Adaptive zoning for efficient transport modelling in urban models Alex Hagen-Zanker1, and Ying Jin2 1Department
of Civil and Environmental Engineering, University of Surrey, Guildford, United Kingdom
[email protected] 2Martin Centre for Architectural and Urban Studies, University of Cambridge, Cambridge, United Kingdom
[email protected]
Abstract. Transport modelling and in particular transport assignment is a wellknown bottleneck in computation cost and time for urban system models. The use of Transport Analysis Zones (TAZ) implies a trade-off between computation time and accuracy: practical computational constraints can lead to concessions to zone size with severe repercussions for the quality of the transport representation in urban models. This paper investigates how a recently developed geographical topology called adaptive zoning can be used to obtain more favorable trade-offs between computational cost and accuracy than traditional TAZ. Adaptive zoning was developed specifically for representing spatial interactions; it makes use of a nested zone hierarchy to adapt the model resolution as a function of both the origin and destination location. In this paper the adaptive zoning method is tied to an approach to trip assignment that uses high spatial accuracy (small zones) at one end of the route and low spatial accuracy (large zones) at the other end of the route. Opportunistic use of either the first or second half of such routes with asymmetric accuracy profiles leads to a method of transport assignment that is more accurate than traditional TAZ based assignment at reduced computational cost. The method is tested and demonstrated on the well-known Chicago Regional test problem. Compared with an assignment using traditional zoning, an adaptive-zoning-based assignment that uses the same computation time reduces the bias in travel time by a factor 16 and link level traffic volume RMSE by a factor 6.4. Keywords: Transport, Assignment, TAZ, Zone
1
Introduction
Traffic assignment is a long-standing problem in transport modelling: it determines the level of traffic load as well as congestion/crowding which are essential for appraising investment and regulatory policies. Owing to its importance, traffic assignment methods have undergone continuous development. The simplest form of assignment is all-
adfa, p. 1, 2011. © Springer-Verlag Berlin Heidelberg 2011
or-nothing which places all traffic between an origin and destination node on the minimal cost path. More advanced models recognize that as traffic is assigned to a link, a degree of congestion takes place which affects the time required for traversing the link and hence the cost. In a static user equilibrium, traffic is assigned to the links such that all used paths from an origin to a destination carry the same cost, and no less costly path exists (Wardrop 1952). Over the years, methods of iterative weighted all-or-nothing assignment (Fukushima 1984) based on a more general quadratic programming method (Frank and Wolfe 1956) have become firmly established. In recent years, bushbased assignment methods are providing a more efficient, though perhaps not yet as well understood, alternative (Bar-Gera 2002; Dial 2006; Nie 2010). Other models of assignment include dynamics traffic assignment (Friesz et al. 1989), and stochastic user equilibrium (Lam et al. 1999). This paper is primarily concerned with all-or-nothing assignment, and its role in the Frank-Wolfe algorithm. Nevertheless, the computational load and cost of the assignment procedures is a common challenge across the above spectrum of assignment methods. The phenomenal rise in the power of personal computing has not yet overcome the issue, and the continued expansion of functional city regions and the need for urban models to cover large areas will likely exacerbate the problem. Practically all transport models make use of Transport Analysis Zones (TAZ) for aggregate computations on groups of locations and individuals. Larger zones correspond to a greater degree of aggregation and therefore less precision and reduced computational cost. The use of zones in transport assignment as an approximation causes a bias, overestimating local traffic near the zone centroid and underestimating it elsewhere. When the zones are large, the inability to assign intra-zonal traffic can lead to significant underestimation of traffic, whereas the bundling of groups of origins and destination to representative centroids leads to a mix of over- and underestimation. Without mitigation, the effect can culminate in excessive and spurious levels of modelled congestion. The common workaround of introducing auxiliary nodes around a centroid spreads the traffic loads and devolves local overloading. However, the underlying problem of a bias in the distribution of local traffic is not overcome. A considerable body of research exists addressing the trade-offs involved in zone design and optimization of zone systems(Chang et al. 2002; Ding 1998; Martinez et al. 2005; Martinez et al. 2009; Viegas et al. 2009). This article proposes a reformulation of the assignment problem that creates new possibilities for simultaneously improving computational efficiency and precision of local traffic assignment, using the concepts of adaptive zoning. In first instance we are concerned with are for the all-or-nothing assignment which can be a further input to the static user equilibrium assignment based on the standard Frank-Wolfe algorithm and other assignment methods. The all-or-nothing assignment is most often solved using the Dijkstra shortest path algorithm. This algorithm finds the tree that represents all shortest paths between one single node and all others. With TAZ, the nodes that are considered as origins and destinations are the zone centroids. The aggregation error occurs as the actual origin and destination of trips are not the zone centroids. It should be noted that the error in the route from an origin to a destination is mainly near the origin and destination: the approximation by zone centroids means that traffic is routed
from roughly the right location to roughly the right location, and it is only for the extremes of the trip that locational accuracy is crucial. Likewise, if we would find the route between a small zone and a large zone, we can expect it to be more accurate near the small zone than near the large zone. This paper aims to exploit this last consideration: the rationale is that for a given origin and destination we find two routes: one from a large zone containing the origin to a small zone containing the destination, and another from a small zone containing the origin to a large zone containing the destination. Of both routes we will only assign traffic to the more accurate half. Thus the assignment takes place twice, the enhanced degree of aggregation at one end of the trip provides opportunity for computational advantage. There are two arguments to increase to degree of aggregation at greater distances. Firstly, from the point of view of geometry, at greater distances the same angular error corresponds to a greater locational error. Thus if we are concerned with traffic heading off in the right direction zone size should increase with distance. Secondly, the number of trips between locations generally reduces with distance, thus for greater distances we can allow for a greater error than for smaller distances. The recently introduce geographical topology of adaptive zoning (Hagen-Zanker and Jin 2012; Hagen-Zanker and Jin 2011a) allows to model spatial interaction using zone sizes that adapt to the distance over which interactions take place. Adaptive zoning was introduced by Hagen-Zanker & Jin (2011a) as an alternative method for representing geographical space in the context of spatial interactions. In some transport models, the zoning scheme is defined such that the strongest concentric flows of spatial interaction are represented in more detail, such as in a transport model of London and South East England where the zones become progressively larger away from central London (Jin et al, 2002). In such cases the zone plan is adaptive to the amount of traffic into and out from one group of zones (i.e. in central London), but does not account for the fact that each and every zone interacts more strongly with some zones than with others. Adaptive zoning takes the adaptation to traffic patterns one step further and adapts the size of origin and destination zones to the strength of interaction (amount of traffic) between those zones. Since the strength of interactions typically diminishes with distance, it means that trips over short distances are modelled using small zones and long distances using large zones. Adaptive zoning is related to origin and destination sampling (Kristoffersson and Engelson 2009; Miller et al. 2007; Williams and Lindsay 2002). The idea of destination sampling is to reduce the computational load of transport models by modelling stochastically filtered destinations and apply a correction factor on the volume of traffic that reflects the sampling probabilities. Williams and Lindsay (2002) use a sampling strategy that is distance dependent, providing more precision at shorter distances. Adaptive zoning also reduces the computational load by reducing the number of destinations for each individual origin, but uses a system of zone aggregation instead. Under adaptive zoning, each origin interacts with a smaller number of destinations when compared with a model using conventional TAZ zones. The reduction is achieved through a bespoke and adaptive aggregation of destination zones across the study area. At short distances from the origin zone there is little aggregation of destination zones, and the degree of aggregation becomes progressively higher further away from the
origin. Origin-based adaptive zoning was used previously for the assignment problem (Hagen-Zanker and Jin 2011a), but it was found that the aggregation at the destination end of trips – and the associated bias – overly constrained the applicability. This article extends the methodology by using both origin- and destination-based adaptive zoning in combination with bi-partitioned assignment: the first half of the trip is assigned on the basis of an origin-based adaptive zoning system and the second half of the trip on the basis of a destination-based adaptive zoning system. This reaps the advantages of adaptive zoning, without being exposed to the negative side-effects arising from aggregating distant zones. Earlier articles introducing and exploring adaptive zoning demonstrated its potential for traditional spatial interaction modelling (Hagen‐Zanker and Jin, 2012) and cityscale mode choice modelling (Hagen‐Zanker and Jin, 2013). The current paper is the first to successfully apply adaptive zoning to the computational bottleneck of transport assignment and is intended as a step towards full adaptive zoning based urban modelling. This article presents the methodology for a bi-partitioned assignment with adaptive zoning and all-or-nothing assignment. The methods are demonstrated with the well-known Chicago Regional road transport network, which is one of several commonly used networks for testing and benchmarking assignment algorithms (Bar-Gera 2010).
2
Methods
2.1
Terminology
The traffic network is represented as a weighted graph, where the links (edges) in the graph are road segments that are connected at the nodes (vertices). All trips to and from a zone are modelled as if they are starting or ending from a designated node in that zone called the centroid. The edge weights represent the costs of travelling typically in the form of a generalized cost that includes travel time, distance and tolls. In this article the terms origin and destination refer to the start- and the end nodes of trips. The terms source and target on the other hand, refer to the role of nodes in the assignment algorithm. Each sub-problem assigns traffic from one source to multiple targets. When the source is an origin, the targets are destinations and the sub-problem is called origin-based. Conversely, a destination-based sub-problem assigns trips from multiple origins (targets) to a single destination (source), using a reverse assignment. 2.2
Network assignment
The input to network assignment is an OD matrix that specifies the number of trips between each origin and destination pair. A second input is the weighted graph that represents the transport network. The purpose of all-or-nothing assignment then is to allocate the trips of each OD pair to the shortest path between the origin and destination and thus establish link intensities. The least-cost paths in the network can be found using the Dijkstra algorithm (Dijkstra 1959). The algorithm builds a shortest path tree from one source node (a zone centroid), to all nodes in the network. The algorithm starts
as an empty tree and grows by successively adding nodes to the tree from the source node outwards. Once all the target zone centroids have been added, the shortest paths for the source zone are complete and the algorithm can be terminated. The Dijkstra algorithm provides the following information: pl ,t
D N ,s
D N ,s v
d
,indicating whether link l is on the path from node s to t in network N ,the shortest path distance from node s to v in network N
For convenience, the following intermediate variables are defined:
al
D N ,s
D N ,s
D N ,s
min dl1
D N ,s
max dl1 ,t
bl
ht
D N ,s
, dl2
D N ,s
(1)
(2)
, dl2 ,t
D N ,s
12 dt
D N ,s
(3)
where link l connects the nodes l1 and l2. alDN ,s is the shortest path distance to the nearer of l1 and l2, and blDN ,s is the shortest path distance to the further, and htDN ,s is the halfway distance between nodes s and t. The D(N,s) superscript is used to indicate that the associated variable are found though one application of the Dijkstra shortest path algorithm on the network N and the source node s. The status of a link relative to the shortest path between s and t can be classified in four categories:
not part of the shortest path, part of the first half of the shortest path, part of the second half of the shortest path, or partially belongs to the first half and partially to the second half.
Using these categories the proportion of a link belonging to the first half of the shortest path is:
D N ,s l ,t
p
where, pl,t
D N ,s
plD,tN ,s D N ,s pl ,t plD,tN ,s pD N ,s l ,t
0
: D N ,s
1 bl
D N ,s t
1 h
1 al
D N ,s
ht
D N ,s
: 1
D N ,s l
a
ht
D N ,s
0
: D N ,s
bl
:
(4)
0 D N ,s l D N ,s l
D N ,s t D N ,s l
b
h
b
a
is the proportion of link l that is on the first half of the shortest path from
s to t. The proportion for the second half of the path follows naturally:
D N ,s pl ,t 0 : 0 D N ,s D N ,s pl ,t 1 : 1 pl,t
D N ,s l ,t
p where, pl,t
D N ,s
(5)
is the proportion of link l that is on the second half of the shortest path
from s to t. All-or-nothing assignment can be expressed as follows: xla N,T Tij pl , j
D N ,i
i
l N
(6)
j
where xl(N,T) is the traffic on link l, when traffic matrix T is assigned onto network N on the basis of shortest paths. Alternatively, the all-or-nothing assignment can be expressed as follows: AN
xl
D N ,j N,T T pl.Dj N ,i T pl,i l N R
ij
i
AN
xl
j
ij
j
(7)
i
D N ,j N,T T pl,Dj N ,i T pl,i l N R
ij
i
j
ij
j
(8)
i
where NR is the reverse graph of N; i.e., link l1– l2 in N corresponds to l2– l1 in NR. Equations (7) and (8) assume that there is only a single shortest path between two nodes. In reality there can be multiple paths of identical cost, therefore a path independent tie-breaking mechanism should be used. 2.3
Adaptive zoning
Adaptive zoning (Hagen‐Zanker and Jin, 2012) consists of two elements: zone hierarchy and zone neighborhood. The lowest level of the zone hierarchy consists of atomic zones and can be formed by a traditional zone systems. Higher levels of the hierarchy are formed by the subsequent amalgamation of zones into progressively larger aggregated zones. The top level of the zone hierarchy is a single zone that covers the whole study area. When each aggregated zone is formed by the amalgamation of two other zones (atomic or aggregated), then the total number of aggregated zones is one below the number of atomic zones. Thus for a system consisting of n atomic zones, there are in total 2n-1 zones in the hierarchy. The zone neighborhood specifies for each atomic zone a specific set of zones (atomic or aggregated) that it interacts with. These zones are selected from different levels in the zone hierarchy; at short distances from the atomic zones neighboring zones are small and selected from low levels of the hierarchy and at further distances they are large and selected from high levels in the hierarchy. Each neighborhood is a zone-system in its own right that covers the whole study area. Thus, the interaction between two locations in the model area is spatially represented by a zone pair consisting of one atomic and one aggregated zone, whereby the size of the aggregated zone is a function of distance.
As atomic zones interact with small aggregated zones nearby and large aggregated zones at a large distance, it is implied that large aggregated zones interact with atomic zones at large distances and small aggregated zones interact with atomic zones at short distances. We call the set of atomic zones that interact with one aggregated zone, the inverse neighborhood of that zone. The algorithms that form the zone hierarchy and neighborhood are based on the distance between zones as well as the size of zones in terms of traffic generated. This paper uses a point sampling approach to estimate Euclidean distances between zones (HagenZanker and Jin, 2011). Upon amalgamation distances for the aggregated zone are determined as the weighted average of the constituent zones.
di ,ab
Aa di ,a Ab di ,b , Aa Ab
(9)
where di,j is the distance from zone i to j, Aa is the area of zone a, and a b is the zone that amalgamates a and b. The zone hierarchy is created following the procedure of Hagen‐Zanker and Jin (2012) and iteratively merges the pair of zones leading to the smallest increment in the estimated error for a spatial interaction model:
cajoin ,b Dab e
dab ,ab
Dae
da ,a
Dbe
db ,b
,
(10)
where the algorithm joins the pair of zones a and b with lowest value for, Da measures the size of destination zone a (here the number of trips destined for that zone), β is the distance sensitivity parameter of a best-fitting model. The creation of the neighborhood is based on an iterative approach whereby in first instance the neighborhood consists of the top level of the zone hierarchy. Then, iteratively one zone in the hierarchy is subdivided considering both the size of the zone (in terms of distance) and the strength of the interaction. This iteration takes place until the neighborhood consists of the required number of zones.
cisplit , j Ti , j d j , j ,
(11)
where cisplit , j is the criterion for subdividing the aggregated zone j in the neighborhood of zone i. The zone j with the highest value for cisplit , j is subdivided into its constituent parts. Ti,j is the number of trips from i to j. Using adaptive zoning, the original interaction matrix T can be aggregated in two ways; either the origin zones are aggregated, resulting in TO or the destination zones are aggregated, resulting in TD. Using both these matrices the all-or-nothing assignment of equation (8) can be approximated by: AN
xl
D N ,j N,T TijO pl,Dj N ,i TijD pl,i l N R
i
j
j
i
(12)
Note that using this system, the source of the assignment is always an aggregated zone. Which means that the assignment takes place for one inverse neighborhood at a time: each application of the Dijkstra shortest path algorithm determines the routes between one aggregated zone and all the atomic zones that it interacts with. The relationship between zone size and distance means that the Dijkstra shortest path algorithm finds a small tree for small zones and a large tree for large zones. This relationship is the core underlying the efficiency gain of the proposed method. 2.4
Bias correction
The adaptive-zoning based assignment introduces a new bias: when aggregating source zones, traffic that would originally go to the centers of all of its component zones will now go to only one center. The distance from a target to its aggregate source will be different from the average distance to all the original source zones. This difference is likely to be systematic, because the distribution of trips over zones is not random. It is not feasible to calculate the difference exactly, because that would undo the efficiency gain of using the adaptive zoning system. However by assuming a correlation between network distances and Euclidean distance, the following bias correction factor can be calculated:
Tit ps pt fs ,t is Tit pi pt
(13)
is
where s is an aggregate source zone of which the constituent atomic are indicated by i. pz gives the geographical coordinates of the center of zone z. The correction factor is applied by modifying the position of the half-way point, yielding the following modified form of equation (3):
ht
D N ,s
3
fs ,t 12 dy
D N ,s
(14)
Results
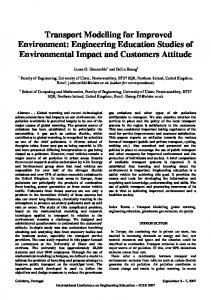
The model is applied to the Chicago Regional road transport network, which is one of several commonly used networks for testing and benchmarking assignment algorithms (Bar-Gera 2010). It was originally developed by the Chicago Area Transportation Study (CATS). The model area comprises 1,790 zones, 12,982 road nodes and 39,018 road links. (Figure 1-a,b). The assignment procedure that is followed is for the user equilibrium using the Frank-Wolfe algorithm that relies on an iterative evaluation of the allor-nothing assignment presented in this paper. For details we refer to the Annex and more in particular to Van Vliet (1987). For comparison purposes an alternative model is created that halves the number of zones (895 zones, Figure 1-c), as well as a series of adaptive zoning based models with
varying degrees of aggregation (Figure 1-d). The only difference between these models and the original 1,790 zone model is due to the aggregation and approximation methods. The deviation from the 1,790 zone mode is therefore a measure of the approximation error. The approximation error is measured by means of the systematic error in total travel time in the model (travel time bias), the root mean squared error (RMSE) in link flows and travel time as well as the correlation between in link traffic intensity. The application of the models shows that with increasing degrees of aggregation, the adaptive zoning system requires less time, but also increases approximation error, in all measures of aggregation error (Table 1). The adaptive zone model with a neighborhood size of 200 zones is nearest to the 895 zone system in terms of computation time. A comparison of the model results of these two runs shows that the adaptive zoning based model has substantially better performance: the correlation is near perfect (0.998 compared to 0.956), the bias in travel times is removed (0.64% instead of 10%) and the link level error is drastically reduced (Link volume RMSE reduces from 221 to 33 vehicles, link cost RMSE reduces from 0.33 to 0.075 seconds). Table 1 also reports on the number of iterations that was necessary for the FrankWolfe algorithm to converge. It shows that the traditional aggregation method reduces the number of iterations relative to the 1790 zone system; this is consistent with the downward bias in traffic volumes, which leads to lower levels of congestion and in turn less spreading over multiple paths. Under adaptive zoning the required number of iterations remains practically the same for all runs, suggesting that the convergence of the algorithm is not materially affected by the adaptive zoning approximation.
Zone system dimensions
Computation time [s]
Link volume correlation []
Link volume RMSE [veh]
Link cost RMSE [s]
Iterations [-]
Ground truth
1790 * 1790
313
1
0
0
0
32
Traditional
895 * 895
193
0.954
-0.10
221
0.33
26
Adaptive
1790 *50
158
0.996
-0.018
85
0.10
33
Adaptive
1790*100
168
0.997
-0.010
47
0.087
33
Adaptive
1790*150
188
0.997
-0.0083
38
0.085
33
Adaptive
1790*200
195
0.998
-0.0064
33
0.075
31
Adaptive
1790*300
231
0.998
-0.0035
25
0.076
32
Travel time bias [-]
Model
Table 1. Comparison between traditional and adaptive zoning based models
Notes:Computation is on a 2.93 GHz Intel® Core™desktop computer using 8 processors and Windows 7, 64 Bit. Computation time excludes the time for generating the zone system, which is in the order of 15s. Link flow correlation is Pearson’s correlation with ground truth of traffic volume over all links. Travel time bias is calculated as T model T ref T ref , where T model xlmodel tlmodel and ref refers to the ground truth model. l
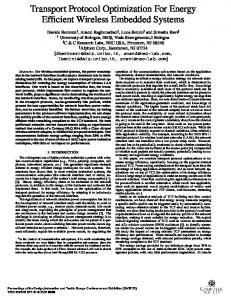
The outcomes for a range of different neighborhood dimensions—from 50 zones to 300 zones—indicate a gradual deterioration with decreasing neighborhood size. However, even for the most severe aggregation (of 50-zone neighborhoods) the results remain reasonable and considerably better than the traditional zone system at 895 zones. Figures 2 sheds more light on the use of computation time by the algorithms. It
Fig. 1. Transport network and alternative zone systems for the Chicago study area
Fig. 2. Comparison of the tree sizes of the sub-problems. The distribution of sub-problem sizes explains the variations in calculation time among the alternative assignment runs.
shows how the traditional approach creates a sub-problem for each zone, whereby the size of each sub-problem, measured as the size of the shortest path algorithm tree is roughly constant and near to the total number of nodes in the network. When a coarser scale traditional zone system is used, the number of sub-problem reduces, but the size of the individual sub-problems remains roughly the same. The adaptive zoning doubles the number of sub-problems, but it drastically reduces the size of the sub-problems.
4
Discussion
4.1
Scalability
Hagen-Zanker & Jin (2011) explored the computational complexity of adaptive-zoning-based assignment and found that the complexity under adaptive zoning is O(n log n) and using traditional zoning O(n2 log n), where n is the number of zones. That analysis depends on the assumption that the number of zones is proportional to the number of links as well as the size of the study area. Here we explore in more depth the nature of this complexity and consider separately the effect of study area size, the number of zones and the size of the network. In order to consider these independently, we define zone density as the number of zones per area, and link density as the number of links per area. One crucial assumption is about the network size of the sub-problems. From the nested nature of the zone hierarchy that provides the aggregated zones, it follows that the size of aggregated zones is exponentially distributed. Furthermore the network size for a sub-problem is a positive function of the zone size; larger zones are found at further distances and hence the radius of an inverse neighbourhood is a positive function of zone size. Finally, there is a lower limit for zone sizes. Consequently, it is reasonable to assume that the network size for sub-problems is negatively exponentially distributed and in any case there is a negatively exponential function under which the distribution
will fit. Figure 2 confirms that this is a reasonable assumption: when the level of aggregation increases, the distribution indeed takes form of an exponential decay curve. The cost of one sub-problem of the Dijkstra algorithm is O(m log m) where m is the number of nodes in the network. For n sub-problems this gives:
n O dijkstra O mx log mx x 1
(15)
where mx is the size of the sub-problem. Approximation by a continuous integral function and considering the network size constant, as under traditional zoning, gives:
n O dijkstra mx m O mlog m dx O nmlog m 0
(16)
Under adaptive zoning mx is assumed to be exponentially distributed:
2n O dijkstra mx me x O me x log me x dx O mlog m 0
(17)
Substituting, m and n for the appropriate products of study area, link density, and zone density gives:
O dijkstra traditional O l z A2 log A log l O dijkstra adaptive O l A2 log A log l
(18)
where A is area, ρz is zone density and ρl is link density. Table 2 summarizes the results for each individual variable, considering all others independent. There is no improvement in scalability with respect to link density, which means that if the sole objective is to increase the number of links in the model, then adaptive zoning offers no additional advantages. Also under adaptive zoning the complexity as a function of study area reduces by an order of magnitude, making it highly suited for large area applications such as city region and country level models. Finally it states that in the limiting case the computational cost is independent of the size of the atomic zones. This is a striking and perhaps counterintuitive result, it is however a direct consequence of the developed method: Each invocation of the Dijkstra shortest path algorithm uses an aggregated zone as its source and finds to path to all atomic zones. The cost of the algorithm is determined by the size of the tree, which in turn is determined by the furthest destination: the number of destination zones is inconsequential. Table 2. Complexity by variable under traditional and adaptive zoning Variable Area (A) zone density (ρz) link density (ρl)
Traditional Complexity O(A2log A) O(ρz) O(ρl)
Adaptive Zoning Complexity O(A log A) O(1) O(ρl)
5
Conclusion
This paper presents a new approach to road traffic assignment that partitions each origin-destination route into the first and the second half, which are assigned by separate sub-problems of computation. The partition opens new opportunities for adaptive trade-offs between computation time and accuracy. Specifically, the paper demonstrates that a bi-partition assignment algorithm with adaptive zoning is a significantly more efficient method. In the worked case using the benchmark Chicago regional road network, we find that when the precision of the zone system is constrained by computation time, the adaptive zoning system is far more precise than a traditional zone system. The bias in modelled travel times reduces from 10% to 0.64% when using adaptive zoning, the RMSE of link volume and link traversal cost reduce by factors of 6.4 and 4.4 respectively. Moreover, our understanding of the structure of the algorithm and an analysis of the computational complexity imply that the detail at which traffic arriving in and departing from zones can be refined without affecting the computational cost. Finally the model scales much better with the size of the study area (A) the complexity of the model is O(A log A) instead of O(A2 log A) which makes it very attractive for modelling large study areas such as those confronted by policy analysts when assessing infrastructure investment and policy initiatives across mega-city regions and nations.
Annex In transport systems typically the time to traverse a link (and hence the cost) is a function of the free flow time, link capacity and traffic flow volume. This article uses the following common model: t
f l tl
p x 1 b l cl
where tl is the link traversal time, tlf is the free-flow traversal time, xl is the traffic flow volume, and cl is the link capacity, b and p are parameters, here b=0.15 and p=4. The co-dependence between tl and xl makes assignment problems more complex. The Frank-Wolfe assignment algorithm accounts for the co-dependence by means of iteration. In the first iteration, traffic is assigned on the basis of free-flow costs and the resulting link traffic loads are used to update the link costs. From then on, each iteration reassigns a fraction of the overall flows on the basis of the updated costs.
xlFW ,1 N1 ,T xlAN ,1 N1 ,T
xlFW ,n N n ,T 1 n xlFW ,n1 N n1 ,T n xlAN N n ,T l N , n 1
where n indicates the iteration number and n is the convergence factor. For the calculation of n as well as the stopping criterion called the relative gap, we refer to Van Vliet (1987). The assignment algorithm iterates until a relative gap of 0.01 is achieved.
References 1. Bar-Gera, H. (2002). "Origin-based algorithm for the traffic assignment problem." Transportation Science, 36(4), 398-417. 2. Bar-Gera, H. (2010). "Transportation Test Problems". http://www.bgu.ac.il/~bargera/tntp (accessed 13 August 2012) 3. Chang, K. T., Khatib, Z., and Ou, Y. M. (2002). "Effects of zoning structure and network detail on traffic demand modeling." Environment and Planning B: Planning and Design, 29(1), 37-52. 4. Dial, R. B. (2006). "A path-based user-equilibrium traffic assignment algorithm that obviates path storage and enumeration." Transportation Research Part B: Methodological, 40(10), 917-936. 5. Dijkstra, E. W. (1959). "A note on two problems in connexion with graphs." Numerische Mathematik, 1(1), 269-271. 6. Ding, C. (1998). "The GIS-based human-interactive TAZ design algorithm: examining the impacts of data aggregation on transportation-planning analysis." Environment and Planning B: Planning and Design, 25(4), 601-616. 7. Frank, M., and Wolfe, P. (1956). "An algorithm for quadratic programming." Naval Research Logistics Quarterly, 3(1-2), 95-110. 8. Friesz, T. L., Luque, J., Tobin, R. L., and Wie, B.-W. (1989). "Dynamic Network Traffic Assignment Considered as a Continuous Time Optimal Control Problem." Operations Research, 37(6), 893-901. 9. Fukushima, M. (1984). "A modified Frank-Wolfe algorithm for solving the traffic assignment problem." Transportation Research Part B: Methodological, 18(2), 169-177. 10. Hagen-Zanker, A., and Jin, Y. (2011a). "Improving geographic scalability of traffic assignment through adaptive zoning."Computers in Urban Planning and Urban Management 2011 Conference. City: Lake Louise, Canada, pp. 15. 11. Hagen-Zanker, A., and Jin, Y. (2011b). "Reducing aggregation error in spatial interaction models by location sampling"The 11th International Conference on GeoComputation. City: London, pp. 4. 12. Hagen-Zanker, A., and Jin, Y. (2012). "A new method of adaptive zoning for spatial interaction models." Geographical Analysis 44(4), 281-301. 13. Hagen-Zanker, A., and Jin, Y. (2013). "Adaptive zoning for transport mode choice modeling.” Transactions in GIS 17(5), 706-723. 14. Jiang, B., and Claramunt, C. (2004). “A structural approach to the model generalization of an urban street network.” GeoInformatica 8 (2), 157-171. 15. Jin, Y., Williams, I. and Shahkarami, M. (2002). “A new land use and transport interaction model for London and its surrounding regions.” European Transport Conference. Cambridge. 16. Kristoffersson, I., and Engelson, L. (2009). "A Dynamic Transportation Model for the Stockholm Area: Implementation Issues Regarding Departure Time Choice and OD-pair Reduction." Networks and Spatial Economics, 9(4), 551-573.
17. Lam, W. H. K., Gao, Z. Y., Chan, K. S., and Yang, H. (1999). "A stochastic user equilibrium assignment model for congested transit networks." Transportation Research Part B: Methodological, 33(5), 351-368. 18. Martinez, L. M., Viegas, J. M., and Silva, E. A. (2005). "Modifiable areal unit problem (MAUP) effects on traffic analysis zones (TAZ) delineation." Modelling and Simulation 2005, 313-323. 19. Martinez, L. M., Viegas, J. M., and Silva, E. A. (2009). "A traffic analysis zone definition: a new methodology and algorithm." Transportation, 36(5), 581-599. 20. Miller, S., Daly, A., Fox, J., and Kohli, S. (2007). "Destination sampling in forecasting: application in the PRISM model for the UK West Midlands region"European Transport Conference. Noordwijkerhout. 21. Nie, Y. (2010). "A class of bush-based algorithms for the traffic assignment problem." Transportation Research Part B: Methodological, 44(1), 73-89. 22. Van Vliet, D. (1987). "The Frank-Wolfe algorithm for equilibrium traffic assignment viewed as a variational inequality." Transportation Research Part B: Methodological, 21(1), 87-89. 23. Viegas, J. M., Martinez, L. M., and Silva, E. A. (2009). "Effects of the modifiable areal unit problem on the delineation of traffic analysis zones." Environment and Planning B: Planning and Design, 36(4), 625-643. 24. Wardrop, J. C. (1952). “Some theoretical aspects of road traffic research.” Proceedings, Institution of Civil Engineers Part 2(9), 325–378 25. Williams, I., and Lindsay, C. (2002). "An efficient design for very large transport models on PCs"European Transport Conference. Cambridge, pp. 18.