Addressing cognitive issues in knowledge engineering with Jambalaya Neil A. Ernst, Margaret-Anne Storey, Polly Allen
Mark Musen Stanford Medical Informatics School of Medicine Stanford University Palo Alto, CA
CHISEL research group Computer Science Department University of Victoria Victoria, British Columbia, Canada
[email protected]
{nernst,mstorey,allenp}@uvic.ca
ABSTRACT Cognitive support in knowledge engineering is a growing concern, and information visualization is a useful means to address this. We identify some requirements for tools offering cognitive support, and present a tool, Jambalaya, which addresses some of these concerns. We identify some of its features and describe areas we are actively improving.
1.
INTRODUCTION
The field of knowledge capture and knowledge representation is at a crossroads. The preceding years have been characterized by ad-hoc development, and lately there has been a move towards a more systematic approach to the development of knowledge-based systems. The area of cognitive support in knowledge engineering has also seen a lot of ad-hoc tool development. In this paper, we demonstrate how our tool, Jambalaya, is evolving into an answer to the challenges of providing cognitive support for knowledge engineering. While the tool started without formal requirements analysis, we have gone through several analytical methods to move it to a more formal status. In light of the Semantic Web initiative, the numerous ontologies and systems it envisions to support machine-readable data online will have a large impact on the knowledge engineering domain. We believe that one of the byproducts of this success will be a requirement for much improved metaphors for understanding the ontological commitment that these different ontologies make. Such cognitive challenges are by no means new to this field, however. Stelzner and Williams [19], for example, describe some of the concerns with mapping between the user’s mental model of a system, and the system model. In a tool designed to help students understand a medical expert system related to MYCIN, GUIDON-WATCH, Richer and Clancey [16] make the point that “. . . providing multiple views of the same knowledge or behavior can help a user understand a complex system”. From these early studies, it seems clear that new
Permission to make digital or hard copies of all or part of this work for personal or classroom use is granted without fee provided that copies are not made or distributed for profit or commercial advantage and that copies bear this notice and the full citation on the first page. To copy otherwise, or republish, to post on servers or to redistribute to lists, requires prior specific permission and/or a fee. K-CAP’03, October 23-25, 2003, Sanibel Island, FL, USA. Copyright 2003 ACM 1-58113-000-0/00/0000ã$5.00
systems are going to require well-designed interfaces to make the Semantic Web vision workable. Well-designed implies that there has been some form of iterative, systematic, user-centered design methodology involved in creating the tool. This paper makes the case that such an interface ought to consider, if not actively involve, techniques and tools from information visualization. In the remainder of this paper, we explain what information visualization is, and describe some other approaches to visualization in knowledge engineering. We then detail a tool we have contributed, Jambalaya, beginning with its history, some studies we performed to analyze requirements for the tool, and concluding with a detailed description of some of the functionality using a sample ontology. Finally, we show how this tool addresses some of the concerns raised above.
2.
BACKGROUND
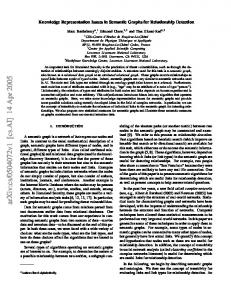
Information visualization techniques are used in many domains to help provide insight or to communicate information [5]. Information visualization leverages innate human abilities to perform spatial reasoning and make sense of relatively complex data using some form of graphical representation language. In the domain of knowledge engineering, such a language is often based on graph theory and has two components: one, the use of nodes to represent concepts in a domain; the other, the use of edges to represent relationships between concepts. The language for visualizing information in this domain therefore consists of manipulations of graphs in some form or another. Jambalaya is closely integrated with Prot´eg´e [12], an ontology engineering and knowledge acquisition tool created at Stanford University. Prot´eg´e uses a frame-based knowledge representation to allow users to model domains using classes (concepts), instances, slots (relations), and facets (constraints on the slots). Written in Java, its architecture allows for extensions to be added via a plug-in metaphor. Recently, work has been ongoing to make the tool compatible with the OWL ontology language for the Semantic Web, as well as support webspecific concepts such as namespaces and Universal Resource Indicators (URIs). Fig. 1 shows the default classes view with a slot window open. The example used here, and throughout this paper, is the wines ontology.
3.
RELATED WORK
Earlier work was motivated by a realization that few users could easily understand what an expert system tool was doing or how to make it work. Concept maps [11] were more focused on user support than other efforts, but seemed to have been hamstrung by a lack of supporting environments for easy knowledge acquisition. An-
Figure 1: The Prot´eg´e user interface with the Jambalaya tab visible other knowledge representation tool, CODE4 [18], focused in more detail on the user experience, and also combined it with a logically rigorous representational semantics. A key detail that CODE4 emphasized was providing multiple methods to view the knowledge, emphasizing the separation of presentation from model. Visual programming and visual knowledge acquisition tools such as KEATS [7] supported the notion of sketching early versions of a knowledge base before the design commenced. This differs slightly from the focus in this paper, which is more concerned with how modelers understand or verify a model after it has been (largely) completed. Another set of tools dealt with visualization techniques in information retrieval and management. An early work, SemNet [10], had several complex metaphors for visualizing personal information, including fisheye views, zooming, and hyperlinking; however, the hardware available at the time (1988) greatly limited its adoption, as did the relatively small amount of electronic data. Other work built on the graph visualization theme, discovering new techniques for browsing networked data.
3.1
Visualization in Knowledge Engineering
Building on these earlier tools, there are many current tools which incorporate some degree of information visualization. Isaviz [15] is a tool designed by the World Wide Web Consortium (W3C) to visualize knowledge representations constructed using the Resource Description Framework (RDF). It uses the GraphViz tool from AT&T. Although the user can configure how the views appear, they are not very interactive and the GraphViz tool itself is not easily customized. It also has facilities for styling the graph using a stylesheet concept, exporting to SVG, and simple editing functions. Ontorama is a visualization tool for RDF-based graphs, detailed in [8]. It presents RDF graphs in a hyperbolic graph layout using radial layouts to align the nodes on a spherical surface. A significant challenge for Ontorama and other hyperbolic browsers is some ontologies may not have fully specified hierarchies, and the tool must somehow determine how to show those nodes. Finally,
the Ontobroker tool [6] uses a hyperbolic view technique to aid in the navigation of ontologies. It has recently been superseded to some extent by KAON [14], a similar tool with more of a focus on the Semantic Web.
3.2
Existing visualizations in Prot´eg´e
Prot´eg´e itself has a fairly standard indented tree view interface, as shown in Fig. 1. Users can navigate the class tree by opening and closing class concepts, or by using a search panel located at the bottom of the screen. Other metaphors for browsing the application exist, such as the Instance Tree widget. This tool allows users to browse through the classes using the slot values (related classes) defined in a particular concept. These techniques mainly support browsing or navigation tasks, and have limited support for understanding. In particular, the default Prot´eg´e interface makes it very difficult to grasp more complex relationships, such as multiple inheritance or complex slot compositions (as used in reification). There are several plug-ins supporting visualization in Prot´eg´e. Ontoviz [17], like IsaViz, relies on the GraphViz graph viewer to visualize ontologies in Prot´eg´e. Exploring the ontology is very difficult in Ontoviz, as the user interactions are restricted to panning and simple zooming. Furthermore, OntoViz does not support more than one layout, which can only be structured based on the inheritance relationship. Customization is limited and the visualization does not scale beyond a few hundred entities. Secondly, the TGVizTab, developed in 2002 by Harith Alani [1], makes use of a spring-embedding algorithm to implement a customizable layout for concepts and relationships. The true strength of Touchgraph lies in its salience – the meaning of the graph shown is typically readily apparent to users (something not always true of Jambalaya). Some of the weaknesses of TGVizTab concern the difficulty of seeing all relationships (e.g., non structural relationships), screen clutter, and the difficulty in synchronizing this view with the Prot´eg´e view. Finally, although more detail is provided in section 6, for comparison, we think of Jambalaya as a suite of tools and views for viewing on-
tologies with graph metaphors – there are several different mechanisms for viewing data in Jambalaya. One lack the tool has is the ability to directly edit concepts and relationships in the view itself.
4.
REQUIREMENTS ANALYSIS
Jambalaya was initially developed as the result of a collaboration between the Prot´eg´e team and Jambalaya developers [21]. The Jambalaya code had started out as a software engineering tool, and some obvious synergies were seen with knowledge engineering. This initial development and release was characterized by a lack of any formal requirements process. While it was apparent to both teams that this was potentially very useful, no effort was made to identify what the tool should look like; thus, the existing features were simply inserted wholesale into Prot´eg´e. We had identified requirements for the tool based on our work in software comprehension [20], but had not done any work to identify the requirements in this different domain. Approximately six months following the initial release of the plugin, we began to question whether the tool was meeting the requirements of the users. We did limited quantitative analysis of the Jambalaya tool: some studies were performed to analyze how useful the various interface elements were, but nothing detailed has been done from a quantitative perspective. A heuristic evaluation was also done to identify some user interface challenges, and the walkthrough helped to make the tool more usable. Neither approach provided any clear requirements that our tool should meet.
4.1
Qualitative requirements gathering
One of us (Allen) has researched the subject of user studies in knowledge engineering, noting the difficulties with user testing in this domain [2]; some of the problems include access to expert users, and problems with domain knowledge occluding the intentions of the survey. These issues led us to focus on a more qualitative approach to determining requirements; for this, we chose a two-pronged approach. One method was to survey the general user population of the Prot´eg´e tool and determine some of their preliminary needs for a visualization tool. This resulted in a user survey which was disseminated to the Prot´eg´e user mailing list and other knowledge engineering lists (available at http://shrimp.cs. uvic.ca/jambalaya/user-survey.htm). The results are discussed in more detail in a report by Ernst and Storey [9], but in general we found that there are a wide variety of users and domains to which ontology engineering is being applied, and further, that visualization is a desired feature. We believe that the wide-ranging degree of domains we uncovered is a sign of the future, and that tools that operate at a meta level to assist users to understand the modeling decisions, such as Jambalaya, will be increasingly important in maintaining clear communication and understanding. We used the survey as a pointer to areas where more detailed investigation might be useful, and this drove the second aspect of our requirements gathering: contextual inquiries at two separate venues. The American National Cancer Institute works on a largescale taxonomy and ontology of cancer-related research and disease concepts known as the NCI Thesaurus [13]. We conducted two site visits to the NCI team to determine how their ontology engineering workflow proceeded, and what some requirements for that workflow might be. Using contextual inquiry techniques (specified in [3]), we sat with users to view their daily activities. We also conducted higher level discussions with the technical gurus and managers of the project, to gauge their needs.
We also conducted a site visit to the University of Washington Foundational Model of Anatomy Project (see http://sig.biostr.washington.edu/projects/fm/ AboutFM.html). Here, we used similar techniques to gauge the needs of the users of that domain. We watched the users perform domain modeling and verification, asked specific questions about the process, and then concluded with a demonstration of Jambalaya in its current form to gauge their reaction. From this demonstration we gathered several important points of feedback as to how the tool could be changed to better suit their needs. These two visits, in conjunction with the survey, as well as our previous work in software engineering [20], gave us some specific data to form preliminary visualization requirements for the knowledge engineering domain, in conjunction with a detailed literature review.
4.2
Other studies
The requirements proposed below are also motivated by other research. In Tallis et al. [22] the experimenters observed users performing many high-level tasks during their user studies, including understanding, browsing and search, editing, verification, and error correction. These tasks suggest some common areas that all ontology tools must support. Blythe et al. [4] further identified some typical concerns that users may have when adding new knowledge to an intelligent system, such as where to start, whether the correct information is being added, and issues with getting lost. Finally, Eisenstadt et al. [7] also present some interesting principles regarding knowledge engineering visualizations, for example, that there should be a mapping between what is shown and what is present in the model; notation and actions should be immediately obvious and self-evident; and the visualization should show all the implications of the model. All three of these studies provide detailed discussion of problems with typical interfaces to knowledge engineering tools, and we use these to motivate the requirements below.
5.
PROPOSED REQUIREMENTS
There are several things users did, or rather, wished they could do, that most ontology tools do not support; these include informal authoring, easy model verification, and collaboration, among others. This section provides some the motivation for these functional requirements of knowledge engineering tools aiming to lessen the cognitive burden on modelers.
5.1
User types
It is possible to outline many different user types for ontology engineering, yet any such taxonomy would likely be non-exhaustive and limiting. We prefer to use an abstract model, noting that while there are many actors involved in the development and use of an ontology, typically there are two major roles played (any of which may belong to different people at different stages). We characterize these as modelers and end-users. For example, from our work at the NCI, the modeler role is played by the scientists who are concerned with the knowledge acquisition process, while the end-user role is played by scientists who leverage the NCI Thesaurus at their own centres (for example, to provide terms for querying and report creation). In general, the Jambalaya tool is focused on the modeler role, and therefore, the requirements we analyzed and suggest below support the modeler. End users and novices may have different requirements with which we are not yet completely familiar, although this category of user is certainly important.
Figure 2: Jambalaya, showing a tree layout with arc filter and script manager
5.2
Functional requirements in knowledge engineering visualization
We conjecture these functional visualization requirements would help users by providing insight to help them understand or browse the knowledge base, as well as help in authoring concepts and instances. 1. Provide Insight Allow for overviews of the ontology and viewing of non-structural relationships. 2. Facilitate Navigation Support top-down exploration, relationship based exploration, and viewing of search results. 3. Support Graphical Editing Provide techniques for visual knowledge acquisition and editing. 4. Facilitate Collaboration Provide a mechanism for sharing and saving specific aspects of an ontology.
6.
WHAT JAMBALAYA PROVIDES
Jambalaya provides cognitive support to modelers by filling a majority of the functional requirements we have identified above.
6.1
Elements in the Jambalaya toolkit
Figure 2 shows a typical view in Jambalaya. Prot´eg´e concepts are mapped as nodes in the graph, and are represented as complex objects, typically shaped as rectangles. ‘Opening’ a node shows the corresponding Prot´eg´e form for that class. Slots are mapped as graph edges, and join nodes; they can be followed like hyperlinks to navigate between nodes. Nodes and arcs can be clustered; nodes are clustered using the abstraction inherent in the hierarchical structure such as an is-a relationship. Arcs are clustered using a feature we refer to as composites, which are groups of different slot types. Composite arcs can also demonstrate where relationships between nodes exist at lower levels in the hierarchy than currently shown. The elements of Jambalaya also support the notion of filtering, which implies that certain types of each element can be turned on or off in the graph view. These techniques help address requirements 1 and 2.
6.2
Tools for manipulating the graph
To operate on these elements, Jambalaya provides many different tools, most of which are described below. A tool is an element of the application which offers the user a separate set of functionality. Main View The main view represents the screen that is always shown. It handles the majority of user operations, such as the different layouts and views. Hierarchical View The hierarchical view presents a high-level visualization using a tree layout to show an overview of the entire knowledge base. It uses the default Prot´eg´e is-a relationship to structure the tree. Nodes can be selected here to navigate in the main view. Finally, nodes are highlighted to show the results of searches and filtering. Treemap view This tool uses a treemap algorithm to layout nodes in a space-filling manner. It can generally show more nodes than the other tools and is very useful for gaining a sense of the overall structure of a knowledge base. For example, when the grid is sized by number of children, concepts with more sub-concepts will be larger, and easier to see (see Fig. 3) . Search Jambalaya currently supports limited search functionality, using the plain-text name of nodes and arcs to do search matching. We are interested in extending this using some of Prot´eg´e’s query plug-ins. Script Manager We have recently implemented the notion of enduser scripting into the toolkit. The script manager allows users to write scripts to access functionality we have exposed to automate common tasks, such as showing all the nodes in an ontology, filtering arcs, or changing layouts. The script manager is shown in Fig. 2. Live Bookmarks and the Filmstrip Live bookmarks are interactive Scalable Vector Graphics which contain information about where a user was browsing in an ontology. They can function as stand-alone web-viewable images, with simple interactions, or can be exported and imported using the Filmstrip
Figure 3: The filmstrip and attribute panel with a treemap layout in Jambalaya concept (shown in Fig. 3). This feature supports collaboration. Attribute Panel We’ve begun experimenting with a way of selecting attributes to filter using double sliders, as shown in Fig. 3. We believe these tools partly address requirements 1, 2, and 4. We plan on adding preliminary support for graphical editing in the near future.
6.3
Views of the graph
Unlike the other two visualization plug-ins for Prot´eg´e, Jambalaya does not focus on one particular visualization technique. Rather, we provide a variety of views that the user can select from. The current default view is the nested view. This nests nodes within other nodes based on a relationship the user can select. Initially this relationship, referred to as the structural relationship, is merely the is-a hierarchy, which mirrors the layout in the indented list Prot´eg´e provides. Other visualization metaphors that can be used include a tree layout (both horizontal, as shown in Fig. 2, and vertical), force-directed layout, treemap layout, and a radial layout. The reason we focus less on innovative views is that we believe that the techniques are not the major hurdle in one’s use of the tool; the major problem we have observed is in scalability and speed. No matter what metaphor is used, if it cannot handle the scale of the problem the user is interested in, it will not be used again. Much of our effort has been dedicated to this idea, and the treemap tool can now handle up to one hundred thousand nodes relatively easily. Finally, we believe that providing several mechanisms best supports the different cognitive learning styles users have, as shown in other research we have conducted [20].
7.
DISCUSSION AND FUTURE WORK
Although we have shown how Jambalaya meets some of the requirements we have identified, we acknowledge there is much to be done. For example, the requirements, while based on extensive research, may differ between domains. We would like to analyze the requirements based on other domains of interest. Furthermore, we should conduct some more quantitative analysis to confirm some
of our hypotheses. Directions for this work have been provided in Allen’s M.Sc. thesis [2].
7.1
Customization and extensibility
Implicit in our belief that there is great variability in user needs is the fact that users are the ones best able to decide what they need. To further support this, we are currently working on extending our rather rudimentary scripting support to provide almost complete access to the application. The next step will see users able to modify a visualization ontology we have created that describes the Jambalaya tool, and is used as a settings file to be read on start-up. These modifications will allow the application to be customized by either end-users (modelers at the NCI, for example) or their technically proficient colleagues. This customization may take the form of hiding additional complexity that is not needed, by removing unwanted tools or views; it may also involve custom scripts being written to add domain-specific features. Finally, we are also interested in making Jambalaya itself more flexible at the source code level by adding some form of extension points, similar to what Prot´eg´e currently offers. This could allow, for instance, other teams to develop plug-ins for Jambalaya that offer new views or layouts. We would like to take some ideas from the CODE4 tool mentioned in the background section, and make the distinction between the model elements of Jambalaya and the views on those elements even more pronounced.
8.
CONCLUSIONS
We have shown how visualization in knowledge engineering is an important issue. The increasingly larger ontologies that are being developed quickly exhaust human capacity for conceptualizing them in their entirety. Using a combination of background literature reviews and our existing work in software comprehension, combined with two separate qualitative inquiries and a web survey with 44 respondents, we have proposed a set of functional requirements we believe visualization tools in knowledge engineering must meet to provide useful and powerful cognitive support for knowledge engineering. We elaborated on features of our tool that support some of these requirements. Our directions are aimed at validating some of these requirements by conducting small-scale expert user tests,
as well as improving the adoption of our tool by increasing its extensibility and customization.
9.
ACKNOWLEDGMENTS
We wish to acknowledge the many people who have made this work possible, notably the members of the CHISEL research group and the co-operative people at the NCI and FMA projects. We wish also to acknowledge the support, moral and otherwise, from the Prot´eg´e team at Stanford, including Dr. Natalya Noy and Dr. Ray Fergerson. Primary funding for this research was provided by an NSERC scholarship and a grant from the National Cancer Institute. The Prot´eg´e resource is supported, in part, by grant P41 LM007885 from the National Library of Medicine.
10.
REFERENCES
[1] H. Alani, “Tgviztab: An ontology visualisation extension for protege,” in Knowledge Capture 03 - Workshop on Visualizing Information in Knowledge Engineering. Sanibel Island, FL: ACM, 2003. [2] M. M. Allen, “Empirical evaluation of a visualization tool for knowledge engineering,” M. Sc., University of Victoria, 2003. [3] H. Beyer and K. Holtzblatt, Contextual Design: Defining Customer-Centred Systems. San Francisco: Morgan Kaufmann, 1998. [4] J. Blythe, J. Kim, S. Ramachandran, and Y. Gil, “An integrated environment for knowledge acquisition,” in Int. Conf. on Intelligent User Interfaces, 2001, pp. 13–20. [5] S. Card, J. D. Mackinlay, and B. Shneiderman, Readings in Information Visualization: Using Vision to Think. London: Academic Press, 1999. [6] S. Decker, M. Erdmann, D. Fensel, and R. Studer, “Ontobroker: Ontology based access to distributed and semi-structured information,” in DS-8, ser. Semantic Issues in Multimedia Systems, R. Meersman, Ed. Kluwer, 1999, pp. 351–369. [7] M. Eisenstadt, J. Domingue, T. Rajan, and E. Motta, “Visual knowledge engineering,” IEEE Trans. on Software Engineering, vol. 16, no. 10, pp. 1164–1177, 1990. [8] P. Eklund, N. Roberts, and S. P. Green, “Ontorama: Browsing an rdf ontology using a hyperbolic-like browser,” in First International Symposium on CyberWorlds (CW2002). IEEE, 2002, pp. 405–411. [9] N. Ernst and M.-A. Storey, “A preliminary analysis of visualization requirements in knowledge engineering tools,” University of Victoria,” CHISEL Technical Report, August 19 2003. [10] K. Fairchild, S. Poltrock, and G. Furnas, “Semnet: Three-dimensional graphic representations of large knowledge bases,” in Cognitive Science and its Applications for Human-Computer Interaction, R. Guidon, Ed. Lawrence Erlbaum Associates, 1988, pp. 201–233. [11] B. Gaines and M. Shaw, “Concept maps as hypermedia components,” International Journal of Human-Computer Studies: Special Issue on Knowledge-Based Hypermedia, vol. 43, no. 3, pp. 323–361, 1995.
[12] J. H. Gennari, M. A. Musen, R. Fergerson, W. E. Grosso, M. Crubzy, H. Eriksson, N. F. Noy, and S. W. Tu, “The evolution of protg: An environment for knowledge-based systems development,” International Journal of Human-Computer Studies, vol. 58, no. 1, pp. 89–123, 2003. [13] J. Golbeck, G. Fragoso, F. Hartel, J. Hendler, B. Parsia, and J. Oberthaler, “The national cancer institute’s thesaurus and ontology,” Journal of Web Semantics, vol. 1, no. 1, 2003. [14] A. Maedche, B. Motik, L. Stojanovic, R. Studer, and R. Volz, “Ontologies for enterprise knowledge management,” IEEE Intelligent Systems, vol. 18, no. 2, pp. 26–33, March/April 2003. [15] E. Pietriga. (2003) Isaviz: A visual authoring tool for rdf. World Wide Web Consortium. [Online]. Available: http://www.w3.org/2001/11/IsaViz/ [16] M. Richer and W. J. Clancey, “Guidon-watch: A graphic interface for viewing a knowledge-based system,” IEEE Computer Graphics and Applications, vol. 5, no. 11, pp. 51–64, 1985. [17] M. Sintek. (2003) Ontoviz tab: Visualizing protege ontologies. [Online]. Available: http://protege.stanford.edu/plugins/ontoviz/ontoviz.html [18] D. Skuce and T. C. Lethbridge, “Code4: A unified system for managing conceptual knowledge,” International Journal of Human Computer Studies, vol. 42, pp. 413–451, 1995. [19] M. Stelzner and M. D. Williams, “The evolution of interface requirements for expert systems,” in Expert Systems: The User Interface, ser. Human/Computer Interaction, J. Hendler, Ed. Norwood, NJ: Ablex Publishing, 1988, pp. 285–306. [20] M.-A. Storey, F. Fracchia, and H. A. Mueller, “Cognitive design elements to support the construction of a mental model during software exploration,” Journal of Software Systems: special issue on Program Comprehension, vol. 44, pp. 171–185, 1999. [21] M.-A. D. Storey, M. A. Musen, J. Silva, C. Best, N. Ernst, R. Fergerson, and N. F. Noy, “Jambalaya: Interactive visualization to enhance ontology authoring and knowledge acquisition in protege,” in Workshop on Interactive Tools for Knowledge Capture, K-CAP-2001, Victoria, B.C. Canada, 2001. [22] M. Tallis, J. Kim, and Y. Gil, “User studies of knowledge acquisition tools: Methodology and lessons learned,” in Knowledge Acquisition Workshop, 1999.