Patient Preference and Adherence
Dovepress open access to scientific and medical research
o R i g i n al r e s e ar c h
Open Access Full Text Article
Adherence to a behavioral weight loss treatment program enhances weight loss and improvements in biomarkers This article was published in the following Dove Press journal: Patient Preference and Adherence 12 June 2009 Number of times this article has been viewed
Sushama D Acharya 3 Okan U Elci 3 Susan M Sereika 1,2,3 Edvin Music 3 Mindi A Styn 3 Melanie Warziski Turk 3 Lora E Burke 2,3 1 Department of Biostatistics, Graduate School of Public Health 2 Department of Epidemiology, Graduate School of Public Health, 3 School of Nursing, University of Pittsburgh, Pittsburgh, PA, USA
Correspondence: Lora E Burke Professor, School of Nursing, Department of Epidemiology, Graduate School of Public Health, 3500 Victoria St., 415 Victoria Bldg, University of Pittsburgh, Pittsburgh, PA 15261, USA Tel +1 412 624 2305 Fax +1 412 383 7293 Email
[email protected]
submit your manuscript | www.dovepress.com
Dovepress
Objectives: To describe participants’ adherence to multiple components (attendance, energy intake, fat gram, exercise goals, and self-monitoring eating and exercise behaviors) of a standard behavioral treatment program (SBT) for weight loss and how adherence to these components may influence weight loss and biomarkers (triglycerides, low density lipoproteins [LDL], high density lipoprotein, and insulin) during the intensive and less-intensive intervention phases. Methods: A secondary analysis of a randomized clinical trial consisting of a SBT with either fat-restricted standard or lacto-ovo vegetarian diet. The 12-month intervention was delivered in 33 group sessions. The first six months reflected the intensive phase; the second six months, the less-intensive intervention phase. We conducted the analysis without regard to treatment assignment. Eligible participants included overweight/obese adults (N = 176; mean body mass index = 34.0 kg/m2). The sample was 86.9% female, 70.5% White, and 44.4 ± 8.6 years old. The outcome measures included weight and biomarkers. Results: There was a significant decline in adherence to each treatment component over time (P 0.0001). In the first six months, adherence to attendance, self-monitoring and the energy goal were significantly associated with greater weight loss (P 0.05). Adherence to attendance and exercise remained significantly associated with weight loss in the second six months (P 0.05). Adherence to attendance, self-monitoring and exercise had indirect effects through weight loss on LDL, triglycerides, and insulin (P 0.05). Conclusions: We observed a decline in adherence to each treatment component as the intervention intensity was reduced. Adherence to multiple treatment components was associated with greater weight loss and improvements in biomarkers. Future research needs to focus on improving and maintaining adherence to all components of the treatment protocol to promote weight loss and maintenance. Keywords: adherence, obesity, diet, exercise, self-monitoring, biomarkers
Obesity is a chronic disorder with a prevalence rate that continues to increase in some population groups. Efforts to improve weight loss have focused on standard behavioral treatment (SBT) programs that require lifestyle changes such as adopting healthy eating and exercise patterns.1 Adopting these patterns requires committing to major behavioral changes, making long-term adherence a challenge. Declining adherence during or after a SBT program results in high rates of weight regain.2 Although success in any weight-loss program requires adhering to the study protocol and successfully implementing and maintaining lifestyle change, detailed measurement of adherence has been reported infrequently; thus, little is known about the extent to which people adhere to the components of an SBT program. We defined
Patient Preference and Adherence 2009:3 151–160 151 © 2009 Acharya et al, publisher and licensee Dove Medical Press Ltd. This is an Open Access article which permits unrestricted noncommercial use, provided the original work is properly cited.
Dovepress
Acharya et al
adherence as the extent to which a participant’s behavior in making lifestyle changes coincided with the study protocol. Reported measures of adherence in the literature include periodic three-day food records,3–5 a dietary assessment questionnaire,6,7 diary recordings of the amount of exercise performed,6 rates of adherence to the treatment protocol as reported in interviews,8 and rates of attendance at the intervention sessions.9,10 However, few investigators report adherence, and as noted here, the measures vary greatly, making it difficult to compare adherence across studies. Greater adherence to treatment has been associated with improved clinical outcomes and prevention or reduction of complications.11–14 Self-monitoring, or keeping track of food and exercise behaviors, has been found to result in greater weight loss among various populations seeking weight loss.12,15,16 Similarly, a positive association between the number of intervention sessions attended and weight loss has been reported.10,13 A relationship between adherence to physical activity regimens and weight loss has also been reported.6,17 However, these studies had several limitations, particularly a limited sample size12 and a brief intensive intervention period.12,15 Because adherence varies over time, it is important to examine the pattern of adherence to treatment following the intensive phase intervention as well as the effect of adherence on clinical outcomes in a relatively larger sample. Although the SBT program requires adherence to multiple components of the intervention, many studies report only one or two measures of adherence, such as attendance,10,13 dietary adherence,11 or physical activity adherence.6 Hence, little is known about the pattern of adherence to the various components of a weight loss intervention during the intensive and less-intensive phases. Many weight loss studies have reported changes in biomarkers during the intervention period.18 However, none has examined the effects of adherence to treatment components on biomarkers. We conducted an 18-month randomized clinical trial (PREFER; Paving the road to everlasting food and exercise routine) that used a 2 × 2 factorial design comparing the effects of two dietary options; standard weight loss diet (STD-D) vs lacto-ovo-vegetarian diet (LOV-D) by whether or not subjects received their preferred dietary treatment (Preference-Yes versus Preference-No).19 This paper describes participants’ adherence to multiple components of an SBT program for weight loss: session attendance, dietary goals (calories and fat grams), exercise goals, and self-monitoring eating and exercise behaviors, and the effect of each component of adherence on weight change and biomarkers (triglycerides, low density
152
submit your manuscript | www.dovepress.com
Dovepress
lipoproteins [LDL], high density lipoprotein [HDL], and insulin) during the intensive (0–6 months) and less-intensive (7–12 months) phases of the intervention. Since we observed no differences in adherence to the components of the treatment protocol and weight, and biomarker changes by the four treatment combinations utilizing the assessment data,20,21 this secondary analysis was conducted as a single sample without regard to randomized diet or preference treatment utilizing the process data.
Methods The design, recruitment and randomization procedures have been described in detail elsewhere.19 The study protocol was approved by the University of Pittsburgh Institutional Review Board. All participants provided written informed consent.
Participants A total of 932 individuals were screened for eligibility by phone and subsequent questionnaires. Eligibility criteria required that individuals were between 18 and 55 years of age; had a body mass index (BMI) between 27 and 43 kg/m2 inclusively; and had completed a five-day food diary at screening. Individuals were excluded if they had a current medical condition requiring physician supervision of diet or physical activity; were pregnant or had intention to become pregnant during the study period; were receiving pharmacological treatment that might affect weight; reported alcohol intake of 4 drinks/day; were participating in any weightloss program in the last six months; or reported abstention from eating meat, poultry, or fish in the past month. After completion of the screening phases and baseline assessment, 200 participants were stratified by gender, ethnicity and diet preference and randomly assigned to 1 of 4 groups through a two-stage randomization scheme: Preference-Yes + STD-D (n = 63); Preference-Yes + LOV-D (n = 36); Preference-No + STD-D (n = 50) and PreferenceNo + LOV-D (n = 48). Fifteen individuals had to be excluded from Preference-Yes + STD-D diet to obtain a fair balance in size across the groups. Nine participants were excluded during the study because they no longer met eligibility criteria, eg, pregnancy, diabetes. Of a total of 176 participants who participated in the treatment sessions initially, the current analysis included 151 participants who attended the assessment visits.
Intervention All four treatment groups received the common components of the standard behavioral intervention: (1) group sessions,
Patient Preference and Adherence 2009:3
Dovepress
Adherence to weight loss treatment program
(2) daily energy goal, (3) daily fat gram goal, (4) weekly exercise/physical activity goal (minutes), and (5) selfmonitoring eating and exercise behaviors. The only difference between the diet groups was that the LOV-D participants were instructed to eliminate meat, poultry, and fish from their diet by the sixth week of the program.
period stayed within the energy and fat gram goals; thus, if a participant knew that a social event may lead to exceeding the calorie/fat gram goals one day, he/she was encouraged to eat less than the dietary goals on other days that week so the week’s total would be within the goal. This strategy is referred to as banking calories and fat grams.
Group sessions
Exercise goal
Participants attended closed group sessions weekly during the intensive phase in the first six months. The less-intensive phase consisted of biweekly meetings for months 7–9 and monthly meetings for months 10–12. This 12-month treatment phase was followed by a six-month maintenance phase with no contact by study staff until the final 18-month assessment. The evening sessions lasted approximately an hour. The cognitive-behavioral intervention used several strategies from models of motivation and behavior change. Sessions focused on behavioral strategies for modifying one’s lifestyle and adopting healthy eating and physical activity behaviors and included a wide range of topics from information on general health/nutrition/exercise to practical hands-on experiences to develop skills, such as label reading, food shopping, and using low-fat cooking methods. The same multidisciplinary team (behavioral scientist, nutritionist, and exercise specialist) led these sessions. Further details of the intervention have been reported elsewhere.19 Several approaches used to promote attendance and retention included contacting participants who missed a session the next day and conducting a make-up session when possible. If a participant missed two consecutive sessions, we sent a letter offering an individual make-up session. If the participant could not attend, we sent session materials and when possible, we exchanged diaries. Incentives to promote attendance included receiving either Cooking Light for the STD-D group or Vegetarian Times magazine for the LOV-D group at the session.
Participants were instructed to increase their physical activity gradually, primarily via walking, until they reached a goal of 150 minutes per week by the sixth week. As an alternative to walking, aerobic activities such as bicycling, swimming, and jogging were encouraged. We promoted the use of frequent, short bouts to meet one’s exercise goal, eg, exercise for 10–15 minutes three times per day.
Self-monitoring This was a central behavior change strategy used to increase the participants’ awareness of their eating behaviors, the foods consumed, and their physical activity levels. We instructed participants to record in a paper-and-pencil diary all the foods consumed with the corresponding number of energy and fat grams, as well as physical activity duration (minutes) and type. They were provided a reference book with nutrient information and were taught how to look up energy and fat gram content for food items when food labels were unavailable. They also calculated subtotals after each dietary entry or at least periodically throughout the day, to compare intake values to their daily goals, and make dietary and physical activity adjustments accordingly. We provided each participant who turned in the completed food and exercise diary a new diary for the next week at each session. The interventionist reviewed the completed diary, provided written feedback, and returned it at the next session.
Measures of adherence Attendance at group sessions
Energy and fat gram goals Each participant received a daily energy and fat gram goal based on gender and baseline body weight. For those weighing 200 lbs, the prescribed daily total energy intake was 1200 calories for women and 1500 calories for men. For those weighing 200 lbs, it was 1500 calories for women and 1800 calories for men. The fat gram goal was 25% of the total daily calories, eg, 33 or 42 grams/day for females and 42 or 50 grams/day for men. The interventionists counseled participants to ensure that their average daily consumption over a one-week
Patient Preference and Adherence 2009:3
Attendance was examined as a binary variable (adherent: attended, nonadherent:not attended).
Adherence to energy and fat gram goals We calculated adherence to energy and fat gram goals on a weekly basis to incorporate the banking strategy. Adherence to the energy goal was calculated by dividing the total number of energy consumed per week by the weekly calorie goal, then multiplying by 100 to express the value as a percentage, eg, if a participant with a daily calorie goal of 1800 (weekly goal = 12,600) reported consuming 10,500 total calories in a
submit your manuscript | www.dovepress.com
Dovepress
153
Dovepress
Acharya et al
week, the level of adherence to the energy goal was calculated as 83.3% (10,500/12,600 × 100%). We calculated the level of adherence to the fat gram goal similarly. Based on the calculation of adherence to the energy intake and fat gram goals, participants were categorized as adherent (reported consuming 85%–115% of the weekly goals) and nonadherent (reported consuming 85% or 115% of the weekly goals) on a weekly basis. It is important to note that participants were categorized for energy and fat gram goals separately; thus, a person could be adherent to the dietary goal in one dimension (energy) and not in another (fat grams). If a diary was not returned, adherence to dietary goals (energy and fat grams) was coded as nonadherent for that week.
Adherence to exercise goal We calculated exercise adherence using the reported weekly minutes spent exercising divided by the weekly goal. For example, a person who reported 140 minutes when the goal was 150 minutes a week, adherence to the goal was 93% (140/150 × 100%). Since the exercise goal was increased over the first six weeks, the denominator was changed accordingly. Adherence to the goal was examined as a binary variable based on whether participants achieved the goal each time their diaries were submitted (adherent: 100% of weekly goal, nonadherent: 100% of weekly goal).
Adherence to self-monitoring We examined adherence to self-monitoring as a binary variable based on whether participants completed daily recordings of food, energy intake and fat grams in the weekly diary (adherent:self-monitored, nonadherent:did not self-monitor). We defined an incomplete or a missing diary as nonadherent for that week. Participants were expected to complete 32 diaries during the intervention period.
Outcome measures At each intervention session, we measured weight on a digital scale (Tanita Corporation of America, Inc., Arlington Heights, IL, USA) with the participant in light clothing and not wearing shoes. This scale is widely used in the research and is known to provide valid measures of weight and body composition. Additionally, the scale was calibrated periodically to ensure reliability. Blood samples, obtained following a 12-hour fast every six months, were assayed at the Heinz Nutrition Laboratory, University of Pittsburgh. Analyses of serum triglyceride and HDL levels were conducted enzymatically using the Abbot VP Supersystem. LDL was estimated using the Friedwald
154
submit your manuscript | www.dovepress.com
Dovepress
equation. Insulin was measured by radioactive immunoassay procedure.
Statistical methods We used SAS (version 9.1.3; SAS Institute, Inc., Cary, NC) to conduct the statistical analyses. The significance level for two-sided hypothesis testing was set at 0.05. We computed descriptive statistics as means and standard deviations, or medians and interquartile ranges for continuous variables and frequency counts and percentages for categorical variables. Wilcoxon rank-sum and two sample t-tests for continuous variables and chi-squared tests of independence for categorical variables were used to compare baseline characteristics of the participants included in the analysis and those excluded from the analysis due to missing data from the treatment sessions or the semi-annual assessments. Weight measurements were missing for some sessions due to attrition that occurred at different time points. For missing session weights, we used the difference in weight from the last to the next attended session and distributed that weight difference equally over the number of missed sessions. Participants who attended at least 50% of the sessions were included in the examination of the effects of the five components of adherence on the percent weight change (n = 139 at six months and n = 106 at 12 months). Participants missing the 6th or 12th month weight assessment were excluded from examination of the effects of adherence on percent biomarker changes (n = 25). Because adherence to each treatment component was treated as a binary response, nonlinear mixed effects modeling was applied (PROC NLMIXED) to model adherence as a function of time. Mixed-effect logistic regression modeling was employed for the longitudinal binary response variables of adherence to attendance, exercise, self-monitoring, and calorie and fat gram goals with the probability of being adherent (=1) being modeled.22 Both linear and nonlinear functions of time (eg, square root, squared, and cube) were considered. We used the likelihood ratio test to compare nested models. Nonsignificant functions of time were eliminated to achieve parsimonious models. To test the effects of components of adherence on percent weight change over time, we used linear mixed modeling (PROC MIXED). We excluded adherence components from the full multivariate model if they were not statistically significant in the univariate analyses or did not significantly improve the model. Using the Akaike information criterion and the Bayesian information criterion, the heterogeneous Toeplitz covariance structure was identified as having the best
Patient Preference and Adherence 2009:3
Dovepress
Adherence to weight loss treatment program
fit for the variance/covariance for the repeated assessments for weight. For the examination of the mediating effects of weight loss on adherence components, we calculated the proportion of weeks that participants were adherent for each component by dividing the number of completed diaries by the total number of sessions in each six-month period. Percent change was considered for weight and biomarkers. We used the Sobel test via bootstrapping23 to examine the mediating effect of percent weight change as described in Figure 1. Sensitivity analyses were performed to assess data points that were outliers and/or were influential. These observations were detected by graphical analysis of residuals. When outlying observations were omitted via sensitivity analysis, the results did not change, supporting the robustness of our findings.
Results The PREFER sample was predominantly female (86.9%), White (70.5%), currently employed (63.1%), and on average,
completed 15 years of formal education. The mean age was 44.4 ± 8.6 years with a BMI range of 27.1 kg/m2 to 42.7 kg/m2 at baseline. Table 1 described the mean weight and measures of biomarkers of participants included in the analysis.
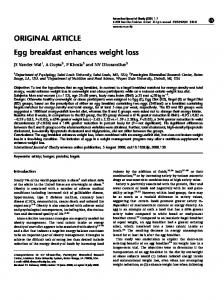
Adherence to treatment protocol Figure 2 displays the overall pattern of adherence to all components of the treatment protocol over time. Attendance had the highest level of adherence followed by self-monitoring, and achieving the exercise, energy and fat gram goals during the entire intervention period. Attendance decreased to 56% at the end of the first six months and to 44% at the end of 12 months. Half of the sample continued to self-monitor at six months and 22% at the end of the year. On average, 62% of the diaries were turned in and of those diaries, 93.2% of them contained completed recordings. We observed a sharp decline in adherence to the exercise at week six, the point where the goal increased to 150 minutes per week, and observed a continuing decline thereafter. The highest level
A ADHERENCE
Total Effect
BIOMARKERS Response Variable
Predictor Variable Total effect of adherence on biomarkers (no controlling for weight ∆) B
Indirect Effect (through weight ∆)
WEIGHT CHANGE Mediator Effect of weight ∆ on biomarkers controlling for adherence
Effect of adherence on weight ∆
ADHERENCE
Direct Effect
Predictor Variable
BIOMARKER Response Variable
The effect of adherence on biomarkers (controlling for weight ∆) Figure1 Direct and indirect effects of adherence measures on changes in biomarkers. Note: Δ, change.
Patient Preference and Adherence 2009:3
submit your manuscript | www.dovepress.com
Dovepress
155
Dovepress
Acharya et al
Table 1 Measures of weight and biomarkers at baseline, 6, and 12 months Measures
Baseline (n = 151)
6 months (n = 151)
12 months (n = 127)
Mean ± SD (min, max)
Mean ± SD (min, max)
Mean ± SD (min, max)
Weight (kg)
94.18 ± 14.51 (67.62, 136.30)
85.81 ± 14.62 (49.44,123.0)
85.28 ± 14.71 (52.35, 118.20)
Insulin (µmol/L)
18.30 ± 8.20 (2.60, 52.30)
14.10 ± 5.93 (2.00, 33.80)
14.90 ± 7.21 (2.70, 44.80)
LDL (mg/dL)
123.8 ± 35.11 (25.90, 216.60)
122.1 ± 35.52 (21.50, 230.20)
120.70 ± 34.18 (44.00, 210.60)
Males
41.68 ± 8.59 (27.30, 62.00)
43.89 ± 10.22 (28.80, 73.90)
44.49 ± 7.64 (30.00, 58.70)
Females
54.12 ± 11.19 (30.70, 84.40)
51.50 ± 10.65 (28.90, 83.00)
55.15 ± 12.26 (27.40, 84.20)
196.3 ± 110.5 (49.00, 457.00)
121.2 ± 60.15 (56.00, 279.00)
139.6 ± 63.04 (57.00, 316.00)
125.5 ± 58.97 (45.00, 389.00)
121.9 ± 55.69 (45.00, 342.00)
117.8 ± 56.87 (43.00, 419.00)
HDL (mg/dL)a
Triglycerides (mg/dL)b Males Females
Notes: 19 males and 132 females at baseline and 6 months; 18 males and 109 females at 12 months. Abbreviations: LDL, low-density lipoprotein; HDL, high-density lipoprotein; SD, standard deviation. a,b
of adherence to the energy goal (50%) occurred at week 3; adherence continually declined thereafter. Less than 40% of participants achieved the prescribed fat gram goal in the first three weeks; 22% continued to be adherent at the end of the weekly sessions, and the percent adherent decreased to 10% at 12 months. In the first six months, a significant nonlinear decline was found in adherence to attendance; a significant linear decline was found in adherence to self-monitoring and the energy
goal; a significant linear and nonlinear decline was found in adherence to the exercise and the fat gram goals (all ts 2.25 and ps 0.0001). However, in the second six months, only a significant linear decline was observed to all intervention components (all ts 2.22 and ps 0.0001).
Adherence and weight change In the first six months, the mean weight loss from baseline was -9.42 ± 5.93% (-8.81 ± 5.96 kg). Using univariate regression
1.0
Attendance Self-monitoring Exercise
0.9 0.8
Fat Calorie
Proportion
0.7 0.6 0.5 0.4 0.3 0.2 0.1 0.0 0
2
4
6
8
10 12 14 16 18 20 22 24 26 28 30 32 34 36 38 40 42 44 46 48 50
Time (Weeks) Figure 2 Proportion of participants adherent to the five treatment components (N = 176).
156
submit your manuscript | www.dovepress.com
Dovepress
Patient Preference and Adherence 2009:3
Dovepress
Adherence to weight loss treatment program
models controlling for the effect of time, we found greater weight loss was significantly associated with greater attendance, more frequent self-monitoring, and higher adherence to exercise and energy goals (P for all 0.0001) (Table 2). However, no significant difference in weight loss was observed between those who were adherent and those who were not adherent to the fat gram goal. The final multiple regression model with percent weight change as a dependent variable indicated significant associations with more frequent self-monitoring (P = 0.004), greater attendance (P = 0.005) and adherence to the energy goal (P = 0.032). A marginally significant association was also observed between adherence to the exercise goal and percent weight change (P = 0.07) (Table 3). Following the less-intensive intervention phase (at 12-month), the mean weight change from six months was 0.23 ± 4.35% (0.20 ± 3.56 kg). As indicated by the univariate regression models, a significantly greater weight loss or maintenance was observed among attendees (P = 0.001), those who were more adherent to self-monitoring (P = 0.03) and those with greater adherence to the exercise goal (P = 0.003). There was a marginally significant difference in weight loss between adherers to the energy goal and non-adherers (P = 0.09), but there was no difference in weight loss or weight maintenance related to fat gram goal adherence (Table 2). Table 3, the multiple regression model revealed significant associations between weight loss and greater attendance (P = 0.005) and weight loss and adherence to the exercise goal (P = 0.014) (Table 2). Participants excluded from the analysis during the intensive (n = 37) and less-intensive (n = 70) phases had a significantly higher BMI (P = 0.02) at baseline than participants included in the analysis. Other variables including gender, race, and age did not differ between the two groups.
Adherence and biomarkers During the intensive phase, the median change in biomarkers from baseline were -2.5% for LDL (interquartile range
[IQR]: -14.3, 11.21%), -3.45% for triglycerides (IQR: -23.1, 13.7%), -2.9% for HDL (IQR: -11.7, 5.4%), and -23.1% for insulin (IQR: -33.7, 4.8%). As indicated by the Sobel test, adherence to fat gram goal was not significantly related to any biomarkers. However, significant indirect effects through weight change were noted for some adherence components on selected biomarkers: attendance with changes in LDL (95% confidence interval [CI] = -23.55, -8.30), triglycerides (95% CI = -50.11, -11.27) and insulin (95% CI = -37.85, -15.11); adherence to self-monitoring with changes in LDL (95% CI = -30.62, 12.31), triglycerides (95% CI = -40.93, -8.45) and insulin (95% CI = -30.62, -12.31); and adherence to the exercise goal with changes in LDL (95% CI = -15.37, -5.48), triglycerides (95% CI = -24.31, -5.22), and insulin (95% CI = -28.33, -10.53). Adherence to the fat gram goal had no indirect effect on any biomarkers (Table 4). The direct and indirect effects of HDL on adherence measures were not explored in the first six months because of an initial decline in HDL level, an expected phenomenon during weight loss. At the 12-month assessment, the median change in biomarkers from six months was: 1.02% for LDL (IQR: -12.9, 13.34%), 0.43% for triglycerides (IQR: -20.8, 28.77%), 5.04% for HDL (IQR: -2.73, 15.96%), and 8.57% for insulin (IQR: -10.3, 31.94%). The Sobel test revealed no significant direct or indirect effect of each adherence component on biomarkers during the less-intensive phase. We observed no differences in race, gender, age, or BMI among participants who were excluded at six and 12 months when compared with participants included in the analysis.
Discussion The present study examined adherence to a behavioral weightloss intervention and how adherence to these intervention components was related to weight loss and biomarkers in a weight-loss trial. The findings suggest that adherence declines even during the intensive phase. Adherence to attendance,
Table 2 Univariate regression modelsa of measures of adherence as predictors of percent weight change Adherence components
Intensive intervention phase 0–6 months (n = 139)
Less-intensive intervention phase 7–12 months (n = 106)
Estimate
SE
t(P)
Estimate
SE
t(P)
Attendance
0.19
0.04
4.68 (0.0001)
0.30
0.09
3.25 (0.001)
Self-monitoring
0.25
0.04
6.91 (0.0001)
0.17
0.08
2.12 (0.03)
Exercise goal
0.15
0.03
4.74 (0.0001)
0.24
0.08
2.96 (0.003)
Calorie goal
0.17
0.03
5.33 (0.0001)
0.14
0.08
1.67 (0.09)
Fat gram goal
-0.02
0.04
0.76 (0.44)
-0.01
0.09
-1.4 (0.89)
Note: aModels adjusted for the effect of function of time (square root). Abbreviation: SE, standard error.
Patient Preference and Adherence 2009:3
submit your manuscript | www.dovepress.com
Dovepress
157
Dovepress
Acharya et al
Table 3 Final multivariate regression modelsa of the set of adherence components as predictors of percent weight change Adherence measures
Intensive intervention phase 0–6 months (n = 139)
Less-intensive intervention phase 7–12 months ( n = 106)
Estimate
SE
t(P)
Estimate
SE
t(P)
Attendance
0.12
0.04
2.81 (0.005)
0.26
0.09
2.79 (0.0054)
Self-monitoring
0.14
0.05
2.88 (0.004)
–
–
–
Exercise goal
0.06
0.03
1.79 (0.07)
0.20
0.08
2.47 (0.01)
Calorie goal
0.08
0.04
2.15 (0.03)
–
–
–
Notes: Parsimonious model did not include self-monitoring and calorie goal in the less-intensive phase; aModels adjusted for the effect of function of time (square root). Abbreviation: SE, standard error.
self-monitoring and the energy goal was positively associated with weight loss during the intensive intervention phase. Similarly, positive associations between attendance and adherence to exercise and weight loss were observed during the less-intensive phase. Indirect effects of adherence were observed with the improvement in biomarkers indicating a mediation effect through weight loss. We observed the maximum weight reduction and improvements in biomarkers (except HDL) during the first six months followed by weight maintenance during the second six months. Attendance had the highest rate of adherence with the least decline whereas adherence to the fat gram goal was the lowest at all times. Our findings, significantly greater weight loss with greater protocol adherence, are consistent with the findings of others who have reported greater weight loss with better attendance,9,10 self-monitoring,10,16,24 and adherence to the energy goal.12 Hollis and colleagues15 reported a greater weight loss with higher attendance, frequent self-monitoring and adherence to exercise. These cumulative results indicate that adherence to multiple treatment components is necessary to achieve successful weight loss. During the less-intensive phase, weight maintenance was significantly associated with greater attendance and adherence to the exercise goal. The beneficial effects of regular exercise on successful weight loss25,26 and weight maintenance
are well established.27 Our findings also emphasize the importance of adherence to the exercise regimen to be successful in maintaining weight loss. The nonsignificant findings between self-monitoring, adherence to energy goal, and weight change may be explained by the continued decline in self-monitoring over time. Since attendance was the only adherence component that was positively associated with weight loss during both the intensive and less-intensive intervention phases, it might be used as an indicator of overall declining adherence during the intervention period. We also examined the effect of each adherence component on the biomarkers and found that adherence to selfmonitoring and the exercise goal had indirect effects on the improvement of biomarkers during the intensive phase. These findings suggest that the effects of self-monitoring and exercise are manifested through a mediating role of weight loss on biomarkers. Higher levels of adherence to self-monitoring and exercise resulted in greater weight loss, which in turn led to improvement in biomarkers. The indirect effect of adherence components on biomarkers is further strengthened by the lack of such associations during the less-intensive phase since no significant weight change was observed during that period. We did not find a significant association between adherence to the fat gram goal and weight loss, nor did we observe
Table 4 Indirect bootstrapping effects of proportion of each adherence component on percent change in biomarkers through percent weight change (n = 151)a,b Biomarkers
Adherence measures during the intensive phase Attendance
Self-monitoring
Exercise
Mean
SE
95% CI
Mean
SE
95% CI
Mean
SE
95% CI
Low density lipoprotein (mg/dL)
-15.03
3.85
-23.55, -8.30
-20.90
4.71
-30.62, -12.31
-9.91
2.50
-15.37, -5.48
Triglycerides (mg/dL)
-27.51
9.98
-50.11, -11.27
-22.71
8.16
-40.93, -8.45
-13.98
4.86
-24.31, -5.22
Insulin (mg/dL)
-25.39
5.79
-37.85, -15.11
-20.90
4.71
-30.62, -12.31
-18.57
4.63
-28.33, -10.53
Notes: aNo direct significant effect of adherence measures on biomarkers were observed; bOnly effects where CI did not include 0 (P 0.05) are reported. Abbreviations: CI, confidence interval; SE, standard error.
158
submit your manuscript | www.dovepress.com
Dovepress
Patient Preference and Adherence 2009:3
Dovepress
a direct or indirect effect of adherence to the fat gram goal on biomarkers. This might have been due to the very low adherence to this goal. A low-fat diet is viewed as less appetizing and satiating28 and thus might have been the most difficult component for participants to implement and sustain. Azadbakht and colleagues29 reported that the moderate-fat diet (30% energy) group was more successful in reducing weight and other cardiovascular risks than the low-fat diet (20% energy) group. Similarly, Shai and colleagues18 suggested that the Mediterranean and low-carbohydrate diets might be more effective than the low-fat diet for achieving more favorable changes in weight and lipid levels. Hence, it is possible that individuals might be more likely to reduce their fat intake for the long term if they adopt a moderate-fat diet consisting of unsaturated fatty acids as opposed to a standard low-fat diet. The findings of this study have implications for researchers and clinicians mainly that greater attention needs to be given to enhancing adherence to all components of the SBT protocol for improved reduction of weight and related cardiovascular risks. Although adherence to treatment components contributed significantly to successful weight loss and improvement in biomarkers, it was very difficult for participants to remain adherent. Considering the wide variation in adherence to the treatment components, exploring individualized strategies to improve adherence in future studies is important. A growing body of evidence suggests that adherence to the treatment protocol declines over time6,12,16 indicating the need for innovative strategies to enhance adherence. One such strategy could be the incorporation of motivational interviewing to augment the existing intervention. Motivational interviewing has been associated with greater adherence to treatment and follow-up in a weight-loss program30 and with increased adherence to dietary goals.31 Other strategies, such as setting individual goals, being rewarded for progress attained and receiving feedback and reinforcement were successful in the Diabetes Prevention Program and should be incorporated into other behavior change programs targeting weight loss. Future studies should also focus on developing approaches that decrease the burden of self-monitoring for individuals seeking weight loss. The Women’s Health Initiative dietary intervention developed self-monitoring options, such as the picture tracker (a graphic tool to count fruit/vegetable and grain servings) and the eating patterns questionnaires (tool to track changes in behaviors related to low-fat eating).32 The use of personal digital assistants with dietary software has also been explored as an alternative to traditional self-monitoring approach.33–35 These approaches should be integrated in future weight loss studies in order to enhance adherence.
Patient Preference and Adherence 2009:3
Adherence to weight loss treatment program
The main limitation of this study was the reliance on self-report measures. Attendance was the only objective measure of adherence. The generalizability of these findings may be limited due to the predominantly female sample; however, the sample included 18% males, and moreover, 29% minorities. Additionally, the proportion of the sample that was adherent during the later phase was smaller during the less-intensive phase, thus may have been inadequate to detect statistically significant differences. A major strength of the study was the comprehensive examination of adherence to each component of the weight-loss treatment protocol for 12 months. The retention rate of 74% at the 12-month assessment was comparable or better than rates reported for other weight-loss studies.6,36 Despite declining adherence, all groups lost weight (0.54 kg to 33.61 kg).
Conclusion A steady decline in adherence even during the intervention period indicates that it is difficult for participants to sustain the behavior changes required for treatment goal achievement. Our findings reveal greater attendance and adherence to self-monitoring, exercise, and calorie goals contribute to successful weight loss and maintenance. Moreover, improvements in biomarker measures are achieved through weight loss. Some additional strategies, such as individual support, motivational interviewing and the use of less burdensome self-monitoring tools should be explored in future studies to achieve optimal adherence to the treatment protocol.
Disclosure The authors declare no conflicts of interest in this work. This study was supported by the following grants: NIDDK, #RO1-DK58631 and partial support for LE Burke by NIH K24 Award, NR010742. The conduct of the study was also supported by the Data Management Core of the Center for Research in Chronic Disorders NIH-NINR #P30-NR03924, the Obesity and Nutrition Research Center NIH-NIDDK #DK-046204, and the General Clinical Research Center, NIH-NCRR-GCRC #5MO1-RR00056 at the University of Pittsburgh. We gratefully acknowledge the participants in this study who willingly gave their time to complete the assessments.
References
1. Wing RR. Behavioral approaches to the treatment of obesity. In: Bray GA, Bourchard C, James WPT, editors. Handbook of obesity: Clinical applications. 2nd ed. New York: Marcel Dekker; 2004. p. 147–167. 2. Wing RR. Behavioral interventions for obesity: Recognizing our progress and future challenges. Obes Res. 2003;11 Suppl:3S–6S.
submit your manuscript | www.dovepress.com
Dovepress
159
Dovepress
Acharya et al 3. Dansinger ML, Gleason JA, Griffith JL, Selker HP, Schaefer EJ. Comparison of the Atkins, Ornish, Weight Watchers, and Zone diets for weight loss and heart disease risk reduction: A randomized trial. JAMA. 2005;293(1):43–53. 4. Van Horn LV, Dolecek TA, Grandits G, Skweres L. Chapter 8. Adherence to dietary recommendations in the special intervention group in the Multiple Risk Factor Intervention Trial. American Journal Clinical Nutrition. 1997;65(suppl):289S–304S. 5. Barnard ND, Gloede L, Cohen J, et al. A low-fat vegan diet elicits greater macronutrient changes, but is comparable in adherence and acceptability, compared with a more conventional diabetes diet among individuals with type 2 diabetes. J Am Diet Assoc. 2009;109(2): 263–272. 6. Jakicic JM, Winters C, Lang W, Wing RR. Effects of intermittent exercise and use of home exercise equipment on adherence, weight loss, and fitness in overweight women: a randomized trial. JAMA. 1999;282(16): 1554–1560. 7. Simkin-Silverman L, Wing RR, Boraz MA, Kuller LH. Lifestyle intervention can prevent weight gain during menopause: results from a 5-year randomized clinical trial. Ann Behav Med. 2003;26(3):212–220. 8. Dansinger ML, Schaefer EJ. Low-fat diets and weight change. JAMA. 2006;295(1):94–95. 9. Lantz H, Peltonen M, Agren L, Torgerson JS. A dietary and behavioural programme for the treatment of obesity. A 4-year clinical trial and a long-term posttreatment follow-up. J Intern Med. 2003;254(3): 272–279. 10. van Gool CH, Penninx BW, Kempen GI, et al. Determinants of high and low attendance to diet and exercise interventions among overweight and obese older adults. Results from the arthritis, diet, and activity promotion trial. Contemp Clin Trials. 2006;27(3):227–237. 11. Alhassan S, Kim S, Bersamin A, King AC, Gardner CD. Dietary adherence and weight loss success among overweight women: results from the A TO Z weight loss study. Int J Obes (Lond). 2008;32(6): 985–991. 12. Carels RA, Young KM, Coit C, Clayton AM, Spencer A, Hobbs M. Can following the caloric restriction recommendations from the Dietary Guidelines for Americans help individuals lose weight? Eat Behav. 2008;9(3):328–335. 13. Chao D, Farmer DF, Sevick MA, Espeland MA, Vitolins M, Naughton MJ. The value of session attendance in a weight-loss intervention. Am J Health Behav. 2000;24(6):413–421. 14. Wadden TA, Crerand CE, Brock J. Behavioral treatment of obesity. Psychiatr Clin North Am. 2005;28(1):151–170. 15. Hollis JF, Gullion CM, Stevens VJ, et al. Weight loss during the intensive intervention phase of the weight-loss maintenance trial. Am J Prev Med. 2008;35(2):118–126. 16. Wadden TA, Berkowitz RI, Womble LG, et al. Randomized trial of lifestyle modification and pharmacotherapy for obesity. N Engl J Med. 2005;353(20):2111–2120. 17. Yon BA, Johnson RK, Harvey-Berino J, Gold BC. The use of a personal digital assistant for dietary self-monitoring does not improve the validity of self-reports of energy intake. J Am Diet Assoc. 2006;106(8): 1256–1259. 18. Shai I, Schwarzfuchs D, Henkin Y, et al. Weight loss with a lowcarbohydrate, Mediterranean, or low-fat diet. N Engl J Med. 2008; 359(3):229–241.
19. Burke LE, Choo J, Music E, et al. PREFER study: A randomized clinical trial testing treatment preference and two dietary options in behavioral weight management – rationale, design and baseline characteristics. Contemp Clin Trials. 2006;27(1):34–48. 20. Burke LE, Hudson AG, Warziski MT, et al. Effects of a vegetarian diet and treatment preference on biochemical and dietary variables in overweight and obese adults: A randomized clinical trial. Am J Clin Nutr. 2007;86(3):588–596. 21. Burke LE, Warziski M, Styn MA, Music E, Hudson AG, Sereika SM. A randomized clinical trial of a standard versus vegetarian diet for weight loss: The impact of treatment preference. Int J Obes. 2008;32:166–176. 22. Hedeker D, Gibbons RD. Longitudinal Data Analysis. New York: John Wiley and Sons; 2006. 23. Preacher KJ, Hayes AF. SPSS and SAS procedures for estimating indirect effects in simple mediation models. Behav Res Methods Instrum Comput. 2004;36(4):717–731. 24. Yon BA, Johnson RK, Harvey-Berino J, Gold BC, Howard AB. Personal digital assistants are comparable to traditional diaries for dietary selfmonitoring during a weight loss program. J Behav Med. 2007;30(2): 165–175. 25. Jakicic JM, Otto AD. Physical activity recommendations in the treatment of obesity. Psychiatr Clin North Am. 2005;28(1):141–150. 26. Gordon-Larsen P, Hou N, Sidney S, et al. Fifteen-year longitudinal trends in walking patterns and their impact on weight change. Am J Clin Nutr. 2009;89(1):19–26. 27. Tate DF, Jeffery RW, Sherwood NE, Wing RR. Long-term weight losses associated with prescription of higher physical activity goals. Are higher levels of physical activity protective against weight regain? Am J Clin Nutr. 2007;85(4):954–959. 28. Astrup A, Toubro S, Raben A, Skov AR. The role of low-fat diets and fat substitutes in body weight management: what have we learned from clinical studies? J Am Diet Assoc. 1997;97(7 Suppl):S82–S87. 29. Azadbakht L, Mirmiran P, Esmaillzadeh A, Azizi F. Better dietary adherence and weight maintenance achieved by a long-term moderatefat diet. Br J Nutr. 2007;97(2):399–404. 30. Smith West D, DiLillo V, Burzac Z, Gore SA, Greene PG. Motivational interviewing improves weight loss in women with type 2 diabetes. Diabetes Care. 2007;30(5):1081–1087. 31. Bowen D, Ehret C, Pedersen M, et al. Results of an adjunct dietary intervention program in the Women’s Health Initiative. J Am Diet Assoc. 2002;102(11):1631–1637. 32. Mossavar-Rahmani Y, Henry H, Rodabough R, et al. Additional selfmonitoring tools in the dietary modification component of The Women’s Health Initiative. J Am Diet Assoc. 2004;104(1):76–85. 33. Glanz K, Murphy S, Moylan J, Evensen D, Curb JD. Improving dietary self-monitoring and adherence with hand-held computers: a pilot study. Am J Health Promot. 2006;20(3):165–170. 34. Burke LE, Warziski M, Starrett T, et al. Self-monitoring dietary intake: Current and future practices. J Ren Nutr. 2005;15(3):281–290. 35. Sevick MA, Piraino B, Sereika S, et al. A pilot study of PDA-based dietary self-monitoring in hemodialysis patients. J Ren Nutr. 2005;15(3):304–311. 36. Renjilian DA, Perri MG, Nezu AM, McKelvey WF, Shermer RL, Anton SD. Individual versus group therapy for obesity: Effects of matching participants to their treatment preferences. J Consult Clinl Psychol. 2001;69(4):717–721.
Dovepress
Patient Preference and Adherence
Publish your work in this journal Patient Preference and Adherence is an international, peer-reviewed, open access journal that focusing on the growing importance of patient preference and adherence throughout the therapeutic continuum. Patient satisfaction, acceptability, quality of life, compliance, persistence and their role in developing new therapeutic modalities and compounds to
optimize clinical outcomes for existing disease states are major areas of interest. This journal has been accepted for indexing on PubMed Central. The manuscript management system is completely online and includes a very quick and fair peer-review system. Visit http://www.dovepress.com/ testimonials.php to read real quotes from published authors.
Submit your manuscript here: http://www.dovepress.com/patient-preference-and-adherence-journal
160
submit your manuscript | www.dovepress.com
Dovepress
Patient Preference and Adherence 2009:3