Journal of Water and Environment Technology, Vol. 8, No.1, 2010
Adsorption Characteristics of Metals in Aqueous Solution by Local Materials with Additives as Liners for Waste Containment Facilities Syed Abu Sayeed Mohammed *, Maya Naik ** *Faculty of Civil Engineering, HKBK College of Engineering, Nagawara, Bangalore 560045, India. **Faculty of Civil Engineering, BMS College of Engineering, Bangalore 560019, India. ABSTRACT Liners play an important role in minimizing migration of contaminants in landfill engineering. Adsorption studies were carried out in order to assess the suitability of local materials with additives as liners .The red soil along with admixtures has been found to retain heavy metals and alkali metals effectively. For different dilution ratios, it was found that adsorption efficiency decreases with increasing dilution ratio. Empirical adsorption models like Langmuir and Freundlich were applied for the experimental data and both were found to vary linearly. Monolayer sorption capacity was obtained using Langmuir isotherm, which was used to arrive at adsorption rankings for different mixtures. The correlation coefficient varied from 0.9058 to 0.9884 for Langmuir and from 0.9096 to 1 for Freundlich, which suggests that both isotherm models fit very well. Constant pH batch adsorption studies were carried out at pH 4, 6, 8, 10, and 12. It was found that adsorption is pH dependent and maximum adsorption takes place at a pH range of 6 to 8 for all elements, except for hexavalent chromium. Confirmatory tests were done by taking scanning electron microscopy (SEM) images and electron dispersive spectroscopy (EDS) for thorough understanding of soil mineral structure. Keywords: adsorption, alkali metals, dilution ratios, EDS, Freundlich, heavy metals, Langmuir, pH, SEM
INTRODUCTION Landfills have been the most economical and environmentally acceptable method for the disposal of solid wastes. However, the leachate generated in landfills migrate downwards and poses threat to ground water, unless properly controlled by a barrier. Percolating fluid will tend to migrate downward through the landfill as leachate. Unless properly regulated, leachates generated by precipitation and other liquids within the waste, flow from the landfill into underlying ground water and thus, potentially contaminate the drinking water aquifer. In an earlier study on a municipal and industrial waste dump site of Bangalore, it was found that the soil of Bangalore which is predominantly red soil is moderately vulnerable to pollutants (Mohammed et al., 2008). By comparing the literature, it has been found that geosynthetic clay liners have more advantages (which give a hydraulic conductivity of ≤ 1X 10 -9 cm/s) compared to compacted clay liners (CCL), but their availability is limited. Soil liners possess many limitations but are widely used because of their universal availability, low cost, large attenuation capacity and their resistance to puncture and damage. In developing countries CCLs are more popular because of the availability of Address correspondence to Syed Abu Sayeed Mohammed, Dept. of Civil Engineering, HKBK College of Engineering, # 22/1, Nagawara, Bangalore 560045, India. Email:
[email protected] Received: July 01, 2009, Accepted: December 01, 2009. - 29 -
Journal of Water and Environment Technology, Vol. 8, No.1, 2010
good quality clays and cheap labour. Landfill engineering is sufficient to ensure a leachate retention time of 50 years. The behavior of CCL to diffusion and transport phenomenon for major ions of leachates have been studied for brown and red soil of Bangalore. Mathematical models have been used to illustrate the migration of contaminants through soil liners. Different ions migrate through soil liners at different velocities depending on their diffusion coefficients (Naik and Sivapullaiah, 2003). The behavior of the combination of materials has also been enumerated. Materials like fly ash, illite, red soil and mixture of fly ash and bentonite, illite and bentonite also stabilizing these materials by mixing lime have also been studied. It has been found that fly ash has high hydraulic conductivity, illite possesses reasonably high cation exchange capacity and specific surface area and its hydraulic conductivity is lower in chemical solutions than in water. Addition of 20% bentonite to illite greatly enhances its quality as liner material. Moreover, the compressibility of mixture is decreased and hydraulic conductivity is lowered. The fly ash-bentonite mixture is less compressible, possesses good strength but with poor chemical compatibility. It can be used to contain leachates with heavy metal ions. Red soil-bentonite mixture possesses many desirable properties for its potential use as a liner. Inclusion of bentonite has helped to increase the cation exchange capacity because it possesses reasonably low compression index. Non-plastic fly ash-bentonite mixture becomes plastic upon addition of lime. It slightly increases the compression index but lowers the hydraulic conductivity. Stabilization of illite with lime has improved its plasticity but slightly increased its hydraulic conductivity. From the above work it can be concluded that the selection of barrier system should be site specific considering local hydrogeology, nature of waste, size of the landfill, climatic conditions, availability of suitable materials and economy (Laxmikantha and Sivapullaiah, 2000). The phenomenon of sorption has not been given much thought on the soil of Bangalore. Transport parameters that can be used to predict transport of heavy metals are rarely reported in literature, particularly, hazardous waste might leach out from these liners and finally enter the ground water (Tanit et al., 2009). In an earlier work, leaching studies were conducted on the red soil with additives. It was found that enhanced retention capacity for contaminants have been obtained with red soil of Bangalore with additives like cement, lime and fly ash. Chromium is the least sorbed and is subjected to nonspecific adsorption. The sorption sequence for the heavy metals considered are Zn>Cu>Cr. Potassium is subjected to specific adsorption due to lower hydrated radius of its ions and sodium is subjected to nonspecific adsorption because it is dispersive in nature. The sorption sequence is K> Na. (Mohammed et al., 2009) The main aim of this work is to conduct sorption studies at constant initial concentration; conduct sorption at constant pH; use adsorption isotherms to predict the type of sorption taking place and study the suitability of the different combination of mixtures as liners based on sorption phenomenon, confirmatory tests using SEM and EDS for thorough understanding of the soil mineral structure.
- 30 -
Journal of Water and Environment Technology, Vol. 8, No.1, 2010
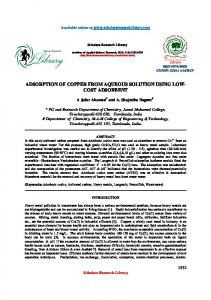
MATERIALS AND METHODS Instrumentation A cost-effective method has been used to determine concentrations of copper, zinc and chromium by potentiometry. For the determination of copper and zinc, mercury electrode with calomel as reference electrode is used. For the determination of chromium, platinum electrode instead of mercury electrode was used. First, standardization of this method was done. Standard samples of 1, 5, 10, 20, 50, 100 mg/l of contaminants were prepared and determined potentiometrically and standard graphs were plotted. The trends in the graphs should match with the standard curves given in literature. It was found that at higher concentrations, the standard graphs matched with the theoretical graphs. The potentiometric method using mercury electrode for the determination of zinc and copper had limitations at very low concentrations of less than 5ppm, since the working concentrations used was of a higher range, hence, this limitation seem to have negligible effect on our work (Fig.1). For the determination of sodium and potassium, flame photometric method was used (Jeffery et al., 1997).
(a)
(b)
(c)
Fig.1 (a) Experimental setup for the potentiometric determination of copper using mercury electrode (b) Closeup of the mercury electrode specially fabricated for this work (c) Sample shaker fabricated by the authors Chemicals Heavy metal salts like copper nitrate, zinc nitrate, potassium dichromate were used. Sodium chloride and potassium chloride were the alkali metal salts used for adsorption experiments. Adjustments of pH were carried out using 0.1N hydrochloric acid (HCl) and 0.1N sodium hydroxide (NaOH).The chemicals used were analytical grade (AR) supplied by Nice Chemicals. Adsorbent Red soil of Bangalore drawn from the campus of the Indian Institute of Science (IISc), Bangalore is taken as the main soil for experiments; IISc was selected as it is a big campus with minimal contamination. Approximately 10 kg soil samples were taken 15cm below the ground. The soil was air dried and sieved to 2mm. Sub samples of air dried soil were ground and sieved to obtain aggregates less than 0.1mm to ensure uniformity of the material (Morrerra et al., 2001). Additives selected to enhance the properties were lime obtained as AR grade calcium hydroxide supplied by Qualigens Company, cement supplied by Associated Cement
- 31 -
Journal of Water and Environment Technology, Vol. 8, No.1, 2010
Company (ACC) grade 53 and fly ash obtained from Raichur Thermal Power Station (RTPS), Karnataka, India. Fly ash, a finely divided powder, is a byproduct from coal combustion in power plants that requires ultimate disposal. The major constituents of fly ash are silica, alumina and iron oxide which are ideal metal adsorbents. Potential use of fly ash as an additive for liner material is obvious as it can be obtained cheaply in large quantities and can be used as an adsorbent. The physical properties of fly ash as obtained from RTPS revealed a specific gravity of 2.05, fineness of 356 m2/kg, lime reactivity of 83%, soundness (autoclave) of 0.06 %, and residue (in 45 microns) of 33.6 %. The EDS results give the chemical composition of major elements in percent by weight as Ca (0.85%), Al (10%), Si (18%), Fe (12%), O (55%), Mg (2%), and C (8%). Also EDS shows no detectable presence of any heavy metals. In order to calculate the presence of any background concentrations of the selected contaminants, batch leaching tests were performed according to American Standard Testing Methods (ASTM D3987 – 85, reapproved 2004). It was found that no traces of heavy metals were found in the soil, but there was detectable presence of alkali metals. In order to simplify the problem, the background concentrations were subtracted from the total concentrations. By running blank samples, it has been found that the concentration of sodium was 5.6 mg/l and potassium was 8 mg/l for red soil. The physico-chemical properties of the selected soil are given below in Table 1. The cation exchange capacity of the soil was 18.5 meq/100g determined by ammonium acetate extraction method. Specific gravity test was conducted using a specific gravity bottle as per IS 2720 (Part III sec I). The liquid limit test of soil was determined by cone penetrometer method as per IS 2720 (Part V). Liquid limit of a soil was taken as the water content corresponding to 20 mm penetration from a line drawn with respect to water content and penetration. The plastic limits of the soils were obtained as per standard method IS 2720 (Part V). Shrinkage limit test was conducted as per IS 2720-1972 (Part VI). Grain-size distribution, the percentage of various sizes of particles in a given dry soil sample, was determined by particle size analysis or mechanical analysis. The mechanical analysis was performed in two stages: sieve analysis and sedimentation analysis. Bureau of Indian Standards (BIS), which is a regulatory body established by the government of India to standardize all testing methods and standard practices in the form of design codes, were considered in the study. These standards are consistent with ASTM and British standards. It takes into consideration Indian conditions which are unique due to geographical and climatic conditions. Batch Adsorption Tests Batch adsorption tests were done according to ASTM D 4646 – 87(reapproved 2001). This test method is meant to allow for a rapid (24 h) index of a geomedia’s sorption affinity for given chemicals or leachate constituents. The 24-h duration is used to make the test convenient and also to minimize microbial degradation which may be a problem in lengthened procedures. Due to this time constraint, the final (24-h) concentration should not be confused with that of an equilibrium or steady-state concentration. The 24-h time limit may be sufficient to reach a steady-state. About 5 to 70 g (oven-dried basis) of the weighed air-dried sample was placed into the appropriate container. The samples were weighed to a minimum of three significant figures. Solution was added to yield a 1:20 soil-to-solution ratio. This was determined on an oven-dried basis.
- 32 -
Journal of Water and Environment Technology, Vol. 8, No.1, 2010
Determination of solution volume needed per sample for a soil-to-solution ratio of 1:20 was done by first retaining a separate, appropriately preserved aliquot of the initial solution for analysis. The container was then closed and placed on the rotary extractor. It was agitated continuously for 24 ± 0.5 h at 29± 2 r/min at room temperature (22 ± 5°C). The container was opened and the temperature of the solution as well as any changes in the sample or solution (that is, color, odor, etc.) was noted. The liquid phase was separated from the majority of the solid phase by decantation. The liquid phase could be filtered through a 0.45-μm pore size membrane filter, or a subsample could be centrifuged at the predetermined rate of rotation and time for the centrifugation equipment employed at constant temperature and the temperature was recorded after 24 h. After a clear solution has been obtained, an aliquot was placed in an appropriate container, and analyzed or stored in a refrigerator at 4 ± 2°C until the analysis. Samples with S/L ratios of 1:20, 1:30, 1:40, 1:100, 1:200, were taken and shaken for 24 hours. Then, 100mg/l of contaminant was added proportionally to all samples and again shaken for 24 hours. The samples were then removed, filtered and the filtered liquid was analyzed for its concentration. For pH dependent tests the procedure was the same as mentioned except for the pH of the contaminant which was first adjusted to the required pH and then the adsorbent was added maintaining a constant S/L ratio of 1:20 throughout. All pH adjustments were made using 0.1N HCl and 0.1N NaOH. This was done to prevent neutralization reaction from taking place because of the presence of lime in the adsorbent and also to mimic field conditions (Veli and Alyuz, 2007). Table 1 - Physico-chemical properties of red soil. Property
red soil
Specific Gravity
2.64
Liquid Limit (%)
38.0
Plastic Limit (%)
21.0
Shrinkage Limit (%)
18.0
Max Dry Density (KN/m 3 ) Optimum Moisture Content (%) Cation Exchange Capacity (Meq/100gm) Specific Surface Area (m2/gm) Fine Sand %
16.8
31.8
Silt %
30.2
Clay %
38.0
Unified Soil Classification Symbol
CL
- 33 -
19.2 18.5 44.0
Journal of Water and Environment Technology, Vol. 8, No.1, 2010
Adsorption Models Adsorption isotherms for all five elements (Cr, Zn, Cu, K, Na) were obtained by performing batch adsorption studies. Solutions of 100 mg/L concentration were used. The amount of adsorbed metal (qe) per unit absorbent mass or sorption coefficient expressed as mg/g was calculated as follows: qe
(C0 Ce )V m
(1)
where Co is the initial heavy metal concentration, Ce is the concentration of heavy metal at equilibrium (mg/L), m is the soil mass (mg) and V is the solution volume (L). Calculations were made by using these data and adsorption curves were obtained. Langmuir isotherm Langmuir isotherm can be defined according to the following formula qe
Vm kCe 1 kCe
(2)
where qe is the amount of adsorbed heavy metal per unit clay mass (mg/g), Vm is the monolayer capacity in mg/g, k is the equilibrium constant and Ce is the equilibrium concentration of the solution (mg/L). Eq. (2) can be written in the following linear form Ce 1 C e qe kVm Vm
(3)
The results obtained from the experimental studies were applied to Langmuir isotherm. Freundlich isotherm The Freundlich isotherm model is considered to be appropriate for describing both multilayer sorption and sorption on heterogeneous surfaces. This isotherm can be explained by the following equation: qe K f Ce
1
(4)
n
where Kf is the Freundlich constant (mg/g) and 1/n is the adsorption intensity The linear form of Eq. (4) can be written as 1 log qe log K f log Ce n
(5)
Confirmatory tests using SEM and EDS Scattering electron microscopy (SEM) characterization tests were performed for thorough understanding of soil mineral structure. Preparation of Samples for SEM Analysis. An L/S ratio of 20 was maintained and samples of mixtures spiked with contaminants were taken and subjected to batch adsorption tests according to ASTM D 4646 –
- 34 -
Journal of Water and Environment Technology, Vol. 8, No.1, 2010
87(reapproved 2001). The extract was filtered through Whatman no. 45 filter paper to separate soil from liquid. The filter paper was rinsed with distilled water and the resulting soil mixture was transferred into a porcelain dish, covered to avoid contamination and allowed to dry naturally. The dried soil extract was subjected to SEM and EDS analyses. (Young and Young, 2003). Preparation of moulds for SEM and EDS. The specimen is mounted on a metal stub on top of which is a double-sided carbon tape used to place the sample. Later this stub was placed in the coating machine for the metal coating process. For an electrically conductive specimen, observation of the specimen without metal coating is the best method. For a non-conductive specimen, however, metal coating is usually applied to give the specimen electrical conductivity. This decreases the specimen’s capacity to acquire an electrostatic charge and increases the yield of secondary electrons. The important thing to remember when applying a metal coating is that the coat of metal film must be as thin as possible (in terms of microns) so that the specimen surface morphology is not completely covered by coating. The resultant images reveal remarkable structural resolution down to a few nanometers with great accuracy because the film provides a continuous coating over all the sample contours. In our case, platinum was used with a coating time of 120 seconds and vacuum less than 5 Pa, as soil is a non-magnetic material. The mould or stub was kept in the vacuum chamber and SEM imaging and EDS were carried out. SEM and EDS were taken through JEOL -JSM 6360A, the model with a magnification capacity of X500, X1000, and X2000 and accelerating voltage of 20 kV with working distance (WD) of 10 mm and a spot size of 58. First area of image was chosen and focused then through software EDS analysis, the same thing was done on the same image by either selecting spot analysis, line analysis or area analysis. In our case, area analysis was done and after the x-ray scan was completed, the EDS result was also obtained simultaneously, both qualitatively and quantitatively. RESULTS AND DISCUSSION Sorption at different dilution ratios. Figures 3, 4, 5, 6 and 7 were plotted with the concentration on the x-axis and sorption coefficient on the y-axis. Sorption coefficient can be defined in general as the ratio of the amount of metal sorbed to a gram of soil. The results are presented in millimoles to normalize the effect of atomic weight of ions. It can be observed that as the concentration of the metal ion considered decreases, sorption capacity increases, and is probably due to less competition for sorption at lower concentration. In other words for a high L/S ratio the adsorption efficiency is lowered which is in confirmation with the work of (Young and Young, 2003). At lower initial concentration sufficient adsorption sites are available for sorption of metal ions. Conversely the number of metal ions at higher concentrations is relatively more compared to the available adsorption sites. The difference in the removal capacity is a result of the difference in their chemical affinities and ion exchange capacities with respect to the chemical functional group on the surface of the adsorbent. In this case the availability of free adsorption sites dominates. (Fatiha et al., 2009).
- 35 -
Journal of Water and Environment Technology, Vol. 8, No.1, 2010
Adsorption isotherms Empirical adsorption models like Langmuir and Freundlich were applied for the experimental data and both were found to vary linearly. Langmuir isotherm illustrates the single coating layer on adsorption surface. This model predicts that adsorption takes place at a specific adsorption surface. The attraction between molecules decreases as the molecules move away from the adsorption surface. The adsorption capacities were calculated as shown in Table 2. The adsorption capacity of copper was found to be better with 3 % cement content. Copper is retained in soils through exchange and specific adsorption mechanisms
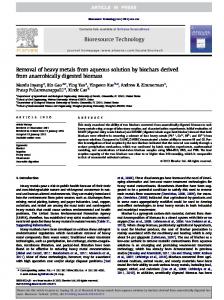
Fig.2 - Typical plot of Langmuir isotherm for red soil + 3% cement for chromium.
Fig. 3 - Sorption behaviour of copper for different mixtures
- 36 -
Journal of Water and Environment Technology, Vol. 8, No.1, 2010
Fig. 4 - Sorption behaviour of zinc for different mixtures
Fig. 5 - Sorption behaviour of chromium VI for different mixtures
Fig. 6 - Sorption behaviour of sodium for different mixtures
- 37 -
Journal of Water and Environment Technology, Vol. 8, No.1, 2010
Fig. 7 - Sorption behaviour of potassium for different mixtures. It has been suggested that a clay mineral exchange phase may serve as a sink for Cu in non-calcareous soils. (McBride and Bouldin, 1984). For zinc with 3 % and 6 % lime content, the adsorption capacity was increasing, in soil-lime system the pH of the system increases immediately. Due to this, there is a possibility of formation of ZnOH+ species and also to some extent, precipitation of zinc onto the surface of the soil. The ZnOH+ species get adsorbed onto the soil surface along with zinc ions, in addition to zinc retention through ion exchange and adsorption mechanism. This leads to an increase in the total capacity of soil to retain more amount of zinc. (Kurdi and Doner, 1983) The pH at the surface of the particle is 0.5 to 1 unit higher than the ambient pH. Hence the precipitation of the metal ions can still occur onto the surfaces of the material at pH values 0.5 to 1.0 unit lower than the pH at which solution precipitation occurs. It is observed that Zn adsorption increases with pH in soil-lime system and reaches equilibrium condition. There is a possibility of formation of ZnOH+ and the hydrolysed species are strongly adsorbed to soil surfaces. Hence, precipitation is not a major mechanism of retention of zinc in soils because of the relatively high solubility of zinc compounds. Since red soil is already acidic in nature (pH = 4), the concentration of H+ is higher and these H+ are competing with zinc ions for the available exchangeable as well as adsorption sites leading to low retention of zinc ions at low pH conditions. Cr6+ also exhibited good adsorption with soil fly ash mixture. Adsorption and precipitation behaviour of Cr6+ in soils is controlled by a variety of factors like redox potential, oxidation state, pH, soil minerals, competing ions and complexing agents (Bradl, 2004). The adsorption capacity depended significantly on the type of metal species added. The adsorption rankings derived from Table 4 are Cu>Zn>Cr (Tanit, et al. , 2009). The adsorption capacity of sodium and potassium was better with 3% cement content. Highly charged cations tend to be held more tightly than cations with less charge and secondly cations with a small hydrated radius are bound more tightly and are less likely
- 38 -
Journal of Water and Environment Technology, Vol. 8, No.1, 2010
to be removed from the exchange complex. The combined influence of these can be summarized by the lysotropic series Al3+ > Ca2+ > Mg2+ > K+ > Na+ > H+. The adsorption rankings for sodium and potassium were K>Na, which confirms with earlier work (Mohammed et al., 2009) Freundlich isotherm The Freundlich parameters shown in Table 2 and 3 represent the batch test results with metal retention as a function of the initial metal concentration. This is used to illustrate adsorption on heterogeneous surfaces and multilayer sorption. The Freundlich isotherm is linear if 1/n = 1 and as 1/n decreases the isotherm becomes non-linear. The variation was linear for both Langmuir and Freundlich (Fig. 8). The correlation coefficient varies between 0.9058 to 0.9884 for Langmuir and between 0.9096 to 1 for Freundlich, which suggests that both isotherm models fit very well (Sevil and Bilge, 2007). The higher values of Kf and 1/n indicate that greater metal uptake is occurring, however, it did not occur in our case. The concentration of adsorbed metal was calculated and it was found that there is a match between Langmuir’s adsorption capacity and experimental data which proves that Freundlich isotherm does not hold true for these mixtures (Coles and Yong, 2006). Langmuir’s adsorption capacity and experimental data gave consistent results which suggest that Langmuir model is suitable for these mixtures.
Fig.8 - Typical Freundlich isotherm of RD + fly ash (1:1) for sodium. pH-dependent sorption Soil pH is the most important parameter influencing metal–solution and soil–surface chemistry. The number of negatively charged surface sites increases with pH. In general, metal adsorption is small at low pH values. Adsorption then increases at intermediate pH from near zero to near complete adsorption over a relatively small pH range. This pH range is referred to as the pH adsorption edge. At high pH values, the metal ions are completely adsorbed. The pH is a primary variable which determines cation and anion adsorption onto oxide minerals (Bradl, 2004).
- 39 -
Journal of Water and Environment Technology, Vol. 8, No.1, 2010
In order to investigate the effect of pH on adsorption to different mixtures, metal solutions of 100ppm and an L/S ratio of 20 was used at pH ranging from 4 to 12. Batch adsorption tests were done according to ASTM D 4646 – 87 (reapproved 2001). The highest removal efficiency was obtained at pH range of 6 to 8. At lower pH, the adsorption efficiency decreased. The effect of pH changed due to the type of adsorbent used and its behaviour in solution and the type of ions adsorbed. From Figs. 9, 10, 11, 12 and 13, it can be observed that as the pH increases, adsorption efficiency also increases particularly near neutral pH. For copper, the probable reason might be that alkaline mixtures specific adsorption of copper onto CaCO3 is likely to take place in waste-soil systems and precipitation may be an important mechanism of retention (McBridge and Bouldin, 1984). For zinc (Fig. 10), it can be observed that at pH of 4 adsorption increased, and adsorption efficiency continued increasing until pH 12. This is probably because in soil-lime system pH increases immediately. Due to this there is a possibility of formation of ZnOH+ species and also to some extent precipitation of zinc onto the surface of the soil. The ZnOH + species get adsorbed onto the soil surface along with zinc ions, in addition to zinc retention through ion exchange and adsorption mechanism. This leads to an increase in the total capacity of soil to retain more amount of zinc. (Kurdi, and Doner, 1983).
- 40 -
Journal of Water and Environment Technology, Vol. 8, No.1, 2010
Table 2 - Isotherm parameters of heavy metals in different adsorbents. Sl no
Metals
Adsorbent
Langmuir Isotherm
Vm mg/g, Monolayer adsorption capacity
1
2
3
Copper
Zinc
Chromium
Freundlich Isotherm
R2
K
Kf
in mg/g
n adsorption intensity
Concentration of adsorbed Metal in mg/g (qe = Kf.Ce 1/n )
R2
Red Soil
28.34
0.07
0.9535
2.1031
10.51
3.2588
0.9248
Red Soil + 3% Lime
81.83
0.12
0.9058
2.0911
5.672
4.71
0.9144
Red Soil + 6 % Lime
85.63
0.15
0.9243
2.7216
4.823
7.07
0.9103
Red Soil + 1% Cement Red Soil + 3% Cement Red Soil + Fly Ash (1:1)
49.4
0.11
0.9076
2.1396
8.665
3.64
0.9124
86.02
0.06
0.9047
2.0631
7.74
3.74
0.948
85.8
0.08
0.9138
2.0763
10.194
3.262
0.9096
Red Soil
41.83
1.23
0.9568
2.1349
4.25
6.31
0.9179
Red Soil + 3% Lime
100.68
0.14
0.9632
2.0973
4.74
5.54
0.9104
Red Soil + 6 % Lime
113.748
0.09
0.913
2.0854
6.06
4.458
0.9382
Red Soil + 1% Cement Red Soil + 3% Cement Red Soil + Fly Ash (1:1)
68.994
0.1
0.9458
2.155
6.188
4.535
0.913
81.02
0.11
0.9606
2.0873
7.41
3.885
0.9797
86.7
0.14
0.9286
2.1923
5.08
5.427
0.9436
Red Soil
27.96
1.81
0.9884
2.5838
12.376
3.748
0.937
Red Soil + 3% Lime
23.59
0.43
0.9487
2.2007
10.245
3.45
0.9858
Red Soil + 6 % Lime
15.24
0.16
0.9884
2.2007
10.245
3.45
0.9858
Red Soil + 1% Cement Red Soil + 3% Cement Red Soil + Fly Ash (1:1)
19.49
0.14
0.9337
2.0248
16
2.7
0.9442
14.38
0.16
0.9302
2.8765
6.269
5.99
1
71.68
0.16
0.9884
2.6947
12.755
3.86
0.9006
- 41 -
Journal of Water and Environment Technology, Vol. 8, No.1, 2010
Table 3 - Isotherm parameters of alkali metals in different adsorbents. Sl no
Metals
Adsorbent
Langmuir Isotherm
Vm mg/g, Monolayer adsorption capacity
1
2
Sodium
Potassium
Freundlich Isotherm
R2
K
Kf mg/g
,
in
n adsorption intensity
Concentration of adsorbed Metal in mg/g (qe = Kf.Ce 1/n )
R2
Red Soil
43.34
0.12
0.9829
2.3062
2.63
13.285
0.9914
Red Soil + 3% Lime
35.05
0.32
0.9305
1.721
1.32
39.62
0.9732
Red Soil + 6 % Lime
30.76
0.33
0.9831
2.3289
9.07
3.869
0.938
Red Soil + 1% Cement Red Soil + 3% Cement Red Soil + Fly Ash (1:1)
50.32
0.2
0.98
2.275
2.44
15.02
0.9245
66.37
0.5
0.927
2.1546
3.16
9.25
0.9259
35.99
0.13
0.9661
2.3268
6.02
5
0.987
Red Soil
50.54
0.43
0.9709
2.3407
2.7
12.885
0.982
Red Soil + 3% Lime
40.45
0.29
0.8233
2.3381
3.69
12.871
0.9791
Red Soil + 6 % Lime
33.53
0.44
0.9031
2.298
3.83
7.65
0.9941
Red Soil + 1% Cement Red Soil + 3% Cement Red Soil + Fly Ash (1:1)
67.37
0.67
0.9021
2.1949
2.06
20.53
0.9113
77.39
0.43
0.9126
2.0929
2.05
19.786
0.9361
45.61
0.54
0.9478
2.2983
2.75
12.265
0.943
- 42 -
Journal of Water and Environment Technology, Vol. 8, No.1, 2010
Table 4 - Comparative metal adsorption capacities. Sl No 1. 2. 3. 4. 4. 5. 6. 7. 8. 9
Adsorption Cu Adsorption Capacity
Ranking RD3C>5RD5FA>RD6L>RD3L> RD1C>RD. Zn Adsorption Capacity RD6L>RD3L>5RD5FA>RD3C>RD1C>RD. Cr Adsorption Capacity 5RD5FA>RD>RD1C>RD3L>RD6L>RD3C. Na Adsorption Capacity RD3C>RD1C>RD>5RD5FA>RD3L>RD6L. K Adsorption Capacity RD3C>RD1C>RD>5RD5FA>RD3L>RD6L. Adsorption onto Red Soil Zn>Cu>Cr, K>Na Adsorption onto Red Soil Zn> Cu>Cr, K>Na + 3% Lime Adsorption onto Red Soil Zn> Cu>Cr, K>Na + 6% Lime Adsorption onto Red Soil Zn>Cu>Cr, K>Na + 1% Cement Adsorption onto Red Soil Zn> Cu>Cr, K>Na + 3% Cement Adsorption onto Red Zn> Cu>Cr, K>Na Soil + 50 % Fly Ash
Abbrevations :- RD - red soil, RD3L- red soil + 3% lime, RD6L - red soil + 6% lime, RD1C – red soil + 1% cement, RD3C – red soil + 3% cement, 5RD5FA - 50% red soil + 50% fly ash. In a soil fly ash system the adsorption was good, and this is probably because Cr6+ gets chemically included in cementitious compounds of fly ash (Dermatas and Meng, 2003). Also, there are a lot of activities taking place continuously in the form of redox reactions. Under certain conditions, Cr6+ gets converted into a stable Cr3+ but it gets reconverted to Cr6+, hence it becomes difficult to stabilize Cr6+. Chromium exists in two possible oxidation states in soils: the trivalent chromium, Cr (III) and the hexavalent chromium, Cr (VI). Forms of Cr (VI) in soils are as chromate ion, HCrO4- predominant at pH10mM) and at pH 2-6. The dichromate ions pose a greater health hazard than chromate ions. Both Cr (VI) ions are more toxic than Cr(III) ions. Because of the anionic nature of Cr (VI), its association with soil surfaces is limited to positively charged exchange sites, the number of which decreases with increasing soil pH. Iron and aluminum oxide surfaces will adsorb CrO42- at acidic and neutral pH. It was concluded that the adsorption of Cr(VI) by ground water alluvium was due to iron oxides and hydroxides coating the alluvial particles. The adsorbed Cr(VI) was, however, easily desorbed with the input of uncontaminated ground water, indicating nonspecific adsorption of Cr(VI). The presence of chloride and nitrate had little effect on Cr(VI) adsorption, whereas sulfate and phosphate inhibited adsorption. It has been found that SO42- and dissolved inorganic carbon inhibited Cr(VI) adsorption by amorphous iron oxyhydroxide and subsurface soils (Grove and Ellis, 1980). The presence of sulfate, however, enhanced Cr(VI) adsorption to kaolinite and BaCrO4 may form in soils at chromium contaminated waste sites. No other precipitates
- 43 -
Journal of Water and Environment Technology, Vol. 8, No.1, 2010
of hexavalent compounds of chromium have been observed in a pH range of 1 to 9. Hexavalent chromium is highly mobile in soils. In a study of the relative mobilities of 11 different trace metals for a wide range of soils, it was found that clay soil, containing free iron and manganese oxides, significantly retarded Cr (VI) migration. Hexavalent chromium was found to be the only metal studied that was highly mobile in alkaline soils. The parameters that correlated with Cr(VI) immobilization in the soils were free iron oxides, total manganese, and soil pH, whereas the soil properties, cation exchange capacity, surface area, and percent clay had no significant influence on Cr(VI) mobility. It has been reported that Cr(III) forms hydroxyl complexes in natural water, including Cr(OH)2+, Cr(OH)2+,Cr(OH)30 and Cr(OH)4-. Trivalent chromium is readily adsorbed by soils. In a study of the relative mobility of metals in soils at pH 5, Cr(III) was found to be the least mobile. Hydroxyl species of Cr (III) precipitate at pH 4.5 and complete precipitation of the hydroxyl species occurs at pH 5.5. Hexavalent chromium can be reduced to Cr (III) under normal soil pH and redox conditions. Soil organic matter has been identified as the electron donor in this reaction .The reduction reaction in the presence of organic matter proceeds at a slow rate at ambient pH and temperatures. It has been reported that in natural soils the reduction reaction may be extremely slow, requiring years. The rate of this reduction reaction, however, increases with decreasing soil pH. Soil organic matter is probably the principal reducing agent in surface soils. In subsurface soils, where organic matter occurs in low concentration, Fe(II) containing minerals reduce Cr(VI). However, it was observed that this reaction only occurred in the subsurface soil with a pH