Membrane Water Treatment, Vol. 7, No. 1 (2016) 23-38
23
DOI: http://dx.doi.org/10.12989/mwt.2016.7.1.023
Adsorption of methyl orange from aqueous solution on anion exchange membranes: Adsorption kinetics and equilibrium Muhammad Imran Khan, Liang Wu, Abhishek N. Mondal, Zilu Yao, Liang Ge and Tongwen Xu** CAS Key Laboratory of Soft Matter Chemistry, Lab of Functional Membranes, School of Chemistry and Material Science, University of Science and Technology of China, Hefei, Anhui 230026, P.R. China
(Received May 01, 2015, Revised May 31, 2015, Accepted November 18, 2015) Abstract. Batch adsorption of methyl orange (MO) from aqueous solution using three kinds of anion
exchange membranes BI, BIII and DF-120B having different ion exchange capacities (IECs) and water uptakes (WR) was investigated at room temperature. The FTIR spectra of anion exchange membranes was analysed before and after the adsorption of MO dye to investigate the intractions between dye molecules and anion exchange membranes. The effect of various parameters such as contact time, initial dye concentration and molarity of NaCl on the adsorption capacity was studied. The adsorption capacity found to be increased with contact time and initial dye concentration but decreased with ionic strength. The adsorption of MO on BI, BIII and DF-120B followed pseudo-first-order kinetics and the nonlinear forms of Freundlich and Langmuir were used to predict the isotherm parameters. This study demonstrates that anion exchange membranes could be used as useful adsorbents for removal of MO dye from wastewater. Keywords: adsorption; anion exchange membrane; methyl orange; langmuir isotherm; freundlich isotherm
1. Introduction Different types of dyestuffs come in the effluents of wastewater from many industries such as plastic, leather, dyestuff, pulp mills, food, and textile. These dyes are stable in nature and resistant to biodegradation due to its complex aromatic molecular structure (El Qada et al. 2008, Han et al. 2008). In order to overcome the health problems and to protect the environment, it is really necessary to treat these waste effluents in a proper way. Therefore, many technologies such as coagulants photocatalysis, ultrafiltration, biological treatment, electrochemical, oxidizing agents and adsorption have been used to treat with this environmental problem (Borrios et al. 2012). Among them, adsorption is considered to be the most simple and effective method than others (Theydon and Ahmed 2012). Various solid materials such as alginate, activated carbon, chitosan and modified chitosan functionalize polymeric resines and ion exchange membranes have been examined as adsorbents. Resins and membranes are known to be the most important adsorbents (Adriá-Cerezo et al. 2000, Leinonen and Lehto 2000). The cost and adsorption capacity of these Corresponding author, Professor, E-mail:
[email protected] **Corresponding author, Professor, E-mail:
[email protected] Copyright © 2016 Techno-Press, Ltd. http://www.techno-press.org/?journal=mwt&subpage=5
ISSN: 2005-8624 (Print), 2092-7037 (Online)
24
Muhammad Imran Khan, Liang Wu, Abhishek N. Mondal, Zilu Yao, Liang Ge and Tongwen Xu
adsorbents changes from one adsorbent to other. Due to their unique chemical properties, enormous amount of applied reactive dyes usually end up in wastewaters and this has prompted us to find the requirment for sufficient treatment technologies. Modern work has probed utilizing adsorption/ion exchange to water contaminated with a broad range of reactive dyes. For example, Karcher et al. (2001) tested many commercial adsorbents (zeolites, polystyrene resins, ion exchangers and granulated ferric hydroxide) for reactive dye removal and found that anion exchange resins were the most effective adsorbents. A follow-up study by the same authors provided useful information for the successes of packed-bed operation, including the aspect of resin regeneration (Karcher et al. 2002). However, most commercial ion exchangers are in the form of porous particles and their packed-bed operation for flow process normally have some drawbacks such as high pressure drop, flow channeling, slow pore diffusion, low accessible flow rate etc. Ion exchange membrane is an excellent alternative for removing the above difficulties. It could not only defeat the mass transfer problems for packedbeds but also show the characteristics of easier scale-up design (either staking more membranes together or using a larger membrane area). Therefore, ion exchange membrane should be an excellent selection for dyes adsorption and the related achievement should be effectively checked. However, the use of ion exchange membranes to dye removal from wastewater has been neglected from long time. The main goal of this work is to investigate the adsorption properties of anionic dye methyl orange (MO) by employing three different kinds of commercial anion exchange membranes BI, BIII and DF-120B with different water uptake and ion exchange capacity (IECs) as adsorbents. The effects of various parameters namely contact time, initial dye concentration and ionic strength on the adsorption of MO from aqueous solution have been studied. The adsorption kinetics and isotherms also analyzed to understand the mechanism of adsorption onto anion exchange membranes BI, BIII and DF-120B. 2. Experimental material and method 2.1 Materials 2.1.1 Adsorbent The commercial anion exchange membranes BI and BIII were provided by Chemjoy Membrane Co. Ltd, Hefei, Anhui, China and commercial anion exchange membrane DF-120B was provided by Tianwei Membrane Com. Ltd, Shandong, China. These membranes were used as adsorbents for anionic dye methyl orange (MO). The ion exchange capacties of anion exchange membranes BI, BIII and DF-120 are found to be 0.55 mmol/g, 0.26 mmol/g and 0.83 mmol/g respectively. Similarly, the water uptakes of membranes BI, BIII and DF-120 are determined to be 42.7%, 37.3% and 74.2%, respectively. The polymer backbone of BI and BIII are blends of quaternized poly(2,6-dimethyl-1,4-phenylene oxide) (QPPO) and polyvinyl alcohol (PVA) with
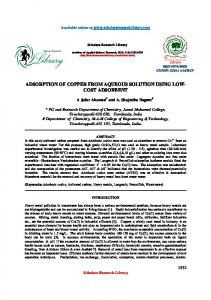
Fig. 1 Molecular structure of methyl orange (MO) dye
Adsorption of methyl orange from aqueous solution on anion exchange membranes...
25
weight ratio of 5:5 and 3:7, respectively. Commercial DF-120B membrane is based on QPPO and has been widely used in China for recovery of acids by diffusion dialysis. All the three membranes were reinforced by woven polyester fibers. Before the experiments, all the membranes were treated alternatively with 1 M HCl and 1 M NaOH to remove the impurities. 2.1.2 Adsorbate The commercial anionic dye known as methyl orange (MO) (C.I. 13025, MF: C14H14N3NaO3S, 327.34 g mol-1, λ maximum 464 nm) was obtained from Fluka chemicals and used as adsorbent. Its solubility is 0.5 g/100 mL. The stock solution of 1000 mg/L was prepared by dissolving 1.0 g of accurately weighed MO in 1 litre of double distilled water and required concentrations were obtained by further dilution of stock solution. All the chemicals used in the experiments were of analytical reagent grade. The dye structure is shown in Fig. 1. 2.2 Adsorption Batch adsorption experiments were carried out by immersing anion exchange membranes BI, BIII and DF-120B into the measured volume of MO dye aqueous solution with a shaking speed of 75 rpm at room temperature. The concentration of methyl orange (MO) was measured by UV/VIS spectrophotometer (UV-2550, SHIMADZU) and related caliberation curve was obtained. The wavelength of 464 nm was set for methyl orange. The amount of MO adsorbed onto the anion exchange membrane at time ―t‖, qt (mg/g) was measured by the following relation qt
Co Ct V W
(1)
where Co and Ct are the concentration of MO at initial state and at time t, respectively. Similarly V and W are volume of MO aqueous solution and weight of an anion exchange membrane respectively. 2.3 FTIR spectra analysis FTIR spectra of dried membranes were recorded by using the technique attenuated total reflectance (ATR) with FTIR spectrometer (Vector 22, Bruker) having resolution of 2 cm-1 and a total spectral range of 4000-400 cm-1.
3. Results and discussion 3.1 FTIR spectra analysis Transform Infrared Spectrometry (FTIR) is a powerful tool for identifying types of functional groups of adsorbents that are responsible for entrapping the molecules of dye. Fig. 2 shows the FTIR spectra of anion exchange membranes before and after adsorption MO dye. The IR spectra of these membranes shows number of peaks, indicating the structure of these anion exchange membranes. The adsorption of MO on anion exchange membranes is confirmed by FTIR spectroscopy which shows characteristics band of dye adsorption onto anion exchange membranes.
26
Muhammad Imran Khan, Liang Wu, Abhishek N. Mondal, Zilu Yao, Liang Ge and Tongwen Xu
Fig. 2 FTIR spectra of anion exchange membranes before and after MO adsorption
Before adsorption of dye, the peak observed in the range of 2800-3000 cm-1 for these anion exchange membranes corresponds to –CH3 stretching from the PPO back bone. The bands in the range of 1446 cm-1 are because of stretching of –CH groups (V and δ) (Wu et al. 2010). The band in region of 1600-1620 cm-1 is due to stretching vibration of C-N group (Li et al. 2006, Lin et al. 2012). The broad peaks in the range of 3050-3600 cm-1 is due to the presence of –OH groups in the membranes. The adsorption peaks of symmetrical and asymmetrical stretching vibration of CO are at 1200 cm-1 and 1306 cm-1 and those of phenyl group at 1470 cm-1 and 1600 cm-1 respectively. After adsorption, some changes are observed in the spectra as a result of the interactions between the MO dye and the anion exchange membranes. The band at 1600 cm-1 showed C-N stretching that appeared at lower frequencies in comparison with the position before the sorption process at 1620 cm-1 (Haddadain et al. 2013). Further, the peak intensity of C-N at 1600 cm-1 is increased after the adsorption of MO dyes over anion exchange membranes (Haddadain et al. 2013). The band in the range of 1350 cm-1 is due to the stretching of –S = O group indicating successful adsorption of MO dye on the membrane surface. Moreover, the weak band at 1037 cm -1 corresponds to the –N = N− stretching vibration (Marcal et al. 2011). This all discussion proves the successful adsorption of MO onto anion exchange membranes. 3.2 Effect of contact time The effect of contact time on the adsorption capacity (qt) of MO dye from aqueous solution was investigated at room temperature keeping the concentration of MO dye (50 mg/L) and mass of adsorbent (0.1 g) constant. The results are shown in Fig. 3. As represented in the Fig. 3 that the adsorption capacity of MO on AEMs increases with the contact time. After 24 hours the maximum adsorption of MO dye on the surface of three anion exchange membranes (AEMs) were attained and after this stage the dye adsorption became almost constant. This observation reveals that the equilibrium contact time required for MO dye adsorption on three AEMs (BI, BIII and DF-120B) was 24 hours at room temperature and this time was used to obtain relieble and consistent experimental results. The adsorption of MO dye found to be fast enough in the initial stage of
Adsorption of methyl orange from aqueous solution on anion exchange membranes...
27
Fig. 3 Effect of contact time on MO adsorption onto anion exchange membrane BI, BIII and DF-120B, Initial dye concentration = 50 mg/L; Ionic strength = nil
Fig. 4 Effect of initial dye concentration on MO adsorption onto anion exchange membranes BI, BIII and DF-120B, Contact time = 24 h; Ionic strength = nil
reaction because at the start of the sorption all the reaction sites were empty and therefore the percentage of dye removal increased quickly. With the passage of time, most of the reaction sites of the AEM were covered by dye molecules and due to the repulsive forces between bulk phase and the solute molecules in solid, the remaining reaction sites became unavailable. At this stage, the dye molecules were transported into the internal sites of the adsorbent through pore diffusion, which required longer time and is shown in the linear portion of figure (Luo et al. 2010). IEC and WU are also the important parameters of membranes and have a close relation with adsorption capacity. The IEC of anion exchange membrane BI is 0.55 mmol/g while it is observed as 0.26 mmol/g for BIII. The proportion of QPPO and PVA in BI and BIII is 5:5 (w/w) and 3:7 (w/w) respectively. From this it can be concluded that membrane with higher proportion of QPPO shows higher ion exchange capacity (IEC) than the membrane with less proportion of QPPO. Therefore, the adsorption capacity (qe) of anion exchange membrane BI is higher than BIII. Similarly, the commercial DF-120B membrane is also based on QPPO but its water uptake (WR) is much higher
28
Muhammad Imran Khan, Liang Wu, Abhishek N. Mondal, Zilu Yao, Liang Ge and Tongwen Xu
than both BI and BIII. This higher water uptake is responsible for lower adsorption capacity of DF-120B membrane. Even though MO is water soluble, it is well reported that adsorbate with relative large molecular weight easily adsorb onto material with low hydrophilicity due to the hydrophobical interaction (Xu et al. 2003). So our observation coincides with the physiochemical properties of the membranes. 3.3 Effect of initial dye concentration The initial dye concentration has a particular effect on the adsorption capacity.The effect of initial dye concentration on adsorption capacity of MO dye on all three anion exchange membranes was investigated using the adsorbent dose of 0.1 g and contact time of 24 hours at room temperature and results are shown in Fig. 4. It gives useful driving forces to overcome the resistance of mass transfer from aqueous phase to the solid phase. The increase in dye concentration also increases the interaction between dye and adsorbent. It is shown in Fig. 4 that the adsorption capacity (qe) of MO dye on anion exchange membrane BI, BIII and DF-120B increases with the same proportion as the initial dye concentration increases. This behaviour is due to the concentration gradient between MO dye solution and AEMs surface and mass transfer driving forces are higher at high MO concentration (Luo et al. 2010, Roy et al. 2012). Membrane properties such as ion exchange capacity (IEC) and water uptake (WR) have also affected the adsorption capacity (qe) of dyes. With higher ion exchange capacity for BI which decreases from BI to BIII, we can assume that QPPO content in the membrane matrix gradually decreases and hence the functional group responsible for adsorption process decreases. The results verify that as the adsorption capacity increases with increase in concentration from BIII to BI. On the other, the adsorption capacity of commercial DF-120B membrane with higher water uptake also increases with initial dye concentration. 3.4 Effect of ionic strength Mostly the wastewater contains different type of dyes and salts. The adsorption was found to be strongly influenced by the concentration and nature of ionic species (Alkan and Doğan 2001). The influence of ionic strength on the adsorption capacity of MO dye from aqueous solution were studied at room temperature and results are shown in Fig. 5. It can be observed that adsorption capacity of MO dye from aqueous solution was decreased with increasing the ionic strength for all three membranes. As the concentration of NaCl increases from 0.2 M to 1.5 M, the adsorption capacity of MO dye decreases from 19.95 mg/g to 17.83 mg/g, 19.85 mg/g to 14.58 mg/g and 19.90 mg/g to 16.55 mg/g for anion exchange membranes BI, BIII and DF-120B respectively. The negative effect of ionic strength on the adsorption capacity is due to competition between the MO anions and Cl- for the active sorption sites (Gong et al. 2005). 3.5 Adsorption kinetics The adsorption kinetics is significant factor to determine the rate at which the adsorbate is removed from the solution (Dąbrowski 2001). The experimental results obtained for adsoprtion of anionic dye methyl orange on all the three anion exchange membranes at room temperature were used for kinetic studies. Here, four kinetic models namely pseudo-first-order model, pseudosecond-order model (Otero et al. 2003), liquid film diffusion model (Oladoja and Akinlabi 2009),
Adsorption of methyl orange from aqueous solution on anion exchange membranes...
29
Fig. 5 Effect of ionic strength on MO adsorption onto anion exchange BI, BIII and DF-120B, Initial dye concentration = 50 mg/L; Contact time 24 h
Fig. 6 Pseudo-first order plot for MO adsorption onto anion exchange membranes BI, BIII and DF-120B
and Elovich model (Shek et al. 2009, Dizge et al. 2009) were employed to explain the kinetics of the adsorption. These models are described as Pseudo-first-order kinetic model log(qe qt ) log qe K1t
(2)
Pseudo-second-order kinetic model t 1 t 2 qt K 2 q e q e
(3)
Liquid film diffusion model ln(1
qt ) k fd t qe
(4)
30
Muhammad Imran Khan, Liang Wu, Abhishek N. Mondal, Zilu Yao, Liang Ge and Tongwen Xu
Elovich model qt
1
. ln( . )
1
. ln(t )
(5)
where qt (mg/g) and qe (mg/g) are the amount of dye adsorbed on the membrane at time t and at
Fig. 7 Pseudo-second order plot for MO adsorption onto anion exchange membranes BI, BIII and DF-120B
Table 1 Kinetic parameters for adsorption of MO onto anion exchange membranes BI, BIII and DF-120B Systems
BI
BIII
DF-120B
qe (mg/g)
19.95
19.85
19.90
Pseudo-first-order model qe (mg/g) -3
k1 (10 /min) R2
12.99 2.03 0.931
14.73 2.02 0.968
15.53 1.62 0.946
Pseudo-second-order model qe (mg/g) -4
k2 (10 g/mg.min) R2
21.57 4.85 0.996
21.34 4.94 0.997
22.03 3.25 0.993
Liquid film diffusion model -3
Kfd (10 ) Cfd R2
4.67 -0.426 0.931
4.66 -0.298 0.968
3.72 -0.248 0.946
0.63 0.63 0.915
0.39 0.39 0.938
Elovich model α (mg/g.min) β (g/mg) R2
0.58 0.58 0.877
Adsorption of methyl orange from aqueous solution on anion exchange membranes...
31
equilibrium respectively, K1 (/d) is the pseudo-first-order rate constant, K2 (g/mg.d) is the pseudosecond-order rate constant, Kfd (/h) is the liquid film diffusion rate constant, α is the initial adsorption rate (mg/g.min), β is the desorption constant related to the extent of surface coverage and the activation energy for the chemisorption. All the constants calculated for different anion exchange membranes for these models are given in Table 1. The plot of time vs log(qe–qt) is shown in Fig. 6. The correlation coefficient (R2) values obtained for anion exchange membranes BI, BII and DF-120B were found to be 0.931, 0.968, and 0.946 respectively at room temperature. It shows that the adsorption of MO dye on anion exchange membranes did not follow pseudo-firstorder kinetic model. Additionally, it can be observed from the Table 1 that the correlation coefficient values (R2) for pseudo-second-order reaction are greater than 0.99 for all the membranes at room temperature. Moreover, there is a good agreement between calculated adsorption capacity (qe,cal) and experimental adsorption capacity (qe,exp) for adsorption of MO dye on all these anion exchange membranes. It is represented in Fig. 7. The values of qe and K2 are
Fig. 8 Liquid film diffusion model plot for MO adsorption onto anion exchange membranes BI, BIII and DF-120B
Fig. 9 Elovich model plot for MO adsorption onto anion exchange membranes BI, BIII and DF-120B
32
Muhammad Imran Khan, Liang Wu, Abhishek N. Mondal, Zilu Yao, Liang Ge and Tongwen Xu 180
qe (mg/g)
150 120 90
'Expt.' Freundlich Langmuir
60 30
0
100
200 Ce (mg/L)
300
400
Fig. 10 Freunlich and Langmuir adsorption isotherms of MO onto anion exchange membrane BI by nonlinear method 160
140 qe (mg/g)
120
100 80 60
'Expt.' Freundlich Langmuir
40 20 0
100
200
300 Ce (mg/L)
400
500
Fig. 11 Freunlich and Langmuir adsorption isotherms of MO onto anion exchange membrane BIII by nonlinear method
calculated from slope and intercept of Fig. 7 and are given in the Table 1. These evidences indicate that adsorption of MO dye on anion exchange membranes followed pseudo-second-order kinetics. Similar kinetics was observed in the adsorption of dye on to LDH-based adsorbents (BenselkaHadj Abdelkader et al. 2011). The experimental data obtained for adsorption of MO dye on anion exchange membranes is also subjected to liquid film diffusion model at room temperature. The plot of ln(1 − qt/qe) vs time for all the anion exchange membranes is shown in Fig. 8. The correlation coefficient values (R2) for adsorption of MO on anion exchange membranes BI, BIII and DF-120B are 0.931, 0.968 and 0.946 repectively which are also lower than those of pseudo-second-order model as shown in Table 1. 3.6 Adsorption equilibrium Adsorption isotherms give useful knowledge on the adsoprtion capacity of the adsorbents and the type of adsorbent-adsorbate intraction. The adsorption isotherms are plotted between the quantity of dye adsorbed per gram of membranes ―qe‖ and the quantity of dye left in equilibrium solution Ce and are shown in Figs. 10-12. The adsorption isotherm indicates that adsorption capacity ―qe‖ increases with the concentration of dyes. These isotherms show the relationship between the amount of adsorbate adsorbed on the adsorbent and the concentration of adsorbate at equilibrium. The analysis of isotherm data by fitting the data to different isotherm models is an
Adsorption of methyl orange from aqueous solution on anion exchange membranes...
33
qe (mg/g)
160 120 'Expt.' Freundlich Langmuir
80 40
0
100
200 Ce (mg/L)
300
400
Fig. 12 Freunlich and Langmuir adsorption isotherms of MO onto anion exchange membrane DF120B by nonlinear method
important step in finding the most suitable model that can be used to explain the adsorption process (Royer et al. 2009). There are number of adsorption models which present for analyzing experimental results and for explaining the adsorption equilibrium. Here, isothermal models namely Langmuir and Freundlich are used to explain the experimental data. The Langmuir isotherm theory assumes monolayer coverage of adsorbate over homogeneous adsorbent surface. A basic assumption is that adsorption takes place at specific homogeneous sites within the adsorbent. Once a dye molecule occupies a site, no further adsorption can take place at that site. The Langmuir isotherm is represented as (Langmuir 1918). 𝑞𝑒 =
𝑞𝑚 𝑏𝐶𝑒 1 + 𝑏𝐶𝑒
(6)
Where b is Langmuir constant and qm is Langmuir monolayer adsorption capacity. For nonlinear method, a procedure is used, which is applicable to computer operation and reported in literature by (Zafar et al. 2015) was developed to determine the isotherm parameters by minimizing the respective the chi-square values between experimental data and isotherm using a software WaveMetrices IGOR Pro 1.2.0. Figs. 10-12 show the experimental equilibrium data and predicted the theoretical isotherms using nonlinear method for adsorption of MO onto anion exchange membranes. The obtained isotherm parameters are given in Table 2. The monolayer adsorption capacities measured for anion exchange membranes BI, BIII and DF-120B are 157.86, 148.68 and 145.47 mg/g respectively. It shows that experimental data for MO adsorption on each anion exchange membranes is fitted well to the Langmuir model. It is also worth noted that the IEC of the membranes (times the dye molecular weight) gives the theoretical adsorption amount qm and the values are 180.4 mg/g, 85.1 mg/g and 271.7 mg/g. These values are in good agreement with the calculated one as given Table 2. The essential characteristics of the Langmuir isotherm can be expressed in term of a dimensionless constant separation factor RL and is given by (Weber and Chakravorti 1974) RL
1 1 bCo
(7)
The value of RL indicates the shape of the isotherm to be either unfavourable (RL > 1), linear
34
Muhammad Imran Khan, Liang Wu, Abhishek N. Mondal, Zilu Yao, Liang Ge and Tongwen Xu
Table 2 Adsorption parameters for adsorption of MO onto anion exchange membranes BI, BIII and DF120B by nonlinear method System BI BIII DF-120B
Langmuir Isotherm qm (mg/g) b (L/mg) 157.86 ± 8.66 0.75325 ± 0.188 148.68 ± 7.4 0.80201 ± 0.166 145.47 ± 5.58 1.1481 ± 0.191
Freunlich Isotherm nF 6.6222 ± 1.17 7.2192 ± 1.11 6.7828 ± 1.09
KF 71.043 ± 8.95 67.782 ± 7.21 71.495 ± 7.32
Table 3 Separation factor (RL) for adsorption of MO onto anion exchange membranes BI, BIII and DF-120B Initial dye concentration (mg/L) 20 40 60 80 120 160 200 240 280 320 400 500 600 700 800 900
RL BIII 0.059 0.030 0.020 0.015 0.010 0.0077 0.0062 0.0052 0.0044 0.0038 0.0031 0.0024 0.0021 0.0018 0.0016 0.0014
BI 0.062 0.032 0.022 0.016 0.011 0.0082 0.0066 0.0055 0.0050 0.0047 0.0033 0.0026 0.0023 0.0019 0.0017 0.0015
DF-120B 0.021 0.011 0.0072 0.0054 0.0043 0.0036 0.0033 0.0027 0.0026 0.0025 0.0024 0.0021 0.0017 0.0012 0.0010 0.0009
(RL = 1), favourable (0 < RL < 1), or irreversible (RL = 0) (McKay 1982). The RL values foradsorption of MO onto anion exchange membranes are given in Table 3.The value RL lies between 0 and 1 indicating that the adsorption of MO on anion exchange membranes is favourable process (Xiong et al. 2010, Duran et al. 2011). Moreover, the values of RL for MO adsorption on BI lies 0.062-0.015, for BIII lies 0.059-0.0014 and for DF-120B the RL values lies between 0.0210.0009, indicating favourable adsorption of dye molecules for all the systems under the study. The Freundlich isotherm model is based on the assumption that the adsorption occurs on the hetrogeneous surface with interaction between adsorbed molecules and suggests that adsorption energy has a nonuniform distribution over the adsorbent surface (Mittal et al. 2010). The Freundlich isotherm is represented as (Freundlich 1906) 1
𝑞𝑒 = 𝐾𝐹 𝐶𝑒 𝑛
(8)
Where KF is the Freundlich constant related to with the adsorption capacity. KF can be defined as
Adsorption of methyl orange from aqueous solution on anion exchange membranes...
35
the adsorption or distribution coefficient and represents the quantity of dye adsorbed onto adsorbent at unit equilibrium concentration and nF is the adsorption intensity or heterogeniety factor. For nonlinear method, a procedure is used, which is applicable to computer operation was developed to determine the isotherm parameters by minimizing the respective the chi-square values between experimental data and isotherm using software WaveMetrices IGOR Pro 1.2.0. Figs. 10-12 indicate the Freundlich nonlinear plots for MO adsorption onto BI, BIII and DF-120B adsorbents respectively and predicted values of parameters are reproduced in Table 2. The Freundlich constant nF is a measure of the deviation from linearity of adsorption and is used to verify the type of adsorption. It is suggested that if nF is equal to unity, the adsorption is linear. Furthermore, nF below unity indicates that adsorption is a chemical process, whereas nF above unity is associated with the favourable adsorption and a physical process (Ö zcan et al. 2005). It suggests that experimental data for MO adsorption on anion exchange membranes BI, BIII and DF-120B is fitted to the Freundlich model. For favourable adsorption process, the value of nF should be in range from 1 to 10. The values of nF for MO adsorption onto anion exhange membrane BI, BIII and DF-120B are found to be 6.62, 7.21 and 6.78 respectively indicating the favourable adsorption of MO dye on the anion exchange membranes. 4. Conclusions Adsorption of anionic dye MO on commercial anion exchange membranes BI, BIII and DF120B has been evaluated at room temperature. This study indicates that anionic dye MO could be successfully adsorbed on anion exchange membranes BI, BIII and DF-120B having different IECs and water uptakes. The FTIR spectra analysis shows the successful adsorption of MO onto the anion exchange membranes. The operating conditions namely contact time, intitial dye concentration and ionic strength have significant affects on MO adsorption quantity. The adsorption capacity of MO dye on anion exchange membranes BI, BIII and DF-120B increases with contact time and initial dye concentration but decreases with ionic strength. The membrane properties such as IEC and water uptake have also significant affects on the adsorption of MO dye on anion exchange membranes. The adsorption kinetics of MO dye on BI, BIII and DF-120B are studied by employing pseudo-first-order, pseudo-second-order, liquid film diffusion model and Elovich model. The adsorption kinetic results indicate that MO adsorption onto anion exchange membranes BI, BIII and DF-120B followed pseudo-second-order kinetics. Adsorption data was also analysed by different nonlinear forms of adsorption isotherm such as Langmuir and Freundlich models. The results show that the adsorption of MO onto anion exchange membranes BI, BIII and DF-120B fitted well to the Langmuir adsorption isotherm model. Acknowledgments The authors are extreamly thankful to the National Science Foundation of China (No. 51273185, 21376232) and CAS-TWAS President’s fellowship for Ph.D. programs for financial support. References Adriá-Cerezo, D.M., Llobat-Estellés, M. and Maurı-́ Aucejo, A.R. (2000), ―Preconcentration and speciation of chromium in waters using solid-phase extraction and atomic absorption spectrometry‖, Talanta, 51(3),
36
Muhammad Imran Khan, Liang Wu, Abhishek N. Mondal, Zilu Yao, Liang Ge and Tongwen Xu
531-536. Alkan, M. and Doğan, M. (2001), ―Adsorption of copper(II) onto perlite‖, J. Colloid Interf. Sci., 243(2), 280-291. Benselka-Hadj Abdelkader, N., Bentouami, A., Derriche, Z., Bettahar, N. and de Ménorval, L.C. (2011), ―Synthesis and characterization of Mg–Fe layer double hydroxides and its application on adsorption of Orange G from aqueous solution‖, Chem. Eng. J., 169(1-3), 231-238. Berrios, M., Martín, M.Á . and Martín, A. (2012), ―Treatment of pollutants in wastewater: Adsorption of methylene blue onto olive-based activated carbon‖, J. Ind. Eng. Chem., 18(2), 780-784. Dąbrowski, A. (2001), ―Adsorption — from theory to practice‖, Adv. Colloid Interf. Sci., 93(1-3), 135-224. Dizge, N., Keskinler, B. and Barlas, H. (2009), ―Sorption of Ni(II) ions from aqueous solution by Lewatit cation-exchange resin‖, J. Hazard. Mater., 167(1-3), 915-926. Duran, C., Ozdes, D., Gundogdu, A. and Senturk, H.B. (2011), ―Kinetics and isotherm analysis of basic dyes adsorption onto almond shell (Prunus dulcis) as a low cost adsorbent‖, J. Chem. Eng. Data, 56(5), 21362147. El Qada, E.N., Allen, S.J. and Walker, G.M. (2008), ―Adsorption of basic dyes from aqueous solution onto activated carbons‖, Chem. Eng. J., 135(3), 174-184. Freunlich, H. (1906), ―Over the adsorption in solution‖, J. Phys. Chem., 57, 385-470. Gong, R., Ding, Y., Li, M., Yang, C., Liu, H. and Sun, Y. (2005), ―Utilization of powdered peanut hull as biosorbent for removal of anionic dyes from aqueous solution‖, Dyes Pigm., 64(3), 187-192. Han, R., Ding, D., Xu, Y., Zou, W., Wang, Y., Li, Y. and Zou, L. (2008), ―Use of rice husk for the adsorption of congo red from aqueous solution in column mode‖, Bioresour. Technol., 99(8), 2938-2946. Haddadain, Z., Shavandi, M.A., Abidin, Z.Z., Razi, A.F. and Ismail, M.H. (2013), ―Removal of methyl orange from aqueous solutions using Dragon Fruit (Hylocereusundatus) foliage‖, Chem. Sci. Trans., 2(3), 900-910. Karcher, S., Kornmüller, A. and Jekel, M. (2001), ―Screening of commercial sorbents for the removal of reactive dyes‖, Dyes Pigm., 51(2-3), 111-125. Karcher, S., Kornmüller, A. and Jekel, M. (2002), ―Anion exchange resins for removal of reactive dyes from textile wastewaters‖, Water Res., 36(19), 4717-4724. Langmuir, I. (1918), ―The adsorption of gases on plane surfaces of glass, mica and platinum‖, J. Am. Chem. Soc., 40(9), 1361-1403. Li, Y., Xu, T.W. and Gong, M. (2006), ―Fundamental studies of a new series of anion exchange membranes: membrane prepared from bromomethylated poly (2,6-dimethyl-1,4-phenylene oxide) (BPPO) and pyridine‖, J. Membr. Sci., 279(1-2), 151-159. Lin, X., Wu, L., Liu, Y., Ong, A.L., Poynton, S.D., Varcoe, J.R. and Xu, T.W. (2012), ―Alkali resistant and conductive guanidinium-based anion-exchange membranes for alkaline polymer electrolyte fuel cells‖, J. Power Sour., 217, 373-380. Leinonen, H. and Lehto, J. (2000), ―Ion-exchange of nickel by iminodiacetic acid chelating resin Chelex 100‖, React. Function. Polym., 43(1-2), 1-6. Luo, P., Zhao, Y., Zhang, B., Liu, J., Yang, Y. and Liu, J. (2010), ―Study on the adsorption of Neutral Red from aqueous solution onto halloysite nanotubes‖, Water Res., 44(5), 1489-1497. Marcal, L., de Faria, E.H., Saltarello, M., Calefi, P.S., Nassar, E.J. and Ciuffi, K.J. (2011), ―Aminefunctionalized titanosilicates prepared by the sol-gel process at adsorbent of azo-dye orange II‖, Ind. Eng. Chem. Res., 50(1), 239-246. McKay, G. (1982), ―Adsorption of dyestuffs from aqueous solutions with activated carbon I: Equilibrium and batch contact-time studies‖, J. Chem. Technol. Biotechnol., 32(7-12), 759-772. Mittal, A., Mittal, J., Malviya, A., Kaur, D. and Gupta, V.K. (2010), ―Adsorption of hazardous dye crystal violet from wastewater by waste materials‖, J. Colloid Interf. Sci., 343(2), 463-473. Oladoja, N.A. and Akinlabi, A.K. (2009), ―Congo red biosorption on palm kernel seed coat‖, Ind. Eng. Chem. Res., 48(13), 6188-6196. Otero, M., Rozada, F., Calvo, L.F., Garcıá , A.I. and Morán, A. (2003), ―Kinetic and equilibrium modelling of the methylene blue removal from solution by adsorbent materials produced from sewage sludges‖,
Adsorption of methyl orange from aqueous solution on anion exchange membranes...
37
Biochem. Eng. J., 15(1), 59-68. Ö zcan, A.S., Erdem, B. and Ö zcan, A. (2005), ―Adsorption of Acid Blue 193 from aqueous solutions onto BTMA-bentonite‖, Colloids and Surfaces A: Physicochem. Eng. A, 266(1-3), 73-81. Roy, A., Chakraborty, S., Kundu, S.P., Adhikari, B. and Majumder, S.B. (2012), ―Adsorption of anionic-azo dye from aqueous solution by lignocellulose-biomass jute fiber: Equilibrium, kinetics, and thermodynamics study‖, Ind. Eng. Chem. Res., 51(37), 12095-12106. Royer, B., Cardoso, N.F., Lima, E.C., Vaghetti, J.C.P., Simon, N.M., Calvete, T. and Veses, R.C. (2009), ―Applications of Brazilian pine-fruit shell in natural and carbonized forms as adsorbents to removal of methylene blue from aqueous solutions — Kinetic and equilibrium study‖, J. Hazard. Mater., 164(2-3), 1213-1222. Shek, T.-H., Ma, A., Lee, V.K.C. and McKay, G. (2009), ―Kinetics of zinc ions removal from effluents using ion exchange resin‖, Chem. Eng. J., 146(1), 63-70. Theydan, S.K. and Ahmed, M.J. (2012), ―Adsorption of methylene blue onto biomass-based activated carbon by FeCl3 activation: Equilibrium, kinetics, and thermodynamic studies‖, J. Anal. App. Pyrol., 97(0), 116-122. Weber, T.W. and Chakravorti, R.K. (1974), ―Pore and solid diffusion models for fixed-bed adsorbers‖, AIChE J., 20(2), 228-238. Wu, C.M., Wu, Y.H., Luo, J.Y., Xu, T.W. and Fu, Y.X. (2010), ―Fu, Anion exchange hybrid membranes from PVA and multi-alkoxy silicon copolymer tailored for diffusion dialysis process‖, J. Membr. Sci., 356(1-2), 96-104. Xiong, L., Yang, Y., Mai, J., Sun, W., Zhang, C., Wei, D., Chen, Q. and Ni, J. (2010), ―Adsorption behavior of methylene blue onto titanate nanotubes‖, Chem. Eng. J., 156(2), 313-320. Xu, T., Fu, R. and Yan, L. (2003), ―A new insight into the adsorption of bovine serum albumin onto porous polyethylene membrane by zeta potential measurements, FTIR analyses, and AFM observations‖, J. Colloid Interf. Sci., 262(2), 342-350. Zafar, S., Khalid, N., Daud, M. and Mirza, M.L. (2015), ―Kinetic studies of the adsorption of Thorium Ions onto Rice Husk from aqueous media: Linear and Nonlinear Approach‖, The Nucleus, 52(1), 14-19. RJ
38
Muhammad Imran Khan, Liang Wu, Abhishek N. Mondal, Zilu Yao, Liang Ge and Tongwen Xu
Nomenclature Code
Full name
AEM
Anion exchange membrane
b
Langmuir constant
Co
Initial concentration of dye
Ct
Concentration of dye at time ―t‖
IEC
Ion exchange capacity
k1
First order rate constant (/min)
k2
Second order rate constant (g/mg/min)
Kf
Freundlich constant
Kfd
Liquid film diffusion rate constant
MO
Methyl orange
nf PVA qe
Heterogeniety factor Polyvinyl alcohal Adsorption capacity at equilibrium
qe,cal
Theoretical qe values obtained from kinetic models (mg/g)
qe,exp
Experimental qe values (mg/g)
qm qmax QPPO qt 2
R
Langmuir monolayer adsorption capacity Maximun adsorption capacity Quaternized poly(2,6-dimethyl-1,4-phenylene oxide) Adsorption capacity at time ―t‖ Correlation cofficient
t
Time in minutes
V
Liquid phase volume (L)
W
Weight of adsorbent (g)
WR
Water uptake
α β
Chemi-sorption rate (/mg.min) Coefficient related to the extension of covered surface and chemi-sorption activation energy (g/min)