Journal of Environmental Protection, 2014, 5, 1352-1363 Published Online October 2014 in SciRes. http://www.scirp.org/journal/jep http://dx.doi.org/10.4236/jep.2014.513129
Adsorption of Methylene Blue from Aqueous Solution Using Steam-Activated Carbon Produced from Lantana camara Stem Omotayo Sarafadeen Amuda1*, Akeem Olusegun Olayiwola1, Abass Olanrewaju Alade2, Abolaji Grace Farombi3, Segun Akanmu Adebisi4 1
Analytical/Environmental Chemistry Unit, Department of Pure and Applied Chemistry, Ladoke Akintola University of Technology, Ogbomoso, Nigeria 2 Department of Chemical Engineering, Ladoke Akintola University of Technology, Ogbomoso, Nigeria 3 Department of Science Laboraory Technology, Osun State Polytechnic, Iree, Nigeria 4 Department of Chemical Sciences, Osun State University, Osogbo, Nigeria Email: *
[email protected] Received 21 August 2014; revised 16 September 2014; accepted 8 October 2014 Copyright © 2014 by authors and Scientific Research Publishing Inc. This work is licensed under the Creative Commons Attribution International License (CC BY). http://creativecommons.org/licenses/by/4.0/
Abstract This study investigated the adsorption of Methylene Blue (MB) present in wastewater onto the activated carbon produce from Lantana camara stem. The agricultural material (Lantana camara stem) was carbonized at 300˚C for 2 h, ground and steam-activated. The Steam-Activated Lantana camara (SALC) stem carbon was characterized using Scanning Electron Microscope (SEM) and Fourier Transform Infrared (FTIR) Spectrophotometry before and after adsorption. Batch model experiments were conducted at 20˚C to study the effects of pH, agitation time, adsorbent dosage and initial concentration of methylene blue. The equilibrium adsorption isotherms and kinetics were investigated. The FTIR bands at 3500, 2500, 2196 and 1682 cm−1 were shifted to 3646.3, 3030, 2822, 1709.05 cm−1 after MB adsorption. Similarly, the Scanning Electron Microscopy (SEM) analysis showed that the average pore size on the activated carbon was 20 µm. The Methylene Blue (MB) uptake increased with the increase in pH. Similarly, the dye adsorption increased as contact time increased, and reached equilibrium at 60 minutes. The removal of the dye increased when the dosage was increased from 0.5 - 2.0 g∙L−1, at different dye concentrations (50 - 200 mg∙L−1). The percentage removal decreased with increasing initial dye concentration for SALC. The adsorption isotherm data fitted well to the Freundlich isotherm (R2 = 0.989) while the experimental data fitted very well to the pseudo-second-order kinetic model (R2 = 0.99). This study suggests that adsorbent prepared from Lantana camara stem can be used effectively for the adsorption of methylene blue in wastewater. *
Corresponding author.
How to cite this paper: Amuda, O.S., Olayiwola, A.O., Alade, A.O., Farombi, A.G. and Adebisi, S.A. (2014) Adsorption of Methylene Blue from Aqueous Solution Using Steam-Activated Carbon Produced from Lantana camara Stem. Journal of Environmental Protection, 5, 1352-1363. http://dx.doi.org/10.4236/jep.2014.513129
O. S. Amuda et al.
Keywords Adsorption, Lantana camara, Methylene Blue, Steam Activation
1. Introduction Dyes are important hazardous substances found in textile industry, food industry, pharmaceutical industry, paper industry and plastics industry. Their presence in water bodies reduces light penetration and this consequently thwarts the photosynthesis of aqueous flora [1] [2]. Similarly, this makes the water objectionable for drinking. Dyes in water stream causes allergy, dermatitis, skin irritation, which, at extreme cases, provoke cancer and mutation in humans [3]. Furthermore, the colour and the non-biodegradable nature of the spent dye baths constitute serious environmental problems. Various treatment methods for the remove dyes from wastewater have been investigated and these methods can be classified as chemical coagulation/flocculation, ozonation, oxidation processes, chemical precipitation, ion exchange, reverse osmosis, and ultra-filtration [4]. However, most of these methods for the removal of dyes from dye containing wastewater have serious restrictions such as high cost, formation of hazardous by-products or intensive energy requirements [5] [6]. Therefore, the development of efficient, low-cost and environmentallyfriendly technologies to reduce dye content in wastewater is extremely necessary. Adsorption is rapidly gaining prominence among the treatment technologies and [7] has noted that adsorption can produce high-quality water while also being a process that is economically feasible. The physical characteristics of the adsorbents such as surface area, porosity, size distribution, density and surface charge have high influence in the adsorption process [8]. As a result, there has been a great interest in developing new adsorbent materials with diverse compositions, properties and functionalities. Although commercial activated carbon is the most widely used adsorbent for dye removal, it is too expensive [9]; consequently, numerous low-cost alternative adsorbents have been proposed including chemically modified sugarcane bagasse lignin [10], pistachio hull waste [11], coffee husk-based activated carbon [12], pine cone [13], rice husk [14], synthetic calcium phosphates [15], natural untreated clay [16], pillared clays [17], and swelling clays [18]. The purpose of this work is to investigate convenient and economic method for basic dye (methylene blue) removal from wastewater by adsorption on an abundantly available adsorbent, but in this case, adsorption of methylene blue dye onto steam activated carbon from Lantana camara stem (SALC). Batch studies involving process parameters such as the effect adsorbent dosage, initial dye concentration, pH of solution, and contact time, were carried out. Equilibrium and kinetic analysis were conducted to determine the factors controlling the rate of adsorption, the optimization of various parameters in dye recovery and to find out the possibility of using this material as low-cost adsorbent for dye removal. The experimental data obtained were analysed using isotherm models such as Langmuir and Freundlich isotherm models.
2. Materials and Methods 2.1. Preparation of Adsorbent The natural low cost material, Lantana camara, was obtained from Stadium Area, Ogbomosho, and OyoState, Nigeria. The stems were separated from the seed and flower and were extensively washed with tap water to remove soil and dust particles. It was then sundried, and further crushed into smaller size. The Lantana camara was carbonized using an electric furnace at 300˚C for 2 h. The carbonized sample was ground into granular form and the carbon was activated using steam activating reactor. The resultant activated carbon was oven-dried at 105˚C for 2 h and cooled to room temperature in a desiccator. It was then ground with mortar and pestle and sieved to 2 mm mesh size. It was later stored inside a desiccator to avoid moisture absorption. The Infrared spectroscopic analysis was conducted on the Steam-Activated Lantana camara Stem (SALCS) to investigate the functional groups present on its surface using Fourier Transform Infrared Spectrometer (Perkin-Elmer Spectrum GX, Kuala Lumpur, Malaysia). The morphologies of the steam activated carbon were characterized using a scanning electron microscope (SEM, JEOL JSM-6480 LV).
1353
O. S. Amuda et al.
2.2. Adsorption Studies
The adsorb ate was prepared by dissolving 1 g of methylene blue powder in small quantity of distilled water in 1000 ml volumetric flask. More distilled water was added to make up to the mark. It was then shaken vigorously for five minutes to ensure complete dissolution and homogeneity; this makes the stock solution of concentration 1000 mg/L. Different concentrations were prepared by serial dilution [19]. Batch adsorption method was employed to determine the effects of contact time, adsorbent dose, dye concentration and pH solution. 100 ml of (50 mg/L) dye solution was poured into a conical flask with adsorbent dosage 0.5 g and place inside a shaker (environmental orbital shaker, Deneb Instruments). The samples were withdrawn from the shaker at predetermined time intervals and the dye solution was separated from the adsorbent by the help of a micropipette. The absorbance of the solution was then measured. The dye concentration was measured after 50, 100, 150, and 200, until the equilibrium was reached. To study the effects of initial pH of the solution on the adsorption process, 100 ml of 50 mg/L dye solution was poured into a conical flask with adsorbent dosage of 1 g. The pH of the dye solutions was adjusted with dilute HCl (0.05 N) or KOH (0.05 N) solution by using a pH meter (EUTECH Instrument, pH 510). 10 ml of dye solution was prepared taking dye and the pH of solution was changed from 3 to 10. The adsorbent dosage was varied as 0.5, 1.0, 1.5, and 2.0 g/150ml. Effect of concentration 100 ml of dye solution was prepared in conical flask with dye concentration 50 mg/L and adsorbent dose (1 g/L) and place the shaker. The temperature was maintained at 20˚C. The final dye concentration readings were taken at 50, 100, 150, and 200. Dye concentration was estimated, spectrophotometrically, at the wavelength corresponding to maximum absorbance, λ max using a spectrophotometer (JASCO UV/Vis-550). The samples were withdrawn from the shaker at predetermined time intervals (30, 45, 60 and 120 min) and the dye solution was separated from the adsorbent by the help of a micropipette. The absorbance of the solution was then measured. The dye concentration was measured after 50, 100, 150 and 200, until the equilibrium was reached. The qe is expressed as
qe =
( Ce − Co )V M
(1)
where, qe = amount of dye adsorbed per unit mass of adsorbent (mg/g), Co = initial dye concentration (mg/L), Ce = final dye concentration (mg/L), V = volume of dye solution and M = mass of adsorbent (g/L).
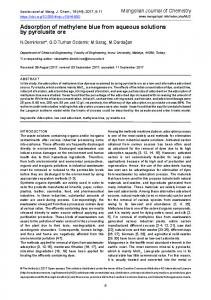
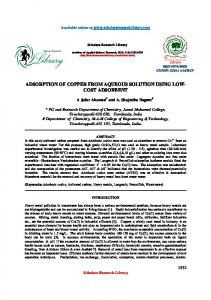
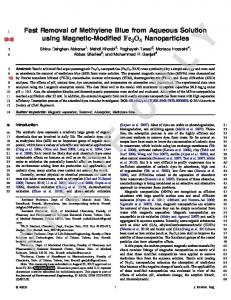
3. Results and Discussion 3.1. Characterization of Adsorbent The FTIR spectra of SALC were taken before and after the adsorption of MB to ascertain the possible involvement of the functional groups on the surface of SALC in the adsorption of MB (Figure 1 and Figure 2). The broad band at 3500 - 2500 cm−1 can be attributed to -OH stretching vibration while the band at 2196 cm−1 can be assigned to the C≡C and/or C≡N stretching vibrations. The peak at 3500 cm−1was strong and broad due to a carbonyl group stretching vibrations superimposed on the side of hydroxyl group band, which has been reported to occur at 3500 - 2500 cm−1. The peaks at 1709.05 - 1682 cm−1 may be attributed to C=O stretching, -CH bending vibrations of carbonyl compound, respectively. The bands at 3030 cm−1 and 2822 cm−1 can be linked to C-H stretching Figure 3 reveals that some new bands appeared, some remained and some were shifted after MB sorption. The bands at 3500, 2500, 2196 and 1682 cm−1 were shifted to 3646.3, 3030, 2822, 1709.05 cm−1 after MB adsorption. This is an indication that OH, C-H, C=C and C=O, carbonyl group could be involved in the adsorption of MB onto SALC. Plates 1(a) and (b) shows the SEM micrographs of SALC samples before and after dye adsorption. The SALC exhibits a caves-like, uneven and rough surface morphology. The surface of dye-loaded adsorbent, however, shows that the surface of SALC is covered with dye molecules: (a) fresh SALC and (b) dye adsorbed SALC.
3.2. Effect of Solution pH on Dye Adsorption onto SALC The pH of the dye solution plays an important role in the whole adsorption process and particularly on the adsorption capacity [20]. The effect of each individual solution pH (3 - 11) on the equilibrium uptake capacity of
1354
O. S. Amuda et al.
Figure 1. FTIR characterization of SALCS before MB adsorption.
Figure 2. FTIR characterization of SALC after MB adsorption.
Figure 3. Effect of pH as a function of percentage removal of MB.
MB dye was studied at different initial dye concentrations (50 - 200 mg∙L−1) at room temperature. The dye uptake was found to increase with an increase in pH (Figure 4). At lower pH, the surface charge may be positive,
1355
O. S. Amuda et al.
Figure 4. Effect of contact time as a function of percentage removal of MB.
thus making (H+) ions compete effectively with cationic dyes causing a decrease in the amount of dye adsorbed [21]. And at higher pH, the surface of SALC may be negatively charged which enhance the positively charged on MB dye through electrostatic force attraction [22]. Similar observations were reported for adsorption of dyes indicating that the adsorbent has a net positive charge on its surface [23] [24].
3.3. Effect of Contact Time on Dye Adsorption onto SALC The adsorption of MB dye at initial concentration of 50 mg∙L−1was studied at different contact time (30 - 120 min). The dye adsorption uptake was increased as contact time increased, and reaches equilibrium at 60 minutes (Figure 5). The result suggests that, adsorption takes place rapidly at the initial stage on the external surface of the adsorbent followed by a slower internal diffusion process, which may be the rate determining step [25] [26]. In addition, the fast adsorption at the initial stage may be due to the fact that a large number of surface sites are available for adsorption but after a lapse of time, the remaining surface sites are difficult to be occupied. This is because of the repulsion between the solute molecules of the solid and bulk phases, thus, taking long time to reach equilibrium [27].
3.4. Effect of Adsorbent Dose on Efficiency of Dye Removal onto SALC The solid/solution ratio is an important factor determining the capacity of adsorbent in a batch adsorption. The effect of adsorbent dosages on the percentage removal of MB dye has been shown in Figure 6. It followed the predicted pattern of increasing percentage adsorption as the dosage was increased [28]. This is probably because of the resistance to mass transfer of dye from bulk liquid to the surface of the solid, which becomes important at high adsorbent loading in which the experiment was conducted [29]. It can be clearly seen that the removal of MB dye increased with increasing the amount of SALC. However the amounts of adsorbed dye per unit weight (Qe) of the SALC decreased with increasing the solid/solution ratio (Figure 6). The removal of the dye increased when the dosage was changed from 0.5 - 2.0 g∙L−1, at different dye concentrations (50 - 200 mg∙L−1). As expected, at constant initial concentration of dye, increasing the sample dose provides a greater surface area and larger number of adsorption sites and hence enhancement of dye uptake [30]. The primary factor explaining this characteristic is that adsorption sites remain unsaturated during the adsorption reaction whereas the number of sites available for adsorption site increases by increasing the adsorbent dose [31].
3.5. Effect of Initial Dye Concentration on Efficiency of Dye Removal onto SALC The effect of the initial dye concentration on the dye adsorption capacity was investigated in the concentration range of 50 - 200 mg/L−1 at room temperature without changing the initial pH of the medium. The results represented in Figure 7 shows that the percentage of removal decreased with increasing initial dye concentration for SALC. The lower uptake at higher concentration resulted from an increased ratio of initial adsorption number of moles of the dye to the available surface area; hence fractional becomes dependent on initial concentration. The initial dye concentration provides an important driving force to overcome the mass transfer resistance of the dye between the aqueous and solid phases. Therefore, at higher initial dye concentration, the number of
1356
O. S. Amuda et al.
Figure 5. Effect of adsorbent dosage as a function of percentage removal of MB.
Figure 6. Effect initial dye concentrationsas function of percentage removal of MB.
Figure 7. Langmuir adsorption isotherm for the adsorption of MB onto SACL.
ions competing for the available sites on the surface of SALC was high, hence, resulting in higher MB adsorption capacity [27]. Similar results were also reported by other researchers [32].
3.6. Adsorption Isotherms The adsorption isotherm indicates how the adsorption molecules distribute between the liquid phase and the solid phase when the adsorption process reaches an equilibrium state. The analysis of equilibrium adsorption data, by fitting them to different isotherm models, is an important step to find the suitable model that can be used for design purpose [33]. Adsorption isotherm study was carried out on two well-known isotherms, Langmuir and Freundlich. The applicability of the isotherm equation was compared by judging the correlation coefficients, R2. 3.6.1. Langmuir Isotherm The linear form of Langmuir’s isotherm model plotted is given by the following equation.
1357
O. S. Amuda et al.
Ce 1 1 = + Ce Qo Qob Qo
(2)
where: Ce is the equilibrium concentration of the adsorbate (MB) (mg/L), Qo is the amount of adsorbate adsorbed by unit mass of adsorbate (mg/g), Qob are Langmuir constant related to monolayer adsorption capacity and affinity of adsorbent towards adsorbate respectively [34]. When Ce/Qo was plotted against Ce straight line with slope 1/Qo was obtained (Figure 8), indicating that the adsorption of the Methylene Blue (MB) onto SALC follows the Langmuir isotherm. The Langmuir constant “b” and “Qo” were calculated from this isotherm and their values are given in Table 1. Conformity of the experimental data to Langmuir isotherm model indicates the homogenous nature of SALC similar observations were reported on the adsorption of Cd onto Crysophyllum albidum shell [29]. The essential characteristics of the Langmuir isotherm can be expressed in terms of a dimensionless equilibrium parameter (RL) [35], which is defined in Equation (3) as. R=
1 1 + bC0
(3)
where: Qob is the Langmuir constants and Ce is the highest dye concentration (mg/L). The value of RL indicates the type of the isotherm to be either unfavourable (RL > 1), linear (RL = 1), favourable (0 < RL < 1) or irreversible (RL = 0) (Table 2). Value of RL was found to be 1 which confirmed that the adsorbent prepared from the Lantana camara stem is favourable for adsorption of MB under conditions used in this study [36]. 3.6.2. Freundlich Isotherm The well-known logarithmic form of Freundlich model used in this is given by the following equation.
1 = log qe log K f + log Ce n
(4)
where: qe is the amount adsorbed at equilibrium (mg/g), Ce is the equilibrium concentration of the adsorbate (MB) and Kf and n are Freundlich constants; n given an indication of how favourable is the adsorption capacity of the adsorbent [37]. Kf can be defined as the adsorption or distribution coefficient and represents the quantity of methylene blue onto SALCS for a unit equilibrium concentration. The slope 1/n ranging between 0 and 1 is a measure of absorption intensity or surface heterogeneity, becoming more heterogeneous as its, value gets closer to zero [38]. Value of 1/n below one indicates a normal Langmuir isotherm while above one is indicative of cooperative adsorption [39]. The plot of logqe verse logCe gives straight lines with slope “1/n” (Figure 9), which shows that the adsorption of MB also follows the Freundlich isotherm. Accordingly, Freundlich constants (Kf and n) were calculated and recorded in Table 1. Table 1 shows the value of the parameter of the two isotherms and related correlation coefficients. The Freundlich model yields a somewhat better fit (R2 = 0.989) than the Langmuir model (R2 = 0. 986). The value of 1/n is 0.751 (Table 1) which indicates favourable adsorption [40] [41]. The adsorption capacities of SALC were compared to previously reported works on the adsorption capacities
Figure 8. Freundlich adsorption isotherm for the adsorption of MB onto SALC.
1358
O. S. Amuda et al.
Figure 9. Plot of ln(qe − qt) against time for the adsorption of MB onto SALC. Table 1. Isotherm characteristics parameters of Langmuir and Freundlich isotherm constants for MB onto SALCS. Langmuir isotherm constants
Freundlich isotherm constants
Qo [(mg/g) (L/mg)]
b
R2
1/n
Kf [(mg/g) (L/mg)]
R2
19.84
0.548
0.986
0.751
1.111
0.989
Table 2. KR values for different isotherm shapes. Values of KR
Type of isotherm
KR > 1
Unfavourable
KR = 1
Linear
0< KR < 1
Favourable
KR = 0
Irreversible
Source: [35].
of various low-cost adsorbent. The experimental data of the present study was found to be higher than those of walnut bark (15.1 mg/g) and yellow passion fruit (16 mg/g) and lower than those of rice husk (4.59 mg/g), cherry saw dust (39 mg/g), sugarcane bagasse (34.2 mg/g) and banana peel (20.8 mg/g) (Table 3).
3.7. Kinetics Studies It is important to be able to predict the rate at which contaminants is removed from aqueous solution in order to design adsorption treatment plant. In order to investigate the mechanism of adsorption and potential rate controlling steps such as mass transfer and chemical reaction, the kinetics of MB sorption onto SALC was investigated using two different models: the pseudo-first-order kinetic [42], and the pseudo-second-order kinetic [43] models. The conformity between experimental data and the model predicted values was expressed by the correlation coefficients (R2, values close or equal to 1 and SSE = sum of square of errors) [41]. A relatively high R2 value indicates that the model successfully describes the kinetics of MB adsorption [44]. The rate constant of adsorption was determined from the pseudo-first-order equation given by
ln ( qe − qt ) =
1 qe − K t n
(5)
where: qe and qt are the amounts of methylene blue adsorbed (mg/g) at equilibrium and at time (min), respectively and K1 the rate constant of adsorption (2 h). Values of K1 were calculated from plots of ln ( qe − qt ) vs t at different concentrations of methylene blue (MB). The correlation coefficient values are higher than 0.90, the experimental qe values also agree slightly different of about (4.7%) with the calculated ones, obtained from the linear plots (Figure 10 and Figure 11). This shows that the adsorption of MB onto SALC is pseudo second order kinetics. Sum of square of errors is a test of kinetic models. Beside the value of R2, the applicability of both kinetics models were verified through the sum of error squares (SSE, %). The adsorption kinetics of MB on adsorbent prepared from Lantana camara stem (SALC) was tested at different initial concentration. The validity of each
1359
O. S. Amuda et al.
Figure 10. Plot of t/qt against time for the adsorption of MB onto SALC.
(a)
(b)
Figure 11. Scanning electron microscope of (a) fresh SALCS and (b) dye adsorbed SALCS. Table 3. The natural forms of agricultural waste and its dye adsorption capacities. Adsorbents
Adsorption capacities (mg/g)
References
Banana peel
20.80
[20]
Cherry saw dust
39.00
[45]
Rice husk
40.59
[46]
Sugarcane bagasse
34.20
[47]
Walnut bark
15.10
[48]
Yellow passion fruit
16.00
[49]
Lantana camera stem
19.84
This work
model was determined by the sum of error squares (SSE, %) given by;
SSE ( % ) =
∑ ( qe − qe cal ) N
2
(6)
where: N is the number of data points: The higher the value of R2 and the lower the value of SSE, the better the goodness of the fit. Table 4 lists the calculated results. It was found that the adsorption kinetics of MB on adsorbent prepared from Lantana camara stem can be described by the second-order kinetic model.
4. Conclusion Lantana camara stem like other agricultural waste can be used in the treatment process of dyes in wastewater.
1360
O. S. Amuda et al.
Table 4. Comparison of the pseudo-first-order and pseudo-second-order adsorption rate constants, calculated experimental qe values for different initial concentrations of MB. First order kinetics model
Initial conc. (mg/L)
Qe (mg/g)
K1 (min−1)
qecal (mg/g)
R2
SSE (%)
Second order kinetics model K2 (g/mg/mm)
qecal (mg/g)
R2
SSE (%)
50
12.34
0.077
13.52
0.98
0.60
0.0053
13.83
0.99
0.48
100
24.77
0.082
26.00
0.91
0.57
0.0026
27.49
0.99
0.95
150
37.00
0.061
37.12
0.98
0.04
0.0018
42.49
0.99
1.45
200
47.00
0.058
46.82
0.98
0.69
0.0012
55.25
0.99
1.98
The adsorption capacity is dependent on pH solution, contact time, adsorbent dosage and adsorbate concentration. Maximum percentage MB removal (85%) was attained at 60 minutes. The adsorption capacity of SALC increased with the increase in pH and initial MB concentration. The Langmuir maximum adsorption capacity showed a slight increase. The Freundlich constant (n) revealed that the adsorption process was favourable and that the adsorption of MB into SALC was dominated by chemisorption. The kinetic modelling of adsorption of MB onto SALC followed the pseudo-second-order kinetic model. The value of the maximum adsorption capacity, Qo (19.84 mg/g) was comparable with the values observed for other adsorbents reported in the earlier studies. These preliminary studies suggest that adsorbent prepared from Lantana camara stem can be used effectively for the adsorbent of MB in wastewater.
Acknowledgements The authors acknowledge the financial support received from Ladoke Akintola University of Technology, Ogbomoso, Nigeria, through Senate Research Grant, LAU/SRG/13/007.
References [1]
Al-Degs, Y.S., El-Barghouthi, M.I., El-Sheikh, A.H. and Walker, G.M. (2008) Effect of Solution pH, Ionic Strength, and Temperature on Adsorption Behaviour of Reactive Dyes on Activated Carbon. Dyes and Pigments, 77, 16-23. http://dx.doi.org/10.1016/j.dyepig.2007.03.001
[2]
Boyer, B., Cardoso, N.F., Lima, E.C. and Macedo, T.R. (2010) A Useful Organofunctionalized Layered Silicate for Textile Dye Removal. Journal Hazardous Material, 181, 366-374. http://dx.doi.org/10.1016/j.jhazmat.2010.05.019
[3]
De Lima, R.O.A., Bazo, A.P., Salvadori, D.M.F., Rech, C.M., Oliveira, D.P. and Umbuzeiro, G.A. (2007) Matagenic and Carcinogenic Potential of a Textile Azo Dye Processing Plant Effluent That Impacts a Drinking Water Source. Mutation Separation Science and Technology, 626, 53-60.
[4]
Amuda, O.S. and Alade, A.O. (2006) Coagulation/Flocculation Process in the Treatment of Abattoir Wastewater. Desalination, 196, 22-31. http://dx.doi.org/10.1016/j.desal.2005.10.039
[5]
Yazdanbakhsh, M., Tavakkoli, H. and Hosseini, S.M. (2011) Characterization and Evaluation Catalytic Efficiency of La0.5Ca0.5NiO3 Nanopowders in Removal of Reactive Blue 5 from Aqueous Solution. Desalination, 281, 388-395. http://dx.doi.org/10.1016/j.desal.2011.08.020
[6]
Tabari, T., Tavakkoli, H., Zargaran, P. and Beiknejad, D. (2012) Fabrication of Perovskite Type Oxide BaPbO3 Nanoparticles and Their Efficiency in Photodegradation of Methylene Blue. South African Journal of Chemistry, 65, 239-244.
[7]
Choy, K.K.H., McKay, G. and Porter, J.F. (1999) Sorption of Acid Dyes from Effluents Using Activated Carbon. Resource Conservation Research, 27, 57-71. http://dx.doi.org/10.1016/S0921-3449(98)00085-8
[8]
Alade, A.O., Amuda, O.S., Afolabi, T.J. and Okoya, A.A. (2012) Adsorption of Naphthalene onto Activated Carbons Derived from Milk Bush Kernel Shell and Flamboyant Pod. Journal of Environmental Chemistry and Ecotoxicology, 4, 124-132.
[9]
Malik, P.K. (2004) Dye Removal from Wastewater Using Activated Carbon Developed from Sawdust: Adsorption Equilibrium and Kinetics. Journal of Hazardous Materials, 113, 81-88. http://dx.doi.org/10.1016/j.jhazmat.2004.05.022
[10] Da Silva, L.G., Ruggiero, R., Gontijo, P.M., Pinto, R.B., Royer, B., Lima, E.C., Fernandes, T.H.M. and Calvete, T. (2011) Adsorption of Brilliant Red 2BE Dye from Water Solutions by Chemically Modified Sugarcane Bagasse Lignin. Chemical Engineering Journal, 168, 620-628. http://dx.doi.org/10.1016/j.cej.2011.01.040 [11] Moussavi, G. and Khosravi, R. (2011) The Removal of Cationic Dyes from Aqueous Solutions by Adsorption onto
1361
O. S. Amuda et al.
Pistachio Hull Waste. Chemical Engineering Research and Design, 89, 2182-2189.
[12] Ahmad, M.A. and Rahman, N.K. (2011) Equilibrium, Kinetics and Thermodynamic of Remazol Brilliant Orange 3R Dye Adsorption on Coffee Husk-Based Activated Carbon. Chemical Engineering Journal, 170, 154-161. http://dx.doi.org/10.1016/j.cej.2011.03.045 [13] Mahmoodi, N.M., Hayati, B., Arami, M. and Lan, C. (2011) Adsorption of Textile Dyes on Pine Cone from Coloured Wastewater: Kinetic, Equilibrium and Thermodynamic Studies. Desalination, 268, 117-125. http://dx.doi.org/10.1016/j.desal.2010.10.007 [14] Safa, Y. and Bhatti, H.N. (2011) Kinetic and Thermodynamic Modelling for the Removal of Direct Red 31 and Direct Orange 26 Dyes from Aqueous Solutions by Rice Husk. Desalination, 272, 313-322. http://dx.doi.org/10.1016/j.desal.2011.01.040 [15] Abdulhamid, S.A. and Asil, A.A. (2011) The Effect of Soaking Process of Agricultural Waste on the Adsorption of Methylene Blue Dye. International Food Research Journal, 18, 977-981. [16] Errais, E., Duplay, J., Darragi, F., M’Rabet, I., Aubert, A., Huber, F. and Morvan, G. (2011) Efficient Anionic Dye Adsorption on Natural Untreated Clay: Kinetic Study and Thermodynamic Parameters. Desalination, 275, 74-81. http://dx.doi.org/10.1016/j.desal.2011.02.031 [17] Gil, A., Assis, F.C.C., Albeniz, S. and Korili, S.A. (2011) Removal of Dyes from Wastewaters by Adsorption on Pillared Clays. Chemical Engineering Journal, 168, 1032-1040. http://dx.doi.org/10.1016/j.cej.2011.01.078 [18] Li, Z., Change, P.H., Jiang, W.T., Jean, J.S. and Hong, H. (2011) Mechanism of Methylene Blue Removal from Water by Swelling Clays. Chemical Engineering Journal, 168, 1193-1200. http://dx.doi.org/10.1016/j.cej.2011.02.009 [19] Hameed, B.H., Din, A.T. and Ahmad, A.L. (2007) Adsorption of Methylene Blue onto Bamboo-Based Activated Carbon: Kinetics and Equilibrium Studies. Journal of Hazardous Materials, 141, 819-825. http://dx.doi.org/10.1016/j.jhazmat.2006.07.049 [20] Annadurai, G., Juang, R.S. and Lee, D.J.S. (2002) Use of Cellulose Wastes for Adsorption of Dyes from Aqueous Solutions by Banana Peel Waste: Kinetic, Equilibrium and Thermodynamic Studies. Desalination, 271, 80-87. [21] Srinivasan, P., Sivakumar, P. and Raja, S. (2013) Kinetic and Isotherm Studies for the Adsorption of a Textile Dye Using PVA Matrix Supported Activated Carbon. Archives of Applied Science Research, 5, 132-140. [22] Dermibas, E., Dizge, N., Sulak, M.T. and Kobya, M. (2008) Adsorption Kinetics and Equilibrium Studies of Copper from Aqueous Solutions Using Hazelnut Shell Activated Carbon. Chemical Engineering Journal, 148, 480-487. [23] Demirbas, A. (2009) Agricultural Based Activated Carbons for the Removal of Dyes from Aqueous Solutions: A Review. Journal of Hazardous Materials, 167, 1-9. http://dx.doi.org/10.1016/j.jhazmat.2008.12.114 [24] Kavitha, D. and Namasivayam, C. (2007) Experimental and Kinetic Studies on Methylene Blue Adsorption by Coir Pith Carbon. Bioresource Technology, 98, 14-21. http://dx.doi.org/10.1016/j.biortech.2005.12.008 [25] Allen, S.J. and Koumanova, B. (2005) Decolourisation of Water/Wastewater Using Adsorption. Journal of the University of Chemical Technology and Metallurgy, 40, 175-192. [26] Gialamouidis, D., Mitrakas, M. and Liakopoulou-Kyriakides, M. (2010) Equilibrium, Thermodynamic and Kinetic Studies on Biosorption of Mn(II) from Aqueous Solution by Pseudomonas sp., Staphylococcus xylosus and Blakeslea trispora Cells. Journal of Hazardous Materials, 182, 672-680. http://dx.doi.org/10.1016/j.jhazmat.2010.06.084 [27] Idris, M.N., Ahmad, Z.A. and Ahmad, M.A. (2011) Adsorption Equilibrium of Malachite Green Dye onto Rubber Seed Coat Based Activated Carbon. International Journal of Basic & Applied Sciences, 11, 305-311. [28] El Katori, E.E., Fouda, A.S. and Al-Sarawy, A.A. (2011) Removal of Some Thiazole Dyestuffs from Aqueous Media by Adsorption onto Different Types of Carbon. Indian Journal of Chemical Technology, 18, 319-326. [29] Ho, Y.S., Chiang, T.H. and Hsueh, Y.M. (2005) Removal of Basic Dye from Aqueous Solution Using Tree Fern as a Biosorbent. Process Biochemistry, 40, 119-124. http://dx.doi.org/10.1016/j.procbio.2003.11.035 [30] Bello, O.S. and Ahmad, M.A. (2011) Adsorption Removal of a Synthetic Textile Dye Using Cocoa Pod Husk. Toxicological & Environmental Chemistry, 93, 1298-1308. http://dx.doi.org/10.1080/02772248.2011.590490 [31] Khattri, S.D. and Singh, M.K. (2009) Removal of Malachite Green from Dye Wastewater Using Neem Sawdust by Adsorption. Journal of Hazardous Materials, 167, 1089-1094. http://dx.doi.org/10.1016/j.jhazmat.2009.01.101 [32] Amuda, O.S., Edewor, T.I., Afolabi, T.J. and Hung, Y.-T. (2013) Steam-Activated Carbon Prepared from Chrysophyllum albidum Seed Shell for the Adsorption of Cadmium in Wastewater: Kinetics, Equilibrium and Thermodynamic Studies. International Journal of Environment and Waste Management, 12. http://dx.doi.org/10.1504/IJEWM.2013.055595 [33] Ho, Y.S. and McKay, G. (1998) A Comparison of Chemisorption Kinetic Models Applied to Pollutant Removal on Various Sorbents. Process Safety and Environmental Protection, 76, 332-340. [34] Langmuir, I. (1916) The Adsorption of Gases on Plane Surfaces of Glass, Mica and Platinum. Journal of the American
1362
Chemical Society, 40, 1361-1403. http://dx.doi.org/10.1021/ja02242a004
O. S. Amuda et al.
[35] Weber, T.W. and Chackravorti, R.K. (1974) Pore and Solid Diffusion Models for Fixed Bed Absorbers. American Institute of Chemical and Engineering Journal, 20, 228-238. http://dx.doi.org/10.1002/aic.690200204 [36] Hall, K.R., Eagleton, L.C., Acrivos, A. and Vermeulen, T. (1966) Pore- and Solid-Diffusion Kinetics in Fixed-Bed Adsorption under Constant-Pattern Conditions. Industrial & Engineering Chemistry Fundamentals, 5, 212-223. http://dx.doi.org/10.1021/i160018a011 [37] Freundlich, H.M.F. (1906) Über die adsorption in lösungen. Zeitschrift für Physikalische Chemie (Leipzig), 57, 385-470. [38] Fytianos, K., Voudrias, E. and Kokkalis, E. (2003) Sorption-Desorption Behaviour of 2,4-Dichlorophenol by Marine Sediments. Chemosphere, 40, 3-6. http://dx.doi.org/10.1016/S0045-6535(99)00214-3 [39] Bello, O.S., Fatona, T.A., Falaye, F.S., Osuolale, O.M. and Njoku, V.O. (2011) Adsorption of Eosin Dye from Aqueous Solution Using Groundnut Hull-Based Activated Carbon: Kinetic, Equilibrium, and Thermodynamic Studies. Environmental Engineering Science, 29, 186-194. [40] Adamson, A.W. (2001) Physical Chemistry of Surfaces. 5th Edition, Wiley, New York, 212-223. [41] Aksu, Z. and Tezer, S. (2000) Equilibrium and Kinetic Modelling of Biosorption of Remazol Black B by Rhizopus arrhizus in a Batch System: Effect of Temperature. Process Biochemistry, 36, 431-439. http://dx.doi.org/10.1016/S0032-9592(00)00233-8 [42] Lagergren, S. (1898) About the Theory of So-Called Adsorption of Soluble Substance. Kungliga Svenska Vetenskapsakademiens Handlingar, 24, 1-39. [43] Hu, Q.H., Qiao, S.Z., Haghseresht, F., Wilson, M.A. and Lu, G.Q. (2006) Adsorption Study. Journal of Clinical Nutrition, 55, 675-681. [44] Malarvizhi, R. and Sulochana, N. (2008) Sorption Isotherm and Kinetic Studies of Methylene Blue Uptake onto Activated Carbon Prepared from Wood Apple Shell. Journal of Environmental Protection Science, 2, 40-46. [45] Ferrero, F. (2007) Dye Removal by Low Cost Adsorbents: Hazelnut Shell in Comparison with Wood Saw Dust. Journal of Hazardous Materials, 142, 144-152. http://dx.doi.org/10.1016/j.jhazmat.2006.07.072 [46] Vadivelan, V. and Kumar, K.V. (2005) Equilibrium, Kinetics, Mechanism, and Process Design for the Sorption of Methylene Blue onto Rice Husk. Journal of Colloid and Interface Science, 286, 90-100. http://dx.doi.org/10.1016/j.jcis.2005.01.007 [47] Filho, N.C., Venancio, E.C., Barriquello, M.F., Hechenleitner, A.A. and Pineda, E.A.G. (2007) Methylene Blue Adsorption onto Modified Lignin from Sugar Cane Bagasse. Eclectic Chemistry, 32, 63-70. [48] Bushra, K., Azra, Y., Muhammed, F., Lubna, L. and Benish, I. (2010) Study of Colour Measurements of Leather Dyed with Walnut Bark Natural Dye. Journal of Industrial Resources, 53, 252-257. [49] Pavan, F.A., Gushikem, Y., Mazzoczto, A.C., Dias, S.L.P. and Lima, E.C. (2007) Statistical Design of Experiments as a Tool for Optimizing the Batch Condition of Methylene Blue Biosorption on Yellow Passion Fruit and Mandarin Peels. Dyes and Pigments, 72, 256-266. http://dx.doi.org/10.1016/j.dyepig.2005.09.001
1363