ISSN 2394 - 7780
Volume 2, Issue 3 (I) July – September 2015
International Journal of
Advance and Innovative Research
Indian Academicians and Researchers Association www.iaraedu.com
International Journal of Advance and Innovative Research Volume 2 , Issue 3 (I) : July - September 2015 Editor- In-Chief
Dr. Pranjal Sharma
Members of Editorial Advisory Board Dr. Nurul Fadly Habidin Faculty of Management and Economics, Universiti Pendidikan Sultan Idris, Malaysia
Dr. Marwan Mustafa Shammot Associate Professor, King Saud University, Riyadh, Saudi Arabia
Prof. P. Madhu Sudana Rao Professor of Banking and Finance, Mekelle University, Mekelle, Ethiopia
Dr. Amer A. Taqa Faculty, DBS Department, College of Dentistry, Mosul University
Dr.Agbo J.Madaki Lecturer, Catholic University of Eastern Africa, Kenya
Dr. Sunita Dwivedi Associate Professor, Symbiosis International University, Noida
Dr. D. K. Pandey Director,
Dr. Sudhansu Ranjan Mohapatra Director, Centre for Juridical Studies Unique Institute of Management & Technology, Meerut Dibrugarh University, Dibrugarh Dr. Tazyn Rahman Dean ( Academics ) Jaipuria Institute, Ghaziabad
Dr. Neetu Singh HOD, Department of Biotechnology, Mewar Institute , Vasundhara, Ghaziabad
Dr. Teena Shivnani HOD, Department of Commerce, Manipal University, Jaipur
Dr. Anindita Associate Professor, Jaipuria School of Business, Ghaziabad
Dr. K. Ramani Associate Professor, K.S.Rangasamy College of Technology, Namakkal
Dr. S. Satyanarayana Associate Professor, KL University , Guntur
Dr. Subha Ganguly Dr. Gauri Dhingra Scientist (Food Microbiology) Assistant Professor, University of Animal and Fishery Sciences, Kolkata JIMS, Vasant Kunj, New Delhi Dr. V. Tulasi Das Assistant Professor, Acharya Nagarjuna University
Dr. R. Suresh Assistant Professor, Mahatma Gandhi University
Copyright @ 2014 Indian Academicians and Researchers Association, Guwahati All rights reserved. No part of this publication may be reproduced or transmitted in any form or by any means, or stored in any retrieval system of any nature without prior written permission. Application for permission for other use of copyright material including permission to reproduce extracts in other published works shall be made to the publishers. Full acknowledgment of author, publishers and source must be given. The views expressed in the articles are those of the contributors and not necessarily of the Editorial Board or the IARA. Although every care has been taken to avoid errors or omissions, this publication is being published on the condition and understanding that information given in this journal is merely for reference and must not be taken as having authority of or binding in any way on the authors, editors and publishers, who do not owe any responsibility for any damage or loss to any person, for the result of any action taken on the basis of this work. All disputes are subject to Guwahati jurisdiction only.
International Journal of Advance and Innovative Research Volume 2 , Issue 3 (I) : July - September 2015
CONTENTS Research Papers STRATEGIC ANALYSIS: SUCCESS OF CONVENIENCE STORES OF MEXICAN ECONOMIC AND TRADE PROMOTION
1 – 10
José G. Vargas-Hernández and Karina Edith Flores Valenzuela A STUDY OF CUSTOMER’S USAGE PATTERN ABOUT ICT TRENDS IN BANKING W.R.T. MUMBAI AND THANE REGION
11 – 15
Dr. Shraddha Mayuresh Bhome CONFLICT MANAGEMENT: A TOOL FOR TEAM BUILDING
16 – 21
Dr. V. K. Goyal and Dr. Tazyn Rahman INDIAN JUDICIARY AND CRIMINALIZATION OF POLITICS IN INDIA: A STUDY
22 – 25
Deepom Baruah ECONOMIC DETERMINANTS AND IMPACT OF FOREIGN DIRECT INVESTMENT IN INDIA: AN EMPIRICAL AND THEORETICAL REVIEW IN PRESENT GLOBALIZATION SCENARIO
26 – 31
Naresh Guduru and Ravi Chandra Anchuri ETHICAL ISSUES IN MARKETING RESEARCH: AN INSIGHT
32 – 35
Dr. Dhananjay Awasarikar EVOLUTION OF THE REGIONAL RURAL BANKSIN INDIA
36 – 53
Sulagna Das INSURGENCY AND HUMAN RIGHTS IN NORTH-EAST INDIA
54 – 56
Sujit Sutradhar GLASS CEILING EFFECTS
57 – 62
Dr. Payal Upadhyay TOP SOCIAL MEDIA UPDATES 2015:- A REVIEW OF POPULAR GLOBAL SOCIAL PLATFORMS
63 – 68
Ekta Bansal and Mamta PREDICTING THE FINANCIAL EFFICIENCY OF PUBLIC SECTOR TELECOM COMPANIES BSNL AND MTNL USING Z-SCORE
69 – 76
Sonia Gambhir and Puneet Garg ELEMENTARY EDUCATION AND HUMAN CAPITAL BUILDING: THE JHARKHNAD EXPERIENCE
77 – 82
Onkar Nath Mishra VAT AND GST REFUNDS Reena Kumari
83 – 85
International Journal of Advance and Innovative Research Volume 2, Issue 3 (I) : July - September , 2015
ISSN 2394 - 7780
STRATEGIC ANALYSIS: SUCCESS OF CONVENIENCE STORES OF MEXICAN ECONOMIC AND TRADE PROMOTION José G. Vargas-Hernández and Karina Edith Flores Valenzuela University Center for Economic and Managerial Sciences, University of Guadalajara, Jalisco, México ABSTRACT The objective of this research is to identify the various strategies implemented by the convenience store chain that dominates the retail market in the country for which a review will be some of the different scientific approaches available to explain the performance competitive organization. The results allow to conclude that implementation of a strategic framework is what determines the success of modern format stores in the market for retail that were subject this case study. Keywords: Acquisition, alliances, diversification, corporate strategy, vertical integration. 1. INTRODUCTION Businesses today are constantly faced with a globalized and competitive world that demands constant alertness to seize any market opportunity that guarantees their staying and would achieve the objective for which they were created. That is why no company can compete without the necessary strategies to achieve those objectives and it is the task of the owners or managers that such course of action is closely scrutinized. Thus, Leibenstein (1968) pointed entrepreneurship as a scarce resource in terms of being entrepreneurs who perform activities and actions associated with perception and pursuit of business opportunities. The objective of this research is to identify the various strategies implemented by the convenience store chain that dominates the retail market in the country. Because this business format in the country is in direct competition with the so-called “corner shops” belonging to the group of MSMEs, they areconsidered the engine of the economy for their contribution in generating employment and wealth for the country. This is the main reason why there isa remarkable growth of convenience stores in this sector, which it has been identified as a major threat and they really are. Not because it is increasingly opening more outlets for its more than 12,800 relatively affordable units which are few when compared with 947,248 relating to miscellaneous and grocery stores within the sector (DENUE, 2015), but for the set of strategies to support their competitive behavior and constant expansion. The approach so far made can highlight how the figure of the manager determines the success of the company, because although in structure and access to resources is not possible to establish points of comparison between a unit of traditional retail trade to a convenience store, both converge on the need to develop strategies being notorious the difference between a company that can reach individually to that supported by a corporate management despite presumably have the same business format. This being the starting point for determining the object of study of this research descriptive of the commercial chain OXXO-FEMSA. Corporate strategies are formulated by the highest level of the organizational structure and the action plan of a diversified company with all its scope to multi model business (Luna, 2010). Companies engaged in various industries detect expansion opportunities as Peng (2012) points to increase a company's business with different operations to current, facing the decision of how to do it, either through vertical integration by joining with others, establishing strategic alliances or diversifying its products. This combination of strategies is being observed in the competitive behavior that has been detonated in the unquestionable success of the convenience store chain driven by FEMSA among its other business units. Indicating the importance of the strategic approach for the competitive performance of companies arise the interest to identify which are those that have determined the success of convenience stores which has marked its difference from their direct competition and even traditional trade stores. This being a possible model to follow constrained by the availability of resources and structure that represents a major challenge for those seeking to venture into the retail market. So, the definition of competitive strategies is the key to survival in a globalized environment. The present study was developed through a descriptive analysis of the strategies adopted by the chain's convenience stores in the country that have allowed them a competitive advantage constantly expanding. To this end, it was made a literature review in strategic management that allowed the theoretical basis of competitive behavior observed from the perspective of agency theory, theory of resources and capabilities and industry-based theory. 1
International Journal of Advance and Innovative Research Volume 2, Issue 3 (I) : July - September , 2015
ISSN 2394 - 7780
2. BACKGROUND OF THE PROBLEM A. The retail industry in Mexico The retail trade is one of the main activities of the country as currently employs over other industrial and services sectors. Currently, the retail trade sector is involved in a fierce competition, because the supply has increased markedly and consumer needs are becoming more complex to meet each day. This has led to companies in this sector to establish various strategies to strengthen their competitive advantage. The convenience store format as derived from a combination of miscellaneous grocery stores format and convenience store originating in the United States, with particular characteristics that have grown and have great importance in the retail industry as what are location, size, service, speed and identification of needs. Mexico andseveral Latin American countriesthere have been changes inretailer consumerpreferencesbecause after the conceptionrootedin cornerconvenience storethat represents 35% of household consumptionwhile consumptioninconvenience store obtains already 47% of theconsumer spendingaccording to the analysisWorlpanel(Monex, 2014). Thesubsectorofretaildepartment stores and supermarketsis the generatorof 733, 430directjobs with a contribution of2.1% to the national GDP(ANTAD, 2015) through 40,056storesonly. NAICS (SCIAN) classification
Table 1Retailtaxonomy Format Description
Retailin grocery stores, groceries andsundries
Traditional
It is characterizedby theconsumer.
proximity
to
Supermarketsand department stores.
supermarkets Conveniences stores Price clubs
Integrates supermarkets, hypermarkets and warehouses. Near consumer, extended hoursofserviceand assortment. Wholesales
Pharmacies
Pharmacies
Source: Own elaboration based on dataINEGIandANTAD. The country has a total of 40,056 stores within the classification of supermarkets and department stores, equivalent to 24,864 square meters as a distribution channel. Of which 81% are convenience stores, being the commercial chain of FEMSA the one that represents 53% of the subsector. Figure 1: Integration of Retail Market
Source: Prepared with data from ANTAD (2015). B. Features of the structure of retail trade The characteristics of firms in the retail trade may be defined in terms of structure, size and differentiation of services. This is segmented into traditional trade and modern trade. So that SMEs find their place within the traditional format stores, which in terms of structure are serving the defining characteristics identified by the Bolton Committee for SMEs as companies that have a relatively small market share, have among their managers the owner, with a customized structure and lack of a formal management structure (Curran and Blackburn, 2001). While for modern format stores with outstanding convenience stores, it is observed that these work under the concept of subsidiaries of large firms with different business models or under a franchise scheme. 2
International Journal of Advance and Innovative Research Volume 2, Issue 3 (I) : July - September , 2015
ISSN 2394 - 7780
So that it is possible to observe differences in the competitive performance between the two types of format to be implementing multiple strategies within the main convenience stores. Its structure serves as the logic of a business model perceived as a set of assets, activities and structure of government assets to create value (Osterwalder, Pigneur, 2010). Have a strategic plan that defines the guidelines on how the business was managed, so that these strategic actions are appropriately selected to enable the use of all their resources in the best way and take advantage of opportunities created by the constant changes of the market that also it allows them to participate in various industries with the same technological base. These strategic decisions regarding revenues and profits trying to get these companies are made at the corporate level, so a well-defined corporate strategy is the key to creating competitive advantage (McDowell, 1994). This strategy is crucial because it is the way the company creates value through the configuration and coordination of multi-market activities i.e. is formed by measures which allow the position of businesses within various industries (Vargas-Hernandez, Guerra-Garcia,Bojorquez-Gutierrez, Bojorquez-Gutiérrez, 2014), which in turn has enabled them to have horizontal and vertical structures, geographic strategic deployments, diversification, among others that have enabled steady growth. 3. DEFINITION OF THE PROBLEM Through this research, it aims to identify the various strategies implemented by the convenience store chain that dominates the retail market in the country. This from the question arising from the problem that traditional trading companies are facing at the apparent threat of this business format of modern consumer. Thus, this research is trying to answer the question: Is the implementation of multiple strategies together what supports their competitive behavior and constant expansion of the convenience stores in México? 4. ASSUMPTION OF RESEARCH The implementation of a strategic framework determines the success and steady growth of convenience store modern format. 5. TARGET The objective of this research with the support of theories of resources and capabilities, industry-based approach and agency theory is to identify the various strategies implemented by the convenience store chain to dominate the retail market in the country. 6. JUSTIFICATION Perform strategic analysis of the business model followed by convenience stores, in specific at the Oxxo retail chain owned by FEMSA is to allow it to expand the vision of those competing in this sector. In effect, competition represents a powerful threat to those who continue to operate without have defined a business strategy that serves as a guide to direct actions towards a competitive behavior and not in relation to the number of units of this small business format that opens every day. This is a motive why it is highlighted how the figure of the manager determines the key factor to the success of the company, because it is independent of the size and resources available to both store formats thathave a point of convergence in need to establish strategies. Thus, to identify the key factors that are associated with the implementation of various strategies by the chains of convenience. This allows SMEs involved in the market of retail trade deal, to adopt strategic plans to face the current problems of the growing trend towards consumers by consumption in the modern format. 7. CONTEXTUAL FRAMEWORK A. History and overview of the company The objective of FEMSA's is to improve beer sales through outlets owned by the Company and to obtain information about consumer preferences. This was what incentive the entry to the retail industry, giving rise to FEMSA Trade in 1978, when the first two OXXO stores were opened. This strategy was successful in recent years, and since 2010 this chain acted as the main channel of the company, selling about 16% of all beer produced in 2010 and 40% of total sales in its convenience stores. It has also been an effective distribution channel for carbonated beverages fromother major business units of the company. The main strategy of OXXO retail chain is constantly expanding as it has developed a complex system to evaluate potential new stores, the mixture of suitable products and the most convenient format. This system combines demographics, data from nearby shops and consumer profiles to improve performance of its store by store allowing it to open 1,040, 1,120 and 1,132 new units in the years 2012, 2013 and 2014 respectively. This strategy included opening conveniences stores in non-traditional places such as shopping malls and airports, where they now have high traffic. OXXO stores currently operates 12,853, out of which 12,812 are located 3
International Journal of Advance and Innovative Research Volume 2, Issue 3 (I) : July - September , 2015
ISSN 2394 - 7780
throughout the country and 41 in Colombia, with a particularly strong presence in Northern Mexico offering about 2,744 products in 31 major categories. B. Business strategy FEMSA's business strategy is to use its trade position in the market for small format stores to grow profitably and efficiently. As the market leader, it has a deep knowledge of their markets and considerable experience in the operation of a chain of stores with a national presence allowing it to continue capitalizing on the market knowledge it has acquired through its existing stores. This has allowed it to develop its own business model with the advantage to identify optimal store locations. Market segmentation is an important strategic tool allows the firm to improve the operating efficiency of each location and the overall profitability of the chain. In addition to making substantial investments in IT to improve its ability to capture customer information and improve its overall operating performance through the integration of such systems within a network that enables communication across the company. As a strategy for revenue management, product categorization was implemented so that information was more efficient. The success of OXXO’s promotional strategies can be attributed to its ability to work together with its suppliers that has allowed it to developcapability to executing differentiated promotions, mixed and aimed at attracting new customer segments. Additionally, it has also developed the capability to offer more services to its consumers, such as payment services and other basic transactions. In addition to the strategy of strategic location of stores where from a thorough study of convenience turns to credit providers that enable it to fund its initial inventories to promoting rapid growth. The scale of operationsofthe retail chainis a competitive advantagethat allowsrealizing strategic allianceswith suppliersasone of thegoals is thatconsumersfind what they want.This is toensurethatthe chainhas 16CEDISwhereprovidersarelimitedin resourcesto distribute itsproducts throughthis chain.Since the mainstrategyis theconstantexpansion,much of investmentof FEMSAon the chaingoes tothe construction and openingofnew stores.During2014, it opened 1,132new stores. The amount investedby the companyin 2014was5,191 millionmnx, which wentto the addition ofnew stores,warehouses and improvementsto leased properties. Figure 2: Total Growths by Opening Stores
Source: Compiled fromdataFEMSA2014Annual Report. As part of OXXO’s management strategies that contribute to its competitive advantage is investment in staff training in order to promote loyalty, customer service and maintain a low staff turnover. Thus,its operation strategy for approximately 59% of the stores is operated by independent managers responsible for all aspects of the operation of the stores. The managers are commission agents and are not employees of the company. Each store manager is the legal employer of staff thereof; which in turn enableshim to maintain full control of operations and maintain out of the franchise scheme. The great expansion of chain stores is also due to it being only 11.2% of owners of business premises. The strategy of establishing long term leases with third parties gives it the opportunity to create flows for the start of operations of each point. C. Competition The retail market is highly competitive in the format of convenience stores. The OXXO´s chain faces competition from small format stores like 7-Eleven, Super Extra, Super City, Circle-K, as well as numerous other retail chains around Mexico, other regional stores as well as traditional format stores (Miscellaneous). This competition is therefore for consumers and new locations for stores as well as for the managers to operate 4
International Journal of Advance and Innovative Research Volume 2, Issue 3 (I) : July - September , 2015
ISSN 2394 - 7780
them. The average store size is about 104 square meters, according to all accompanying structures and the number of units inside the market; they participate by 77% in the market share of the trade sector in retail convenience stores nationwide. Figure 3: Market Share of the Convenience Store.
Source: Prepared by Euromonitor International data D. Vertical integration This retail chain also operates following vertical integration strategies because it has a wide range of private label products which is growing both in size and in sales. This in turn also has allowed it take convenience stores to displace and move to other brands available on shelf space and compete on price, giving them the opportunity to offer lower prices than the competition. They are Andatti, Bitz, Chevere, Del Marqués, Azalea, Nutradog, among others. E. Diversification strategies 1). Entry on drug market Following a growth strategy maximizing the opportunity, the company entered the market of pharmacies in Mexico since 2013. This was through acquisition of pharmacy YZA operating 330 stores at the date of acquisition. Later this transaction provided the opportunity to acquire Modern Pharmacy (Farmacias Modernas). In 2014 it agreed to acquire 100% Pharmacy pharmakon (Farmacias Farmacon), which highlights the capacity and ability of these shops to venture into different markets. 2). Entry into the sector Quick Service Restaurants of fast food. Within the guidelines of its growth strategy opens a new route expansion within the quick service restaurant sector. Through the acquisition of 80% of Doña Tota chain leader in the industry in the Northeast country. 3). Entry on Gas Sector. OXXO enter this sector since 1995 working through agreements with third parties that have franchises of PEMEX created the brand OXXO Gas. Given the chance that changes in the Energy Reform in Mexico, it opens the way for free foray into the sector so within the next expansion plans include the acquisition of other stations.The content of this section has as a source of information the 2014 Annual Report available on its website FEMSA (2014). 8. THEORETICAL FRAMEWORK A. Theory of resources and capabilities The company is a collection of productive resources physical, human and intangible, where the growth of the company is defined by how are managed the same (Penrose, 1959). The overall purpose of the company is to combine equity of own resources with other resources acquired abroad so that generate profits. However, under this approach, the company growth is limited by the capacity of management, market uncertainty and risk. A company is successful to the extent that its combined resources will allow it to generate income and be able to respond to market changes (Wernerfelt, 1984). An advantage of resource management is that the company has an infinite number of combinations that can be developed to specialize or diversify. In the search for diversification coupled with the rivalry of the companies they pursue perfection of their organizational capacities generating continued growth of their companies. These capabilities include the skills of middle and upper management, the lower management and workforce (Chandler, 1990). A company with a competitive advantage that achieves superior results to that of their competitors’ positions, it is credited with the protection of a number of scarce resources that makes it impossible for competitors to imitate or substitute, which expresses the opportunity cost of having them. 5
International Journal of Advance and Innovative Research Volume 2, Issue 3 (I) : July - September , 2015
ISSN 2394 - 7780
These necessary resources to implement a strategy can be purchased at the market factors (Barney, 1986). This market has an imperfect competition, since companies can only get a yield above normal only if it has superior information, luck or both. An acquisition strategy based on resources according to Salter and Weinhold (1980) can focus on getting more of these resources that already has and get those that combine effectively with it already. This relationship product-resource opens the possibility of considering the different ways in which the company can develop a growth strategy. However, until now the theory considers only the resources that occur in conjunction with products and how to exploit this condition to generate a competitive advantage. More recent research has focused on developing a theory of resources and capabilities, which proposes that the success of the organization is based on the income generated by especially valuable resources where these capabilities result in the ability of the company to integrate and build new combinations of resources that result in innovative competitive advantages that enable the firm to adapt the changing environment. B. Agency theory This approach is part of noting that all individuals have definite preferences about risk, i.e.there are those who are lovers or adverse to situations with high uncertainty. Agency theory is a condition for cooperation between owner-agent to achieve a common purpose. The problem arises when owner-agent diverge in their interests and have different attitudes towards risk which hampers the condition thus raising agency costs. Therefore as this is the one in charge to solve the problems that may occur in the relationship between owner-agent attempts to describe this relationship use the contract as a means of solution and cost reduction (Jensen and Meckling, 1976) determining who is more efficient. One of the tasks of the agency theory is to create a system of incentives to mitigate the opportunism of the agents so that personal interests are aligned with the interests of the principal and the conflict is minor so in turn agency costs are smaller too. Although the Director is of the kind that cares about being efficient and low opportunism resists certain conditions, it cannot expected to always he is acting in good faith. He somehow expects his reward either recognition or money. Agency theory has been developed along two lines: positivist and principal-agent (Jensen, 1983). Both share as unit of analysis the contract between director and principal given certain assumptions about people, organizations and information. On this basis there are different situations to be assessed to determine what type of contract is the optimum between principal-agent according to the propositions of Eisenhardt (1989):The performance contract is optimal when there is a low risk aversion of the principal, and he does not be afraid to delegate risky tasks to the administrator and he is limited to get results, or when there is a conflict of interest as the two converge in oneself or when the expected results are easy to measure. In such cases for the owner is better to define what is the incentive on the results expected for the agent to align his behavior to achieve the results and therefore he can receive his benefits. On the other hand, the contract behavior is most effective when the outcome depends on the development of certain behaviors for which the owner develops information systems directing to whatmust do exactly the agent and will ensure what he is waiting, or when he works in environment of high uncertainty where it is difficult for the owner to delegate situations of high risk. Therefore, the principal opts for monitoring the behavior of the agent to ensure that his goal is achieved. Also the owner considers the fact that the administrator tasks are not something programmable which always will generate the same result by implying decisions that must be monitored to avoid opportunism. Therefore,it should be monitored his behavior. And finally, when the relationship is expected to be long term it is preferable to have such contracts because they allow the owner to learn from the agent and generate a view that allows more objectively evaluate his behavior. An analyst should also take into account that, while the agency theory studies the relationship between owners and agents, this theory should not be seen as isolated issue that has similarities with other currents of organizational knowledge to help us understand human behavior and its impact on the business performance. Well aware that the incentives are the best way to achieve cooperative behavior and opportunism will always be present given the limited rationality of people. Moreover, it can be said that the contributions of agency theory are information processing, which has a cost, and can be purchased, and the implication that companies can invest in information systems with the end to control the agent opportunism. Agency theory takes as its starting point the assertion of Peng (2010) on the firm requires governance which is possible through the corporate governance tripod, pointing to it as a possible tool of competitive advantage for 6
International Journal of Advance and Innovative Research Volume 2, Issue 3 (I) : July - September , 2015
ISSN 2394 - 7780
the company. It is making it the agency theory in charge of studying the corporate governance in the management of the company, arising from the need from the owner to delegate on an agent power and management functions for strategic decision making. This it is not easy because as Berle and Means (1932) point to the separation of ownership and control creates a conflict of divergent interests between owners and managers. C. Industry based approach The traditional paradigm of industrial organization is to provide a model for the formulation of strategy. And from this, it is defined the strategy by how a company tries to compete with its environment by choosing key goals (Andrews, 1971). A formulation of effective strategy according to the model involves the relationship of fourth key elements: company, industry, implementations of key value for the company and the expectations of society. That is, the success of the company depends on the right combination of internal skills and values of its external environment. Itself implies that the performance of the company's market depends mainly on the characteristics of the industry environment where competes withwhat determines the behavior of the company, whose behavior then determine the collective market performance (Bain, 1968: Mason, 1953). The industrial organization model proposes that the performance of the company measured on profitability and cost minimization depends on the decision of the individual firm of where to orient objectives and these in turn are defined by the structure of the industry to which it belongs considering to the context in which competition is generated. So, this will allowpredicting performance under these circumstances that can be expected in the market. This explains the importance indicated by Porter (1981) to generate a perspective of industrial organization that provides a methodology for formulating strategy focused on measuring the performance of the company in a competitive environment. The firm takes the necessary decisions for its behavior oriented to properly allocate its resources and develop a competitive advantage allowing facilitating its interaction in the market. Corporate strategies are formulated by the highest level of the organizational structure and the action plan of a diversified firm reaches its full multi-business model (Luna, 2010). Companies engaged in various industries are created when a company in one country detects industry and expansion opportunities in other industries and countries. As Peng (2012) points out,to increase a company's business operations with other different to the current ones, facing the decision of how to do it if through vertical integration by joining with other companies or diversifying their products. To implement its strategies, a firm should adapt a multidivisional structure, design an effective control system in all industries and create corporate culture. This is important to ensure that the company make proper use of its resources and capabilities, control costs and achieve its growth target. 1). Strategic alliances Strategic alliances are voluntary agreements to share exchange and develop knowledge and information together so that businesses can obtain resources and capabilities that they are scarce and they cannot acquire on their own. This gives them the opportunity to gain mutual benefits that allow them to sustain their competitive advantage. Generally the strategic alliances generated between companies to compete together and reduce costs, risks and uncertainty. An important feature is that in the authentic alliance the companies involved in it keep its structure of independent government and autonomous capacity of government decisions but this autonomy is limited by its commitments to the alliance partners. Usually partnerships are possible through contracts and agreements where control and autonomy are limited only (Sainz, 2014). An alliance within the considerations based on the industry approach through the five forces model of Porter (1981), which include among them as relevant to the partnership strategy or strategic alliance helps to mitigate the effects of the barriers to entry to new markets and possibility of vertical alliances bottom-up and top-down. For example, alliances with suppliers to ensure quality or other companies in the same market and compete with heterogeneous products together generating products through a combination of technologies. The focus of resources and capabilities that indicates the formation of a partnership or alliance within the framework VRIO, because as mentioned before, one of the objectives of the companies is the complementarity of resources, so it should look for the creation of value allowing to be obtained at lower costs. Rarity is related to the characteristics of the partner with the attributes required to establish a transfer of information on those capabilities that can also be imitated by the partner company. Thus, it can establish a form of organization that the rest of the competition not may have, allowing partner companies to position with a competitive advantage (Peng, 2010). 7
International Journal of Advance and Innovative Research Volume 2, Issue 3 (I) : July - September , 2015
ISSN 2394 - 7780
As can be seen up to now, strategic alliances concentrate on teamwork so as the same with people, to select the partnerindicated requires some degree of affinity for a partnership to work; it also requires a certain degree of confidence. Finally, partnerships and alliances are efficient in the extent to which produce mutual benefits such as access to new markets, diversification of product lines that create value to the company and contribute to its competitive advantage through this as internal and external a processes (Navas, Guerras, 2002). 2). Acquisitions An acquisition is the transfer of control of the operations and management of a company to another so that the latter becomes part of the first. That is, the purchase is made by one company over another, without the latter losing its characteristics but in which their owners no longer have full control of it (Pérez, 2013). A common feature is that the bidding company is larger than the target company and even getting to pay a higher value than the market value of its shares. The effect caused by the non-existence of profit by taking control of a company through corporate acquisitions, is explained by the hypothesis of arrogance that predicts an increase in the market value of the target firm which exceeds the average decline in the value of the bidding company (Roll, 1986). Although the situation described in the preceding paragraph may occur, this is not exactly the way the acquisitions operates, which shows that the market is acting inefficiently occasionally because of the irrational actions of some economic agents. On the other hand, the actual motivation for the company to make an acquisition is more related to corporate control structure between the companies involved (Vasco, Cortés, Gait an& Duran, 2014), as for a corporate is easier to integrate the company in structure to work on a scheme of merger or alliance that may involve a number of unnecessary transaction costs. 3). Vertical integration Vertical integration strategies are those courses of action that allow the company to make decisions about their value chain, focusing especially on the importance that plays its suppliers in its ultimate purpose. So, the measures that can be considered by the company are focused on the possibility of acquiring suppliers or distributors, or improve buyer-supplier relationship to exert a degree of bargaining power. Vertical integration is the acquisition by the company of suppliers or distributors. So the company can acquire a manufacturer supplying a wide range of products, or a key product allowing it to develop its own brand products which in turn gives new options of products and cost savings (Susan, 1994). This is a very common practice in companies with a strategy of expansion and constant growth. Another way that can arise is through the centralized physical distribution centers serving largely to strengthen the negotiating position of the company with suppliers, improve operating efficiency and supply to the end of the chain that result in improvement customer service (Fernie, and McKinnon, 1991). A change in buyer-supplier relationship is also a viable strategy of vertical integration when the company in his role as purchaser has the capability to exercise power over the provider controlling prices, products and even about the innovations of products that his provides you. The bargaining power of the company is determined by its size, so if this is big enough and the supplier is vulnerable to the company, it is possible that this change of relationship can be generated (Grant, 1987). 9. METHOD For the preparation of this research, it was applied an exploratory qualitative analysis approach. The research was turned to review literature sources, in addition to foundations and public information statistics from annual reports issued by the organization. This was collected and only was considered those that will bring and allow makinginferences to answer research questions were considered. This through a descriptive study, that is, analyzing how it is and the phenomenon observed in the study (Hernandez-Sampieri, 1991) manifests. They are considered as dependent variable of convenience stores in the retail market and corporate strategies as independent variables (Vargas-Hernández, et. 2014). 10. CONCLUSIONS Regarding the research assumption on the implementation of a strategic framework is what determines the success of modern format stores in the market for retail. It can be inferred that there is evidence of wellbeing because the achievementsof convenience stores after a review of the number of strategies that the company subject of the case study implemented.The OXXO-FEMSA finds its livelihood within the framework of some of the different scientific approaches available to explain its competitive performance of the organization and that is one of the purposes of the strategic management theories.
8
International Journal of Advance and Innovative Research Volume 2, Issue 3 (I) : July - September , 2015
ISSN 2394 - 7780
The focus of resources and capabilities can explain some of the behaviors of the conveniences stores are oriented toward a vision of alert to changes in the environment to adapt the internal processes and respond in the best way available. In addition to much of their competitive advantage that is determined by making optimal use of their resources and capabilities acquired throughout their history that allowstaking every opportunity to reach the market. On the other hand, the main strategy of OXXO-FEMSA has to be distinguished from the rest through the implementation of strategies that seek to optimize its most valuable resources being the reputation of its brands and the knowledge gained through experience. Within the framework of theories also they have shown how the convenience stores have always gone to the complementarity of resources. Agency theory can explain how the company strategically manages this problem of asymmetric information between owner-agent through independent agents working on commission contract where disclaims without losing control over this responsibility. This reduces the chances of opportunism and ensures their commitment to obtaining the results expected by the company. This allows it to operate under a degree of certainty and better control over the operations, resulting in the possibility of opening its 1000 annual point sales that has been set as a goal. Finally,industry-basedapproachexplains howin findingto maintainitscompetitive advantage andmarket positiontobe detected inthisnewopportunitythe companyfocuses itseffortstoseize, through variousstrategiessuch asvertical integration.Even,it was that gaverise to thischain of storeswhose initial objectivewas to providethe ownerof aneffectivedistributionchannel.Now, itmakespossible to haveits own brands, Strategic alliances largelyexpressedwith its supplierstobethisoneimportantstrategy toprovidefundingin itsinitial inventoriesper store. Also,to partakeof itskeypromotion strategiesandacquisitionsthroughnewbusiness formatshave allowedit to expandand compete inniche markets. REFERENCES 1. Accenture, GS1 México y Storecheck (2012).Hacia el Alto Desempeño. PulsoEstratégico, 32. 2. Andrews, K.R (1971). Concept of corporate strategy. T~P New York: Dow Jones-Irwin. 3. ANTAD (2015).EstudiosEconómicosmarzo 2015.Recuperado de http:www.antad.net , 01 de mayo de 2015. 4. Bain, J.S (1968). Industrial organization.2nd ed. New York: Wiley. 5. Barney, J.(1986), Strategic Factor Markets: Expectations, Luck, and Business Strategy,Management Sci, 1231-1241. 6. Berle,A.A. and Means, G.C. (1932). The Modern Corporation and prívate Property.New York: Hatcourt, Brace &World. 7. Curran, J., & Blackburn, R. (2001).Researching the Small Entreprise. United Kingdom: Sage. 8. Chandler, A. (1990). Scale and Scope: The dynamics of Capitalism. Cambridge, MA: Harvard University Press. 9. DENUE (2015).Análisis de la demografía de los establecimientos.Recuperado de http:www.inegi.org.mx, 14 de Abril de 2015 10. Eisenhardt, K. (1989). Agency theory: An assessment and review. Academy of Management Review, 14: 57-74. 11. Euromonitor International (2014). CadenaComercialOxxo S.A. de C.V. In Retailing Mexico March 2014.Recuperadoel 13 de abril de 2015 de http: www.euromonitor.com 12. FEMSA (2014) InformeAnual 2014: Informaciónpública BMV. Recuperado de http: www.femsa.com 13. Fernie, J. and McKinnon, A. (1991).The Impact of Changes in Retail Distribution on a Peripheral Region: Khe Case of Scotland, International Journal of Retail & Distribution Management, Vol. 19 No. 7, pp. 2532. 14. Grant, R. (1987).Manufacturer-Retailer Relations: The Shifting Balance of Power, in Johnson, G. Ed., Business Strategy and Retailing, John Wiley & Sons, Chichester. 15. Hernández Sampieri, R. (1991). Metodología de la investigación. México: McGraw Hill. 16. Jensen, M. (1983) Organization theory and methodology.Ac- counting Review, 56, 319-338. 9
International Journal of Advance and Innovative Research Volume 2, Issue 3 (I) : July - September , 2015
ISSN 2394 - 7780
17. Jensen, M., &Meckling, W. (1976). Theory of the firm: Managerial behavior, agency costs, and ownership structure. Journal of Financial Economics, 3, 305-360. 18. Leibenstein, H. (1968). Entrepreneurship and Developement.American Economic Review, 58, Nueva York, 67-86. 19. Luna González, A.C. (2010) Administraciónestratégica, Grupo Editorial Patria, 1era Edición.Pp.163-164. 20. Navas, J.E., Guerras, L.A. (2002). La DirecciónEstratégica de la Empresa, Teoría y Aplicaciones, ed. Civitas, 3ª edición, Madrid. 21. Mason, E.S (1939). Price and production policies of large-scale enter- prises. American Economic Review, March, 29, 61-74. 22. Monex (2014).Cobertura FEMSA. Uribe Boyzo Veronica. Recuperado de http:www.monex.com 15 de Abril de 2015. 23. Osterwalder, A. &Pigneur, Y. (2010), Business Model Generation: A Handbook for Visionaries, Game Changers, and Challengers. New Jersey: Wiley Publishers. 24. Peng M. (2010) Estrategia Global.CENGAGE Learning pp.210-245. 25. Peng, M.W. (2012) Estrategia Global. Editorial Cengage Learning, 2da Edición. pp.254-259 26. Penrose,E.T. (1959). The Theory of growth of the firm. New York: John Wiley & Sons. 27. Pérez Ramírez, R. (2013). Privatizaciones, fusiones y adquisiciones: lasgrandesempresas en México. EspaciosPúblicos, 16(37) 113-140. 28. Porter, M. (1981).The contributions of industrial organization to strategic management.Academy of Management Review, 6: 609-620. 29. Sainz de Vicuña Ancin, J.M. (2014) Alianzasestratégicas en la práctica.PrimeraEdición. ed. ESIC. 30. Susan McDowell Mudambi, (1994). A Topology of Strategic Choice in Retailing, International Journal of Retail & Distribution Management, Vol. 22 Iss 4 pp. 32 – 40 31. Vasco, M., Cortés, L. M., Gaitán, S. &Durán, I. A. (2014).Fusiones y adquisiciones en Latinoamérica, gobiernocorporativo y modelogravitacional. Journal of Economics, Finance and Administrative Science, 19(37) 108-117. 32. Vargas-Hernández, J.G., Guerra-García, E., Bojórquez-Gutiérrez A., Bojórquez-Gutiérrez (2014).GestiónEstratégica de lasOrganizaciones; Ciudad Autónoma de Buenos Aires: Elaleph.com
F.,
10
International Journal of Advance and Innovative Research
ISSN 2394 - 7780
Volume 2, Issue 3 (I) : July - September , 2015
A STUDY OF CUSTOMER’S USAGE PATTERN ABOUT ICT TRENDS IN BANKING W.R.T. MUMBAI AND THANE REGION Dr. Shraddha Mayuresh Bhome Visiting Faculty, Gurunanak Khalasa College, Matunga, Maharastha INTRODUCTION The adoption of ICT in banks has improved customer services, facilitated accurate records, provides for Home and Office Banking services, ensures convenient business hour, prompt and fair attention, and enhances faster services. The adoption of ICT improves the banks’ image and leads to a wider, faster and more efficient market. It has also made work easier and more interesting, improves the competitive edge of banks, improves relationship with customers and assists in solving basic operational and planning problems. This paper work analyses the impacts made by the Information and Communication Technology in the Banking Industry. The application of information and communication technology concepts, techniques, policies and implementation strategies to banking services has become a subject of fundamental importance and concerns to all banks and indeed a pre-requisite for local and global competitiveness. ICT directly affects how managers decide, how they plan and what products and services are offered in the banking industry. It has continued to change the way banks and their corporate relationships are organized worldwide and the variety of innovative devices available to enhance the speed and quality of service delivery. REVIEW OF LITERATURE 1. Moghadam, Baytollah Akbari; Behboudi, Mehdi; Jafari, Farzaneh(Dec 2012) in their research say that customers are encouraged to utilize ICT banking as first priority. Increasing the customer’s arousal by ICT advertisements to use ICT banking creates a positive attitude toward bank’s brand, which in-turn is the key factors in ICT banking effectiveness. 2. Jahangir, Nadim; Parvez, Noorjahan(Dec 2012) research states that ICT banking needs, compatibility, convenience, and communication on customer adaptation. In the context of private commercial banks in order to attract more users to ICT banking, it is not going to be enough only to introduce an ICT banking system, but they need to develop the belief of usefulness of the system among their users. The importance of ICT banking needs and the ease of using it should be acknowledged by demonstration on trial basis. 3. Munusamy, Jayaraman; De Run, Ernest Cyril; Chelliah, Shankar; Annamalah, Sanmugam(Dec 2012) in their research found that younger consumers are more likely to adopt ICT banking. The study states that consumers in the age group below 25 years old are the major contributor to ICT banking. 4. Kesharwani, Ankit; Bisht, Shailendra Singh(2012) stated in their study that the main purpose was to extend the technology acceptance model (TAM) in the context of ICT banking adoption in India under security and privacy threat. The researchers have incorporated various inhibitors of ICT banking which restrict the use of ICT banking adoption under “perceived risk”, and also consider the role of the bank web site as a key determinant of perceived risk and of perceived ease of use in the context of ICT banking services. The paper reveals that perceived risk has a negative impact on 11ehavioural intention of ICT banking adoption and trust has a negative impact on perceived risk. A well-designed web site was also found to be helpful in facilitating easier use and also minimizing perceived risk concerns regarding ICT banking usage. 5. Patsiotis, Athanasios G; Webber, Don J; Hughes, Tim (Dec 2013) found that personal capacity is an important determinant of ICT banking. Use of it in a standard, non-sequential approach has no significant effect when the model is sequential. Results suggest that policymakers should emphasize useful attributes of ICT banking when attempting to increase its usage by people who already use the ICT. OBJECTIVE OF THE STUDY 1. To examine the awareness of ICT banking among customers w.r.t. Gender and
Occupation.
2. To analyze the usage of ICT in banking by respondent customers. 3. To suggest measures for effective utilization of ICT banking.
11
International Journal of Advance and Innovative Research
ISSN 2394 - 7780
Volume 2, Issue 3 (I) : July - September , 2015 RESEARCH METHODOLOGY RESEARCH UNIVERSE SAMPLE SIZE DATA COLLECTION DATA DATA ANALYSIS TOOLS
MUMBAI AND THANE COMMERCIAL BANKS 25 STRUCTURED QUESTIONNAIRE PRIMARY AND SECONDARY DATA PERCENTAGE TECHNIQUE , CHI-SQUARE TEST, MEAN, KRUSKAL WALLIS TEST, MANN-WHITNEY U TEST RESULT
HYPOTHESIS OF STUDY 1. Ho1: All the reasons for usage of ICT in banking are equally preferred. H11: All the reasons for usage of ICT in banking are not preferred equally. 2. Ho2: There is no significance of difference between the average preference by male and female. H12: There is significance of difference between the average preference by male and female. 3. Ho3: There is no significance of difference between the average preference by graduate and post-graduate. H13: There is significance of difference between the average preference by graduate and post-graduate. ANALYSIS AND INTERPRETATION OF DATA 1. Ho1: All the reasons for usage of ICT in banking are equally preferred. H11: All the reasons for usage of ICT in banking are not preferred equally. Reasons Curiosity
TABLE 1: MEAN RANK TABLE N
Mean Rank
25
90.66
Inconvenient bank Time (24X7 service)
25
70.58
Inconvenient Branch location
25
79.08
Faster Transaction / information
25
71.84
Safe and secure
25
82.08
Low service charge
25
99.84
Online shopping
25
121.92
Source: Primary Data TABLE 2: KRUSKAL WALLIS TEST Test Statisticsa,b Chi-Square Df p-value a. Kruskal Wallis Test b. Grouping Variable: Index1
Curiosity 19.587 6 .003
INTERPRETATION Since p-value for the Kruskal-Wallis test is less than that of 0.05 indicates that there is significance of difference between the average rankings for reasons. SO we reject null hypothesis and conclude that some of the reasons are preferred more than some others. From mean ranks table we can conclude that online shopping is the highest preferred reason for internet banking. 12
International Journal of Advance and Innovative Research Volume 2, Issue 3 (I) : July - September , 2015
ISSN 2394 - 7780
Ho2: There is no significance of difference between the average preference by male and female. H12: There is significance of difference between the average preference by male and female. TABLE 3: AVERAGE RANKING WITH RESPECT TO GENDER Group Statistics gender N Mean Std. Deviation Std. Error Mean Curiosity Male 11 2.73 2.284 .689 Female 14 3.79 2.694 .720 Inconvenient bank Time (24X7 Male 11 2.36 1.120 .338 service) Female 14 2.36 2.240 .599 Inconvenient Branch location Male 11 2.73 2.054 .619 Female 14 2.71 2.301 .615 Faster Transaction / information Male 11 2.27 1.737 .524 Female 14 2.50 1.605 .429 Safe and secure Male 11 3.27 2.240 .675 Female 14 2.50 1.605 .429 Low service charge Male 11 3.64 2.693 .812 Female 14 3.64 1.737 .464 Online shopping Male 11 5.45 2.207 .666 Female 14 4.14 2.507 .670 TABLE 4: Mann-Whitney U test result Test Statisticsb Curiosity Inconvenient Inconvenient Faster Safe and bank Time Branch Transaction secure (24X7 location / service) information Mann-Whitney U 61.500 64.000 76.000 67.500 59.500 Wilcoxon W 127.500 169.000 142.000 133.500 164.500 Z -.866 -.740 -.057 -.546 -.980 p-value .387 .459 .955 .585 .327 a. Not corrected for ties. b. Grouping Variable: gender
Low service charge
Online shopping
72.000 177.000 -.278 .781
48.000 153.000 -1.622 .105
INTERPRETATION Since p-value for Mann-Whitney U test is greater than that of 0.05 indicates no significant difference between the average rankings for when compared between male and female for each of reason for respondent to open an Internet bank account. Ho3: There is no significance of difference between the average preferences by graduate and postgraduate. H13: There is significance of difference between the average preferences by graduate and post-graduate. TABLE 5: AVERAGE RANKING WITH RESPECT TO EDUCATION Group Statistics Education N Mean Std. Deviation Std. Error Mean Curiosity Graduate 15 2.93 2.712 .700 Post graduate 10 3.90 2.234 .706 Inconvenient bank Time Graduate 15 2.20 1.781 .460 (24X7 service) Post graduate 10 2.60 1.897 .600 13
International Journal of Advance and Innovative Research
ISSN 2394 - 7780
Volume 2, Issue 3 (I) : July - September , 2015 Inconvenient Branch location Faster Transaction / information Safe and secure Low service charge Online shopping
Graduate Post graduate Graduate Post graduate Graduate Post graduate Graduate Post graduate Graduate Post graduate
15 10 15 10 15 10 15 10 15 10
2.67 2.80 2.40 2.40 2.40 3.50 3.53 3.80 4.20 5.50
2.350 1.932 1.682 1.647 1.765 2.014 2.386 1.874 2.859 1.354
Mann-Whitney U test result: Test Statisticsb Curiosity Inconvenient Inconvenient Faster Safe and bank Time Branch Transaction secure (24X7 location / service) information Mann-Whitney U 56.000 65.000 73.500 73.500 53.500 Wilcoxon W 176.000 185.000 193.500 193.500 173.500 Z -1.075 -.577 -.086 -.087 -1.220 p-value .282 .564 .932 .930 .222 a. Not corrected for ties. b. Grouping Variable: education
.607 .611 .434 .521 .456 .637 .616 .593 .738 .428
Low service charge
Online shopping
71.500 191.500 -.197 .844
61.000 181.000 -.793 .428
INTERPRETATION Since p-value for Mann-Whitney U test is greater than that of 0.05 indicates no significant difference between the average rankings for when compared between graduate and post-graduate for each of reason for respondent to open an Internet bank account. FINDINGS AND CONCLUSION There is significance of difference between the average rankings for reasons. SO we reject null hypothesis and conclude that some of the reasons are preferred more than some others. From mean ranks table we can conclude that online shopping is the highest preferred reason for internet banking. There is no significant difference between the average rankings for when compared between male and female for each of reason for respondent to open an Internet bank account. There is no significant difference between the average rankings for when compared between graduate and post-graduate for each of reason for respondent to open an Internet bank account. SUGGESTIONS Banks should create awareness among the customers about use of ICT in banking apart from online shopping. They should take awareness programmes very often to educate customers. REFERENCES 1. MOGHADAM, BAYTOLLAH AKBARI; BEHBOUDI, MEHDI; JAFARI, FARZANEH. Does ICT Advertising Affect the ICT Banking Effectiveness? A Three Dimensional Model for Iran .Journal of ICT Banking & Commerce. Dec2012, Vol. 17 Issue 3, Special section p1-16. 16p 2. Patsiotis, Athanasios G; Webber, Don J; Hughes, Tim. ICT shopping and ICT banking in sequence: An explanatory case study .Journal of Financial Services Marketing. Dec2013, Vol. 18 Issue 4, p285-300. 16p.
14
International Journal of Advance and Innovative Research Volume 2, Issue 3 (I) : July - September , 2015
ISSN 2394 - 7780
3. Jahangir, Nadim; Parvez, Noorjahan. Factors Determining Customer Adaptation to ICT Banking in the Context of Private Commercial Banks of Bangladesh.Business Perspectives & Research. Jul-Dec2012, p2536. 12p. 4. Kesharwani, Ankit; Bisht, Shailendra Singh. The impact of trust and perceived risk on ICT banking adoption in India An extension of technology acceptance model. International Journal of Bank Marketing. 2012, Vol. 30 Issue 4, p303-322. 20p. 5. MUNUSAMY, JAYARAMAN; DE RUN, ERNEST CYRIL; CHELLIAH, SHANKAR; ANNAMALAH, SANMUGAM. Adoption of Retail ICT Banking: A Study of Demographic Factors .Journal of ICT Banking & Commerce. Dec2012, Vol. 17 Issue 3, Special section p1-14. 14p. 6. Yousafzai, shumaila (2012), A literature review of theoretical models of ICT banking adoption at the individual level. Journal of Financial Services Marketing 17 (3) pp. 215-226.
15
International Journal of Advance and Innovative Research Volume 2, Issue 3 (I) : July - September , 2015
ISSN 2394 - 7780
CONFLICT MANAGEMENT: A TOOL FOR TEAM BUILDING Dr. V. K. Goyal1 and Dr. Tazyn Rahman2 Dean & Professor, Jaipuria School of Business, Indirapuram, Ghaziabad Dean1, Jaipuria Institute, Indirapuram, Ghaziabad 1
ABSTRACT Any organization is having people working in different departments and at different levels with different responsibility. Most of the roles and responsibilities are inter dependent among group of people. Conflict is an inevitable situation in any group of people; be it a family, society or any organization working for commercial or non-commercial goals. There is a conflict even between parents & children, husband & wife, brothers & sisters, and any other group. Thus conflict is a common phenomenon at any workplace. However Conflict Management can be used as a tool for improving overall performance of an organization. This paper deals with two types of conflicts namely Defensive Blame Game and Offensive Blame Game. Then it tries to find out why conflicts arise. The authors firmly believe that it is important to know the reasons or root cause of the problem before efforts can be made for finding solutions. This paper deals with using conflict management for improving performance of an individual or group or an organization. Keywords: Conflict, people, organization, blame game INTRODUCTION Before we discuss on conflict management, we need to address some basic questions in very brief such as: What is a conflict? Why there is a conflict? Can we avoid conflict? Can we use conflict for organizational gains? What is a conflict? Conflict can be explained as clash of interests, values, actions, views or directions. Conflict is an inevitable situation where the interests, needs, goals or values of involved parties interfere with one another. Conflicts are barriers for smooth working, decision making process, or create competing coalitions or reduce productivity. Conflict is a clash of interests, values, actions, views or directions (De Bono, 1985). Conflict refers to the existence of that clash. Conflict is initiated the instant clash occurs. Generally, there are diverse interests and contrary views behind a conflict, which are revealed when people look at a problem from their viewpoint alone. Conflict is an outcome of organizational intricacies, interactions and disagreements. It can be settled by identifying and neutralizing the etiological factors. Once conflict is concluded it can provoke a positive change in the organization. When we recognize the potential for conflict, we implicitly indicate that there is already a conflict of direction, even though it may not have yet manifested itself as a clash. Confliction is the process of setting up, promoting, encouraging or designing conflict. It is a wilful process and refers to the real effort put into generating and instituting conflict. Deconfliction is the annihilation of conflict. It does not refer to negotiation or bargaining, or even to resolution of conflict: it is the effort required to eliminate the conflict. Why there is a conflict? Root cause of conflict is disagreement among people. People disagree because they see things differently, want different things, have different thinking styles which encourage them to disagree, or are predisposed to disagree. Conflicting situations arise because of fear, force, fair practices or limited funds. Fear is an imaginary concern for future. Force of any kind initiates and concludes conflicts. Fair practice is the sense of fairness, which determines the moral values of an individual. Tangible as well as intangible costs may provoke conflict during availability of limited funds. Interpersonal conflicts arise because of differences in personality, perceptions, status and ideological and philosophical outlooks. Other causes of conflict can be communication gaps; personality differences; substandard performance; disputes over approaches, responsibility and authority; lack of cooperation; or competition for limited resources. Can we avoid conflict? Conflicting situations are very often unavoidable but effects can be easily changed towards win-win situation for all. Also, it may be possible to minimize the impact of conflicts on the performance of any group of people.
16
International Journal of Advance and Innovative Research Volume 2, Issue 3 (I) : July - September , 2015
ISSN 2394 - 7780
Can we use conflicts for organizational gains? Conflicting situations result in negative and positive effects. This situation helps us in deciding strategies for reducing negative impacts and increasing the positive atmosphere. This approach should help in diffusing more serious conflicts. RESEARCH METHODOLOGY The authors have tried to use Causal Research in this paper as this paper tries to find out the relationship between the Conflict and the cause for this conflict. WHAT CAUSES CONFLICT? Aforesaid deliberations leads to a situation that conflicts are inevitable and therefore there has to be some reason or cause for the conflicts and conflicting situations. There can be two types of conflicting situations as under: 1. Blame Game – Defence: Here all blame one scapegoat.
2. Blame Game –Offence – Here every one blames all others.
Both the above types of conflicts are harmful for individuals as well as organisations. We need to analyze the causes for both the types of conflicts. One common cause identified in this paper is that everyone thinks he/she is right and the other one is wrong.
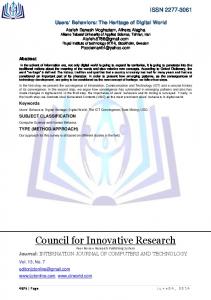
Above picture depicts very popular principle of “Right Hand Rule”. It has been used to explain the effect of blame game. One must realize that when we show o one finger towards someone the other three fingers are pointing towards us. There appears to be only one way for following i.e the direction of thumb. We have to withdraw first finger from pointing towards others (blaming others) and unite to form a team. Thus “I” has to be replaced with “we”. 17
International Journal of Advance and Innovative Research Volume 2, Issue 3 (I) : July - September , 2015
ISSN 2394 - 7780
It results in either we win or we lose. Nobody would like to be a loser. Therefore, perforce, all will work together for a win-win situation. In the author’s view, solutions for managing conflicts should start from top because one reaches the top only because of its team members. If the team members below him are not performing then the day will not be far when the person at the top will also fall off as is depicted in the picture below:
WHY CONFLICTS ARISE? In most organizations, conflicts increase as employees assert their demands for an increased share in organizational rewards, such as position, acknowledgment, appreciation, monetary benefits and independence. Even management faces conflicts with many forces from outside the organization, such as government, unions and other coercive groups which may impose restrictions on managerial activities. Conflicts emanate from more than one source, and so their true origin may be hard to identify. Important initiators of conflict situations include: People disagree. People disagree for a number of reasons (De Bono, 1985). (a) They see things differently because of differences in understanding and viewpoint. Most of these differences are usually not important. Personality differences or clashes in emotional needs may cause conflicts. Conflicts arise when two groups or individuals interacting in the same situation see the situation differently because of different sets of settings, information pertaining to the universe, awareness, background, disposition, reason or outlook. In a particular mood, individuals think and perceive in a certain manner. For example, the half-full glass of one individual can be half-empty to another. Obviously both individuals convey the same thing, but they do so differently owing to contrasting perceptions and dispositions. (b) People have different styles, principles, values, beliefs and slogans which determine their choices and objectives. When choices contradict, people want different things and that can create conflict situations. For example, a risk-taking manager would be in conflict with a risk-minimizing supervisor who believes in firm control and a well-kept routine. (c) People have different ideological and philosophical outlooks, as in the case of different political parties. Their concepts, objectives and ways of reacting to various situations are different. This often creates conflicts among them. (d) Conflict situations can arise because people have different status. When people at higher levels in the organization feel indignant about suggestions for change put forward from their subordinates or associates, it provokes conflict. By tolerating and allowing such suggestions, potential conflict can be prevented. (e) People have different thinking styles, which encourage them to disagree, leading to conflict situations. Certain thinking styles may be useful for certain purposes, but ineffectual or even perilous in other situations (De Bono, 1985). (f) People are supposed to disagree under particular circumstances, such as in sports. Here conflict is necessary, and even pleasurable.
18
International Journal of Advance and Innovative Research Volume 2, Issue 3 (I) : July - September , 2015
ISSN 2394 - 7780
People are concerned with fear, force, fairness or funds (De Bono, 1985). (a) Fear relates to imaginary concern about something which might happen in the future. One may fear setbacks, disgrace, reprisal or hindrances, which can lead to conflict situations. (b) Force is a necessary ingredient of any conflict situation. Force may be ethical or emotional. It could be withdrawal of cooperation or approval. These forces are instrumental in generating, strengthening and terminating conflicts. (c) Fairness refers to an individual's sense of what is right and what is not right, a fundamental factor learnt in early childhood. This sense of fairness determines the moral values of an individual. People have different moral values and accordingly appreciate a situation in different ways, creating conflict situations. (d) Funds or costs can cause conflict, but can also force a conclusion through acceptable to the conflicting parties. The cost of being in conflict may be measurable (in money terms) or immeasurable, being expressed in terms of human lives, suffering, diversion of skilled labour, neglect or loss of morale and self esteem. (De Bono, 1985). Conditions creating conflict situations According to Kirchoff and Adams (1982), there are four distinct conflict conditions, i.e., high stress environments, ambiguous roles and responsibilities, multiple boss situations, and prevalence of advanced technology. Filley (1975) identified nine main conditions which could initiate conflict situations in an organization. These are: (i) Ambiguous jurisdiction, which occurs when two individuals have responsibilities which are interdependent but whose work boundaries and role definitions are not clearly specified. (ii)
Goal incompatibility and conflict of interest refer to accomplishment of different but mutually conflicting goals by two individuals working together in an organization. Obstructions in accomplishing goals and lack of clarity on how to do a job may initiate conflicts. Barriers to goal accomplishment arise when goal attainment by an individual or group is seen as preventing another party achieving their goal.
(iii). Communication barriers, as difficulties in communicating can cause misunderstanding, which can then create conflict situations. (iv)
Dependence on one party by another group or individual.
(v)
Differentiation in organization, where, within an organization, sub-units are made responsible for different, specialized tasks. This creates separation and introduces differentiation. Conflict situations could arise when actions of sub-units are not properly coordinated and integrated.
(vi)
Association of the parties and specialization. When individuals specialized in different areas work in a group, they may disagree amongst themselves because they have different goals, views and methodologies owing to their various backgrounds, training and experiences.
(vii) Behaviour regulation. Organizations have to have firm regulations for individual behaviour to ensure protection and safety. Individuals may perceive these regulations differently, which can cause conflict and negatively affect output. (viii) Unresolved prior conflicts which remain unsettled over time create anxiety and stress, which can further intensify existing conflicts. A manager's most important function is to avoid potential harmful results of conflict by regulating and directing it into areas beneficial for the organization. EFFECTS OF CONFLICTS Conflict situations should be either resolved or used beneficially. Conflicts can have positive or negative effects for the organization, depending upon the environment created by the manager as she or he manages and regulates the conflict situation. POSITIVE EFFECTS OF CONFLICTS Some of the positive effects of conflict situations are (Filley, 1975): Diffusion of more serious conflicts. Games can be used to moderate the attitudes of people by providing a competitive situation which can liberate tension in the conflicting parties, as well as having some entertainment value. In organizations where members participate in decision making, disputes are usually minor and not acute as the closeness of members moderates belligerent and assertive behaviour into minor disagreements, which minimizes the likelihood of major fights. 19
International Journal of Advance and Innovative Research Volume 2, Issue 3 (I) : July - September , 2015
ISSN 2394 - 7780
Stimulation of a search for new facts or resolutions. When two parties who respect each other face a conflict situation, the conflict resolution process may help in clarifying the facts and stimulating a search for mutually acceptable solutions. Increase in group cohesion and performance. When two or more parties are in conflict, the performance and cohesion of each party is likely to improve. In a conflict situation, an opponent's position is evaluated negatively, and group allegiance is strongly reinforced, leading to increased group effort and cohesion. Assessment of power or ability: In a conflict situation, the relative ability or power of the parties involved can be identified and measured. NEGATIVE EFFECTS OF CONFLICTS Destructive effects of conflicts include:
Impediments to smooth working,
Diminishing output,
Obstructions in the decision making process, and
Formation of competing affiliations within the organization.
The overall result of such negative effects is to reduce employees' commitment to organizational goals and organizational efficiency (Kirchoff and Adams, 1982). HOW TO SOLVE CONFLICT??? Realize that some conflicts are inevitable at work. Whenever people are committed and fired up, or change and new ideas are emerging, conflict and disagreement are bound to happen. This does not mean you have to revel in conflict or create trouble just for the heck of it, but it does mean that when conflict happens, it’s not the end of the world. It can be the beginning of an interesting learning process. Conflicts mean that people care enough to disagree strongly. But care should be taken that the conflict does not go on forever. One can follow the given ways to solve conflict: Handle conflicts sooner rather than later: Resolve a conflict when it starts, as it only gets worse with time. Conflicts at work arise not from something that was said, but from something that wasn’t said! Everyone’s waiting for the other to admit he’s wrong and gets more unpleasant after the conflict has stewed for a while. It's essential to interrupt the "waiting game" before it gets to that point. Ask Nicely: If somebody has done something that made you angry, or if you don’t understand their viewpoint or actions, simply asking about it can make a world of difference. Never assume that people do what they do to annoy you. Sometimes there’s good reason why that person does what he or she does (even the things that really get on your nerves), and a potential conflict evaporates right there. Make your inquiry just that--an inquiry, not an accusation of any sort: “Say, I was wondering why you did ‘X’ yesterday” or “I’ve noticed that you often do ‘Y’. Why is that?” are good examples. “Why the hell do you always have to ‘Z’!” is less constructive. Invite the other person to talk about the situation: A hurried conversation at your desk between emails and phone calls won’t solve anything. You need an undisturbed location and time to address the issue. Observe: Identify what you see in neutral, objective terms. This is where you describe the facts of the situation as objectively as possible. What is actually happening? When and how is it happening? What is the other person doing and, not least, what are you doing? You’re only allowed to cite observable facts and not allowed to assume or guess at what the other person is thinking or doing. You can say, “I’ve noticed that you’re always criticizing me at our meetings” because that’s a verifiable fact. You can’t say “I’ve noticed that you’ve stopped respecting my ideas” because that assumes something about the other person. Apologize: Apologize for your part in the conflict. Usually everyone involved has done something to create and sustain the conflict. Remember: You’re not accepting the entire blame; you’re taking responsibility for your contribution to the situation. Appreciate: Praise the other part in the conflict. Tell them why it’s worth it for you to solve the conflict. This can be difficult as few people find it easy to praise and appreciate a person they disagree strongly with, but it’s a great way to move forward.
20
International Journal of Advance and Innovative Research Volume 2, Issue 3 (I) : July - September , 2015
ISSN 2394 - 7780
Identify the consequences: What has the conflict led to for you and for the company? Why is it a problem? Outlining the consequences of the conflict shows why it’s necessary to resolve it. It also helps participants to look beyond themselves and see the conflict "from the outside." Define an objective: What would be a good outcome? It’s essential to set a goal so both parties know the outcome they’re aiming for. That makes reaching the outcome a lot more likely. Get mediation: Some conflicts cannot be solved by the participants alone, and mediators can help. Mediation involves a neutral third party who has been trained in mediation principles, who is experienced in mediation, and who is trusted by the people involved in the conflict. A good mediator will help the disputants find their own solution, not provide advice or push them toward any particular solution. Take care when selecting a mediator. The mediator (or mediators) should only be someone who has undergone formal mediation training, has extensive mediation experience, and has mediated under supervision. Otherwise, he or she may do more harm than good. CONCLUSION Handling and resolving conflicts that arise in the workplace is one of the biggest challenges managers and employees face. Typically there are two responses to conflict: run away (avoidance) or ‘battle it out’. In either case, we often feel uncomfortable or dissatisfied with the results because no resolution has been achieved. By learning to constructively resolve conflict, we can turn a potentially destructive situation into an opportunity for creativity and enhanced performance. Arriving at a positive resolution of conflict is always the ultimate goal. In resolving conflict one has to clearly articulate the causes of the conflict It is always better to address the issues face-to-face (notes, email correspondence, memos are not a productive way to resolve differences). Last but not the least; if the top management wants the conflict to be resolved in an amicable way, then it has to join hands with its employees. Conflicts if not solved can break an organization. So, it’s the duty of the top management to take an immediate call to resolve the conflict by making its employees realize jointly they can work towards their mutual benefits.
REFERENCES De Bono, E. 1985. Conflicts: A Better Way to Resolve Them. London: Harrap.
Filley, A.C. 1975. Interpersonal Conflict Resolution. Glenview IL: Scott, Foresman.
House, R.J., & Rizzo, J.R. 1972. Conflict and ambiguity as critical variables in a model of organizational behaviour. Organizational Behavior and Human Performance, 7: 467-505.
Irving, J.L. 1971. Group think. Psychology Today, November.
Ivancevich, J.M., Szilagyi, A.D., Jr., & Wallace, M.J., Jr. 1977. Organizational Behavior and Performance. California, CA: Goodyear Publishing.
Kirchoff, N., & Adams, J.R. 1982. Conflict Management for Project Managers. Drexel Hill: Project Management Institute.
Thomas, K.W., & Kilman, R.H. 1974. Conflict Mode Instrument. Tuxedo, New York
NY: Xicom. Tosi, H.L., Rizzo, J.R., & Carroll, S.J. 1986. Organizational Behaviour. New York,
NY: Pitman. Turner, S., & Weed, F. 1983. Conflict in Organizations. Englewood Cliffs: Prentice-Hall.
21
International Journal of Advance and Innovative Research Volume 2, Issue 3 (I) : July - September , 2015
ISSN 2394 - 7780
INDIAN JUDICIARY AND CRIMINALIZATION OF POLITICS IN INDIA: A STUDY Deepom Baruah Assistant Professor, Centre for Juridical Studies, Dibrugarh University ABSTRACT The Indian judiciary has always been in the epic of its stature. The role of Indian judiciary can never be denied of, ever since the independence of India the judiciary has always stood the test of time. The Judiciary being the guardian of the Constitution is entrusted with the responsibility of safekeeping of the Constitutional ideals, and as such the Judiciary has on different times showed great concern over the issues and problem concerning the rights of common men and society including criminalisation of politics. In the present article an attempt has been made to examine the various judicial pronouncements and the role of Judiciary concerning criminalisation of politics in India. Key words: Criminalization, Politics, Law, Judiciary OBJECTIVE OF THE STUDY (1) To find out the role played by the Indian Judiciary to curb the menace of criminalization of politics through the study of various judicial pronouncements. (2) To access the impact of these judgments on the Indian political system and on society. METHODOLOGY The present paper is primarily based on secondary sources like law Reports, Books, Journals and online database. The methods used are historical, Narrative and analytical. INTRODUCTION There is a crisis of legitimacy in our political system. While we have outstanding men and women in public life, a flawed electoral process is increasingly alienating public-spirited citizen from the political and electoral arena. The persons best equipped to represent people find it impossible to be elected by adhering to law propriety. On the other hand, a person with a criminal and corrupt record getting elected to legislatures seems to have become the norm. The problem of criminalization goes well beyond the political fate of few individuals. The impact of criminalization of politics in India has reached such an alarming stage that if it continues in such an unprecedented way then in the near future the entire governmental machinery will collapse. Under the Indian legal system there are various laws, which directly or indirectly deal with the entire political process of the country. The Constitution of India also contains various provisions relating to the conduct of electoral process in the country. India has a comprehensive structure of laws to administer and conduct its elections. The formal legal framework for all these elections rests on certain provisions of the Constitution, The Representation of the People’s Act 1950, The Representation of the People’s Act 1951, and the various rules and regulations framed and orders issued under these statutes largely control the electoral poll process of the country. In addition, certain provisions of the Indian Penal Code and a few other Acts are relied upon to provide for punishment as well as disqualification of candidates and members of the two Houses of Parliament of India and State Legislatures. The Supreme Court of India has shown great concern over the growing problem of crminalisation of politics, the Court replying to a writ petition filed by the Association for Democratic Reforms1 took note of the increased criminalisation of politics in India, has held that the voter has every right to know the social, economical and educational background of a candidate in an election to Parliament or State Legislature. Further, the Supreme Court of India directed the Election Commission of India to issue a notification to all the aspiring candidates to make available information’s regarding education, assets, liabilities and criminal antecedents for the benefit of the voter. But the Parliament of India in order to negatived the order of the Court and notification of the Election Commission of India amended the electoral law (Representation of People’s Act) against this amendment the Peoples Union for civil liberties2 filed a writ petition in the Supreme Court of India alleging that the amendment 1
AIR (2002) SC 2112
2
PUCL v. Union of India op.cit
22
International Journal of Advance and Innovative Research Volume 2, Issue 3 (I) : July - September , 2015
ISSN 2394 - 7780
is violative of people’s right to know under Article 19(1) (a) of the Constitution of India.3 The amended Representation of People’s Act provided that only candidates who are elected were required to give details of their assets and liabilities to the concerned presiding officers of the Houses, and not the MPs who are not elected. The Supreme Court of India reacting to the amendment has held that the Parliament cannot declare the law declared by the Court is not binding. The court further said that the amended Representation of People’s Act was a ‘half hearted attempt’ by the government to fight the use of money and muscle power in elections.4 The Supreme Court of India has also affirmed this view in the case of Common Cause a registered Society v Union of India5 wherein the court explaining the power of the Election Commission has said that The Commission has under Article 324(1) of the Constitution of India to ask for details of expenses incurred by the candidate in an election in order to bring more transparency, accountability and to avoid involvement of black money in elections. 6 Time and again the Supreme Court drew the attention of Parliament to damage done to the purity of the process of elections by this atrocious piece of legislation. In G.Y. Kanakkarrao7 the Supreme Court observed: “The prescription on the ceiling on expenditure by a candidate is a more eyewash. This lacuna in the law is, however, for the Parliament to fill, lest the impression is reinforced that its retention is deliberate for the convenience of everyone. If this is not feasible, it may be advisable to omit the provision to prevent the resort to indirect methods for its circumvention and subversion of the law. This provision has ceased to be even a fig leaf to hide the reality.” Again, in C. Narayanaswamy vs. Jaffer Sharief 8 the Supreme Court recorded its dissatisfaction : “As the law stands today, anybody including a smuggler, criminal or any other anti-social element may spend any amount over the election of any candidate to whom such person is interested, for which no account is to be maintained or to be furnished and any such expenditure shall not be deemed to have been expenditure in connection with the election under Section 77(1), so as to amount to corruption. In Jawahar Singh v. Election Commission of India & Others9 the Supreme Court of India dealt with the issue of participation of criminals in elections and whereas a person can contest an election who is released on bail in a criminal offence pending appeal section 8(3) of the Representation of People’s Act deals with disqualification of a candidate pending an appeal in a criminal offence. The Supreme Court while dealing with this issue has in the case of Sharat Chandra Rabha v Khagendra Nath10 has held that suspension of sentence does not wipe out the conviction and sentence. It was held that a reprieve is a temporary suspension of sentence. The effect of remission is to wipe out the remaining part of the sentence, which has not been served, and thus in practice, the sentence is reduced to that which is already undergone. In law, remission does not touch the order of conviction by the court and the sentence passed by the court. If suspension of sentence during the pendency of an appeal does not have the effect of wiping it out, it is difficult to accept the contention that the disqualification U/S 8 (2) remains arrested or in abeyance during the operation of the suspension order pending appeal against the conviction and sentence. This is more so when in section 8 (3) gives contrary indication. Thus in the instant case, the sentence of three years imprisonment is not affected and the appellant remains disqualified although he may not have to undergo the full sentence. The Hon’ble High Court of Allahabad also took the similar view in the case of Sachindra Nath Tripathi v. Doodnath11 while declaring the election as void of Shri Doodnath who 3
For detail concerning this point see Article 19(1) of the Constitution of India.
4
J.N Pandey, Constitutional Law of India, Allahabad Law Agency, Allahabad,p-170
5
[(1996) 2 SCC 752].
6
For detail concerning this point see Article 324(1) of Indian Constitution.
7
AIR (1994) SC 678.
8
[( 1994) 3SCC 170].
9
AIR (1999) ALL 1821.
10
AIR (1961) SC 334.
11
84th Election Law Reports, p 46.
23
International Journal of Advance and Innovative Research Volume 2, Issue 3 (I) : July - September , 2015
ISSN 2394 - 7780
stood convicted by the trial for the offence u/s 302 and 307 I.P.C and who stood released on bail on the election period, held that – “the disqualification which is a automatic effect of conviction, springs up right at the time of pronounce of conviction, which findings is yet to be reserved or set aside. 12 Again the Supreme Court of India in Y.K Gadakh v. Balasaheb Vikhe Patil13 has laid down certain guidelines relating to disqualification of person from contesting the election, which the person has to follow. The obvious intention of the courts in India is to prevent a person who is accused of serious crimes and a court is prima facie satisfied about his involvement in the crime, he should be kept out of the electoral arena as it would be a reasonable restriction in the interest of the public. The recent judgement of the Supreme Court in Lily Thomas v. Union of India14 changed the above mentioned position the Supreme Court of India in this case has held that if a sitting MP or MLA is convicted (not only charged), he/ she would be immediately disqualified and the seat declared vacant. This judgement has also clarified another issue relating to disqualification by affirming that if certain criteria stop a person from contesting in elections, then the same criteria also hold for sitting MPs and MLAs hence they cannot continued to be a member of the Parliament or State Legislature. The Court has also said that the Parliament does not have powers to make different laws for the disqualification of a person based on whether he is a contesting candidate or a sitting member of the Parliament and State Assemblies as it is against the provisions of the Constitution. The above mentioned judgment has raised a lot of debates among the politicians, administrators, statesmen and the common people alike. It also creates again a controversy to clip the power of the legislators by the judiciary.15 It is clear that the observations of the Supreme Court are genuinely meant to protect the conduct of elections from the evils of money power and criminalization. The court fully recognized its own limitation and left it to Parliament to make suitable legislation. It will be unfair to raise the bogey of usurpation of legislative power by the court. Although there are laws to regulate these unlawful Activities and from time to time various recommendations were made by the various commissions, but still there has no worth noticing work has been done by the Parliament till date. A comparison with American Constitution will show us that the American law on corrupt practices is the presence of broad rules in the Constitution of many states that elections must be free and equal which not only means free exercise of right to vote but also the equal influence of each and every vote. This prevents the legislature to pass laws, which violate free and fair elections. If purity of election is the essence of democracy and providing for invalidation of an election on the ground of commission of any corrupt practice is the object of enacting these provisions, it cannot be accepted that the election scene having degenerated over the years, appreciation of evidence for determining the commission of a corrupt practice must be made liberally. If the rule of law has to be preserved as the essence of the democracy of which purity of election is a necessary concomitant, it is the duty of the Courts to appreciate the evidence and construe the law in a manner which would sub serve this higher purpose and not even imperceptibly facilitate acceptance, much less affirmance, of the falling electoral standards. For democracy to survive, rule of law must prevail, and it is necessary that the best available men should be chosen as people's representatives for proper governance of the country. This can be best achieved through men of high moral and ethical values who win the elections on a positive vote obtained on their own merit and not by the negative process of vote of elimination based on comparative demerits of the candidates. It is also necessary that the impact of money power should also be minimized from electoral contest otherwise many men of undoubted ability and credibility for want of requisite financial support should be able to re-enter the field to make the people's choice meaningful. This can be achieved only if elections are contested on a positive vote and the comparison between the merits and abilities of the contestants without the influence of power and pelf and not between their comparative demerits and the support of money
12
Refer to, Indian Penal Code, section 302 & 307.
13
AIR ( 678), SC, 1994.
14
Writ Petition (CIVIL) NO. 490 of 2005, Supreme Court of India.
15
“Parties rue erosion of Parliamentary Democracy” The Assam Tribune, 1st August 2013.
24
International Journal of Advance and Innovative Research Volume 2, Issue 3 (I) : July - September , 2015
ISSN 2394 - 7780
power. Apart from the other adverse consequences, the growing influence of money power has also the effect of promoting criminalization of politics. Real education of the electorate contemplates informing them of the past achievements and future plans of the political party on a positive note and its candidate's qualifications to serve that purpose compared with those of the other political parties and their candidates and not a projection of the comparative greater demerits of the opponents. This is with a view to emphasize that the functioning of the democracy depends on the quality of the men chosen for the governance of the country. This is the need, which the election campaign is meant to serve in an election based on party lines, the qualifications of the candidates being material for this purpose. 16 The right to education act can make a vital contribution in this regard by making the illiterate voter literate so that the voter can exercise his astuteness more effectively while exercising his right to vote because he will be in a much better position to understand the power and the value of his vote. The duty at the top echelons of leadership at the state and national levels of all political parties is to set the trend for giving the needed information to the electorate by adopting desirable standard so that it percolates to the lower levels and provides a congenial atmosphere for a free and fair poll. A contrary trend of speeches by the top leaders tends to degenerate the election campaign as it descends to the lower levels and at time promotes even violence leading to criminalisation of politics. The growth of this unhealthy trend is a cause for serious concern for the proper functioning of the democracy and it is the duty of the top leaders of all political parties to reverse this trend to enable movement of the functioning democracy in the proper direction.
16
Cf para 18, Manu/SC/0599/1994.
25
International Journal of Advance and Innovative Research Volume 2, Issue 3 (I) : July - September , 2015
ISSN 2394 - 7780
ECONOMIC DETERMINANTS AND IMPACT OF FOREIGN DIRECT INVESTMENT IN INDIA: AN EMPIRICAL AND THEORETICAL REVIEW IN PRESENT GLOBALIZATION SCENARIO Naresh Guduru and Ravi Chandra Anchuri Assistant Professor, Balaji Institute of Technology & Science, Narsampet ABSTRACT Foreign direct investment (FDI) is considered to be one of the important factors, which leads to the globalization of an economy. The globalization over the last two decades has been hailed as a major development, which result in economic prosperity in developing countries. In this paper, we have attempted to identify the Determinants , impact and problems associated with India’s current foreign direct investment regime, and more importantly the other associated factors responsible for India’s unattractiveness as an investment location. The presence of large domestic market, fairly well developed financial architecture and skilled human resources, it can attract much larger foreign investments than it has done in the past. India's present international investment regime facilitates easy entry of foreign capital in almost all areas subject to specific limits on foreign ownership. Entry options have not only become procedurally simpler, but prospects for higher yields from investment have also become brighter. But further boost to Foreign Direct Investment (FDI) will depend significantly on further liberalization of its foreign investment regime. The paper provides the brief synthesis of the regime and analyzes the economic and policy variables as the important determinants of FDI inflows to India. Key Words: Foreign Direct Investment (FDI), Foreign Portfolio Investment (FPI), Gross Domestic Product (GDP), Economic Policy Reform I. INTRODUCTION India is the largest democracy and fourth largest economy in terms GDP in the world. With its consistent growth performance and high-skilled manpower, India provides enormous opportunities for foreign investment. Since the beginning of economic reforms in 1991, major reform initiatives have been taken up in the field of investment, trade and financial sector. Enactment of Competition Act, liberalization of Foreign Exchange Management Act (FEMA), and amendments in Intellectual Property Right laws and many other initiatives make India attractive for business. India is the second most attractive foreign Direct Investment destination (A.T. Kearney 2007). Also it is the second most attractive destination among transnational Corporations for FDI 2007-09 (UNCTAD's World Investment Report, 2007). Though FDI inflows have responded positively to policy changes by increasing from US$ 165 million in 1990-1991 to US$ 90 billion in 2008-2009, there might have been much more had foreign investment not been regulated in some key areas. Till the 1990s the policy was heavily restrictive with majority foreign equity permitted only in a handful export- oriented, high technology industries. Initiated reforms changed the perceptions of foreign investors with foreign investment policy becoming progressively liberal following steady withdrawal of external capital controls and simplification of procedures. While India has an overall market-friendly and liberal policy towards foreign investment, foreign capital still does not enjoy equally easy access in all parts of the economy. The manufacturing sector is still untapped accompanied by lack of access in certain services and agriculture. India's future foreign investment policy faces the critical challenge of increasing access of foreign capital to these segments. DEFINITION OF FDI Foreign Direct Investment (FDI) is now recognized as an important driver of growth in the country. Government is , therefore, making all efforts to attract and facilitate FDI and investment from Non Resident (NRIs) including Overseas Corporate Bodies (OCBs), that are predominantly owned by them, to complement and supplement domestic investment According to the International Monetary Fund (IMF), a FDI has three components, namely equity capital, reinvested earnings and other direct capital. A large number of countries, including several developing countries, report FDI inflows in accordance with the IMF definition. However, the Reserve Bank of India (RBI) reports FDI inflows only on the basis of investments received from non-residents on equity and preference share capital under the FDI scheme. As the data released by the RBI does not capture reinvested earnings and other capital, these inflows to India do not fully comply with standard international coverage and are, therefore, not directly comparable with the FDI data released by other countries Keeping in mind the issues relating to foreign investment, the study aims to achieve the following objectives: 1) To study the existing policy framework of International Investments 2) To examine the economic policy determinants of FDI 26
International Journal of Advance and Innovative Research Volume 2, Issue 3 (I) : July - September , 2015
ISSN 2394 - 7780
3) To suggest the improvements that can be made in the current policy framework. 4) To access the sector-wise foreign direct investment in India. 5) To analyze the trends, growth and patterns of FDI inflows into India with Special focus on the postliberalization periods; HYPOTHESIS To achieve the objectives, an attempt has been made to test the following hypothesis: H1: There is no effect of GDP on the inflows of FDI in India. H2: There is no significant effect of openness (exports and imports) on the inflows of FDI. H3: Debt/GDP ratio is not the cause of FDI inflows in India H4: There is no effect of legal rights enforcement in attracting FDI inflows in India. H5: There is no effect of business start up procedures required in attracting FDI inflows in India. H6: There is no effect of tax policies on FDI inflows in India. H7: There is no effect of Forex reserves on FDI Inflows The rest of the paper is divided into four sections. Section II presents the literature review on policy regime as a determinant of FDI Section III represents the brief outline of the International Investment Regime i.e. FDI policy. Section IV represents the relationship between FDI and economic policy variables taking following factors into consideration namely, market size, openness (exports and imports), lending rates, debt service ability, strength of legal rights and tax structure followed by the concluding remarks. DATA AND METHODOLOGY To understand the relationship between FDI and economic policy variables multiple correlation and step wise regression is used. Multiple correlations explain the relationship between FDI and its various independent variables. The step wise regression is used because the independent variables are also correlated to each other and effect of one on FDI can be interpreted in better way. The effect of one on multi collinearity, is measured by Darwin Watson test. The data is taken for a period of 9 years from 2006-2014. The data used for analysis is secondary data taken from the following sources World Development Indicators published by World Bank.
FDI Fact Sheet published by Department of Industrial Policy & Promotion. Ministry of Finance
II. LITERATURE REVIEW FDI Defined In the present era of liberalization, role played by growth of international trade have increasingly influenced FDI and FPI into developing countries. FDI is the largest component of long-term capital flows to developing countries and is expected to remain their dominant source of external finance. Danziger (1997) defines FDI broadly as an investment made by a foreign investor in order to acquire an ongoing interest in an enterprise operating in a country other than the investor's home country. The foreign investor intends to exercise some control over the management of the direct investment enterprise. It is a Greenfield investment if the foreign investor establishes a new venture in the host country. It is merger & acquisition if the foreign investor makes an acquisition of the whole or part of an existing firm or project in the host country is purchased. International Monetary Fund (1996) maintains that foreign direct investment (FDI) is a category of international investment in which a resident entity in one economy (the direct or foreign investor) acquires a lasting interest in an enterprise resident in another economy (the direct investment enterprise). Whether the lasting interest is related to a controlling interest or to potential control is immaterial. It is constituted that the foreign investor should own at least 10% of on overseas direct investment enterprise to control and influence the management of the investment (IMF FDI in India means investment by non-resident entity/person resident outside India in the capital of the Indian company under Schedule 1 of FEM (Transfer or Issue of Security by a Person Resident outside India) Regulations 2000 (Consolidated FDI Policy Circular, DIPP, 2010). Foreign portfolio investment (FPI), on the other hand, is a financial investment made by an investor from one country in the securities markets of another country, seeking purely financial gains in the form of income or capital. 27
International Journal of Advance and Innovative Research Volume 2, Issue 3 (I) : July - September , 2015
ISSN 2394 - 7780
Generally, this is a short - term investment in shares, bonds, notes, money market instruments and financial derivatives, and does not imply significant control over or a lasting interest in the enterprises concerned. FDI DETERMINANTS According to the OLI paradigm of Dunning , the presence of ownership-specific competitive (O) advantages in a transnational corporation, the presence of locational advantages (L) in a host country, and the presence of superior commercial benefits internally in a firm (I) are three important set of determinants which influence the FDI inflows
III. CURRENT SCENARIO OF FDI INFLOW IN INDIA Since economic reforms initiated in 1991, Government of India has taken many programs to magnetize FDI inflows, to improve the Indian economy. An important objective of promoting FDI in India and other developing countries has been to promote efficiency in production and increase exports. However, any increase in equity stake of the foreign investors in existing joint ventures or purchase of a share of equity by them in domestic firms would not automatically change the orientation of the firm. That is, “the aim of FDI investors would be to benefit from the profit earned in the Indian market. As, a result, in such cases FDI inflows need not be accompanied by any substantial increase in exports, whether such investment leads to modernization of domestic capacity or not”. Therefore, it is a challenge for a developing country like India to channelize its capital inflow through FDI into a potential source of productivity gain for domestic firms. As a result, India has received total FDI of US$ 180,034 million from the year 1990-91 to 2009-10 which is due to the initiatives taken by the Government of India in attracting FDI inflows in India. The FDI inflows have shown a rising trend from 1991-92 to 1997-98 owing to the sincere programmes of structural liberalization and open market reforms. The rise in flows of FDI till 1997 was due to not only of the liberalization policy but also due to the sharp expansion in the global scale of FDI outflows during the 1990s. Another causal factor may have been the recovery of the Latin American economies, which had begun to emerge from the Debt Crisis of the 1980s. Then after during 1998-99 and 1999-00 there was decline in FDI inflow which was due to the decline in industrial growth rate in the economy and also due to the result of the East Asian Financial Crisis. But again in the next following year, foreign investment started to bounce back. During 2002-03 and 2003-04, again there was fall in flow of foreign direct investment which was due to the cast of Global Recession on the Indian economy. The FDI Equity inflows during the five years 2005-06 to 2009-10 showed a massive increase of more than seven times than those of the previous years 1991-92 to 1999-00 and 2000-01 to 2004- 05. This increase was due to the revised FDI Policy in March 2005, an important element of the policy was to allow FDI up to 100% foreign 28
International Journal of Advance and Innovative Research Volume 2, Issue 3 (I) : July - September , 2015
ISSN 2394 - 7780
equity under the automatic route in townships, housing, built-up infrastructure and construction-development projects IV. MAJOR ECONOMIC DETERMINANTS IN INDIA 1. Restrictive FDI regime The FDI regime in India is still quite restrictive. As a consequence, with regard to cross border ventures, India ranks 57th in the GCR 1999. Foreign ownership of between 51 and 100 percent of equity still requires a long procedure of governmental approval. In our view, there does not seem to be any justification for continuing with this rule. This rule should be scrapped in favor of automatic approval for 100-percent foreign ownership except on a small list of sectors that may continue to require government authorization. The banking sector, for example, would be an area where India would like to negotiate reciprocal investment rights. Besides, the government also needs to ease the restrictions on FDI outflows by non-financial Indian enterprises so as to allow these enterprises to enter into joint ventures and FDI arrangements in other countries. Further deregulation of FDI in industry and simplification of FDI procedures in infrastructure is called for. 2. Lack of clear cut and transparent sectoral policies for FDI Expeditious translation of approved FDI into actual investment would require more transparent sectoral policies, and a drastic reduction in time-consuming red-tapism. 3. High tariff rates by international standards India’s tariff rates are still among the highest in the world, and continue to block India’s attractiveness as an export platform for labor-intensive manufacturing production. On tariffs and quotas, India is ranked 52nd in the 1999 GCR, and on average tariff rate, India is ranked 59th out of 59 countries being ranked. Much greater openness is required which among other things would include further reductions of tariff rates to averages in East Asia (between zero and 20 percent). Most importantly, tariff rates on imported capital goods used for export, and on imported inputs into export production, should be duty free, as has been true for decades in the successful exporting countries of East Asia. 4. Lack of decision-making authority with the state governments The reform process so far has mainly concentrated at the central level. India has yet to free up its state governments sufficiently so that they can add much greater dynamism to the reforms. In most key infrastructure areas, the central government remains in control, or at least with veto over state actions. Greater freedom to the states will help foster greater competition among themselves. The state governments in India need to be viewed as potential agents of rapid and salutary change. Brazil, China, and Russia are examples where regional governments take the lead in pushing reforms and prompting further actions by the central government. In Brazil, it is São Paulo and Minais Gerais which are the reform leaders at the regional level; in China, it is the coastal provinces, and the provinces farthest from Beijing, in the lead; in Russia, reform leaders in Nizhny Novgorod and in the Russian Far East have been major spurs to reforms at the central level. 5. Limited scale of export processing zones The very modest contributions of India’s export processing zones to attracting FDI and overall export development call for a revision of policy. India’s export processing zones have lacked dynamism because of several reasons, such as their relatively limited scale the Government’s general ambivalence about attracting FDI; the unclear and changing incentive packages attached to the zones; and the power of the central government in the regulation of the zones, in comparison with the major responsibility of local and provincial government in China. Ironically, while India established her first EPZ in 19654 compared with China’s initial efforts in 1980, the Indian EPZs never seemed to take off -- either in attracting investment or in promoting exports. 6. No liberalization in exit barriers While the reforms implemented so far have helped remove the entry barriers, the liberalization of exit barriers has yet to take place. In our view, this is a major deterrent to large volumes of FDI flowing to India. An exit policy needs to be formulated such that firms can enter and exit freely from the market. While it would be incorrect to ignore the need and potential merit of certain safeguards, it is also important to recognize that safeguards if wrongly designed and/or poorly enforced would turn into barriers that may adversely affect the health of the firm. The regulatory framework, which is in place, does not allow the firms to undertake restructuring. 7. Stringent labor laws Large firms in India are not allowed to retrench or layoff any workers, or close down the unit without the permission of the state government. While the law was enacted with a view to monitor unfair retrenchment and 29
International Journal of Advance and Innovative Research Volume 2, Issue 3 (I) : July - September , 2015
ISSN 2394 - 7780
layoff, in effect it has turned out to be a provision for job security in privately owned large firms. This is very much in line with the job security provided to public sector employees. Most importantly, the continuing barrier to the dismissal of unwanted workers in Indian establishments with 100 or more employees paralyzes firms in hiring new workers. With regard to labor regulations and hiring and firing practices, India is ranked 55th and 56th respectively in the GCR 1999. Labor-intensive manufacturing exports require competitive and flexible enterprises that can vary their employment according to changes in market demand and changes in technology, so India remains an unattractive base for such production in part because of the continuing obstacles to flexible management of the labor force. 8. Financial sector reforms Reform of India’s financial sector is crucial for large FDI flows into India. However, only some partial steps have been undertaken and these are by no means going to make any meaningful changes to the existing system. India’s banking and insurance companies were nationalized more than two decades ago. While a number of countries had undertaken such actions in the 1970s and early 1980s, for instance Mexico, France, and Chile, however, they have almost completely reversed this policy by now. Be that as it may, India still continues to rely on a state-owned, state-run banking system and the insurance sector till very recently remained a government monopoly. This as one would expect has had highly adverse results, both in terms of availability of funds for investment and a negligible presence of foreign banks and no presence of foreign insurance companies in the country. 9. High corporate tax rates Corporate tax rates in East Asia are generally in the range of 15 to 30 percent, compared with a rate of 48 percent for foreign companies in India. High corporate tax rate is definitely a major disincentive to foreign corporate investment in India. With respect to tax evasion, India is ranked 48th in the GCR 1999. V. CONCLUDING REMARKS The present study analysis the policy related variables like openness of the economy, foreign exchange reserves, debtservice ratio, strength of legal rights, tax policies and economic determinant, that is, GDP to throw light at the possible variables influencing the foreign direct investment inflows in India. The analysis shows that independent variables including GDP, Openness and LR affect the inflows of FDI to India. Among the major reasons which discourage the international investors from investing in India despite of its consistent economic growth includes: 1) Inadequate Legal system 2) Maturity of the financial markets 3)
Politics and corruption
4) Lack of infrastructure 5) Instability of Indian Social and Political environment practices All in all a more open policy frame is required which can be integrated with developing economies policy frame so that India becomes the most attractive destination and actually receive Foreign Direct Investment in the sectors which has potential to grow from foreign capital. Further more the integration at National level is required as sectors which are covered under automatic route are subject to other caveats imposed by State and respective Ministry. REFERENCES Abbott, KennethW., and Duncan Snidal. 2000. “Hard and Soft Law in International Governance.” International Organization 54(3): 421–56.
Ahlquist, John S. 2006. “Economic Policy, Institutions, and Capital Flows: Portfolio and Direct Investment Flows in Developing Countries.” International Studies Quarterly 50(3): 681–704.
Anitha& Dr. K. Maran(2011), Recent trends in foreign direct investment, International Journal of Research in Commerce & Management, vol. no. 2 (2011), issue no. 8 (August),pp28-34.
ADB (2004), "Asian ADO/2004/default.asp.
Agarwal, J. P. (1980), "Determinants of Foreign Direct Investment: A Survey." Weltwirtschaftliches Archiv, 116, pp. 739-773.
Development
Outlook
2004
http://www.adb.org/Documents/Books/
30
International Journal of Advance and Innovative Research Volume 2, Issue 3 (I) : July - September , 2015
ISSN 2394 - 7780
Charkrabarti, A. (2001), "The Determinants of Foreign Direct Investment: Sensitivity Analyses of CrossCountry Regressions." Kyklos, 54(1), pp. 89-114.
DIPP (2009), Fact Sheet on FDI, FDI Statistics 2009 DIPP (2008), Fact Sheet on FDI, FDI Statistics 2008 Dunning J.H., "The Eclictic Model of FDI",
Jackson, S., Markowski, S. (1995), "The Attractiveness of Countries to Foreign Direct Investment." Journal of World Trade, 29, pp. 159-180.
31
International Journal of Advance and Innovative Research Volume 2, Issue 3 (I) : July - September , 2015
ISSN 2394 - 7780
ETHICAL ISSUES IN MARKETING RESEARCH: AN INSIGHT Dr. Dhananjay Awasarikar Professor, Suryadatta Institute of Management and Mass Communication, Bavdhan, Pune ABSTRACT Ethics focuses on standards, rules and code of conduct governing the behavior of individuals and groups of individuals. Ethico-Moral human actions are closely and basically related to varying human thoughts initiated, implemented and dominated by the human character which is exhibited through social behavior. Ethics is not only personal but also relative concept. Overall adoption of ethics is a matter of concern, although they are partially followed by some business houses. Especially after the year 1980, because of emergence of Customer-oriented Approach resulting in increasing competition and also emergence of Consumerism as a dynamic concept, in India, the culture to conduct Marketing Research gained a wide and broad recognition, particularly, as a vital tool of Marketing Management. The manufactures of consumer goods and the marketers dealing in service sector have realized the significance of Marketing Research, at present. As per the findings of a recent survey, the cost of the Market Research conducted in India in recent past was over 800 Crores. It can be predicted that Research Culture would be an Integral Part of Marketing Activity in 21st Century in India. Privacy, Intrusion, Deception through Misrepresentation and Misleading Practices are some selected Ethical Issues in Marketing Research in India. All these issues are dealt with in this paper, Key Words: Privacy, Confidentiality, Intrusion, Deception and Misleading Practices. INTRODUCTION The English word ‘Ethics’ has originated from the Greek word ‘Ethos’ which literally means the manners or the character. Moreover, in Latin it is called as ‘Ethicus.’ Also, in one restrictive sense, it is interpreted as a synonym of the word ‘Morality’, in the sense that it is that branch of philosophy which deals with Moral Principles. However, strictly technically speaking, the two words namely ‘Ethics’ and ‘Morality’ have different meanings especially in respect of their Practical Scope as well as Social Applicability. Fundamentally, Ethics focuses on standards, rules and code of conduct governing the behavior of individuals and groups of individuals. Morality is primarily concerned with relative good or bad and right or wrong human behavior in a given situation. In other words, Ethico-Moral human actions are closely and basically related to varying human thoughts initiated, implemented and dominated by the human character which is exhibited through social behavior. Really, Marketing Research played a minor role under Sales-oriented Marketing Approach in India, especially prior to the year 1980; however, thereafter because of emergence of Customer-oriented Approach resulting in increasing competition and Consumerism as a dynamic concept, in India, the culture of conduct of Marketing Research did gain a very wide and broad recognition particularly as a vital tool of Marketing Management. Furthermore, after getting feedback from Consumer Satisfaction Surveys, today’s’ smart marketers are observed taking a wise second look towards the target customer through conduct of Marketing Research, in order to corroborate customer information prior to finalization of a decision. In other words, the overall frequency of Marketing Research in India has rapidly increased in last thirty five years (1980 -2015) as it has now become an on-going activity exactly against past, not only to discover but also to re-discover the real or the interested consumer. As a result, many Companies are employing Marketing Research Consultancies who, in turn, have set up specialized cells, just, to cater to the growing needs of the Companies investigating Consumer Satisfaction through Marketing Research. Not only the manufactures engaged in the production of consumer goods but also the marketers dealing in service sector have rightly realized the practical significance of Marketing Research, at present. RATIONALE OF THE PAPER IN THE PRESENT MARKET SCENARIO As per the findings of a recent Market Survey, India is one of the fastest growing markets for Marketing Research amongst some other countries. Also, the cost of the Market Research conducted in India in recent past was over 800 Crores. Besides, this cost is likely to increase even more, in the years to come. Especially because of ever increasing demand and size of Marketing Research, some advertising agencies also are 32
International Journal of Advance and Innovative Research Volume 2, Issue 3 (I) : July - September , 2015
ISSN 2394 - 7780
observed diversifying in to the field of Marketing Research. It may necessarily not be out of place to predict over here that Research Culture would be an Integral Part of Marketing Activity in 21st Century in India. On this background of the Marketing Research in India, as on today, along with the increase in its demand and the size, a number of Ethical issues also started emerging in the marketing sphere. Unless such issues are checked and controlled in reasonable time, right now, the number of such undesirable but inevitable issues would go on rising with the passage of time. Moreover, as this is a very hot topic of curiosity arousing and debate, at present, it is loudly commented in several guest lectures, seminars, workshops and conferences of not only National but also International levels. Thus, it is the right time to study, quite critically, Ethical issues in Marketing Research in India. OBJECTIVES The following are the Objectives of this Paper. 1. To develop conceptual Understanding about Ethics 2. To Study the Ethical Issues in Marketing Research in India SCOPE . The Scope of this Paper extends to the development of conceptual understanding about Ethics. The paper further throws some light on some selected Ethical Issues in marketing Research in India. METHODOLOGY The following Methodology was adopted for writing this Paper. 1. The review of literature was done through several books and significant websites (Secondary Data) in order to learn (a) The overall concept of Ethics and (b) Ethical Issues in Marketing Research in India. 2. The paper is based on Secondary Data. SOURCES OF SECONDARY DATA The Sources of Secondary Data include Books and Websites, related to Marketing Research, the details of which are given in the Section, of Categorized Bibliography, which is located at the end of this Paper. ETHICS The Oxford dictionary defines the word ‘Ethics’ as the ‘Moral Principles that govern or influence a person’s behavior’. The word ‘Moral’ is concerned with the principles of right or good and wrong or bad human behavior. After learning the definition of the word ‘Ethics’ , as mentioned above, some unanswered and unavoidable questions do crop up. What is right? What is wrong? What is good? What is bad? Who would decide as to what is good or bad or right or wrong? Therefore, it is not only personal but also relative concept. Furthermore, what is right is good, always. But, what is not right which may be bad may not be wrong, always, as it may be right in some situation. Value system of right and wrong or good or bad, honesty or dishonesty, just or unjust, equitable or inequitable is, in fact, the real or actual practical base for smooth and satisfactory working of a business. Overall adoption of ethics is, indeed, a matter of great concern although they are partially followed by some of the reputed business houses. Prof. Arun Monappa has quoted some of the references from the book ‘Ethics in Business’ authored by T. Baumhart. In this book it is stated that Ethical means confirming to the principles of human conduct, or it also means according to common usage. Moreover, the words like just or honest are interpreted synonymous with the word ‘Ethical.’ Ethical standards are basically the ideals or the guiding principles of human conduct. Every society, religion or Institution has its own Ethical standards or Moral values. As per the Vendantic outline of Ethical vision given by Prof. S. K. Chakraborty – one of the recognized authorities on the topics of Ethics and Management, in Vedas, Upanishads, Smrutis, Ramayana Mahabharata and Kautilya’s Arthaashastra, there are references to the different diversions of individual and social norms and ethical behavior at appropriate places. In order to understand standard Ethical Practices, Ethical Codes like Marketing Research Association Code (MRAC), Advertising Standards Council of India (ASCI), American Marketing Association’s Codes of Ethics, American Sociological Association’s Codes of Ethics, American Psychological Association’s Code of Ethics, to mention a few, can be referred to. Furthermore, the Marketing Research Association Code in respect 33
International Journal of Advance and Innovative Research Volume 2, Issue 3 (I) : July - September , 2015
ISSN 2394 - 7780
of Marketing Research Standards is basically designed with the prime objective to promote an Ethical Culture in the profession of Marketing Research where the principles of Honesty, Professionalism, Fairness and Confidentiality combine to support the success of the profession. ETHICAL ISSUES IN MARKETING RESEARCH IN INDIA The following few are the selected Ethical Issues in Marketing Research in India. (a) Privacy and Confidentiality (b) Intrusion (c) Deception through Misrepresentation (d) Undesirable Practices Let s discuss each of these issues in detail, one by one, in the following lines. (a) Privacy and Confidentiality While collecting Primary Data, many a time, the field investigators encroach the privacy of a respondent by asking very personal or highly Confidential Questions or detail Information related to Secret Matters, either related to the individual respondent or the Company itself. (It may necessarily not be out of place to point out over here that Secret Matters include those maters, the sharing of which with the field investigator may endanger the Unique Selling Proposition or the Brand Name or the Image of the Company in the contemplation, especially, of the External People.) Furthermore, some field investigators use hidden cameras, some of them study as to how the credit cards or ATM cards are used by the consumers for purchases, some of them misuse the private information obtained from the customer databases of different companies, etc. (b) Intrusion Not only personal but also the telephonic or mobile interviews are experienced annoying and intruding by the respondents. Some such questions are asked by the interviewers which make the position of the respondent, quite awkward, at times. Moreover, instead to take care of the convenience of the respondent, the interviewers, in general, tend to take care of their self convenience. In the process, they comfortably forget that they get their convenience caused at the cost of the inconvenience of the respondents. When the same interviewing trend continues, over a period, in respect of the same respondent, the respondent tends to be reluctant to cooperate for the subsequent interview. (c) Deception through Misrepresentation The Market Researchers, more often than not, deceive the respondents, quite tactfully. In order to collect data, especially from the competitor, the researchers send dummy customers to the key persons and places where required data can really and readily be available. Moreover, some researchers pretend themselves to be the shoppers and thereafter conduct an Opinion Survey about different products, services or the brands. (d) Undesirable Practices Besides, Marketing Researchers indulge in some undesirable practices like Sugging (Selling under the guise of Research) or Frugging (Fund Raising under the guise of Research). However, these kinds of activities on the part of Fake Researchers, no doubt, tarnish the image of the Genuine Researchers who conduct it sincerely and seriously. RESEARCH PAPER LIMITATIONS Like every other Paper, this Paper also proceeds with the following limitations. 1. As the present Study is strictly of Academic Orientation, some sort of adaptation to prevailing market conditions is naturally necessary prior to practical application. . 2. As this study is based on Secondary Data, all the limitations of Secondary Data have direct and deep impact on the Researcher’s Views and Opinions. 3. The narration about different Codes of Ethics is covered in brief for want of length of the paper. 4. Only a few Selected, Repetitive and leading Ethical Issues related to Marketing Research in India are covered in this paper for want of length of the paper. SCOPE FOR FUTURE RESEARCH During the course of the study of this Paper, the researcher found out that there is an ample scope and adequate potential for research in future for the following topics related to Ethical Issues in Marketing Research in India. 34
International Journal of Advance and Innovative Research Volume 2, Issue 3 (I) : July - September , 2015
ISSN 2394 - 7780
1. A Contemporary Study to improve the Level of Ethical Marketing Research Practices in India 2. A Critical Study of Perspectives of Ethical Issues in Marketing Research in India 3. A Critical Study of Ethical Issues in Presenting a Report of Marketing Research in India REFERENCES Books 1. Avasarikar D. P., Dr. Chordiya S. B., 2007, Marketing Research, Nirali Prakashan, India, Pune, edn1. 2. Beri G. C., 2009, Marketing Research, Tata McGraw Hill Education Pvt. Ltd., India, New Delhi, edn4. 3.
Easwaran Sunanda, Singh S. J., 2008, Marketing Research, Concepts, Practices and Cases, Oxford University Press, India, New Delhi, edn1.
4. Kakade M. D., Marketing Management, 2003, Marketing Management, Nirali Prakashan, India, Pune, edn1. 5. Kotler, Keller, Koshy and Jha, 2009, Marketing Management, Pearson Prentice Hall, U. S. A., edn13. 6. Luck D. J., Rubin R. S., 2008, Marketing Research, Prentice Hall of India Pvt. Ltd., India, New Delhi, edn7. 7. Nargundkar Rajendra, 2008, Marketing Research, Text and Cases, Tata McGraw Hill Education Pvt. Ltd., India, New Delhi, edn3. 8. Sherlekar S. A., Krishnamoorthy R, 2012, Marketing Management, Concepts and Cases, Himalaya Publishing House, Mumbai, edn14. 9. Tull D. S., Hawkins D. I., 1983, Marketing Research, Measurement and Method, PHI Learning Pvt. Ltd., India, New Delhi, edn6. Websites 1. www.acrwebsite.org 2. www.boundless.com 3. www.indiaclass.com 4. www.marketingresearch.org 5. www.slideshare.net 6. www.smallbusiness.chron.com 7. www.zenportfolios.com
35
International Journal of Advance and Innovative Research Volume 2, Issue 3 (I) : July - September , 2015
ISSN 2394 - 7780
EVOLUTION OF THE REGIONAL RURAL BANKSIN INDIA Sulagna Das Research Scholar, KIIT School of Management, Bhubaneswar ABSTRACT The present study focuses on the amalgamation pattern of the fifty six (56) Regional Rural Banks (RRBs) of India,state wise. The paper gives an idea about the status of the RRBs starting from the date of their formation till date. The changes occurred in their organisational structure due to amalgamation and their present financial condition. The study is exploratory in nature and is totally based on secondary data published in the individual website of the banks, website of RBI and NABARD, and different journals. Key Words: Regional Rural Banks, Amalgamation, Performance, India, States INTRODUCTION The Gramin banks or the Regional Rural Banks (RRBs)in India have been established in the year 1975, has travelled a long journey. In a developing country like India, rural development is a matter of big concern, and these RRBs were formed with the intension of developing the rural sector of the country, by providing bank finance / loans to the small and marginal farmers, agricultural labourers, artisans and small entrepreneurs in rural areas, as well as encourage them to earn on their own. The RRBs have passed through critical periods, by incurring losses, which resulted in theirdoubtful survival, sooner the Government of India, took a decision of merging these banks with their sponsor banks, to encourage their revival process.Though majority of these banks have improved a lot and has proved to be financially viable, some of them are still perpetually sick. The Amalgamation process of the gramin banks has been initiated, with an objective of enlarging the operational areas of these banks. As some of these RRBswere confined to one or two districts of a state, this caused hindrance towards the growth of these banks geographically.As per the recent list published in the year 2014, in the month of August, out of originally one ninety six (196) only fifty six (56) RRBs are operating in our country, with a network of 19,082 branches and covering 642 districts in 27 states (including Puducherry). The fifty six (56) RRBs include, Five (5) in Andhra Pradesh, One (1) in Arunachal Pradesh, Uttarakhand, Chhattisgarh, Himachal Pradesh, Kerala, Tripura, Meghalaya, Mizoram, Nagaland, Manipur, Puducherry and Haryana, Seven (7) in Uttar Pradesh, Two (2) in Assam, Odisha, Tamil Nadu, Rajasthan, Maharashtra, Jharkhand, and Jammu and Kashmir, and Three (3) in West Bengal, Gujarat, Bihar, Madhya Pradesh, Karnataka and Punjab, under the twenty (20) sponsored commercial banks namely State Bank of India, Bank of Baroda, Bank of India, Allahabad Bank, Indian Bank, Indian Overseas Bank, Punjab National Bank, United Commercial Bank, United Bank of India, Union bank of India, Central Bank of India, Syndicate Bank, State Bank of Hyderabad, Andhra Bank, Dena Bank, Jammu & Kashmir Bank, State Bank of Mysore, Canara Bank, Bank of Maharashtra, and State Bank of Bikaner andJaipur. The process of mergers initiated by the Indian Government has been put on hold, as per the reports of June, 2014, no fresh proposal for amalgamation will be taken further, as the Government of India will focus on improving the performance as well as the profitability of these newly formed banks, by increasing the pool of investors to tap capital for these RRBs. The Government of India has been making various efforts in making these RRBs a profitable organisation by recapitalisation, by allowing the RRBs lend in consortium finance, foreign markets, and commercial projects. The RRBs have been moving forwards towards the core banking solution for effective operation and to increase customer base, and according to the recent reports, 20 RRBs has reached the CBS platform. There are still unresolved cases of single gramin banks covering few states of the country, namely Arunachal Pradesh, Meghalaya, Manipur, Nagaland Mizoram and Tripura. The RRBs of these states are having limitations in their operations, which adversely affect their performance and profitability and this is a great matter of concern for these banks, as well as to the country’s developing economy. A detailed analysis of the constraints as well as a solution to these is an urgent need. Performance of the RRBsin India collectively as on 2013-14: There were fifty seven(57) RRBs, {now fifty six (56), as on August, 2014} covering 642 districts, which 19,082 number of branches as on 31st March, 2014. As per the reports the aggregate deposits grew 13%, investments grew 2%, borrowings grew 34% and outstanding loans and advances grew 17%. All the fifty seven (57) RRBs have earned profit of Rs.2, 833 crores. Forty nine (49) out of fifty seven (57) RRBs are financially and sustainably viable as there is an increasing percentage (89%) of earning profit and carrying no accumulated loss, the remaining 11% that is eight (8) RRBs with accumulated losses, had gone down to 17% as on 31st march, 2014. The reserve increased to Rs. 15,736 36
International Journal of Advance and Innovative Research Volume 2, Issue 3 (I) : July - September , 2015
ISSN 2394 - 7780
crores and net worth increased to Rs. 21,199 crores. The recovery percentage has gone up to 81.9% as on 30th June, 2013. The gross NPA percentage has declined to 4.4% as on 31st March, 2014.(Nabard, n.d.) OBJECTIVES 1. To understand the merging pattern of the RRBs in all the states of India. 2. To analyse if all the states encouraged and accepted the merger process of the RRBs 3. To analyse the past and the present situation of the RRBs based on each state 4. To compare between the RRBs of different states SCOPE OF THE STUDY The study is restricted to the RRBs operating in all the twenty seven (27) states of India. Namely Andhra Pradesh, Arunachal Pradesh, Assam, Rajasthan, Gujarat, Bihar, Jharkhand, Odisha, West Bengal, Haryana, Madhya Pradesh, Uttar Pradesh, Tamil Nadu, Punjab, Puducherry, Kerala, Karnataka, Manipur, Meghalaya, Nagaland, Tripura, Mizoram, Jammu and Kashmir, Himachal Pradesh, Maharashtra, Chhattisgarh, and Uttarakhand. RESEARCH METHODOLOGY The study is fully based on the secondary data that are collected from published reports and financial statements as well as from individual website of the RRBs, Nabard and Reserve Bank of India. In this direction various research papers, authentic journals and websites have been considered. Twenty Seven states of our country Indiahave been studied individually based on the status of the RRBsthat are operating presently in that particular state, as well as the number of RRBs that were operating previous to the amalgamation process, that started in 2004-05. In the study it has been also considered, the districts as well as the number of branches these new amalgamated banks are having, their financial status as on 2013-14 financial year. STUDY STATE WISE IN DETAILS Andhra Pradesh:The RRBs of Andhra Pradesh participatemore cooperatively and more energetically, to uplift the status of the rural sector by developingthe rural farm and non-farm sector, and focusing on the deprived section of the society and encouraging rural business and rural crafts by amalgamation process of the RRBs.Presently five RRBs are operating in the state of Andhra Pradesh. Namely Andhra Pradesh Gramin Vikash Bank, Andhra Pragati Gramin Bank, Chaitanya Godavari Gramin Bank, Deccan Gramin Bank, now known as Telengana Gramin Bank and Saptagiri Grameena Bank. These five banks are in their amalgamated form, and the details of the amalgamation can be seen in Table1. Table 1: Status of Amalgamation in Andhra Pradesh
Source: Computed 37
International Journal of Advance and Innovative Research Volume 2, Issue 3 (I) : July - September , 2015
ISSN 2394 - 7780
Performance of the RRBs in Andhra Pradesh:All these banks are in the profitable position as on the financial year 2013-14. Telengana Gramin bank has a net worth of Rs.369.23 Croreas on 31.03.2014, with a customer base of over 23.98 lakh, and is capable of extending personalized & satisfactory services to all its customers. These RRBs are more focused on ‘customer centric’ products, and is also offering higher rates of interest on term deposits in comparison to the commercial banks. Andhra Pradesh Gramin Vikash Bank started from only Rs 4001 Crore of total business as on 31.3.2006 and reached to Rs 15173 Crore as on 31.8.2014 with a 279% growth, which indicates they are gaining public confidence day by day. Chaitanya Godavari Gramin Bank as on 31.03.2014had a net worth of Rs.146.51 crore and their aggregate business stood at 3391.37crore. Andhra Pragathi Grameena Bank has been adjudged as the best bank, with a total business of Rs.13262.17 Crore and net profit of Rs.160.37 Cr as on 31.03.2014. Lastly Saptagiri Grameena Bank had a total business of Rs.4800 crores as on 31.03.2014, which grew 19.07% over previous year.(Official Website, n.d.) Assam:The main intension behind the formation of these RRBs in Assam was to develop and uplift the rural sector of the state. From its inception till date two banks are operating for the same cause, previously there were few more numbers of these banks, but in the year 2006, four of these RRBs were merged to form Assam Gramin Vikash Bank. The full details are available in Table2. On the other hand, LangpiDehangi Rural Bank has been operating since its inception in 1982, with 57 branches in the two hilly districts of Assam. Table 2: Status of Amalgamation in Assam
Source: Computed Performance of the RRBs in Assam:Both the RRBs of Assam are having profitable situation.Thetotal business of Assam Gramin Vikash Bank has been growing since 2006, from Rs. 2565 crores, to Rs.10098 crores as on 31st March,2014.LangpiDehangi Rural Bank has a credit deposit (CD) ratio of 42% as on 21.03.2014 and the total income earned for the year 2013-14 was Rs. 4395.82 lacks an increase of 7.54% over the previous year, net profit was 603.28 lacks, and CAR was 12.86%.(Official Website, n.d.) Bihar: The main objective of the RRBs of Bihar is to develop the rural sector by financing the farm& non-farm sectors, generate other employment programs for the rural mass, to deliver the best possible customer service to its customer, as well as generate income and profit for the each of the business centres.There were two phases of amalgamation of the RRBs in Bihar, in the first phase out of 16 gramin banks, 15 were merged,seven (7) banks were merged to form Uttar Bihar Kshetriya Grameena Bank, and three (3) banks were merged to form Bihar Kshetriya Grameena Bank. The number of banks decreased to five (5) after the first phase. In the second phase again Uttar Bihar Kshetriya Grameena Bank got merged with Kosi Kshetriya Grameena Bank to form Uttar Bihar Grameena Bank, and Bihar Kshetriya Grameena Bank got merged with Samastipur Kshetriya Grameena Bank to form Bihar Gramin bank. The details can be seen in table3. Table 3: Status of Amalgamation in Bihar
38
International Journal of Advance and Innovative Research Volume 2, Issue 3 (I) : July - September , 2015
ISSN 2394 - 7780
Source: Computed Performance of the RRBs in Bihar: Bihar Gramin Bank is sponsored by United Commercial Bank, had a total business of Rs. 5095 crore and Uttar Bihar Gramin Bank on the other hand had a profit of around 243 croreas on 31st March, 2014.(Official Website, n.d.) Chhattisgarh:Two phases of amalgamation took place in Chhattisgarh, first one was in 2006 and the second one was in September 2013. Presently only one bank operates in the state. The detail has been given in table number 4. Table 4: Status of Amalgamation in Chhattisgarh State
Sponsor Bank
Chhattisgarh
New RRBs
Amalgamated RRBs
State Bank of India
Chhattisgarh Grameena Bank
Dena Bank
Chhattisgarh Rajya Grameena Bank
BastarKshetriya Grameena Bank Bilaspur Raipur Grameena Bank RaigarhKshetriya Grameena Bank Chhattisgarh Grameena Bank Surguja Kshetriya Grameena Bank Durg Rajnandgaon Grameena Bank
Date of Amalgamation/HeadOffice
Operating Areas/Districts /Branches
30th June, 2006 (1st phase of amalgamation)
2nd September, 2013 (2nd phase) Sundar Nagar, Raipur
27 districtsand 584 branches
Source: Computed Performance of the RRBs in Chhattisgarh: The only Regional Rural Bank of Chhattisgarh was in a profitable condition as of March, 2014. Gujarat:Presently three (3) RRBs are operating in Gujarat, namely Baroda Gujarat Grameena Bank,Dena Gujarat Grameena Bank, and Saurashtra Grameena Bank. The details of their amalgamation has been given in the below table 5. Table 5: Status of Amalgamation in Gujarat State
Gujarat
Sponsor Bank Bank of Baroda
New RRBs
Baroda Gujarat Grameena Bank
Amalgamated RRBs
Panchmahal Vadodara Grameena Bank Surat Bharuch Grameena Bank Valsad Dangs Grameena Bank
Date of Amalgamation/ Head-Office 12th September, 2005 Bharuch
Operating Areas/Districts/ Branches 177 branches in 14- districts
39
International Journal of Advance and Innovative Research Volume 2, Issue 3 (I) : July - September , 2015 Dena Bank
Dena Gujarat Grameena Bank
State Bank of Saurashtra
SaurashtraGram eena Bank
BanaskanthaMehsanaGrameena Bank Kutch Grameena Bank Sabarkantha Gandhinagar Grameena Bank Jamnagar Rajkot Grameena Bank Junagadh Amreli Grameena Bank Surendranagar Bhavnagar Grameena Bank
ISSN 2394 - 7780
12th September, 2005 Gandhinagar
179 branches in7districts of Gujarat
21.12.2005 Rajkot
11 districts of Gujarat
Source:Computed Performanceof the RRBs in Gujarat: Baroda Gujarat Gramin made a rapid growth from total business of Rs.801 Crore in 2005, to Rs.3114 crore, as on 31st march, 2014.Saurashtra Grameena Bank and Dena Gujarat Gramin also incurred profit for the same year.(Official Website, n.d.) Haryana:To serve and develop the rural mass efficiently and earn profit for the bank was the sole intension behind the amalgamation of Sarva Haryana Gramin Bank. The details of amalgamation can be seen from table6. Table 6: Status of Amalgamation in Haryana State
Haryana
Sponsor Bank
New RRBs
Amalgamated RRBs
Punjab National Bank
Haryana Gramin Bank
AmbalaKurukshetriyaGrameen a Bank Haryana Kshetriya Grameena Bank Hissar-SirsaKshetriya Grameena Bank
Syndicate Bank
Gurgaon Gramin Bank
Established in the year 1976 (no amalgamation)
Punjab National Bank
SarvaHaryana Gramin Bank
Haryana Gramin Bank
Date of Amalgamation/ Head-Office 12.09.05 1st phase amalgamation
Operating Areas/Districts/ Branches
163 branches
29.11.2013 Rohtak 2nd phase amalgamation
All the 21 Districts of Haryana, 554 Branches
Gurgaon Gramin Bank
Source: Computed Performance of the RRBs in Haryana:Total business of the bank as on 30th June, 2014 was Rs.14921.77 crore, total deposits was Rs.8985.55 crore and total advances were Rs.5936.22 Crore. (Official Website, n.d.) Himachal Pradesh:The prime objective behind the establishment was to provide basic banking facilities to the remote rural sectors and rural masses in the form of productive creditfor agriculture, cottage and small scale industries, as well as allowed finance for housing, education, and transport to public under different schemes. Himachal Pradesh Gramin Bank is giving sincere effortto fulfil its obligations. The details of the amalgamation can be seen from table 7. Table 7: Status of Amalgamation in Himachal Pradesh State
Himachal Pradesh
Sponsor Bank Punjab National Bank State Bank of India
New RRBs
Himachal Pradesh Grameena Bank
Amalgamated RRBs Himachal Grameena Bank
Date of Amalgamation/HeadOffice
Operating Areas/Districts/ Branches
15th February 2013 Mandi
12 districts, with 190 branches
Parvatiya Grameena Bank
Source: Computed 40
International Journal of Advance and Innovative Research
ISSN 2394 - 7780
Volume 2, Issue 3 (I) : July - September , 2015
Performance of the RRBs of Himachal Pradesh:The bank has shown satisfactory performance in 2014. The total business was Rs.3597.74 crore, which included deposit base of Rs.2649.12 crore and advances Rs.948.62 crore, with a Net worth of Rs.120.02 crore and Reserves to the tune of Rs.104.58 croreas on 30.09.2014. The Gross profit and net profit was Rs. 12.52 crore and Rs. 8.66 crore respectively in September, 2014.(Official Website, n.d.) Jammu and Kashmir:The main objective of the Bank is to improve the economy of rural, semi-urban & urban centres. Table 8 shows the details of amalgamation. Table 8: Status of Amalgamation in Jammu and Kashmir State
Sponsor Bank
New RRBs
Amalgamated RRBs
Jammu and Kashmir
Jammu & Kashmir Bank State Bank of India
J & K Grameena Bank
Kamraz Rural Bank Jammu Rural Bank
EllaquaiDehati Bank
Was established on 16th, July 1979 No amalgamation took place
Date of Amalgamation/ Head-Office 30th June 2009 Jammu
Operating Areas/Districts/ Branches 11 Districts and 203 branches
Kashmir Srinagar
13 districts with 133 Branches,
Source: Computed Performance of the RRBs of Jammu and Kashmir:EllaquaiDehati Bank of Jammu and Kashmirhas been doing a great performance by increasing its total business to Rs. 30,37, 235 thousands, as on March, 2014, from Rs. 24,72,608 thousands as on March 2013.(Official Website, n.d.) Jharkhand:The RRBs of Jharkhand has been doing a great job by developing the rural economy and providing finance for the sake of agriculture, trade and commerce, and other productive activities in the rural areas. The details of amalgamation can be seen in table 9. Table 9: Status of Amalgamation in Jharkhand State
Sponsor Bank
Jharkhand
New RRBs
Bank of India
Jharkhand Grameena Bank
State Bank of India
Vananchal Grameena Bank
Amalgamated RRBs
Giridih Kshetriya Grameena Bank Hazaribagh Kshetriya Grameena Bank Ranchi Kshetriya Grameena Bank Singhbhum Kshetriya Grameena Bank Palamau Kshetriya Grameena Bank Santhal Paraganas Grameena Bank
Date of Amalgamation / Head-Office 12.06.2006 Ranchi
Operating Areas/Districts/ Branches 15 districts with 239 branches
30.06.2006 Dumka
9 districts, with 203 branches
Source: Computed Performance of the RRBs of Jharkhand:Total profit of Vananchal Gramin Bank and Jharkhand Gramin bank as on March, 2014 was Rs.1590.59 lakhs and Rs. 378574 thousands respectively, and Rs. 973.30 lakhs in the current financial year.(Official Website, n.d.) Kerala:Kerala Gramin Bank has been formed by amalgamation of North and South Malabar Grameena Banks, with the aim of developing the region. The details of the amalgamation process have been given in table10. Table 10: Status of Amalgamation in Kerala State
Kerala
Sponsor Bank Syndicate Bank Canara Bank
New RRBs
Kerala Gramin Bank
Amalgamated RRBs
North Malabar Grameena Bank
Date of Amalgamation/ Head-Office 8th July 2013 Malappuram, Kerala
Operating Areas/Districts/ Branches 14 districts with 542 branches
South Malabar Grameena Bank
Source: Computed 41
International Journal of Advance and Innovative Research Volume 2, Issue 3 (I) : July - September , 2015
ISSN 2394 - 7780
Performance of the RRBs in Kerala: Kerala Gramin Bank is the largest RRBs in the country with a total business of above 15,000 Crore as on March, 2014.(Official Website, n.d.) Punjab:Like theRRBs in other states, the RRBs of Punjab were formed for the welfare purpose of the rural mass. The details of the amalgamation have been given in table 11. Table 11: Status of Amalgamation in Punjab State
Sponsor Bank
New RRBs
Amalgamated RRBs
Punjab
Punjab National Bank
Punjab Grameena Bank
Gurdaspur-Amritsar Kshetriya Grameena Bank Kapurthala-Ferozpur Kshetriya Grameena Bank ShivalikKshetriya Grameena Bank
State Bank of Patiala Punjab and Sindh Bank
Malwa Gramin Bank Sutlej Gramin Bank
Was established on 27.02.1986, no amalgamation Established on 22.03.1986
Date of Amalgamation/ Head-Office 12th September, 2005 Kapurthala
Operating Areas/Districts/ Branches 264 branches across 13 districts
Sagrur
68 branches in 5 districts 6 districts with 31 branches
Bathinda
Source: Computed Performance of the RRBs of Punjab: Punjab Gramin Bank had total business of Rs.6595.88 crores as on 31.01.2015, the total reserves and net worth was Rs. 482 crores and Rs.504 crores respectively. MalwaGramin Bank had a deposit and advance of Rs 879.81 crores and Rs 864.55 crore respectively. It is a profit earning bank and its profit and reserves were Rs 14.53 crores and Rs 125.47 crores respectively as on 31.03.2014.Sutlej Gramin Bank on the other hand had a net profit of Rs. 2.36 crore as on March, 2014.(Official Website, n.d.) Karnataka:The RRBs in Karnataka has been formed, was the amalgamation was done in two phases, to provide financial facilities to the rural people. The details of amalgamation can be seen in table12. Table 12: Status of Amalgamation in Karnataka State
Sponsor Bank
New RRBs
Karnataka
Canara Bank
Pragathi Grameena Bank
State Bank of Mysore
Cauvery Kalpatharu Grameena Bank
Syndicate Bank
Karnataka Vikas Grameena Bank
Corporation Bank Vijaya Bank State Bank of Mysore Govt. of Karnataka Canara Bank
Kaveri Grameena Bank
Pragathi Krishna Grameena Bank
Amalgamated RRBs
Chitradurga Grameena Bank Kolar Grameena Bank Sahyadri Grameena Bank TungrameenaBankhadra Grameena Bank Cauvery Grameena Bank Kalpatharu Grameena Bank Bijapur Grameena Bank Malaprabha Grameena Bank Netravati Grameena Bank VaradaGrameena Bank Chikmagalur Kodagu Grameena Bank Visveshvaraya Grameena Bank Cauvery Kalpataru Grameena Bank Pragathi Grameena Bank
Date of Amalgamation/ Head-Office 12th September, 2005 1st phase of amalgamation
Operating Areas/Districts /Branches
24th May, 2006 1st phase of amalgamation 12th September, 2005 Dharwad
9 districts with 552 branches
01st November, 2012 Mysuru City
10 southern districts with 400 Branches
23rd August 2013 Gulbarga
10 districts 625 branches
Krishna Grameena Bank
Source: Computed 42
International Journal of Advance and Innovative Research
ISSN 2394 - 7780
Volume 2, Issue 3 (I) : July - September , 2015
Performance of the RRBs of Karnataka:Kavery Gramin bank had a registered business growth of 22.49% during the last financial year, reaching a level of Rs.8401.50 crores. The net profit of the Bank has grown by 36.52% registering Rs.44.75 crores. Pragati Krishna Gramin Bank on the other hand had a total business, of over Rs.16697 crores as on March 2014. The bank earned a net profit of Rs.104.70 Crore for the year 2013-14 compared to Rs.78.93 Crore in the year 2012-13, with an increase in the growth rate by 32.65%. (Official Website, n.d.) Total Business of Karnataka Vikas Grameena Bank has crossed ₹ 16,000 crore as on December, 2014. (Karnataka Vikas Grameena Bank opens 3 lakh accounts,2014) Maharashtra:The RRBs were formed to develop agriculture, trade, commerce, and industry. Presently two RRBs are operating, details of which has been given in table13. Table 13: Status of Amalgamation in Maharashtra State
Sponsor Bank
New RRBs
Amalgamated RRBs
Maharashtra
Central Bank of India
VidharbhaKshet riya Grameena Bank
Bank of India
Wainganga Kshetriya Grameena Bank
Bank of Maharashtra
Maharashtra Godavari Grameena Bank
Bank of India
Wainganga Krishna Grameena Bank
Bank of Maharashtra
Maharashtra Grameena Bank
Govt. of Maharashtra Central Bank of India
VidhrabhaKonk an Grameena Bank
Akola Kshetriya Grameena Bank BuldhanaGrameena Bank Yavatmal Kshetriya Grameena Bank Bhandara Grameena Bank Chandrapur GadchiroliGrameena Bank Aurangabad Jalna Grameena Bank Thane Grameena Bank Ratnagiri Sindhudurg Grameena Bank Solapur Grameena Bank Wainganga Grameena Bank Thane Grameena Bank Marathwada Grameena Bank Maharashtra Godavari Grameena Bank VidhrabhaKshetriya Grameena Bank Wainganga Krishna Grameena Bank
Date of Amalgamation/ Head-Office 12th September, 2005
Operating Areas/Districts/ Branches
1st August, 2006
25th March, 2008
15th December, 2008
20th July, 2009 ShivajinagarNande d
16 districts, 348 branches
28th February, 2013 Nagpur
7 districts/ regions
Source: Computed Performance of the RRBs in Maharashtra:Net Profit MGB and VKGB are Rs. 355173 thousands, and Rs. 208150 thousands respectively.(Official Website, n.d.) Madhya Pradesh:Three RRBs are operating in the state, details of which can be seen in table 14. Table 14: Status of Amalgamation in Madhya Pradesh State
Madhya Pradesh
Sponsor Bank Bank of India
New RRBs
Narmada MalwaGrameena Bank
Amalgamated RRBs
Dewas-Shajapur Grameena Bank Indore-Ujjain Kshetriya Grameena Bank NimarKshetriya Grameena Bank Rajgarh-SehoreKshetriya Grameena Bank
Date of Amalgamation/ Head-Office 3rd April, 2006
Operating Areas/Districts /Branches
43
International Journal of Advance and Innovative Research
ISSN 2394 - 7780
Volume 2, Issue 3 (I) : July - September , 2015 Central Bank of India
Chambal-Gwalior Kshetriya Grameena Bank
Central Bank of India
SatpuraKshetriya Grameena Bank
Central Bank of India
Satpura Narmada Kshetriya Grameena Bank
State Bank of India
Madhya BharathGrameena Bank
State Bank of India Allahabad Bank Union Bank of India State Bank of India Central Bank of India Uco Bank
MadhyanchalGrame en Bank
Bank of India Bank of Baroda
Narmada JhabuaGrameena Bank
Chambal Kshetriya Grameena Bank Gwalior-Datia Kshetriya Grameena Bank Chhindwara-Seoni Kshetriya Grameena Bank Hoshangabad Kshetriya Grameena Bank Mandla-Balaghat Kshetriya Grameena Bank Shahdol Kshetriya Grameena Bank Satpura Kshetriya Grameena Bank Chambal-Gwalior Kshetriya Grameena Bank Ratlam Mandsaur Kshetriya Grameena Bank Bundelkhand Kshetriya Grameena Bank Damoh-Panna Sagar Grameena Bank Shivpuri-Guna Kshetriya Grameena Bank Madhya Bharath Grameena Bank Sharda Grameena Bank
1st July, 2006
1st June, 2006
8th April, 2008
30th June, 2006
30th June, 2006 Sagar
12 districts with 405 branches
8th October, 2012 Chhindwara
451 branches in 25 districts
1st November, 2012 Indore
12 districts
RewaSidhiGrameena Bank Central Madhya Pradesh Grameena Bank
Satpura Narmada Kshetriya Grameena Bank Vidisha Bhopal Kshetriya Grameena Bank Mahakaushal Kshetriya Grameena Bank Narmada Malwan Grameena Bank Jhabua Dhar Kshetriya Grameena Bank
Source: Computed Performance of the RRBs in Madhya Pradesh:Total profit of Narmada JhabuaGrameen Bank was Rs. 82.85 crore as on 31.03.2014. Total business of Madhyanchal Gramin bank was Rs.7387 crore and net profit was Rs. 23.40 crores as on 31.03.2014.(Official Website, n.d.) Uttarakhand:Uttarakhand Gramin Bank came into existence after amalgamation of Uttaranchal Gramin Bank and NainitalAlmora Kshetriya Gramin Bank. The details can be seen in table 15. Table 15: Status of Amalgamation in Uttarakhand State
Uttarakhand
Sponsor Bank
State Bank of India
State Bank of India
New RRBs
Uttaranchal Grameena Bank
Amalgamated RRBs
AlaknandaGrameena Bank
Date of Amalgamation/ Head-Office 30th June, 2006 (1st phase)
Operating Areas/Districts/B ranches
Ganga-Yamuna Grameena Bank Pithoragarh Kshetriya Grameena Bank
44
International Journal of Advance and Innovative Research
ISSN 2394 - 7780
Volume 2, Issue 3 (I) : July - September , 2015 Bank of Baroda
Uttarakhand Grameena Bank
1stNovember, 2012 Dehradun
Uttaranchal Grameena Bank Nainital Almora Kshetriya Grameena Bank
13 districts of Uttarakhand, with 260 branches
Source: Computed Performance of the RRBs in Uttarakhand:The total business was Rs. 4243.98 crores, with a growth of 22.28% and a profit of Rs. 11.30 croresas on March, 2014.(Official Website, n.d.) Odisha:Presently there are two banks operating in Odisha. The details of the amalgamation can be seen in table 16. Table 16: Status of Amalgamation in Odisha State
Sponsor Bank
Odisha
Indian Overseas Bank Uco Bank State Bank of India
State Bank of India Andhra Bank Indian Overseas Bank
New RRBs
Neelachal Gramya Bank KalingaGramya Bank Utkal Gramya Bank
Utkal Grameena Bank Odisha Gramya Bank
Bank of India Uco Bank
Amalgamated RRBs
Puri Grameena Bank Dhenkanal Grameena Bank Balasore Grameena Bank Cuttack Grameena Bank Bolangir Anchalik Grameena Bank Kalahandi Anchalik Grameena Bank Koraput Panchabati Grameena Bank Utkal Gramya Bank Rushikulaya Grameena Bank Baitarani Grameena Bank Kalinga Grameena Bank Neelachal Grameena Bank
Date of Amalgamation/ Head-Office 31st August, 2007 2nd January, 2006 31st July, 2006
Operating Areas/Districts /Branches
1stNovember, 2012 Bolangir
17 districts with 426 branches
7th January 2013 Bhubaneswar
525 branches in13 districts
Source: Computed Performance of the RRBs in Odisha:The profit after tax and total business of Odisha Gramya Bank as on March,2014 are Rs. 1442.24 Lakhs Rs. 1093961.34 lakhs respectively.(Official Website, n.d.) West Bengal:The land ofWest Bengal itself has immense potential both for agriculture and industry. The three RRBs of the state are doing a great job in enhancing agricultural and industrial productivity in the rural areas. Besides, introduction of non-traditional crop cultivation and multi-dimensional approach for rising food production, these banks are also providing microfinance for the upliftment of the state’ economy. Details of amalgamation have been given in table17. Table 17: Status of Amalgamation in West Bengal State
Sponsor Bank
New RRBs
West Bengal
Uco Bank
Paschim Banga Grameena Bank
United Bank of India
Bangiya Grameena Vikash Bank
Central Bank of India
Uttar Banga Kshetriya Grameena Bank
Amalgamated RRBs
Howrah Grameena Bank Bardhaman Grameena Bank Mayurakshi Grameena Bank Gaur Grameena Bank Mallabhum Grameena Bank Murshidabad Grameena Bank Nadia Grameena Bank Sagar Grameena Bank Established in 7th March 1977
Date of Amalgamation/ Head-Office 26th February, 2007 Howrah
Operating Areas/Districts/ Branches 219 branches in 4 districts
21st February, 2007 Murshidabad
11 districts, with 557 branches
Cooch Behar
3 districts with 26 branches
Source: Computed 45
International Journal of Advance and Innovative Research
ISSN 2394 - 7780
Volume 2, Issue 3 (I) : July - September , 2015
Performance of the RRBs in West Bengal: Total business of Bangiya Gramin Vikash Bank was Rs. 13375.75 crores, and net profit was Rs. 32.28 crores respectively. Paschim Banga Gramin Bank has also reported a net profit of Rs.19 crores thereby reducing accumulated loss to Rs.98 crore as on 31.03.2014. Total equity and total asset of Uttarbanga Kshetriya Gramin Bank was Rs. 1028.31 million and Rs. 22410.19 million respectively as on March, 2014.(Official Website, n.d.) Rajasthan:Agriculture followed by animal husbandry are the main economic activities of Rajasthan, due to scanty rainfall, they apply artificial ways of irrigation. The two RRBs that are presently operating provide finance for canal projects and agriculture. Details of the amalgamation can be seen in table18. Table 18: Status of Amalgamation in Rajasthan State
Sponsor Bank
New RRBs
Amalgamated RRBs
Rajasthan
Bank of Baroda
Baroda Rajasthan Grameena Bank
Punjab National Bank
Rajasthan Grameena Bank
State Bank of Bikaner & Jaipur
Marwar Ganganagar Bikaner Grameena Bank
Aravali Kshetriya Grameena Bank Bhilwara-Ajmer Kshetriya Grameena Bank Bundi-Chittorgarh Kshetriya Grameena Bank Dungarpur-Banswara Kshetriya Grameena Bank Marudhar Kshetriya Grameena Bank Alwar Bharatpur Anchalik Grameena Bank Shekhawati Grameena Bank Bikaner Kshetriya Grameena Bank
Uco Bank
Jaipur TharGrameena Bank
Central Bank of India Bank of Baroda
Baroda Rajasthan Kshetriya Grameena Bank
Punjab National Bank State Bank of Bikaner & Jaipur UCO Bank ICICI Bank State Bank Of Bikaner & Jaipur
Marudhara Grameena Bank
Mewar Anchalik Grameena Bank Rajasthan MarudharaGram eena Bank
Marwar Grameena Bank Sriganganagar Kshetriya Grameena Bank Jaipur Nagaur Anchalik Grameena Bank Thar Anchalik Grameena Bank Baroda Rajasthan Grameena Bank Hadoti Kshetriya Grameena Bank Rajasthan Grameena Bank
Date of Amalgamation /Head-Office 3rd February, 2006 Ajmer
Operating Areas/Districts /Branches
24th January, 2006 12th June, 2006
27th January, 2006
1 January, 2013 Ajmer
705 branches in 21 districts
Marwar Ganganagar Bikaner Grameena Bank
25th February, 2013
9 districts
Jaipur Thar Grameena Bank Established in 1983
Udaipur
Marudhara Grameena Bank Mewar Aanchalik Grameena Bank
1st April, 2014 Jodhpur
15 Districts with 462 branches
Source: Computed Performance of RRBs of Rajasthan:Total Businessof Rajasthan MarudharaGrameen Bank was Rs. 9830.89 crore, the total profit of Baroda Rajasthan Kshetriya Grameena Bank increased from Rs. 1479856 as on March, 2013, to Rs. 2317500 as on March,2014.(Official Website, n.d.) Uttar Pradesh:Amalgamation in Uttar Pradesh has been done in two phases. Presently there are seven (7) RRBs operating in the state. Like other states, the amalgamation process helped the RRBs to increase the 46
International Journal of Advance and Innovative Research
ISSN 2394 - 7780
Volume 2, Issue 3 (I) : July - September , 2015
efficiency in their operations and improve the socio-economic condition of the rural people of the state. The details of amalgamation can be seen in table number 19. Table 19: Status of Amalgamation in Uttar Pradesh State
Uttar Pradesh
Sponsor Bank
New RRBs
Allahabad Bank
Lucknow Kshetriya Grameena Bank
Allahabad Bank
Triveni Kshetriya Grameena Bank
Bank of Baroda
Baroda Eastern Uttar Pradesh Grameena Bank
Bank of Baroda
Baroda Western Uttar Pradesh Grameena Bank
Canara Bank
Shreyas Grameena Bank
Punjab National Bank
Uttar Pradesh Grameena Bank
State Bankof India
Purvanchal Grameena Bank
Union Bank of India
Kashi Gomti Samyut Grameena Bank
Punjab National Bank
Sarva U.P. Grameena Bank
Bank of India
Aryavart Grameena Bank
Amalgamated RRBs
Bhagirath Grameena Bank Sarayu Grameena Bank Shravasti Grameena Bank ChattrasalGrameena Bank Tulsi Grameena Bank Vindhyavasini Grameena Bank Allahabad Kshetriya Grameena Bank Faizabad Kshetriya Grameena Bank Fatehpur Kshetriya Grameena Bank Kanpur Kshetriya Grameena Bank Pratapgarh Kshetriya Grameena Bank Raebareli Kshetriya Grameena Bank Sultanpur Kshetriya Grameena Bank Bareilly Kshetriya Grameena Bank Shahjahanpur Kshetriya Grameena Bank Aligarh Grameena Bank Etah Grameena Bank Jamuna Grameena Bank Hindon Grameena Bank Muzaffarnagar Kshetriya Grameena Bank Vidur Grameena Bank Basti Grameena Bank Gorakhpur Kshetriya Grameena Bank Gomti Grameena Bank Kashi Grameena Bank Samyut Kshetriya Grameena Bank Uttar Pradesh Grameena Bank Rani Lakshimibai Kshetriya Grameena Bank Devi Patan Kshetriya Grameena Bank Kisan Grameena Bank Avadh Grameena Bank Barabanki Grameena Bank Farrukhabad Grameena Bank
Date of Amalgamation/ Head-Office 1st March, 2006
Operating Areas/Districts/ Branches
1st March, 2006
23rd February, 2006 (1st phase)
23rd February, 2006 (1st phase)
1st June, 2006
21st December, 2005
12th September, 2005
12th September 2005 Varanasi
7 districts, with nearly 175 branches
30th, November, 2007 Meerut
17 Districts, With 345 Branches.
3rdOctober, 2006 (1st phase)
321 branches
47
International Journal of Advance and Innovative Research
ISSN 2394 - 7780
Volume 2, Issue 3 (I) : July - September , 2015 Bank of Baroda
Baroda Uttar Pradesh Grameena Bank
Central Bank of India
Ballia – Etawah Grameena Bank
Baroda Eastern Up Grameena Bank Baroda Western Up Grameena Bank Ballia Kshetriya Grameena Bank
31st March 2008 (2nd phase) Raebareli
895 branches in 14 districts.
1stJanuary, 2010 (first phase)
8 districts, 135 branches
2nd March 2010 Banda
650 branches & 4 extension counters spread over 11 districts of Uttar Pradesh 350 branches
Allahabad Bank
Allahabad U.P. Grameena Bank
Etawah Kshetriya Grameena Bank Triveni Kshetriya Grameena Bank Lucknow Kshetriya Grameena Bank
Bank of India Up State CoOp. Bank
Aryavart Kshetriya Grameena Bank
Aryavart Grameena Bank Kshetriya Kisan Grameena Bank
1st Oct, 2012 (2nd phase) Lucknow
Bank of India
Grameena Bank Of Aryavart
Aryavart Kshetriya Grameena Bank Shreyas Grameena Bank
1st April, 2013 Lucknow
Canara Bank State Bank of India Central Bank of India Syndicate Bank
Purvanchal Bank
Purvanchal Grameena Bank
(3rd phase) 1st April 2013 Gorakhpur
15 districts of Uttar Pradesh with a network of 651 branches 571 branches in 11 districts
Ballia – Etawah Grameena Bank Prathama Bank
established on 2nd October, 1975
Moradabad
4 districts with a network of 301 branches
Source: Computed Performance of the RRBs of Uttar Pradesh: Total Business of Prathama Bank, Purvanchal Bank and Allahabad UP Gramin BankwasRs.8141 Crore, Rs. 10376 crore and Rs.11535.99 crore respectively. The total profit of Purvanchal Bank, Gramin Bank of Aryavart and Baroda UP Gramin Bankwas Rs. 30.02 crore, Rs. 173,14,91,293 and Rs. 4898868 respectively as on 31.03.2014 and total profit of SarvaUP Gramin Bank as on 31.12.2014 was Rs. 25.76 crore.(Official Website, n.d.) Tamil Nadu:PallavanGrama Bank and PandyanGrama Bank are the two RRBs operating in Tamil Nadu, which has been formed to improve the socio-economic condition of the rural people of the state. The details of amalgamation can be seen in table number 20. Table 20: Status of Amalgamation in Tamil Nadu State
Tamil Nadu
Sponsor Bank
Indian Bank Indian Overseas Bank
New RRBs
Amalgamated RRBs
Pallavan Grama Bank Pandyan Grama Bank
Adhiyaman Grama Bank Vallar Grama Bank Established in 9th March 1977
Date of Amalgamation/ Head-Office 31-08-2006 Salem Virudhunagar
Operating Areas/Districts/ Branches 15 Districts with 205 branches 16 Districts with 246 Branches
Source: Computed Performance of the RRBs in Tamil Nadu:Pandayan Grama Bank’s total business reached Rs. 7089.93 crore, deposits crossed Rs. 3179.97 crore credits crossed Rs. 3909.99 crores and operating profit was Rs. 162.58 crore as on March, 2014.PallavanGramya Bank on the other hand has been aiming to grow from Rs. 2200 crores to Rs.3000 crores by March 2014.(Official Website, n.d.) The states with only one state level RRBs: At present, seven states, of India,that includes, Arunachal Pradesh, Manipur, Meghalaya, Mizoram, Nagaland, Tripura, and Puducherry, have state-level RRBs.No amalgamation has taken place for these banks. Arunachal Pradesh: Arunachal PradeshRural Bankwas formed with the sole intension of providing banking services and financial facilities to the people of Arunachal Pradesh. The bank since the year 1983 has been playing a pivotal role in developing the economy of the state Arunachal Pradesh, as well as its people. Under 48
International Journal of Advance and Innovative Research
ISSN 2394 - 7780
Volume 2, Issue 3 (I) : July - September , 2015
the sponsorship of State Bank of India, Government of India, and State Government of Arunachal Pradesh this bank is continuing focusing on the welfare of the state as before. The details can be seen in Table21. Table 21: Status of Amalgamation in Arunachal Pradesh State
Sponsor Bank
Arunachal Pradesh
State Bank of India
New RRBs
Date of Establishment
Arunachal Pradesh Rural Bank
Head-Office
It was established on 30th November 1983. It is operating for 26 years.
Operating Areas/Districts/ Branches 8 districts with 28 branches
Naharlagun,
Source: Computed Performance of the RRBs in Arunachal Pradesh: Arunachal Pradesh Rural Bank is in a profitable condition with a total business of 44500.91 lacks as on 31st March, 2014.(Official Website, n.d.) Manipur:The Bank operated with an objective of economic development of the rural people especially the weaker sections of the society, the state, by participating in poverty alleviation programmes organised by Central and State Governments. Table 22: Status of Amalgamation in Manipur State Manipur
Sponsor Bank United Bank of India
New RRBs Manipur Rural Bank
Date of Establishment 28th May, 1981
Head-Office Manipur
Operating Areas/Districts/ Branches 28 (twenty eight) branches spread over in all the 9 (nine) districts
Source: Computed Performance of the RRBs in Manipur: Manipur Rural Bank was in a profitable position as on 31st March, 2014. Meghalaya:Meghalaya Rural Bank currently is the major provider of priority sector credit, in the form of crop loans to the small and marginal farmers in the State and nurtures self-help groups The Bank provides utmost support in implementing Swarna-jayanti Gram SwarozgarYojana (SGSY), as well as promotes Financial Inclusion and Financial Literacy among the rural folk. The details of the bank can be seen from table 23. Table 23: Status of Amalgamation in Meghalaya State Meghalaya
Sponsor Bank State Bank of India
New RRBs Meghalaya Rural Bank
Date of Establishment 29th December 1981
Head-Office Shillong
Operating Areas/Districts/ Branches 7 districts with 87 branches.
Source:Computed Performance of the RRBs in Meghalaya:The total business of the Bank was Rs. 1544.66 crore, and the net profit was Rs. 31.68 crore as on 31.04.2014. Both the areas showed enormous growth, total business grew more than Rs. 170 crore during the year, and net profit grew 12% over the last year.(Official Website, n.d.) Mizoram:Mizoram rural Bank has been formed for the welfare of the rural massin the state. The details about the bank can be seen in table number 24. Table 24: Status of Amalgamation in Mizoram State Mizoram
Sponsor Bank State Bank of India
New RRBs Mizoram Rural Bank
Date of Establishment 27th September, 1983
Head-Office Aizawl
Operating Areas/Districts/ Branches 8 Districts, with 78 branches
Source: Computed Performance of the RRBs in Mizoram:The total business of the Bank has increased from Rs.1694.59 crore in 2012-13 to Rs 1974.90 crore in 2013-14. The profit of the Bank has also increased from Rs.10.58 crore in 201213 to Rs.24.78 crore in 2013-14.(Official Website, n.d.) Nagaland:Nagaland rural Bank has been formed to improve the socio-economic condition of the rural people of the state. The details about the bank can be seen in table number 25.
49
International Journal of Advance and Innovative Research
ISSN 2394 - 7780
Volume 2, Issue 3 (I) : July - September , 2015 Table 25: Status of Amalgamation in Nagaland State
Sponsor Bank
Nagaland
State Bank of India
New RRBs
Date of Establishment
Nagaland Rural Bank
Head-Office Kohima
Operating Areas/Districts/ Branches All districts of Nagaland With 10 branches
Source: Computed Performance of the RRBs in Nagaland:Nagaland Rural bank was having a profitable position as on March, 2014. Tripura:Tripura Gramin Bank is dedicated to the amelioration of the socio-economic condition of the rural people of the state. The details about the bank can be seen in table number 26. Table 26: Status of Amalgamation in Tripura State
Sponsor Bank
Tripura
United Bank of India
New RRBs Tripura Rural Bank
Date of Establishment 21st December, 1976
Head-Office Agartala
Operating Areas/Districts/ Branches 8 Districts, with 142 branches
Source: Computed Performance of the RRBs in Tripura: Total profit for March, 2014 was Rs. 8269 lakhs, for September, 2014 was Rs. 5020 lakhs, and for October, 2014 was Rs. 3331 lakhs.(Official Website, n.d.) Puducherry:PuduvaiBharathiarGrama Bank has been formed to improve the socio-economic condition of the rural mass in the state. The details about the bank can be seen in table number 27. Table 27: Status of Amalgamation in Puducherry State
Sponsor Bank
New RRBs
Date of Establishment
Puducherry
Indian Bank
Puduvai Bharathiar Grama Bank
26th March, 2008
Head-Office
Puducherry
Operating Areas/Districts/ Branches four regions with 32 branches
Source: Computed Performance of the RRBs in Puducherry: The profit before tax earned by the bank was Rs. 800.25 lakhs, against Rs 603.38 lakhs, which was 33% more than the previous year’s PBT, the profit after tax on the other hand increased from Rs. 410.82 lakhs to Rs. 528.48 lakhs during the year thus showing a growth rate of 35% as of March, 2014.(Official Website, n.d.) COMPARATIVE ANALYSIS BETWEEN THE REGIONAL RURAL BANKS OF DIFFERENT STATES The RRBs have been doing a greatjob in the development of the rural sector.Especiallyduring thelast financial year 2013-2014, all the RRBs as seen from the study, were in a profitable position, many of them could get over the accumulated losses incurred previously, with the profit they earned. The RRBs of Andhra Pradesh, Assam, Bihar, Gujarat, Haryana, Himachal Pradesh, Kerala, Punjab, Karnataka, Madhya Pradesh, Uttarakhand, West Bengal, Uttar Pradesh, Tamil Nadu and few of the state level RRBs has been performing well, it was observed that their total business and total profit has reached the ‘crores’ mark. As observed Pragati Krishna Gramin Bank was in a leading position with a maximum total business of Rs. 16697 crores, followed by Andhra Pradesh Gramin Vikash Bank, Kerala Gramin Bank, Sarva Haryana Gramin Bank, and Bangiya Gramin Vikash Bank and Andhra Pragathi Grameena Bank in the fifth and sixth position with a total business of Rs. 15173 crores, Rs. 15000 crores, Rs. 14921.77 crores, Rs. 13375.75 crores, andRs.13262.17 crores respectively. CONCLUSION It can be concludedthat every state as noticed has been encouraging the amalgamation process. At present the central and the states prefer state level RRBs in some more states, for creating economies of scale and to push its financial inclusion agenda. States like Bihar, Karnataka and Punjab had given their consent to amalgamate their RRBs, in West Bengal Paschim Banga Gramin Bank and Uttar Banga Kshetriya Bank may get merged, to form a bigger entity in the near future. The objective behind which the amalgamation process was started in 2005, could be achieved, all the fifty six (56) RRBs in today’s date are in a profitable position with a CBS (core banking solution) platform. 50
International Journal of Advance and Innovative Research
ISSN 2394 - 7780
Volume 2, Issue 3 (I) : July - September , 2015
REFERENCE 1. Brief History of the Bank (n.d.) Retrieved fromhttps://www.sbbjbank.com/About-Us/history.htm 2. Director Report (UCO Bank) (2014) Retrieved from bank/directorsreport/companyid-9180.cms
http://economictimes.indiatimes.com/uco-
3. Financial Intermediaries RRBs (n.d.) Retrieved http://www.rbi.org.in/scripts/AboutUsDisplay.aspx?pg=RegionalRuralBanks.htm
from
4. FinMin puts amalgamation of RRBs on hold (2014) Retrieved from http://www.businessstandard.com/article/finance/finmin-puts-amalgamation-of-regional-rural-banks-on-hold114060900708_1.html 5. Gazette Notification for Amalgamation (2013) Retrieved from http://hgboa.co.in/gazette-notification-ofamalgamation/ 6. Karnataka Vikas Grameena Bank opens 3 lakh accounts (2014) Retrieved http://www.thehindubusinessline.com/news/states/karnataka-vikas-grameena-bank-opens-3-lakhaccounts/article6658420.ece
from
7. List of amalgamated RRBs as on September http://rbi.org.in/scripts/PublicationsView.aspx?id=15529
from
02,
2013
(2013)
Retrieved
8. List of RRBs amalgamated and newly opened as on March 2009 (2010) Retrieved from http://www.rbi.org.in/scripts/PublicationsView.aspx?id=12687 9. Nagaland Rural Bank (2013) Retrieved from http://www.meghalayaruralbank.co.in/images/MRB/Nagaland_RB/Nagaland%20RB-recruitment.pdf 10. Official website NABARD (n.d.) Retrieved from https://www.nabard.org/English/rrbs2.aspx 11. Official website of Allahabad UP Gramin Bank (n.d.) Retrieved from http://www.allahabadgraminbank.in/ 12. Official website of Andhra Pradesh Gramin Vikash Bank (n.d.) Retrieved from http://www.apgvbank.in/ 13. Official website of Andhra Pragathi Grameena Bank (n.d.) Retrieved from http://www.apgb.co.in/ 14. Official website of Arunachal Pradesh Rural Bank (n.d.) Retrieved from http://www.apruralbank.com/ 15. Official website of Assam Gramin Vikash Bank (n.d.) Retrieved from http://www.agvbank.co.in/ 16. Official Website of Bangiya Gramin Vikash Bank (n.d.) Retrieved from www.bgvb.co.in 17. Official website of Baroda Gujarat Gramin Bank (n.d.) Retrieved from http://www.bggb.in/ 18. Official Website of Baroda Rajasthan Kshetriya Gramin Bank (n.d.) Retrieved from www.brkgb.com/ 19. Official website of Baroda http://www.barodagraminbank.com/joomla/
up
gramin
bank
(n.d.)
Retrieved
from
20. Official website of Bihar Gramin Bank (n.d.) Retrieved from http://www.bihargraminbank.in/ 21. Official Website of Central MP Gramin Bank (n.d.) Retrieved from http://www.centralmpgraminbank.com/ 22. Official website of Chaitanya Godavari Grameena Bank (n.d.) Retrieved from http://www.cggb.in/ 23. Official website of Chhattisgarh Rajya Gramin Bank (n.d.) Retrieved from http://www.cgbank.in/ 24. Official website of Dena Gujarat Gramin Bank (n.d.) Retrieved from http://www.dggb.co.in/ 25. Official website of EllaquaiDehati Bank (n.d.) Retrieved from http://www.edb.org.in/ 26. Official website of Gramin Bank of Aryavart (n.d.) Retrieved from http://www.aryavart-rrb.com/ 27. Official website of Himachal Pradesh Gramin Bank (n.d.) Retrieved from http://himachalgraminbank.org/ 28. Official website of J&K Gramin Bank (n.d.) Retrieved from https://www.jkgb.in 29. Official website of Jharkhand Gramin Bank (n.d.) Retrieved from http://www.jharkhandgraminbank.com/ 30. Official Website of Jharkhand Gramin Bank (n.d.) Retrieved from www.jharkhandgraminbank.com/ 31. Official Website of Karnataka Vikas Grameena Bank (n.d.) Retrieved from www.kvgbank.com/ 51
International Journal of Advance and Innovative Research
ISSN 2394 - 7780
Volume 2, Issue 3 (I) : July - September , 2015
32. Official website of KashiGomtiSamyut Gramin Bank (n.d.) Retrieved from http://www.kgsgbank.co.in/ 33. Official Website of KaveryGramieena Bank (n.d.) Retrieved from www.kaverigrameenabank.com/ 34. Official website of Kerala Gramin Bank (n.d.) Retrieved from http://keralagbank.com/ 35. Official Website of Kerala Gramin Bank (n.d.) Retrieved from www.keralagbank.com 36. Official website of LangpiDehangi Rural Bank (n.d.) Retrieved from http://www.ldrb.org/ 37. Official website of Madhya Bihar Gramin Bank (n.d.) Retrieved from http://mbgbpatna.com/home/ 38. Official Website of Madhyanchal Gramin Bank (n.d.) Retrieved from http://www.mgbank.co.in/ 39. Official Website of Maharashtra Gramin Bank (n.d.) Retrieved from http://mahagramin.in/ 40. Official website of Malwa Gramin Bank (n.d.) Retrieved from http://www.malwagraminbank.com/ 41. Official Website of Meghalaya Rural Bank (n.d.) Retrieved from www.meghalayaruralbank.co.in 42. Official Website of Mizoram Gramin Bank (n.d.) Retrieved from www.mizoramruralbank.com 43. Official Website of Narmada Jhabua Gramin Bank (n.d.) Retrieved from http://www.njgb.in/ 44. Official Website of Odisha Gramya Bank (n.d.) Retrieved from www.odishabank.in 45. Official Website of PallavanGrama Bank (n.d.) Retrieved from http://www.pallavangramabank.in/ 46. Official Website of PandyanGrama Bank (n.d.) Retrieved from www.pandyangramabank.in/ 47. Official Website of Paschim www.paschimbangagraminbank.com
Banga
Gramin
bank
Bank
(n.d.)
Retrieved
from
48. Official Website of Pragathi Krishna Gramin Bank (n.d.) Retrieved from www.pragathikrishnabank.com 49. Official website of Prathama Bank (n.d.) Retrieved from http://www.prathamabank.org/ 50. Official Website of PuduvaiBharathiarGrama http://www.puduvaibharathiargramabank.in:81/
Bank
(n.d.)
Retrieved
from
51. Official website of Punjab Gramin Bank (n.d.) Retrieved from http://pgbho.com/ 52. Official website of Purvanchal Bank (n.d.) Retrieved from http://www.pgbgorakhpur.com/ 53. Official Website of Rajasthan Marudhara Gramin Bank (n.d.) Retrieved from www.mgbbank.com/ 54. Official website of Saptagiri http://www.saptagirigrameenabank.in:82/\
Grameena
Bank
(n.d.)
Retrieved
from
55. Official website of Sarva Haryana Gramin Bank (n.d.) Retrieved from http://shgb.co.in/ 56. Official website of Sarva UP Grameen Bank (n.d.) Retrieved from http://www.upgb.com/ 57. Official website of Saurashtra Gramin Bank (n.d.) Retrieved from http://sgbrrb.org/ 58. Official website of Sutlej Gramin Bank (n.d.) Retrieved from http://sgbbathinda.co.in/ 59. Official website of Telangana Grameena Bank (n.d.) Retrieved from http://www.tgbhyd.in/ 60. Official Website of Tripura Gramin Bank (n.d.) Retrieved from www.tripuragraminbank.org/ 61. Official Website of Utkal Gramin Bank (n.d.) Retrieved from http://ugb.co.in/ 62. Official Website of Uttar Banga Kshetriya Gramin Bank (n.d.) Retrieved from http://www.ubkgb.org/ 63. Official website of Uttar Bihar Gramin Bank (n.d.) Retrieved from http://ubgb.in/ 64. Official Website of Uttarakhand Gramin Bank (n.d.) Retrieved from www.uttarakhandgraminbank.com/ 65. Official website of Vananchal Gramin Bank (n.d.) Retrieved from http://www.vananchalgraminbank.com/ 66. Official Website of Vananchal Gramin Bank (n.d.) Retrieved from http://www.vananchalgraminbank.com/ 67. Official Website of Vidharbha Kshetriya Gramin Bank (n.d.) Retrieved from http://www.vkgb.co.in/
52
International Journal of Advance and Innovative Research Volume 2, Issue 3 (I) : July - September , 2015
ISSN 2394 - 7780
68. Rural bank cross-merger on cards (2012) Retrieved from http://articles.economictimes.indiatimes.com/2012-10-02/news/34218012_1_sponsor-banks-rrbs-pragathigramin-bank
53
International Journal of Advance and Innovative Research Volume 2, Issue 3 (I) : July - September , 2015
ISSN 2394 - 7780
INSURGENCY AND HUMAN RIGHTS IN NORTH-EAST INDIA Sujit Sutradhar Lecturer, Department of Political Science, Hojai College, Hojai, Assam ABSTRACT Insurgency has become a part of everyday life in the North-East India. Most of the insurgencies in this region are based on ethnicity. Insurgency has become a lucrative business for many. In the name of liberation struggle, many groups are earning easy money and have degenerated into groups of criminals without having any political ideology. Insurgency and counter insurgency measures-all have contributed to violation of human rights of common people. Army was given wide powers under Armed Forces Special Powers Act (AFSPA). Army operations have resulted in gross violations of human rights with torture, fake encounter, forced disappearance, unlawful detention and even rape by armed forces becoming common. Key words : AFSPA, Ethnicity, Forced Disappearance, Political Ideology, Unlawful Detention. OBJECTIVE OF THE PAPER The paper tries to highlight the problems of Insurgency and its impact on the Human rights Scenario in North East India. METHODOLOGY The paper is primarily based on Secondary Sources like Books, Journals and Articles etc. the methods used are historical, narrative and analytical. INTRODUCTION North east India has been a melting pot of different races since ancient times. It has been considered as the gateway of commerce and culture that linked India overland to east and Southeast Asia. North East India is connected with the rest of India by a narrow strip of land known as the Siliguri Corridor or chicken's Neck. Much of the region is notably ethnically and linguistically different from the rest of India. North-East India shares border with four countries, namely, Bhutan, Bangladesh, China and Myanmar and almost 99% of its boundary is international. The region has immense geo-political significance. Over the years the North-East India has withnessed growth of insurgency and violent conflicts of different magnitude. THE PROBLEM OF INSURGENCY IN NORTH-EAST INDIA India's North-East region is flames of insurgency. Insurgency in this region is as old as the end of colonial rule. According to the Concise Oxford Dictionary, insurgency means rising in active revolt, Obviously against an established Government. Insurgency is a circuit of reciprocal violence where the main players are the state establishment and the challengers of the same. It is a process of violence where one or more groups aim at overthrowing the existing system in accordance with some ideology. It is an act of resistance and transformation. Actually insurgent movements are an expression of the failure of the process of nation building. The nature of insurgency problem in North-East India vary from secessionism to demands for state or Sub-state within India, or a regional autonomy for ethnic groups within the states, or protection of ethnic interests within the states, or protection of ethnic and cultural identities. Mr. S.K. Sinha (Former Governor of Assam) remarked that so many insurgency outfits have mushroomed in the North-East since independence that almost all the letters of the roman alphabet have been used to name them. The Political history of North-East India since independence is characterised by the assertion of various ethnic groups. Based on their separate ethnic identity and out of the feeling of deprivations, these groups have resorted to assert their right to secede from India and to form separate sovereign states. Most of the insurgencies in this region are based on ethnicity. The Nagas were the first to take up arms against the Government soon after independence. The differences between Naga National Council (NNC) and Government of India over their future led to the longest insurgent movement in the Sub-continent. Though some efforts were made to solve the Naga problem in the form of creation of Nagaland in 1963, Shillong Accord (1975) etc. these failed to bore fruit. National Socialist council of Nagaland (NSCN) continued its subversive activities for years. The Mizos also revolved under the banner of Mizo National Front (MNF) in 1960's. The Mizo Accord of 1987 ended Mizo insurgency and at present Mizoram is one of the most peaceful states of North-East India. 54
International Journal of Advance and Innovative Research Volume 2, Issue 3 (I) : July - September , 2015
ISSN 2394 - 7780
In Tripura, indigenous Tripuri's became minority in their own state due to migration. It led to a violent insurgent movement by Tripura National Volunteers (TNV) in 1980's. The TNV movement ended with an Accord which provided creation of Tripura Tribal Autonomous District under sixth schedule of the constitution. But soon two other insurgent groups all Tripura Tiger Force (ATTF) and National Liberation Front of tripura (NLFT) emerged with the demand for secession from India. Manipur has the dubious distinction of being the most violent and troubled state of the region. Its merger with India is viewed as illegal by many and insurgency erupted in Manipur out of this feeling. Several insurgent groups like People's Liberation Army (PLA), United National Liberation Front (UNLF), PREPAK, KCP, KYKL, UPPK, KNF, KNO, UPF, USRA, ZDV, ZRO, KRA, PSG, KLA, KNA etc. are active there. The birth of the United Liberation Front of Assam (ULFA) in 1979 marked the beginning of insurgency in Assam which aims at establishing a sovereign independent Assam. In addition to the ULFA insurgency, the largest plain tribe in the state, the Bodos started a violent movement to protect their ethnic identity in act 1980's. In 1986. The National Democratic Front of Bodoland (NDFB) came into existence with an objective of an independent Bodo country. Apart from ULFA and Bodo insurgency, Assam has also affected by insurgent movements initiated by Karbis, Dimasas and Adivasis. HUMAN RIGHTS SCENARIO IN THE NORTH-EAST The problem of insurgency in Nort-East has resulted in gross human rights violation and human insecurity. National oppression, insurgency, military repression and gross human rights violation for half a century have characterised the society and polity of North-east India. Both insurgency and counter insurgency methods adopted by the state have affected human rights and human security of people in varying degrees. A recent study on 'Maping Human Security in conflict Zones : The case of North-East India' reveals that in the insurgency prone areas, 67.1% of the population is affected by insurgency in different ways. People have to suffer from killing, displacement lose of home and property, family separation, poverty, rape and sexual abuse and many others. Insurgency has affected the lives of the people in their day-to day activities. People are constantly living under fear, anxiety and suspicion. To deal with armed insurgencies in the North-east, the Government has deployed its armed Forces. But the presence and activities of the armed forces have in no way, improved the situation. It is found that the armed forces often treat the people in human manner. Arbitrary arrest, detention, torture, rape and even killing on mere suspicion by armed forces are very common. But unfortunately such human rights violations are justified on the grounds that some people and groups have taken up arms against the State and its armed forces. It has to be remembered that state terrorism is not and cannot be an answer to insurgency. Another disturbing aspect of human rights Scenario in the Northeast is the mushrooming of insurgent groups and increase in their activities. These groups also frequently kill those who oppose them, forcibly collect money, kidnap persons for ransom etc. In last few years many groups have resorted to bomb blast in public places, massacres as a means of ethnic cleansing and other brutal techniques to discard the state. All these are also glaring examples of violation of basis human rights of people. The operation of a number of oppressive lows like National Security Act (NSA), Armed Forces special Powers Act 1958, section 144 of the criminal procedure code have been curtailing the human rights of the people in North-East. AFSPA allows security personnel to arrest anybody on the basis of suspicion and on the other, denies people the space to air their grievances to be heard. Many women are being raped by the army in the name of search operation. CAUSES OF INSURGENCY There are several reasons like poverty, unemployment, lack of connectivity, inadequate health care and educational facilities, feelings of neglect and non-participation in governing their own affairs etc. which have contributed to the insurgency in the region. Inadequacies in Governance and administration, public perceptions of widespread corruption and lack of accountability have also contributed in equal measure to the creation of feelings of alienation in large sections of the local population. Policies of the Government often do not reflect the local ground realities and do not adequately address local sensitivities and even the implementation of the policies have not been satisfactory.A proper study of the North-East and its people showed find an important place in the school curriculum. The feelings of alicnation and anger in the region are not just against New Delhi. There are grievances even against 55
International Journal of Advance and Innovative Research Volume 2, Issue 3 (I) : July - September , 2015
ISSN 2394 - 7780
the local political leadership and administration which are corrupt, inefficient and insensitive to the needs of the people. SUGGESTIONS After a careful scrutiny of the problem of insurgency in North-East, certain suggestions can be made to deal with the problem. 1. One must expedite the opening-up of the economy of this region. It must be opened up towards the rest of India as well as towards the east of India. The North-East should have an important role in India's look East policy like South India. 2. No doubt central Government has taken some laudable initiatives in recent years and thousands of crores of rupees are annually sanctioned for the North-East now. But due to corruption and lack of transparency, most of such funds are being misused and these do not reach the intended beneficiaries. Administrative accountability and good Governance is a must if insurgency is to be uprooted. 3. For eliminating insurgency we have to check ad-hocism in dealing with matters and problems in the region. There has been lack of consistency in policy-making, whether it relates to counter-insurgency, economic development, redressing of the local grievances etc. such tendencies should be avoided. 4. For elimination of this malady, a holistic and consistent policy is essential. It would be possible only if it is based on national consensus and the leaders and intellectuals of the North-East can play an important role in the formulation and implementation of such a policy. 5. Accelerated economic development and the consequent prosperity is an important antidote to the feelings of alienation. Nagaland returned to relative peace after the conclusion of the Shillong Accord in 1975 though the differences with the National Socialist Council of Nagaland (I-M and Khaplang factions) still remain. Mizoram has remained relatively peaceful since the Government of India and the Mizo National Front reached an agreement in the 1980's. 6. The North-East with its rich bio-diversity and national resources has huge potential for tourism, hydropower generation, cultural tourism etc. If these opportunities are properly tapped with Government support, there is possibility of turning this region into a developed one. CONCLUSION The human rights situation in North-East is far for being satisfactory. To improve the situation, there is an urgent need to solve the whole issue of insurgency. The state has to address the root causes of insurgency and offer a political solution. The State must take people into confidence and should try to bridge the huge gap that currently exist between the state and the people. Violation of human rights should be dealt with according to the laws of the country and the spirit of the Human Rights declaration whether such violations are inflicted by the army or by insurgent groups. The protection of Human Rights Act. 1993 should be amended to bring the human rights violations by armed forces under National Human Rights Commissions purview. Serious engagement of both Government and the civil society can offer a lot in terms of creating positive atmosphere of mutual trust, understanding and respect for human rights. REFERENCES 1. Agarwal, H.O, (2006), Human Rights, Central Law publication, Allahabad 2. Dutta, A.R., (2009), Human Security in North-East India : Issues And Policies, Anwesha Publication, Guwahati. 3. Pakem, B, (1997), Insurgency in North-East India, Omson Publication, New Delhi 4. Sanjaoba, N, (2004), Human Rights : Current Issues, Omson Publication, New Delhi 5. Ghosh, Subir (2001) Frontier Travails North-East : The Politics of a Mess, Macmillan India, Delhi 6. Chaube, S.K, (1999), Hill Politics in North-East India Orient Longman, Patna 7. Rocky, Raile (2012), Issues, responses and consequences : An Analysis of Persistent Imbroglio in Manipur, Journal of North-East India Studies, Vol.2, No.2, Jul-Dec 2012, P.P-49-63 8. Phukan, G (2000), Political Dynamies of North-East India South Asia Publishers, Delhi 9. Koijam, Radha Binod, 2010, The Impact of Insurgency Activities in North-East India on Socio-economoc Development and its solution thereof, speech delivered on 29th January, 2010 in the 12th NERCPA Conference at shillong (Jan 28-30)
56
International Journal of Advance and Innovative Research Volume 2, Issue 3 (I) : July - September , 2015
ISSN 2394 - 7780
GLASS CEILING EFFECTS Dr. Payal Upadhyay HOD, MBA Department, Maharishi Arvind International institute of Technology, Kota, Rajasthan “As far as glass ceiling, I feel that all you can do is give it your absolute best with whatever gifts the universe has given you. And if you make it in some way that other people can recognize, that’s fine. But even if you don’t quote or unquote make it, you are fine if you have given it your whole heart and soul.” ABSTRACT Not all gender or racial inequalities need to be defined as glass ceilings. If the "glass ceiling" is intended merely as a more colorful phrase to describe what we already mean by gender or racial inequality, then we are proliferating concepts that may ease our communication with the public, but do little to advance our work as analysts of the causes of inequality. Therefore, our first goal is to provide a clear content to the glass ceiling concept, deriving our definition from its usage in recent literature. For us, a glass ceiling is a specific type of gender or racial inequality that can be distinguished from other types of inequality. In defining the glass ceiling more precisely, we are not suggesting that this type of inequality is more unjust or larger than other types of inequality; nor do we believe it is necessarily more deserving of policy interventions than other types of inequality. It is merely different, and because it is different, it requires distinction from other inequalities. THE GLASS CEILING………………………………..it is a reflection of gender roles and relation which give rise to and complete inequalities between women and men in all walks of life. The invisible artificial barriers that block women from senior executive’s jobs. Key words:-gender, racial, inequalities, glass ceiling, precisely, leadership, organization, artificial barriers. INTRODUCTION OF THE CONCEPT According to the Federal Glass Ceiling Commission (1995a:iii), the concept glass ceiling refers to "artificial barriers to the advancement of women and minorities." These barriers reflect "discrimination ... a deep line of demarcation between those who prosper and those left behind." The glass ceiling is the "unseen, yet unbreakable barrier that keeps minorities and women from rising to the upper rungs of the corporate ladder regardless of their qualifications or achievements"(Federal Glass Ceiling Commission 1995b:4; emphasis added). This official description suggests that the definition of a glass ceiling must recognize that it reflects a job inequality that is unexplained by a person's past "qualifications or achievements"; it reflects labor market discrimination, not just labor market inequality. The usual, but imperfect, method for detecting discrimination is to look for inequalities that are unexplained by prior characteristics of the employees. Inequalities that derive from past discrimination in education or training or from choices that people make to pursue nonmarket goals such as family, volunteer work or leisure are not generally considered as part of a glass ceiling. Therefore, our first criterion for a glass ceiling is that: A glass ceiling inequality represents a gender or racial difference that is not explained by other job-relevant characteristics of the employee. In practice, this means that glass ceilings are measured as the residual differences due to race or gender after controlling for education, experience, abilities, motivation, and other job-relevant characteristics. Several contentious issues have arisen around discrimination research that will also affect glass ceiling research. First, it is impossible to measure and control for all the job-relevant employee characteristics that affect outcomes; some part of the residual difference may reflect true differences in productivity or preferences, not discrimination. Second, it is possible to control for too many job characteristics since some characteristics of past jobs may explain how discrimination happens, so controlling for them masks rather than detects discrimination. For example, Naff and Thomas (1994) control for "support from a mentor" which could as easily be interpreted as one way in which discrimination occurs to create glass ceilings. Similarly, if earnings or authority is the outcome being studied, controlling for occupation would be inappropriate because occupation changes are a primary way in which careers advance. Do teachers become principals; do principals become school superintendents? Do clerical workers become office managers? Do factory line workers become first-line supervisors; do first-line supervisors become plant managers? Controlling for these occupational changes could potentially eliminate a significant portion of the glass ceiling effect. Finally, there can be reasonable disagreements about what constitutes "job-relevant" characteristics that need to be controlled to establish discrimination. For example, while most would consider family characteristics (e.g., marital status, presence and age of children) illegitimate criteria for promotion and success that should not be controlled in glass ceiling 57
International Journal of Advance and Innovative Research Volume 2, Issue 3 (I) : July - September , 2015
ISSN 2394 - 7780
studies, others could argue that these are proxies for a family versus career orientation that affects productivity and are therefore job-relevant characteristics that need to be controlled. This is not an easily resolved empirical issue. We note the problem here, and construct our own empirical analysis around what we see as the predominant position: marriage and family are not factors that should be controlled in studies of discrimination. We will return to this issue in the discussion when we speculate on reasons for a glass ceiling effect. CONCEPTUAL FRAMEWORK OF GLASS CEILING EFFECT We may quote several women, national and international, in support of the argument that women can excel, a la men. But does it mean women, as a community, are happy? No; right from USA to Africa to China to India, women are still ill treated! THERE IS much talk about liberation of women, reservation for women and prominence to women. We now talk of many women - Indira Gandhi, Chanda Kochhar, Kiran Mazumdar Shaw,Vinita bali,ekta kapoor,neelam dhawan, Indra Krishnamurthy Nooyi. Benazir Bhutto, Kalpana Chawla, Hillary Clinton,Pratibha Patil and others. There are women astronauts, pilots, office bosses, teachers and whatnot. But this does not mean all women are happy. It is time to deliberate on some issues related to the freedom enjoyed by women and the atrocities committed against women at home in particular and in the worldin general. This presents a dismal picture of the women. When we talk about the glass ceiling every man feels that there is not discrimination. No glass ceiling in the corporate world. Many incidents where women perform better than their colleagues All about passion, fascination and determination for the work Many have done it and many are still doing it. But in many these thing are missing and they call it Glass Ceiling:-the term glass ceiling is most often applied in the business situation in which women feels that men are very much involved in the usage of power and women find it difficult to or rather impossible to reach to that level or break the glass ceiling. The term was originally used by Carol Hymowitz and Timothy Schellhardt in a March 24,1986 Wall Street Journal article. when Wall Street Journal reporters coined the phrase to describe the invisible barrier that blocks women from advancing to senior leadership positions in organizations. Glass ceiling is an unacknowledged discriminatory barrier that prevents minority from rising to positions of power or responsibility within an organization The invisible artificial barriers that block women from senior executive jobs It is a reflection of gender roles and relations which give rise to and complete inequalities between women and men in all walks of life ‘Sticky floor’- keeping women stuck at the bottom of the economic pyramid An unofficial barrier to opportunities within an organization or company which is perceived to prevent protected classes of workers, particularly women, from advancing to higher positions. • In this context “Ceiling” is that there is limit to how far someone can climb the hierarchy. •
Whereas “glass” emphasizes on that while everything is very clear, very real, one can see each and every thing very clearly, that is it is transparent and not obvious to the observer.
58
International Journal of Advance and Innovative Research Volume 2, Issue 3 (I) : July - September , 2015
ISSN 2394 - 7780
This invisible barrier continues to exist, even though there are no explicit obstacles keeping minorities from acquiring advanced job positions – there are no advertisements that specifically say “no minorities hired at this establishment”, nor are there any formal orders that say “minorities are not qualified” (largely due to the fact that employment opportunity laws forbid this kind of discrimination, and open admittance of it is career suicide) – but they do lie beneath the surface.
•
The “glass ceiling” is distinguished from formal barriers to advancement, such as education or experience requirements. Mainly this invisible barrier seems to exist in more of the developing countries, in whose businesses this effect is highly “visible”.
Does glass ceiling really exists:????????????????????? In ladies perception glass ceiling still exists.
And if we ask boys about glass ceiling the answer is NO SUCH PHENOMINON EXISTS.
And one thing I would like to share that when I ask the same question everybody present here would be surprised to know that they denied of the existence of glass ceiling.
But I feel that it took little extra effort, some compromises and a little bit of support from the family to reach the top.
But still the debate is on between the feminists and analysts……………………… The glass ceiling exists in India as it does the world over. Women managers, despite being highly educated often remain in lower positions with little access to challenging assignments and power. Women are often promoted to senior positions but the job content and compensation remain lower than those offered to males in similar positions. Women often remain unaware or rather do not make it an issue.
However, this glass ceiling tends to affect working women the most. It’s the barrier that prevents large numbers of women from obtaining and securing that most powerful, prestigious, and highest – grossing jobs in the workforce. This barrier makes many women feel they are not worthy enough to have these high – ranking positions, but also they feel as if their bosses do not take them seriously or actually see them as potential candidates.
The glass ceiling is a barrier not only to individuals but to society as a whole. This barrier reduces the potential pool of corporate leaders by ignoring, or worse, discriminating against over one – half of the ceiling.
REASONS WHY FEMINISTS FEEL THAT GLASS CEILING EXISTS Male dominated management, which made all the decisions for the company.
Lack of proper anti discrimination law and government action on discrimination
Men’s attitude towards problems faced by women
Preference of men over women of same educational qualification and caliber.
Sexual harassment was seen as another major obstacle in the women’s career.
After this debate women still feel the existence of glass ceiling. And analysts on the other hand argued upon the nonexistence of glass ceiling. They feel there are some major reasons because of that woman could not reach the higher position in the organization. The reasons quoted were Women left their jobs midway due to personal problems (like marriage and raising family) In order to get into top management it requires commitment, dedication and determination which was lacking. Less paid because they worked for lesser time and joined low risk jobs. Debate still goes on……………………………… GLASS CEILING EFFECTS – WORKING WOMEN Glass ceiling tends to affect working women the most. An unofficial barrier to workplace advancement, usually in regard to women or an invisible upper limit in corporations and other organizations, above which it is difficult or impossible for women to raise in the ranks.
59
International Journal of Advance and Innovative Research Volume 2, Issue 3 (I) : July - September , 2015
ISSN 2394 - 7780
This phenomenon exists even in the 21st century when globalization and technological advances have brought about 360 degree changes in all walks of life. Through women are being included in the workforce to add diversity in the work culture, the evil is still prevalent manifold. The lion’s share of leadership positions throughout the world remain a male preserve as an invisible barrier Prevents women from reaching the highest corporate levels. “There is a glass ceiling in the middle of the ladder leading to the top, and it can’t be seen, but when women run into the bump their heads and can’t move beyond it.
ASIAN perspective Women are better seen as a homemaker
So the corporate organization in these countries did not seem to favor women
It was a matter of a policy for not hiring women.
Some Asian examples • Videocon international –“we are from an orthodox family” •
Tata motors “no women rule”
•
Many other companies hire ladies for their work and not for the corporate work
On the other hand company hire only ladies because of their inter-personal skills In a male-dominated world of business, some women have broken all barriers to get to the top.
INDIA'S MOST POWERFUL BUSINESSWOMEN 1.Chanda Kochhar is the Managing Director and Chief Executive Officer of ICICI Bank Limited. She began her career with ICICI as a Management Trainee in 1984 and has thereon successfully risen through the ranks by handling multidimensional assignments and heading all the major functions in the Bank at various points in time. 2. Vinita Bali, Managing Director, Britannia Industries, has always made unconventional decisions. Rising prices of wheat, sugar and dairy products affect her as much as they do every housewife. 3.Kalpana Morparia, former Joint Managing Director of ICICI Bank, and currently CEO of JPMorgan gives complete credit for her transformation from a corporate lawyer to a corporate leader to K.V. Kamath. 4. Kiran Mazumdar Shaw, Chairman and Managing Director of Biocon, is India’s bio-tech queen. She says in an interview to Forbes India that she learnt the importance of self-reliance and personal re-invention at an early age. From starting off with Rs 10,000 in a garage her company Biocon is today worth Rs. 1,511 crore. 5. Mallika Srinivasan, the Chairman and CEO of TAFE, believes in a no-frills working style. She has risen to become India's tractor woman making an indelible impression in a heavily male-dominated industry. TAFE's turnover, a mere Rs86 crore in 1985 - the year she joined - had risen to Rs5, 800 crore by 2010/11 6. Ekta Kapoor has created a niche for herself as the queen of the silver screen soaps. As the Joint Managing Director and Creative Director of Balaji Telefilms, her production company, she rules almost every television network.
60
International Journal of Advance and Innovative Research
ISSN 2394 - 7780
Volume 2, Issue 3 (I) : July - September , 2015
7. Neelam Dhawan is the Managing Director of Hewlett-Packard India. She has been an icon for women in the IT industry. There were just handful women in the industry way back in the early 80s when she began her career accidentally at HCL. 8. Preetha Reddy the managing director of India's largest healthcare company, Apollo hospitals. Ms Reddy has been instrumental in the group's quality certification process (ISO 14001 and 9001). As a trailblazer, she ensured the JCI accreditation process in five of the group hospitals in Delhi, Chennai, Hyderabad, Ludhiana and Dhaka. 9. A nominated member of the Rajya Sabha, Shobhana Bhartia also runs one of India's largest media houses. She is Chairperson and Editorial Director of HT Media which had revenues of Rs 1,815 crore in 2010/11.
Women Managers/Employment
Korea
Egypt
Switz.
Mexico
CzechR.
Aust.
Swed.
Canada
Rus. Fed.
Managers Employed 3-D Column 3 3-D Column 4 3-D Column 5 Ukraine
50 45 40 35 30 25 20 15 10 5 0
SOME STATISTICS RELATED TO WOMEN Women hold 1 to 3 per cent of top executive jobs in the largest corporations worldwide.
Only 12 countries have a women head of state
Only 14 % of the world’s Parliamentarians are women
Only 1 per cent of trade union leaders are women
Top jobs
1-5 percent of executive jobs occupied by women.
Senior management
10-20 percent.
Managerial jobs
6-30 percent.
Administrative and managerial 10-43 percent.
Professional and technical
20-60 percent.
CONCLUSION
Many people believe that women are making less for performing the same jobs as men The “glass ceiling” is a controversial subject that’s constantly in hot pursuit. There are many statistics and theories that come into play; in fact, that people may find it difficult to reach a solid conclusion. Does the glass ceiling really exist, or is it all a matter of how the facts are skewed either for or against it?
Glass Ceiling underwent several variations as the problem grew and became more and more pronounced. It was soon seen that discrimination was not only towards stopping the women from reaching greater heights, but also creating circumstances wherein she by herself felt week unsuitable. Hence both vertical and horizontal aspects of glass ceiling became important.
REFERENCES Baxter, Janeen,a nd ErikO lin Wright.2 000. "TheG lassC eilingH ypothesis:A ComaprativeS tudy of the United States, Sweden, and Australia."G endera nd Society 14:275-94.
Bernhardt, Annette, Martina Morris, and Mark S. Handcock. 1995. "Women's Gains or Men's Losses?A Closer Look at the Shrinking Gender Gap in Earnings."American Journal of Sociology. 61
International Journal of Advance and Innovative Research Volume 2, Issue 3 (I) : July - September , 2015
ISSN 2394 - 7780
Brown, JamesN ., and Audrey Light. 1992. "InterpretingP anel Data on Job Tenure."Journal of Labor Economics. Bryk, Anthony S., and Stephen W. Raudenbush. 1992. Hierarchical Models: Applications and Data Analysis Methods. Sage. Catalyst, Inc. 1999. Women of Color in Corporate Management: Opportunities and Barriers. Catalyst. Cheng, Cliff. 1997. "Are Asian American Employees a Model Minority or Just a Minority?" Journal of Applied Behavioral Science. Corcoran, Mary, and Greg J. Duncan. 1979. "Work History, Labor Force Attachment, and Earnings Differences between Races and Sexes."Journal of Human Resources. Cotter, David A., JoAnn M. DeFiore, Joan M. Hermsen, Brenda Marsteller Kowalewski, and Reeve Vanneman. 1997. "Same Data, Different Conclusions. Comment on Bernhardt et al." American Journal of Sociology.
Cotter, David A., Joan M. Hermsen, and Reeve Vanneman. 1999. "Systems of Gender, Race, and Class Inequality :Multi level Analyses."Social Forces.
Davies-Netzley, Sally.1 998." Womena bove the GlassC eiling :Perceptions on Corporate Mobility and Strategies for Success." Gender and Society.
Duleep, Harriet Orcutt, and Seth Sanders. 1992. "Discrimination at the Top: American-Born Asian and White Men." Industrial Relations.
England, Paula. 1992. Comparable Worth: Theories and Evidence. Aldine de Gruyter.
62
International Journal of Advance and Innovative Research Volume 2, Issue 3 (I) : July - September , 2015
ISSN 2394 - 7780
TOP SOCIAL MEDIA UPDATES 2015: A REVIEW OF POPULAR GLOBAL SOCIAL PLATFORMS Ekta Bansal and Mamta Assistant Professor, Janki Devi Memorial College, University of Delhi, Delhi ABSTRACT Social media assumed its importance especially in last 10 years and changed its forms and ways to connect with the ultimate audiences. Era of technological revolution is going on and with each passing new technological revolution social media platforms are changing with the preferences of users. The role of each social media platform is unique on their own designed accessibility and approach towards their end audiences. In this article the usage popularity of these various media platforms are analyzed and reasons for their wide acceptance among audiences is also viewed. The social media platforms which are popular among audiences are Facebook, Twitter, LinkedIn, Instagram, Pinterest, Google+, YouTube and Snapchat. So, if marketers and businesses really need their existence and popularity to maintain equitably throughout they must update themselves about the latest popular media platforms. Keywords: - Facebook, Twitter, LinkedIn, Instagram, Pinterest, Google+, YouTube, Snapchat and Year2015. INTRODUCTION The latest fact about the market is that it is summed up in to one channel that is “mobile”. The penetration of Smartphone and other latest handy devices have become affordable and the wireless connections are ubiquitous and faster. Here are some interesting statistical facts like: 7.2 billion People on planet and following numbers behind them are quite surprising.
Out of that 3 billion people are active internet users.
2.1 billion People approximately are having social media accounts.
3.65 billions are using internet through their ipads and Smartphone.
1.7 billion People are having active social media accounts.
Now after seeing this it is worth interesting to know about some statistical facts about the various social media platforms for the year 2015. FACEBOOK Facebook is a pioneer in social media platforms and it is 11 years old now heading towards puberty but still the leader in this social media market. Facebook has reached 1.44 billion active users monthly and 47% of all internet users are on Facebook. As per to statistics 936 million people log onto Facebook daily (DAU) for March 2015, which represents a 17% increase year over year. From this it is clearly predictable that number of active users are continuously increasing on Facebook and providing promising audience for marketing efforts. 29.7% users are from age of 25 to 34 years, and the next 25% of age group of users are aging from 16 to 24 years and these are the main demographic profiles of Facebook users clearly indicating the prime target audiences for the marketers. Nearly 75% of the revenue comes from mobile advertising and 4.75 billion of content shared daily on Facebook. Furthermore statistics say that everyday 798 million of Facebook users are using their accounts from their mobile phones. Amazingly, approximate 82.8% of the daily active users are from outside the USA and Canada. India is on the second place regarding the number of users, with approximate 109 million persons registered, and followed by Brazil (70.5 million users) and Indonesia (60.3 million users). TWITTER Twitter is totally different form of social networking, it is called real time social networking site. A place where information is being shared when it actually happens for connecting with other in real time which often results into long-lasting contacts and friendship. Twitter has 302 million monthly active users and yes this is a small number when compare it to Facebook. Out of all the accounts, 77% are outside the USA. Language barrier is not a problem – the website supports more than 35 languages. Twitter is most used in Asia and Pacific area (35%), North America (22%) and Western Europe (15.9%). 88% of Twitter users tweet through mobile and 500 million tweets per day are send. 58 % of the top brands in the world have over 100,000 Twitter followers and 92% of international brands tweet more than once daily, 36% of which are link-containing tweets. About 34% of marketers are able to successfully generate leads through Tweeter and Tweets containing image links have 5x higher engagement rate. 63
International Journal of Advance and Innovative Research Volume 2, Issue 3 (I) : July - September , 2015
ISSN 2394 - 7780
Even business-to-business (B2B) marketers are on Twitter, 2nd most used social network (85 percent) by B2B marketers. LINKEDIN LinkedIn is world’s largest professional social networking platform and it’s fighting the tough demographic and numerous challenges along the way. LinkedIn always incorporated the latest challenges to give fresh and new look to their website recently they introduced new look to feel fresh with the home page and profile page for their users. LinkedIn is a business, and its runners are always seeking ways to maximize the profit bottom line for their business. Users and end audiences presence and engagement translate into value for LinkedIn. LinkedIn is always in the fast lane, moving from an online website and virtual networking tool to a comprehensive career management and personal branding platform. Right at the top of the profile page, LinkedIn posts status so users can see how they are doing. It’s a great way to measure the brand impact. LinkedIn has made it easier to stay connected to with the various network members. As per to the statistics over 332 million members are registered under LinkedIn and most of them are from U.S.A. Over 39 million of college graduates and professional are registered on the website. 44% of females are there on website and average monthly time spends on the site by users is approximately 17 minutes. Through the website 1 billion endorsements has been done and 13% minimals (15-34years) are using LinkedIn website regularly.
INSTAGRAM Instagram is very new in the field of social media networking but due to the popularity the media has gained made it to influence marketers and users to great extent. Instagram established in the year 2010 and grown over the years and reached 300 million monthly active users. It has become one of the most engaging visual platforms and product promotion is key on this platform. Instagram emerges as an important tool for galleries to sell their artwork and it is one the best tool present in the market along with Facebook as per 2015 Online Art Trade Report by Hiscox, the London-based fine-art insurers. According to this survey, 69% of 519 respondents said they use Instagram for art-related purposes. Out this 75 million are those who use Instagram every day and 30% of teenagers consider that Instagram is the most important social network. 20% of US adult females use Instagram in comparison to 15% of US adult men. Internet users aged between 16 and 64 years have an Instagram account which is 20% of the total users on the Instagram and 41% of audience are aged between 16 and 24years. One shocking fact is that 51% of Instagram's users are male and 49% is female. Ireland is lagging behind when it comes to Instagram only 18% of internet users have an account. Norway is one of the fastest growing countries, with 26% of internet users are having Instagram account and 22% of internet users in the Middle East and North Africa use Instagram. The greatest traffic on the website is registered in USA (28.5%), Brazil (6.5%) and Russia (5.7%). Over 20 billion photos shared on the website and Instagramers shares 70 million (plus) photos and videos each day. 64
International Journal of Advance and Innovative Research Volume 2, Issue 3 (I) : July - September , 2015
ISSN 2394 - 7780
PINTEREST Pinterest is totally different form of social media tool it helps people to discover and share amazing interesting pictures. This is place for all and in fact businesses can also find their potential consumers by promoting their brands through dynamic product images and inspirational quotes and content. Pinterest provides various marketing platforms tools to create images, inspirational visual content for campaign managers to run their product campaign in the most innovative way. Pinterest offers promoted pins in beta to its certain businesses on a cost per click basis. It has also introduced some rich pins that include extra information on the pin itself. The categories for which rich pins are provided are recipe, article, movie, product, and place. One important element of Pinterest is Pinterest analytics that helps to understand how users are getting engaged with your content and pins. On Pinterest under the third party tools Piqora is provided by which businesses can get access to visual marketing platform for pin scheduling, analytics and promotion tools. Now looking to the statistics 2015 for Pinterest has about 70 million users. And out this number 56% are females and rest 44% are males. The average time spent on Pinterest is 98 minutes per month. Pinterest website is mostly accessed in North America (33% of internet users), Middle East and Africa (25% of internet users) and Latin America (18% of internet users). Over 30 billion pins are received on this website and the largest audiences of the site have been registered in USA (32%), China (14%) and India (13%).
65
International Journal of Advance and Innovative Research Volume 2, Issue 3 (I) : July - September , 2015
ISSN 2394 - 7780
GOOGLE+ We have talked about the statistics of and demographic information for Facebook, Twitter, Pinterest and Instagram, but Google+ is a newer network and very unique on its own due to its features and usage. The end audience under Google+ is entirely different from Facebook and other social networks and it is paving the way for the companies who are looking to reach a new and tech-savvy audience. It was launched in the year 2011 with an objective of providing users with a hub for social networking, sharing pictures, video messaging and more. Google+ is unique from other networks reason being it provides circles users which can easily be use to group contacts by relationship, for easy sharing and more control over privacy. Google+ provides a great platform for companies because their audience can easily categorize through updates and separate personal interactions from their business. On Google+ there are about 2.2 billion Google Plus profiles online, but not all of them represent active users. 90% of the people who create a Google profile have never posted publicly on Google+. The Smartphone penetration for Google+ among 18-34 years in U.S is 18%.This website is mostly used in Indonesia (83% of the online population), India (82% of the online population) and Vietnam (80% of internet users). YOUTUBE For every marketer understanding of good social media platform is essential so that they can increase the effectiveness of their business and product. Now when we are talking about the effective social media platform we cannot forget YouTube which is widely acceptable by mass of audiences. Businesses can focus on this channel to boost up their sales and revenue by making effective and creative videos for their end audiences. The year 2015 is the year of video and YouTube is the king for providing the videos to their audiences. It’s not just a video platform. It’s the second biggest search engine. Marketers can augment the content with a video version and enhance their presentations, to show end customers how to use the products, and the special factors can also be added. Talking on the basis of statistics for YouTube then it has 1 billion active users, 4 billion approximate revenue, 4 billion videos are watched on YouTube per day.100 hours of video uploaded every minute and 40% of mobile are being used to watch video content on YouTube specifically. 85% of adults are regular visitors of YouTube excluding China. 9% of all 18-34 year-old visitors to YouTube share or comment on videos each month. YouTube influences purchase intent and decisions among more than half of consumers and 54% of consumers in the U.S are under this influence in comparison with other traditional social media tools.
66
International Journal of Advance and Innovative Research Volume 2, Issue 3 (I) : July - September , 2015
ISSN 2394 - 7780
SNAPCHAT For successful online market strategy every marketer must keep pace with rapidly changing technology which the demand of today else they can lose their potential customers. In social media tools Snapchat has emerged as one of the leading photos sharing and messaging application in today’s market place. It allows users to share videos and photographs with their friends which are referred as “snaps”. Snapchat as a growing social media network currently has 500 million videos and photos being shared on the channel each day. The proof of the platform’s potential value can be viewed when Facebook offered $3 billion for the platform in November 2013. As a business tool business persons can find out their potential customers on this platform where they all are exchanging and participating maximum time. If businesses are making their social media strategy then under that Snapchat will be a very powerful tool, where they can share their products pictures and videos to the ultimate consumers. By using the feature called geofilters, businesses can add a customized sticker to photographs that can only be seen by people within a specific geographic area. Snapchat was launched in 2011 and now it has 100 million daily active users. Out of all social media percentage 18% of people in US use Snapchat as social media tool. 400 million snaps per day are registered and 70% of Snapchat users are females. In US 30% millennial use this platform, 71% users are below 25 years. 25% in UK and 22% in Ireland users are using this social media. In the last year the estimated growth of Snapchat recorded 57% with value of 15 billion dollars. CONCLUSION Social media education and regular updates on it is now more important than ever required, if businesses really want to generate the revenue for their business. These social media updates and education can bring smart moves and avenues for social media managers. Organizations can work on broader strategies and tactics revolving around these social media and can gain market leadership for their brands. The demand for these social media and their effectiveness is need for all those businesses who want to dig bigger in the year 2015.A challenge for every business professional has been generated that how to intelligently integrate the fast moving developments in the area of internet and technology. The major players in the market have realized the importance of these social media platforms for their successful goals and targets accomplishments. Hence, we can say if right social media is hit then right customers and right brand image for the business will be gained in the market else you will be dumped out of the market. REFERENCES
www.socialmediaexaminer.com/social-media-marketing-industry-report-2015
www.stateofdigital.com/biggest-social-media-updates-2015
www.forbes.com/sites/jaysondemers/2014/11/19/the-top-7-social-media-marketing-trends-thatwill-dominate-2015
www.toprankblog.com/2014/05/digital-marketing-2015
www.adweek.com/socialtimes/social-marketing-trends-2015
www.brandwatch.com/2015/01/top-9-social-media-trends-2015
www.stateofdigital.com/biggest-social-media-updates-2015
Zephoria.com/top-15-valuable-facebook-statistics
www.digitalinformationworld.com/2015/02/fascinating-social-networking-stats-2015
www.pewinternet.org/2015/01/09/demographics-of-key-social-networking-platforms-2
www.pewinternet.org/2015/01/09/social-media-update-2014
Lorirtaylor.com/twitter-statistics-2015
expandedramblings.com/index.php/march-2013-by-the-numbers-a-few-amazing-twitter-stats
www.digitalinformationworld.com/2015/01/twitter-marketing-stats-and-facts-you-should-know
www.statista.com
www.linkedin.com/pulse/2015-instagram-statistics 67
International Journal of Advance and Innovative Research Volume 2, Issue 3 (I) : July - September , 2015
ISSN 2394 - 7780
expandedramblings.com/index.php/by-the-numbers-a-few-important-linkedin-stats
www.socialmediatoday.com
expandedramblings.com/index.php/Pinterest-stats
www.cision.com/us/2015/01/25-pinterest-facts-and-pr-best-practices
sproutsocial.com/insights/Pinterest-statistics
www.jeffbullas.com/2015/04/08/33-social-media-facts-and-statistics-you-should-know-in-2015
expandedramblings.com/index.php/YouTube-statistics
Oursocialtimes.com/8-useful-social-media-statistics-for-2015
wearesocial.net/blog/2015/01/digital-social-mobile-worldwide-2015
68
International Journal of Advance and Innovative Research Volume 2, Issue 3 (I) : July - September , 2015
ISSN 2394 - 7780
PREDICTING THE FINANCIAL EFFICIENCY OF PUBLIC SECTOR TELECOM COMPANIES BSNL AND MTNL USING Z-SCORE Sonia Gambhir and Puneet Garg Faculty, IBS Business School, ICFAI University, Dehradun ABSTRACT Business enterprises work on going concern concept. It is important to predict the financial soundness of a business. That can be done through ratio analysis. Financial ratios are a key pointer of financial reliability of a business. Financial ratios are a tool to determine the operational & financial effectiveness of company. A single ratio cannot effectively assess the overall strength or weakness in a company. Altman developed a z-score model using ratios as its foundation. With the help of the Z- Score model, Altman could predict financial efficiency Bankruptcy up to 2-3 years in advance. The following research paper studies the financial health of BSNL and MTNL by using Altman Z score to predict, analyze the financial health of the sample companies. The paper finally offers suggestions for improving the solvency position of the companies. Key words: Altman’s Z score, financial performance, financial health. INTRODUCTION Business enterprises work on going concern concept. Financial soundness of the business is very important. Long term solvency is measured by the equity debt mix and earning power of the company. Many models have been formulated to predict the financial health of the company and to assess about the financial distress. One of the models to know the financial health of the company is developed by Edward Altman. He was the one who framed the model and tested its accuracy. Since than many research has been carried to improve it. Applying a model to analyze the nancial condition of a company may help the management to predict its future and take corrective actions. After the establishment of Altman's Z score model, abundant studies have done further research on the Z score model, including Deakin(1972), Taf er (1983), Goudie (1987), Agarwal and Taf er (2007), Sandin and Porporato (2007). Of these researches Edward Altman's Z score is popular even after 40 years of its formulations. Z score is a multidiscriminate analysis. While doing the review of literature, it was found that very limited studies are conducted using Z score in a developing country like India. Frequent analysis of nancial statements and the company's position will give the real picture of its nancial status. Applying a model to analyze the nancial condition of a company may help the management to predict its future and take corrective actions. It may reduce the chances of bankruptcy. A predictive model may warn an auditor of company's vulnerability and help to protect them against charges of negligence of duties in not disclosing the possibility of corporate failure (Jones, 1987). The creditor, the shareholders, and regulatory agencies will be curious to nd the nancial status of a company. Therefore this study focuses on measuring the nancial health of public sector owned telecom Company which is listed in National Stock Exchange REVIEW OF LITERATURE Chang(2008) studied the corporate governance characteristics of financially distressed rms in Taiwan.(Moyer, 2005) Altman’s Z is one of the best known, statistically derived predictive models used to forecast a firm’s impending bankruptcy. Mansur A. Mulla (2002) made a study in textile mill with the help of Z score model for evaluating the financial health with have weighted financial ratios. Altman’s Z-Score formula is a multivariate formula used to measure the financial health of a company and to diagnose the probability that a company will go bankrupt within a two-year period. Studies of Altman’s Z have yielded mixed results, and recent literature questions whether or not the formula, tested in the mid-twentieth century on manufacturing firms, is useful in today’s marketplace. (Moriarty, 1979)The Z-Score uses various accounting ratios and market-derived price data to predict financial distress and future bankruptcy. The original formula was developed on a sample of 66 manufacturing firms. Firms with assets of less than $1 million were eliminated from the sample. (Moriarty, 1979) The Altman’s Z formula works well provided the scores fall within the “in the tails,” meaning that low and high scores may more accurately predict financial distress than scores that fall in the gray area. Almilia (2006) studied three financial ratios: profit margin, financial leverage and liquidity ratio (current assets to current liabilities) which affected corporate financial distress in Jakarta Stock Exchange during 1998 – 2001, when many companies faced financial difficulties following Asian Financial Crisis in 1997- 1998.Sukana(2006) studied financial ratios of manufacturing companies in Indonesia Stock Exchange (IDX) to predict bankruptcy. 69
International Journal of Advance and Innovative Research Volume 2, Issue 3 (I) : July - September , 2015
ISSN 2394 - 7780
There are also a number of research studies, using data from companies in India that provide various methods to identify failing firms. But the research in telecom sector has not been conducted so far. OBJECTIVES OF THE STUDY 1. To study the overall financial performance of the telecom industry. 2. To predict the financial performance of public sector telecom companies in India. 3. To know the efficiency of financial operations using Z Score. CURRENT SCENARIO OF TELECOM INDUSTRY The telecom industry has been divided into two major segments, that is, fixed and wireless cellular services. In today’s information age, the telecommunication industry has a vital role to play. Considered as the backbone of industrial and economic development, the industry has been aiding delivery of voice and data services at rapidly increasing speeds, and thus, has been revolutionizing human communication. Although the Indian telecom industry is one of the fastest-growing industries in the world, the current teledensity or telecom penetration is extremely low when compared with global standards. India’s teledensity of 36.98% in FY09 is amongst the lowest in the world. Further, the urban teledensity is over 80%, while rural teledensity is less than 20%, and this gap is increasing. As majority of the population resides in rural areas, it is important that the government takes steps to improve rural teledensity. No doubt the government has taken certain policy initiatives, which include the creation of the Universal Service Obligation Fund, for improving rural telephony. These measures are expected to improve the rural teledensity and bridge the rural-urban gap in teledensity. Indian telecom sector is more than 165 years old. Telecommunications was first introduced in India in 1851 when the first operational land lines were laid by the government near Kolkata (then Calcutta), although telephone services were formally introduced in India much later in 1881. Further, in 1883, telephone services were merged with the postal system. In 1947, after India attained independence, all foreign telecommunication companies were nationalized to form the Posts, Telephone and Telegraph (PTT), a body that was governed by the Ministry of Communication. The Indian telecom sector was entirely under government ownership until 1984, when the private sector was allowed in telecommunication equipment manufacturing only. The government concretized its earlier efforts towards developing R&D in the sector by setting up an autonomous body – Centre for Development of Telematics (C-DOT) in 1984 to develop state-of-the-art telecommunication technology to meet the growing needs of the Indian telecommunication network. The actual evolution of the industry started after the Government separated the Department of Post and Telegraph in 1985 by setting up the Department of Posts and the Department of Telecommunications (DoT). The entire evolution of the telecom industry can be classified into three distinct phases. Phase I- Pre-Libralisation Era (1980-89)
Phase II- Post Libralisation Era (1990-99)
Phase III- Post 2000
Until the late 90s the Government of India held a monopoly on all types of communications – as a result of the Telegraph Act of 1885. As mentioned earlier in the chapter, until the industry was liberalised in the early nineties, it was a heavily government-controlled and small-sized market, Government policies have played a key role in shaping the structure and size of the Telecom industry in India. As a result, the Indian telecom market is one of the most liberalised markets in the world with private participation in almost all of its segments. The New Telecom Policy (NTP-99) provided the much needed impetus to the growth of this industry and set the trend for libralisation in the industry. Globalisation has made telecommunication an integral part of the infrastructure of the Indian economy. The telecom sector in India has developed as a result of progressive regulatory regime. The Total Revenue of Telecom Service Sector went up from Rs. 1,95,442 crore in 2011-12 to Rs. 2,12,592 crore in 2012-13 indicating a growth of 8.77%. The corresponding figure of revenue after adjustment of intra operator interconnection charges, comes to Rs. 1,85,930 crore in 2011-12 and Rs. 2,02,074 crore in 2012-13, showing a growth of 8.68% over the previous year. MARKET PLAYERS As on 31st October, 2014 the private access service providers held 90.55% market share of wireless subscribers where as BSNL and MTNL, the two PSU access service providers, held only9.45% market share.
70
International Journal of Advance and Innovative Research Volume 2, Issue 3 (I) : July - September , 2015
ISSN 2394 - 7780
RESEARCH DESIGN Data collection Secondary data is used for the study. Published nancial statements are used for analysis. The period for which the study is done is 5 years, starting from 2009 to 2014. The data required for calculating Z score is obtained from NSE and money control website. The company information is collected from their official website and NSE. Sampling Design This research focuses on a analysis of
nancial performance of public sector telecom companies.
Method of Analysis Quantitative analysis is done using Multi discriminate data analysis. Altman's Z score is used to analyze the nancial statements of the companies. AN OVERVIEW OF THE COMPANIES SELECTED FOR STUDY This research focuses on analysis of financial performance of two major telecom companies namely: BSNL and MTNL. Bharat Sanchar Nigam Limited (abbreviated BSNL) is an Indian state-owned telecommunications company headquartered in New Delhi, India. It was incorporated on 15 September 2000 and took over the business of providing of telecom services and network management from the erstwhile Central Government Departments of Telecom Services (DTS) and Telecom Operations (DTO), with effect from 1 October 2000 on a going concern basis. It is the largest provider of fixed telephony, largest broadband services provider with more than 60% Market share, and fourth largest mobile telephony provider in India. However, in recent years the company's revenues and market share have plummeted into heavy losses due to intense competition in the Indian telecommunications sector. BSNL is India's oldest and largest communication service provider (CSP). It had a customer base of 117 million as of January 2014. It has footprints throughout India except for the metropolitan cities of Mumbai and New Delhi, which are managed by Mahanagar Telephone Nigam (MTNL).BSNL provides almost every telecom service in India. Following are the main telecom services provided by BSNL. As of 30 November 2013, BSNL had 12.9% market share in India and stands as 5th Telecom Operator in India and 67% market share in ADSL Services. Managed Network Services: BSNL is providing complete Telecom Services Solution to the Enterprise Customers i.e. MPLS Connectivity, Point to Point Leased lines and Internet Leased Lines.Universal Telecom Services: Fixed wireline services and landline in local loop (WLL) using 71
International Journal of Advance and Innovative Research Volume 2, Issue 3 (I) : July - September , 2015
ISSN 2394 - 7780
CDMA Technology called bfone and Tarang respectively. As of 30 June 2010, BSNL had 75% market share of fixed lines. BSNL is major provider of Cellular Mobile Telephone services using GSM platform under the brand name Cellone & Excel (BSNL Mobile). As of 30 June 2010 BSNL has 13.50% share of mobile telephony in the country. It has 95.54 million customers using BSNL mobile.WLL-CDMA Telephone Services: BSNL's WLL (Wireless in Local Loop) service is a service giving both fixed line telephony & Mobile telephony. BSNL provides Internet access services through dial-up connection (as Sancharnet through 2009) as Prepaid, NetOne as Postpaid and ADSL broadband as BSNL Broadband BSNL held 55.76% of the market share with reported subscriber base of 9.19 million Internet subscribers with 7.79% of growth at the end of March 2010. Intelligent Network (IN): BSNL offers value-added services, such as Free Phone Service (FPH), India Telephone Card (Prepaid card), Account Card Calling (ACC), Virtual Private Network (VPN), Tele-voting, Premium Rate Service (PRM), Universal Access Number (UAN). BSNL offers the '3G' or the'3rd Generation' services which includes facilities like video calling, mobile broadband, live TV, 3G Video portal, streaming services like online full-length movies and video on demand etc. IPTV: BSNL also offers the 'Internet Protocol Television' facility which enables customers to watch television through internet.FTTH: Fibre to the Home facility that offers a higher bandwidth for data transfer. This idea was proposed on post-December 2009.Helpdesk: BSNL's Helpdesk (Helpdesk) provide help desk support to their customers for their services. BSNL, along with Sai Infosystem - an Information and Communication Technologies (ICTs) provider has launched Voice and Video over Internet Protocol (VVoIP). This will allow making audio as well as video calls to any landline, mobile, or IP phone anywhere in the world, provided that the requisite video phone equipment is available at both ends. BSNL Landline: BSNL Landline is a major role in India.Its numbers start with the prefix "2". Mahanagar Telephone Nigam Limited (MTNL) is a state-owned telecommunications service provider in the metro cities of Mumbai and New Delhi in India and in the island nation of Mauritius in Africa. The company had a monopoly in Mumbai and New Delhi until 1992, when the telecom sector was opened to other service providers. "Transparency makes us different" is the motto of the company. The Government of India currently holds 100% stake in the company. In recent years, MTNL has been losing revenue and market share heavily due immense competition in the Indian telecom sector. ALTMAN'S Z SCORE The Z score, developed by Professor Edward I. Altman, is perhaps the most widely recognized and applied model for predicting nancial distress (Bemmann, 2005). Altman developed this intuitively appealing scoring method at a time when traditional ratio analysis was losing favor with academics (Altman, 1968). Altman Z scores model requires a rm to have a publicly traded equity and be a manufacturer. Altman (1968) collected data from 33 bankruptcies and 33 non-bankruptcies, during the period 1946-1965, to nd discriminating variables for bankruptcy prediction. In his seminal paper, Altman evaluated 22 potentially signi cant variables of the 66 rms by using multiple discriminant analysis to build the discriminant function with ve variables. This model was later modi ed to Altman model (1993) that uses the same variables multiplied by different factors. Individual nancial ratio to predict the nancial performance of an enterprise may only provide caution when it is too late to take a corrective action. Further, a single ratio does not convey much of the sense. There is no internationally accepted standard for nancial ratios against which the result can be compared. Edwin Altman, therefore, combines a number of accounting ratios (liquidity, leverage, activity and pro tability) to form an index of the probability, which was effective indicator of corporate performance in predicting bankruptcy. The Z score is a set of nancial ratios in a multivariate context, based on a multiple discriminated model for the rms,where a single measure is unlikely to predict the complexity of their decision making. Altman Z-Score is a quantitative balance-sheet method of determining a company's nancial health. “Safe” companies, i.e. companies that have a low probability of bankruptcy; have an Altman Z-Score greater than 3.0. The Altman Z-Score is a measure of a company's health and likelihood of bankruptcy. Several key ratios are used in the formulation of an Altman Z-Score Value. The Z-Score model is the 1960's brainchild of Professor Edward Altman of NYU. The Z score consists of 5 variables: X1 = Working Capital / Total Assets X2 = Retained Earnings / Total Assets X3 = EBIT / Total Assets 72
International Journal of Advance and Innovative Research Volume 2, Issue 3 (I) : July - September , 2015
ISSN 2394 - 7780
X4 = Market Value of Equity / Total Liabilities X5 = Net Sales / Total Assets Original Altman Z Score for Public Companies The original model to calculate the Z score for public manufacturing companies is as follows Z = 1.2*X1 + 1.4*X2 + 3.3*X3 + 0.6*X4 + 1.0*X5 When Z is 3.0 or more, the rm is most likely safe based on the financial data. However, be careful to double check as fraud, economic downturns and other factors could cause unexpected reversals. When Z is 2.7 to 3.0, the company is probably safe from bankruptcy, but this is in the grey area and caution should be taken. When Z is 1.8 to 2.7, the company is likely to be bankrupt within 2 years. This is the lower portion of the grey area and a dramatic turnaround of the company is needed. When Z is below 1.8, the company is highly likely to be bankrupt. If a company is generating lower than 1.8, serious studies must be performed to ensure the company can survive. The Z-score formula may be used to predict the probability that a years.
rm will go into bankruptcy within two
Z-scores are used to predict corporate defaults and an easy-to-calculate control measure for the nancial distress status of companies in academic studies. The Z-score uses multiple corporate income and balance sheet values to measure the nancial health of a company. Eidleman (1995) de nes each of the above ratios as follows: X1 is a liquidity ratio , the purpose of which is to measure the liquidity of the assets 'in relation to rm's size' .It is the measure of net liquid asset of a concern to the total capitalization which measures the rm's ability to meet its maturing short-term obligations. X2 is an indicator of the 'cumulative pro tability' of the rm over time which indicates the ef ciency of the management in manufacturing, sales, administration and other activities. X3 is a measure of rm's productivity which is crucial for the long-term survival of the company. It is a measure of productivity of an asset employed in an enterprise. The ultimate existence of an enterprise is based on earning power. It measures how effectively a rm is using its resources. It measures the management's overall effectiveness as shown by the returns generated on sales and investments. X4 de nes the market views the company. The assumption is that with information being transmitted to the market on a constant basis, the market is able to determine the worth of the company. This is then compared to rm's debt. It is reciprocal of familiar debt equity ratio. Equity is measured by the combined market value of all shares, while debt includes both current and long term liabilities. This measure shows how much of an asset can decline in values before liabilities exceed the assets and the concerns become insolvent. It measures the extent to which the rm has been nanced by debt. Creditors look to the equity to provide the margin of safety, but by raising fund through debt, owners gain the bene t of marinating control of the rm with limited investment. X5 is de ned as a 'measure of management ability to compete'. The capital turnover ratio is the standard nancial measure for illustrating the sales generating capacity of the assets. INTERPRETATION OF RESULTS Table 1: Computation of Z score for BSNL Ratio/year
2009
2010
2011
2012
2013
2014
Current Assets
5,497,179
5497179
2,555,149
2,267,653
1,643,158
2,122,331
Current liabilities Net Working Capital
4,835,244 661,935
4835244 661935
1,954,910 600,239
1,929,361 338,292
1,980,444 -337,286
1,994,332 127,999
Total Assets X1=Net working capital/Total assets
13,509,631
13509631
11,095,806
10,199,019
8,933,344
0.048997267
0.0489973
0.054096025
0.03316907
9,555,527 0.035297478
0.01432823
Retained earnings
-182,265
-182265
-638,426
-885,070
-788,444
-701,976
73
International Journal of Advance and Innovative Research
ISSN 2394 - 7780
Volume 2, Issue 3 (I) : July - September , 2015 Total Assets X2=Retained Earnings/Total assets
-0.0867799
9,555,527 0.082511828
8,933,344 0.07857931
-657,979
-882,093
-795,536
-712,419
13509631
11,095,806
10,199,019
8,933,344
-0.016266
-0.059299793
-0.086488
9,555,527 0.083254016
-0.0797483
1,250,000
1,250,000
1,250,000
1,250,000
1,250,000
1,250,000
5000998
3023846
3088931
3081917
3191654
3180012
0.24995011
0.4133808
0.404670742
0.40559171
0.391646463
0.39308028
2,791,344
2791344
2,704,471
2,599,850
2,565,481
2,615,326
Total assets X5=Net sales/Total assets
13509631 0.206618819
13509631 0.2066188
11,095,806 0.24373813
10,199,019 0.25491177
9,555,527 0.268481372
8,933,344 0.29276002
Z score
0.342819641
0.4408781
0.275213854
0.13116733
0.070857464
0.17262164
EBIT Total Assets X3=EBIT/Total Assets Market Value of Equity Total Liabilities X4=Market value of equity/total liabilities Net sales
13,509,631 0.013491486
13509631
11,095,806
10,199,019
-0.013491
-0.057537596
-219,748
-219748
13,509,631 0.016266025
X1 measures the company’s ability to pay short term debts. It shows the liquidity of the company. A very low ratio indicates that working capital is funded by its debts. This is due to increase in current liabilities. X2 measures efficiency of the company to accumulate its profits to finance its total assets. The above table 1 shows that BSNL is able to not able to finance its assets only in three years that too at very low percentage. The balance is procured through long term debts. X3 indicates the company’s ability to utilise its fixed assets to earn profits. The ratio has been very low. X4 shows a low performance. Market value has increased for the three years and than declined. It has performed below the normal standards of this ratio. This shows the financial strength and popularity is low. X5 indicates the company’s ability to utilise its assets to generate sales. The ratio is ideally expected to be 2:1. During the study period on an average the results are below the standards. The result of Z score is below 1.8, the company is highly likely to be bankrupt. If a company is generating lower than 1.8, serious studies must be performed to ensure the company can survive. Ratio/year Current Assets Current liabilities Net Working Capital Total Assets X1=Net working capital/Total assets Retained earnings Total Assets X2=Retained Earnings/Total assets EBIT Total Assets X3=EBIT/Total Assets
Table 2: Computation of Z score for MTNL 2010 2011 2012 2013 16,565.54 10,366.61 9,757.98 10,297.11 25,359.62 14,252.38 14,722.95 17,596.25 -8,794.08 -3,886 -4,965 -7,299 34808.02 28,355 26,907 26,351
2014 15,630.78 8,275.15 7,356 27,436
-0.252645224 -3,063.79 34808.02
-0.1370422 -2,801.92 28,355
-0.1845224 -4,109.78 26,907
-0.27700174 -5,321.12 26,351
0.2680987 7,825.13 27,436
-0.088019658 -2,961.99 34808.02 -0.085095044
-0.0988173 -2,795.37 28,355 -0.0985863
-0.1527394 -4,109.80 26,907 -0.1527401
-0.20193605 -5,321.13 26,351 -0.20193643
0.285211 8,322.32 27,436 0.3033327 74
International Journal of Advance and Innovative Research
ISSN 2394 - 7780
Volume 2, Issue 3 (I) : July - September , 2015 Market Value of Equity Total Liabilities X4=Market value of equity/total liabilities Net sales Total assets X5=Net sales/Total assets
46,116 25359.62
28,571 21708.06
17,262 24370.9
11,592 29134.94
9,494 22395.59
1.818481507 3,657.75 34808.02 0.105083541
1.31612406 3,675.51 28,355 0.12962681
0.7083038 3,373.25 26,907 0.1253664
0.397872795 3,428.66 26,351 0.130117356
0.4239227 3,391.74 27,436 0.1236224
Z score
0.488957011
-0.077781
-0.3889558
-0.91266176
2.0999877
X1 measures the company’s ability to pay short term debts. It shows the liquidity of the company. A negative ratio indicates that working capital being funded by debts. X2 measures efficiency of the company to accumulate its profits to finance its total assets. The above table 2 shows that MTNL is not able to finance assets. It is procured through long term debts except in last year. X3 indicates the company’s ability to utilise its fixed assets to earn profits. The ratio has been negative except in last year. X4 shows a very poor result. Market value has decreased in the subsequent years. It has performed below the normal standards of this ratio i.e. 2. X5 indicates the company’s ability to utilise its assets to generate sales. The ratio is ideally expected to be 2:1. During the study period on an average the results are below the standards. The Z score is less than 1.8. The company is likely to be bankrupt within 2 years as per interpretation of this model. This is the lower portion of the grey area and a dramatic turnaround of the company is needed. RESEARCH SHORTCOMINGS The study is done for public sector telecom companies. The results are applicable only for the period chosen. Only a small sample is used for the study, therefore some risk is associated with the sample size. Altman Z Score was formulated and tested during 1960s. The samples he used were American companies. Even though it has been updated, the reliability of the model to the current situation and Indian Companies is not yet tested. CONCLUSION Fiscal fitness of a company should be assessed periodically. But such analysis is not given importance in a developing country like India and also in many emerging economies. This study has focused on measuring the financial health of automobile companies. It is revealed that even the public companies are not able to reach the overall average. Telecom sector is one which contributes considerably to the GDP of any economy. So, a study on this sector will provide insights of their performance to the external and internal users. The results show that all companies have underperformed after the Global Crisis. According to the study the BSNL and MTNL are not in safe zone, and the overall performance of the companies has decreased.. REFERENCES 1. Altman, E.I., Baidya, T.K.N. Dias, L.M.R., (1979), Assessing Potential Financial Problems of Firms in Brazil, Journal of International Business Studies, Fall. 2. Bemmann, Martin, Improving the Comparability of Insolvency Predictions (June 23, 2005). Dresden Economics Discussion Paper Series No. 08/2005. Available at SSRN:http://ssrn.com/ 3. Chang,J.F, Lee, M.C. and Chen, J.F. (2008), Establishment Forecasting Financial Distress Model using Fuzzy ANN method, Proceeding of the 10th Joint Conference,pp18-24. 4. Hui, H. and Jhao, Jing- Jing (2008), Relationship between Corporate Governance and Financial Distress: An empirical analysis of the distressed companies in China, International Journal of Management, vol.25,pp32-38. 5. Lau, L.H.A. (1987), A Five–state Distress Prediction Model, Journal of Accounting Research,vol.25, no.1,pp127-38, Spring,USA. 6. Mulla, Mansur.A (2002),” Use of Z score Analysis for Evaluation of Financial Health of Textile Mills-A case Study”, Abhigyan, Jan-March, Vol.XIX, No.4, pp37-41. 75
International Journal of Advance and Innovative Research Volume 2, Issue 3 (I) : July - September , 2015
ISSN 2394 - 7780
7. Rasoulzadeh, M., (2001) A Study of Application of Altman’s Model for Predicting the Bankruptcy of Firms accepted in Tehran Stock Exchange. Stock Exchange Monthly, (30): 62-65. 8. Taffler, R.J. (1983), The Assessment of Company Solvency and Performance using a Statistical Model, Accounting and Business Research, vol.15, no52,pp295-308. 9. Ugurlu, Mine and Hakan, Aksoy (2006), Prediction of Corporate Financial Distress in an Emerging Market: The case of Turkey, Cross Cultural Management: An International Journal, Vol.13(4), pp277-96.
76
International Journal of Advance and Innovative Research Volume 2, Issue 3 (I) : July - September , 2015
ISSN 2394 - 7780
ELEMENTARY EDUCATION AND HUMAN CAPITAL BUILDING: THE JHARKHNAD EXPERIENCE Onkar Nath Mishra Research Scholar, Faculty of Management Studies, Banaras Hindu University, Varanasi, Uttar Pradesh ABSTRACT Universal Elementary Education is one of the Millennium Development Goals and is key to build a strong pool of human resources. Just as organisation’s effectiveness and efficiency is determined by its human capital, in the same way the growth prospect of nations and states is affected by its human resources. The theoretical literature clearly demonstrates that states investing higher in human resource development have grown faster than those who do not. Elementary education is one of the key capability building measure and gateway to other HRD interventions. Jharkhand, despite being a resource rich state has failed to ensure that all of its children receive and complete a basic course in elementary education. Not educating the present cohorts has remarkable repercussions for the human resource development which finally manifests itself in maladies like poverty and unemployment. There are a plethora of issues that need immediate attention. The state not only lags behind on literacy front but also the quality of elementary education is deplorable. It seems a herculean task to achieve the UEE goal by 2015. However, the study recommends a multi pronged and concerted efforts to achieve the goal of UEE and elementary education must be given a front seat. Key Words: elementary education, human resource development, Z and T score, coefficient of concordance JEL Classification: I 20, I 28, O 15 1. Prelude Since the development is seen as expansion in choices, the role of investment in human capital has assumed much significance. Of several types of investments the state undertakes in developing its human resources, education is the most important. It is so because education and elementary education in particular, augments the capability of people and enlarges their choice set. The elementary education not only equips an individual with the basic skills of reading, writing and making simple calculations but has far reaching consequences for human capital building. First of all, being literate is a valued outcome in itself as it bolsters the self respect and self confidence of the individual which in turn, has several spill over effects. Furthermore, it prepares the individual for learning more sophisticated skills. The theoretical literature provides ample evidence that the nations and states having a good elementary education system as manifest in higher literacy rate have better human capital than those who do not. Needless to say, better human capital brings economic growth and development. The state of Jharkhand accounts for 2.42% of the total geographical area and 4 % of the total population of the country. The state was created with a vision to become one of the most developed states of India, as it is endowed with extensive natural resources. However, it continues to remain laggard on many fronts and elementary education is one of them. What this study argues is that the state has not been able to realise its potential because it has poor human capital; elementary education lying in decrepitude. Given the fact that elementary education plays a pivotal role in building human capital, it is really a matter of concern that it has not been accorded due significance. This study aims at summarising the status of elementary education in the state and points towards the implications of elementary education for human capital formulation and consequently economic growth and development of the state. The background of this study lies in the fact that with just two and half year in hand, it is going to be a herculean task for the state of Jharkhand to achieve the Millennium Development Goal of Universal Elementary Education (UEE). Universal elementary education assumes that all children irrespective of the caste, creed or location would complete primary education of comparable quality within the stipulated time frame. However, for lakhs of juveniles of Jharkhand the access to primary education continues to be a distant dream. And for those who are enrolled in the primary schools the situation is no far better. The elementary education system in the state is in moribund state as it is plagued with problems ranging from acute shortage of teachers to lack of basic amenities in the schools. The remainder of the paper is divided into five sections. The following section (Section 2) delineates the materials and methodology of the study and comprises three sub sections. The sub section 2.1 discusses the objective and scope of the study and the next sub section focuses on Data source and methodology. It is followed by the development of hypotheses in the last sub section. Section three has been devoted to the analysis of data and related discussion. Section four summarises the key findings of the study. The last section summarises and concludes. 77
International Journal of Advance and Innovative Research
ISSN 2394 - 7780
Volume 2, Issue 3 (I) : July - September , 2015
2. ELEMENTARY EDUCATION, HUMAN CAPITAL AND DEVELOPMENT Human capital is an extremely complex concept defined in non uniform manner. However, it usually refers to the resources in people. It has been defined by the OECD as “the knowledge, skills, competences and other attributes embodied in individuals that are relevant to economic activity” (OECD, 1998). This is a sufficiently broad definition as it encompasses all sort of investments; one can think of in building and improving skills of the human resources of a state and thus is not limited to education alone. While analysing the nexus between elementary education, human capital building and development we face two obvious questions. First, why developed nations invest heavily in elementary education than higher education? Second, why human capital is better in developed nations as compared to developing ones? Interestingly, first question is the answer to the second one. The (social) rate of return is higher on elementary education than higher education, therefore still it is state funded in developed countries. Elementary education contributes in human capital building in both, direct and indirect ways. It directly contributes in human capital building when it boosts people’s self confidence; help them find better jobs, equips with basic skills and enable them to be a part of public debate thereby leading to demand for various services and social security measures from their respective governments (HDR, 2013). It also makes individuals aware of their rights at workplace and hence prevents exploitation by the employers. The spillover effects are no less important than direct benefits. For example, an educated person is more aware of his surroundings, is health conscious etc. From organisation point of view, what are its implications? There are empirical studies that report that firm’s core competences or competitive advantage is induced by the investment of human capital entailed with value creating potential (Lepak & Snell, 1999). Education investment for workers significantly affects his/her productivity in the workplace (Lucas, 1988). After being employed, the workers tend to easily control their working condition in the workplace and relatively receive high rewards in the internal/external labor market (Edward, 1979). Similarly, many researchers present that accumulation of one’s human capital on education and training investment largely affects the growth of an individual’ wage, firms’ productivity, and national economy (Denison, 1962; Schultz, 1961). Elementary education has long been viewed as an important factor contributing to the economic well-being. The literature on growth and development illustrates three mechanisms through which education helps in building human capital may influence the growth process of states. First, education can increase the human capital inherent in the labor force, which increases labor productivity and thus transitional growth toward a higher equilibrium level of output (as in augmented neoclassical growth theories, Mankiw et al. (1992)). Second, education can increase the innovative capacity of the economy, and the new knowledge on new technologies, products, and processes promotes growth as in theories of endogenous growth (Lucas, 1988; Romer, 1990; Aghion and Howitt, 1998). Third, education can facilitate the diffusion and transmission of knowledge needed to understand and process new information and to successfully implement new technologies devised by others, which again promotes economic growth (Nelson and Phelps, 1966; Benhabib and Spiegel, 1994). The Human Development Report 2011 reads “States that perform better on health and education outcomes are also the states with higher HDI and thus higher per capita income”. Below we present below HDI and EDI rankings of few states of India to compare with Jharkhand. Table No.1: HDI and EDI Ranking of Select States STATES
Jharkhand
Kerala
Himachal Pradesh
Punjab
Tamil Nadu
Uttar Pradesh
Bihar
Orissa
HDI#
23
1
4
5
8
18
19
22
EDI*
20
2
4
7
3
13
21
15
# HDI rank is for year 2007-08 *Education Development Index for elementary education, 2006-07 Since HDI constitutes of 3 key indicators of good human capital (since high development very strongly correlates with human capital), it is clear that states with high HDI ranking than Jharkhand have better elementary education system. In short, we can say that elementary education builds human capital by (1) imparting basic skills of reading, writing and making simple calculations, (2) paving the way for learning advanced and sophisticated skills, (3) 78
International Journal of Advance and Innovative Research Volume 2, Issue 3 (I) : July - September , 2015
ISSN 2394 - 7780
augmenting the awareness level of an individual and his capability to reason, (4) enlarging his choice set, and (5) enabling him to make informed and effective choices. These direct benefits generate many indirect benefits for the organisations, in turn. 3. METHODOLOGY 3.1 Objective and scope The specific objective of this paper is to: i. assess the overall status of elementary education in the state ii. enquire and measure the extent of regional inequities in terms of various indicators of primary education iii. study the intra district variations in the distribution of elementary education facilities iv. assess the status of incentives across various districts of the state v. delve into the link between elementary education and human resource development The study is quite comprehensive in its scope. The study includes all the districts of the state. The time period of the study is 2008-2012. 3.2 Data source and technique Secondary data has been utilised to accomplish the objectives of the study. Primarily, this study relies on District Information System for Education (DISE) dataset. However, data have also been taken from other sources as well. These include various reports and publications of organisations working in the field of elementary education such as UNESCO, CARE, NUEPA to name a few. Furthermore data published by the HRD ministry of Jharkhand as well as central government have been used in the study. Important data sources include: (1) annual data published by Government of India under the title, Selected Educational Statistics, (2) annual status education report (ASER) of various years (3) Jharkhand Education Project Council (JEPC)Publications In order to analyse the raw data of DISE 2008-09, MS Excel and statistical software SPSS have been used. The various measures that have been computed are ratio and proportion and percentages along with other appropriate statistical tools. A wide range of parameters and indicators have been used to assess the status of primary education. We have broadly classified these indicators into four groupscoverage, efficiency, infrastructure and incentive. The ranking of districts has been done by using the standardised scores like Z score and T score. Z-Score = (Xi – Mean) / Standard Deviation T-Score = 10Z + 50 Kendell’s rank method has been employed to assess the overall status and position of primary education in the entire 24 districts of the state. Co efficient of Concordance (W) has been used to study the significance of association of a priori said parameters. 3.3 Hypothesis Following hypotheses have been formulated for the purpose of the study: a. H1 : The three sets of rankings of districts are independent for coverage parameter b. H2 : The three sets of rankings of districts are independent for efficiency parameter c. H3 :The three sets of rankings of districts are independent for infrastructure parameter d. H4 : The three sets of rankings of districts are independent for incentive parameter 4. RESULTS AND DISCUSSION As per the provisional estimates of census of 2011 the literacy rate in the state has gone up to 67.63% from 54.11% in 2001. Still the state ranks at 27th position on literacy fronts. 4.1 Overall Position of Elementary Education In this section we study the overall position of elementary education in the state by using the Kendell’s rank method. The overall rankings of districts have been done by pooling the individual rankings of indicators constituting that dimension. The individual ranking of the all the 24 districts on each parameter is given in the appendix. The composite score so obtained is the summary measure of that district on the concerned dimension and the composite ranking of all the 24 districts is presented below: 79
International Journal of Advance and Innovative Research Volume 2, Issue 3 (I) : July - September , 2015
ISSN 2394 - 7780
Table 2: Composite Ranks of Districts DISTRICTS BOKARO CHATRA DEOGHAR DHANBAD DUMKA GARHWA GIRIDIH GODDA GUMLA HAZARIBAG JAMTARA KHUNTI KODARMA LATEHAR LOHARDAGA PAKAUR PALAMU WEST SINGHBHUM EAST SINGHBHUM RAMGARH RANCHI SAHIBGANJ SARAIKELAKHARSAWAN SIMDEGA
Coverage 21.000 11.000 17.500 17.500 12.500 9.500 23.000 16.000 4.000 2.000 1.000 3.000 5.000 7.000 19.000 8.000 20.000 6.000 14.000 9.500 12.500 22.000
Efficiency 13.000 10.000 11.000 17.500 9.000 6.000 4.000 2.000 17.500 5.000 12.000 16.000 21.000 7.500 24.000 23.000 3.000 1.000 22.000 15.000 20.000 7.500
Incentive 21.000 8.000 4.000 9.000 19.500 16.000 1.000 6.500 22.000 19.500 3.000 23.000 17.000 10.500 18.000 15.000 6.500 14.000 24.000 5.000 12.000 2.000
Infrastructure 13.500 16.500 5.000 18.000 20.500 7.000 2.000 9.500 19.000 6.000 8.000 22.000 9.500 20.500 12.000 24.000 1.000 15.000 23.000 13.500 16.500 3.000
24.000
19.000
13.000
11.000
15.000
14.000
10.500
4.000
It is worthwhile to mention here that an inverse relationship exists between the status of elementary education and composite score of the districts. Higher the composite score worse is the condition of that district. From the above table it is clear that on the coverage dimension, Saraikela Kharsawan district is at the top position (rank 24) in providing easy availability of primary schools to its children. The Giridih districts stands at number two with a rank of 23 followed by Sahibganj (22). The districts of Jamtara, Khunti and Hazaribagh are in a deplorable state with regard to the availability of primary schools. The second dimension is that of efficiency. The third column of table number 5 depicts the ranking of the districts on this parameter. Here Lohardaga, Pakur and East Singhbhum hold the first three positions in the same order with the ranks of 24, 23 and 22 respectively. West Singhbhum (1), Godda (2) and Palamu (3) are the laggard ones. On the third dimension of infrastructure as shown in column number five, Pakur, East Singhbhum and Khunti are the top three districts respectively. Palamu, Giridih and Sahibganj are the worst performing districts with ranks 1, 2 and 3 in the same order. East Singhbhum is at the number one position with aspect to incentive followed by Khunti and Gumla. 4.2 Association of parameters Now it will be interesting to find out whether any association exists among the different indicators under each dimension for the different districts. To accomplish this goal Kendall’s coefficient of concordance (W) has been calculated. Since there are 24 districts which is greater than 7 the appropriate value of Chi square has been used to test the significance of the W. The calculated value of W and its corresponding chi square value has been tabulated in table number 3.
80
International Journal of Advance and Innovative Research
ISSN 2394 - 7780
Volume 2, Issue 3 (I) : July - September , 2015
Table 3: Summary table for Test of Association of parameters Serial No.
Hypothesis
Kendell’s W
χ2 value
Accept/Reject
1
The three sets of rankings of districts are independent on coverage
0.316
21.78
Accept
2
The four sets of rankings of districts are independent for efficiency ratios
0.201
18.49
Accept
3
The three sets of rankings of districts are independent for incentive ratios
0.470
32.44
Accept
4
The three sets of rankings of districts are independent for infrastructure ratios
0.184
21.19
Accept
Tabulated value of χ2 = 35.20 at degree of freedom 23 The chi square value for the first null hypothesis is 21.78, for the second it is 18.49, for third it is 32.44 and for the last null hypothesis it is 21.19. The tabulated value of chi square at 23 degree of freedom is 35.20. It is clear that the calculated value of chi square is less than the tabulated value of chi square for all four hypotheses, thereby leading to the acceptance of all the four hypotheses. The acceptance of the first null hypothesis implies that the overall availability of the primary schools cannot be taken as a base for framing policies and planning for elementary education in the state. The individual indicators and factors have to be taken into account while improving the easy and adequate availability of the primary schools. Similarly, the acceptance of second null hypothesis implies that 4 sets of ranking are independent for efficiency dimension. There is no uniformity in performance of the districts on various individual parameters. Consequently, it requires a tailored approach rather than a approach based on a composite measure. Similarly, the acceptance of the third null hypothesis has important implications. The various incentives need to be separately monitored and administered in the different districts so as to increase the enrolment ratio and decrease the dropout rate. Same is the case with the status of infrastructure, as is evident with the acceptance of the fourth null hypothesis. It requires attention on each and every parameter rather than looking at the composite picture and basing decisions on that picture. In nutshell, while designing any mechanism for better delivery of results each parameter demands individual treatment. 5. MAJOR FINDINGS OF THE STUDY a. Elementary education builds human capital in two ways direct and indirect; directly it is beneficial for the individuals and indirectly it generates benefits for the organisations and states. b. There is strong link between the status of elementary education, quality of human capital and growth rate for the Indian states. c. The state as a whole is under covered by the primary school facility as well as there is wide disparity in the distribution of primary schools in different areas of the state. d. Kolhan and Northern Chhota Nagpur divisions are relatively in better position and more efficient in providing elementary education facilities to its children than their three other counterpart. e. The state as a whole is not performing well in providing elementary education infrastructure. The percentage of schools with electricity, drinking water facility, girl’s toilet etc is much lower than most of the developed states. f.
Most of the indicators and parameters in the study show no association for the districts meaning thereby that the overall picture of the elementary education system cannot be used as a base for planning the elementary education system.
6. FINAL REMARKS With the shift to a knowledge based economy, the role of human capital has become vital and all those investments that build human capital have become important. In this context, the role of elementary education or Education for All can hardly be overlooked. The elementary education may be viewed as a gateway to the 81
International Journal of Advance and Innovative Research Volume 2, Issue 3 (I) : July - September , 2015
ISSN 2394 - 7780
world of higher education, knowledge and information. Being the very first stage of formal education, primary education bears the onus of equipping the children with the basic knowledge of reading – writing. It bestows a number of benefits both directly and indirectly to individuals, organisations and states. But it is a tyranny of the fact that millions of the children in the state are excluded from access to elementary education. The elementary education system in the state is in a desperate state plagued with a host of problems viz. never enrolment, poor attendance, high dropout rate, scarcity of teachers, inadequate number of schools, poor infrastructure to name a few. This has led to poor human capital in the state which has finally resulted in slow growth rate for the state. By not educating its present cohort of children the state also is devoid of the opportunity to leverage its youth potential in the coming years. It has to be recognised that there is enormous opportunity cost of not educating the ongoing generation. The government has to recognise that unless it makes adequate investment in developing its human resources the growth potential can’t be realised. Also in the absence of elementary education it will be futile to undertake many programmes of HRD. Hence, elementary education must take the front seat and human resource development must be the first priority. REFERENCES 1. A. Philippe and H. Peter (1998), Endogenous growth theory, Cambridge, MA: MIT Press. 2. Benhabib, J. and Spiegel, M. M. (1994), The role of human capital in economic development: evidence from aggregate cross-country data, Journal of Monetary Economics, 34 (2), 143-173. 3. Debi (1996), Regional Disparity in Education in Orissa, Indian journal of Regional Science, 28 (2). 4. Denison, E. F. (1962). The Sources of Economic Growth in the United States and the Alternatives before Us. NY: Committee for Economic Development 5. Edwards, R. (1979). Contested Terrain: The Transformation of the Workplace in the Twentieth Century. NY: Basic Books 6. Ghosh, S. (2006). An Analysis of Primary Education in Kolkata, CCS Working Paper No. 149, Centre for Civil Society. 7. Human Development Report (2013), UNDP 8. India Human Development (2011), Institute for Applied Manpower Research 9. Inter-Agency Commission (1990). Final Report World Conference on Education for All: Meeting Basic Learning Needs. Jomtien, Thailand. 10. Kundu, S.K (2012). Regional Disparities of Primary Educational Facilities in Murshidabad District of West Bengal, India: Some Findings. International Journal of Humanities and Social Sciences. 2(8), 81-90 11. Lepak, D., & Snell, S. (1999). The Human Resource Architecture: Toward a Theory of Human Capital Allocation and Development. Academy of Management Review, 24, 31-48. 12. Lucas, R. E. (1988), On the mechanics of economic development, Journal of Monetary Economics, 22 (1), 3-42. 13. Mandal, M. and Ganguli, M. (2011). Status of Primary Education in Bankura District, West Bengal: A Geographical Interpretation. Indian Journal of Landscape Systems and Ecological Studies, 34 (1), 171-182. 14. Mankiw, N.G, Romer, D. and Weil, D. (1992), A contribution to the empirics of economic growth, Quarterly Journal of Economics, 107 (2), 407-437. 15. Mishra O. N and Gupta S. (2013). Scrutinising the Inclusiveness of Education at The Grass root Level in Madhya Pradesh, 16. Nelson, R. R. and Phelps, E. S. (1966), Investment in humans, technological diffusion, and economic growth, American Economic Association Papers and Proceedings, 56 (1), 69-75. 17. Rana, K. and Das S (2004). Primary Education in Jharkhand, Economic and Political Weekly, 1172-1178 18. Romer, P. M. (1990), Endogenous technological change, Journal of Political Economy, 98 (5), 8071-8102. 19. Schultz, T. W. (1961). Investment in Human Capital. American Economic Review, 51, 1-17 20. Sen, A. (1999). Development as Freedom. New York: Anchor Books 21. Shukla, S. (1994). Attainment of Primary School Children in India. NCERT, New Delhi. 22. UNESCO, (2001). Monitoring Report on Education for All, UNESCO, Paris.
82
International Journal of Advance and Innovative Research Volume 2, Issue 3 (I) : July - September , 2015
ISSN 2394 - 7780
VAT AND GST REFUNDS Reena Kumari Research Scholar, Magadh University, Bodh- Gaya TOWARDS MORE BUSSINESS –FRIENDLY MECHANISM? Some countries cite their form of value added tax as a goods and sercices tax (GST). For ease of reading we refer in this article to all value added taxes as VAT. NEUTRALITY OF VAT V THE REAL WORLD Businesses sometimes incur VAT on expenses in a foreign country while having no taxable activity or being established in that country. These expenses may be related to the economic activity of those business outside that country and, if so, those businesses should legitimately be entitled to recover the VAT charged to them on those expense. Because VAT, by its very nature ,is supposedly neutral and for VAT payers , the burden of the tax should not fall on taxable businesses. VAT should in principle only tax consumption by final consumers. Businesses should be entitled to deduct the tax on their purchases and offset that tax against the tax they normally collect on their own sales. In the real world things are bit different. It would things are a bit different. It would seem that not all countries implement refund mechanisms and that some of the countries that do so have such complex or burdensome practices that they are difficult for business to apply in practice. In these circumstances VAT might in the end be a cost for businesses. Even when refunded, the amont of time required to obtain the refund creates a cash flow cost for businesses to which shold be added the costs of making the refund claims themselves. In the particular context of the financial crisis, where cash flow is even more significant, this topic is of growing importance. THE EUROPEAN UNION Different practices are implemented around the world . In the European Union (EU), the now relatively well-integrated VAT system has ensured that refund claim mechanisms have been largely harmonised. When the foreign business incurring VAT is located outside the EU, the refund procedures are governed by the 13th VAT Directive 86/560/EECof 17 November 1986. When the foreign business is located with in the EU, the 8th VAT Directive 79/1072/EEC of 6 December 1979 is applicable. Those procedures are open to all businesses that incur VAT in and EU member state when they are not established or the purpose of their activity , nor registered in this Member State ( that is when they do not carry out oa taxable activity in the EU member State of the refund). The EU recently adopted a new Directive 2008/9/EC of 12 February 2008 repealing with effects from 1 January 2010 the previous 8th VAT Directive, and replacing it. This Directive shold ‘enhance the position of businesses’ , as it was perceived that ‘ the current paper-based procedure is slow, coumbersome and costly’. The new procedure , which will apply ot refund applications submitted after 31 December 2009, will be fully electronic and the intention is to ensure quicker refunds for claimants, who will be able to initiate the procedure through the tax administration of their country of establishment. The new Directive implements a more businessfriendly procedure , so as to improve the functioning of the internal market. Other countries Other countries have different strategies. Some countries simply do not provide a refund procedure. This means that is some cases VAT becomes a cost for foreign business. This might create a disincentive to invest in those contries , as usally a business that decides to st up in a country will incur costs before commencing a taxable activity ( although rules exist in many jurisdictions that allow recovery of the VAT incurred for the purpose of setting up a domestic taxable activity). Some of the countries that do not have a refund procedure do , however, allow recovery of the tax through a registration mechanism. Usually , in the EU, a business can only register for VAT in a country- and has to – when it carries out a taxable activity in that country, which means that it will be consdered as a domestic VAT taxpayer in that particular country. In some other jurisdictions, such as Canada, it is possible to register in that country while not having a taxable activity in Canada, for the sole purpose of recovering the Canadian VAT incurred. Yet other countries, such as New Zealand , have chosen to deal with that problem by implementing a wide series of exemption provisions when supplies are made to non resident companies. There do remain examples 83
International Journal of Advance and Innovative Research Volume 2, Issue 3 (I) : July - September , 2015
ISSN 2394 - 7780
of countries where the VAT will be a cost to foreign businesses because the issue has not been coverd by any of these provisions. In such circumstances, those business willl have to implement strategies of their own in order to avoid beraring that non-recoverable VAT cost. They may for instance, develop a small taxable activity in that country that allows them to offset their input tax. THE PERCEPTION OF BUSINESS The lack of consistency between these approaches suggests that eh netrality of the tax could be threatened and that aby irrecoverable tax- and the resulting cascading effect- might distort competition and effect growth. Bussinesses actively participate in the OECS’s work on consumption taxes and they meet with government representatives in a Technical Advisory Group (TAG) to discuss these issues. A preliminary survey of business in July 2008 was an attempt to assess the magnitude of the isseue. The answers received showed that the refund of foreign VAT is a major issue for many respondents. This confirmed a survey previously made by the IMF that showed that ‘refunding of credits… has been a source of tension between tax authorities and the business sector and , in some countries , has led to complex adminstractive measures that have significantly undermined the functioning of the VAT system. Even when refund procedures are in place, business are often concerned about the complexity of those peocedures. Some countries do require reciprocity agreements with the claimant’s hame country ( where the claimant is established in the non-EU country . for example) before making and refund , which means that some countries are ‘blacklisted’. Some countries require that the claimants appoint a tax representative, who is usually in charge of completing all of the formalities related to the claim and is normally jointly liable iwht the claimant. The requirement to appoint a tax representative is , for instance,an option given to the EU member States under the 13th VAT Directive, Art2(3). Businesses are also concerned about the compliance burderns and cost of the procedures that are frequently paper-based and use the local language. There are also concerns about the length of the peocedure: the survery results suggest that some administrations ask many more questions that other and that the time for processing claims differs considerably from one country to another. THE NEED FOR GLOBAL CO-OPERATION On the other hand, granting refunds to businesses with no ‘ presence’ in a country inevitabl brings and element of risk for tax administrations. The absence of ‘jurisdictional power’ over these businesses, or the lack of appropriate exchange of information procedures aro assistance in recovery may well leave the tax administration exposed to fraudulent claims, with little hope of recovering any incorrect refund payments. The results of the preliminary survey made by the OECD in July 2008 suggests tht there is a strong need for co-operation on the refund issue between businesses and governments. Discussions in a global forum such as the OECD’s working party on Consumption Taxes, through its regular interaction with business in the TAG, help to achieve a better balance between ther interests of all parties. Governments better appreciate the concerns of business and osme countries that do not have refund mechanisms could be influenced to provide some form of appropriate mechanism. The OECD will carrying out a new survey in May 2009, thus has been developed in collaboration with government and businsess representatives. It will create a unique opportunity for the broader businesses community ot express its views as the means of ensuring that VAT not incurred in such a way as to and economic cost. depending on outcome of the survey, it is possible the OECD may develop some guidelines on best peractices, or at least some clearer guidance on how best to ensure fiscal neturality. In the context of the current crasis many countries, such as France. Already implemented specific provide ot facilitate the refund of VAT credit their domestiv business and it most be consistent to extend these measures to foreign businesses. International co-operation in needed ,as neither countries bnor businesses can be expected to solve problems in isolation. The OECD work on intenational VAT issuesis under way and guidance on ensure neutrality fro business may well for important element. More information the OECD’s work consumption is available at www.oecd.org/ctp/com. Notes There are some exceptions. Sometimes businesses are not entitled to decides th VAT on their purchases some VAT becomes a sost many countries for instance, exempt specific activities from VAT and do not allow businesses involved in those activities to deduct the VAT on their purchases linked to those exempt activities. 1. In some countries , those activities are reffered to as ‘input taxed, rathere thatn exempt. Health and financial services are amongst the most current exemptions. It many happens also that some countries have impelment specific input tax ‘blocks’ with respect to certain types of supplies of services or goods . VAT 84
International Journal of Advance and Innovative Research Volume 2, Issue 3 (I) : July - September , 2015
ISSN 2394 - 7780
on purchases of vehicle fuel, for instance,is not or only partly recoverable in france depending on the type of fuel that is consumed ( articlae 298 4.10 and 10 bis of the French tax code). These exceptions affects the neutrality of VAT and may create tax cascading effects. 2. See point (3) of the new coucil Directive 2008/9/ EC of 12 feburary 2008 laying doen detailed rules for the refund of value added tax. Provided or in Directive 2006/112/EC, to taxable persons not established in the Member State of refund but established in another Member state. 3. See http://www.lexisurl.com/yPfzl. 4. Canadian Excise Tax Act, s 240(3). 5. Harrison G. and Krelove, R.(2005) VAT refunds: a review of country experience , IMF working paper WP/05/218, IMF , Washington. 6. This is an option given to EU member States by 13th VAT Directive, Art 2(2)). 7. See the French ‘Decret’ n0 2009-109 dated 29 January 2009 ‘ relatif aux modalites d’option pour un regimed’ imposition d’apres le chiffre d’ affaires reel et de rembousement des credits de taxe sur la valeur ajoutee’).
85
MANUSCRIPT SUBMISSION GUIDELINES FOR CONTRIBUTORS 1. Manuscripts should be submitted preferably through email and the research article / paper should preferably not exceed 8 – 10 pages in all. 2. Book review must contain the name of the author and the book reviewed, the place of publication and publisher, date of publication, number of pages and price. 3. Manuscripts should be typed in 12 font-size, Times New Roman, single spaced with 1” margin on a standard A4 size paper. Manuscripts should be organized in the following order: title, name(s) of author(s) and his/her (their) complete affiliation(s) including zip code(s), Abstract (not exceeding 350 words), Introduction, Main body of paper, Conclusion and References. 4. The title of the paper should be in capital letters, bold, size 16” and centered at the top of the first page. The author(s) and affiliations(s) should be centered, bold, size 14” and single-spaced, beginning from the second line below the title. First Author Name1, Second Author Name2, Third Author Name3 1Author Designation, Department, Organization, City, email id 2Author Designation, Department, Organization, City, email id 3Author Designation, Department, Organization, City, email id 5. The abstract should summarize the context, content and conclusions of the paper in less than 350 words in 12 points italic Times New Roman. The abstract should have about five key words in alphabetical order separated by comma of 12 points italic Times New Roman. 6. Figures and tables should be centered, separately numbered, self explained. Please note that table titles must be above the table and sources of data should be mentioned below the table. The authors should ensure that tables and figures are referred to from the main text. EXAMPLES OF REFERENCES All references must be arranged first alphabetically and then it may be further sorted chronologically also. Single author journal article: Fox, S. (1984). Empowerment as a catalyst for change: an example for the food industry. Supply Chain Management, 2(3), 29–33. Bateson, C. D.,(2006), ‘Doing Business after the Fall: The Virtue of Moral Hypocrisy’, Journal of Business Ethics, 66: 321 – 335 Multiple author journal article: Khan, M. R., Islam, A. F. M. M., & Das, D. (1886). A Factor Analytic Study on the Validity of a Union Commitment Scale. Journal of Applied Psychology, 12(1), 129-136. Liu, W.B, Wongcha A, & Peng, K.C. (2012), “Adopting Super-Efficiency And Tobit Model On Analyzing the Efficiency of Teacher’s Colleges In Thailand”, International Journal on New Trends In Education and Their Implications, Vol.3.3, 108 – 114.
Text Book: Simchi-Levi, D., Kaminsky, P., & Simchi-Levi, E. (2007). Designing and Managing the Supply Chain: Concepts, Strategies and Case Studies (3rd ed.). New York: McGraw-Hill. S. Neelamegham," Marketing in India, Cases and Reading, Vikas Publishing House Pvt. Ltd, III Edition, 2000. Edited book having one editor: Raine, A. (Ed.). (2006). Crime and schizophrenia: Causes and cures. New York: Nova Science. Edited book having more than one editor: Greenspan, E. L., & Rosenberg, M. (Eds.). (2009). Martin’s annual criminal code:Student edition 2010. Aurora, ON: Canada Law Book. Chapter in edited book having one editor: Bessley, M., & Wilson, P. (1984). Public policy and small firms in Britain. In Levicki, C. (Ed.), Small Business Theory and Policy (pp. 111–126). London: Croom Helm. Chapter in edited book having more than one editor: Young, M. E., & Wasserman, E. A. (2005). Theories of learning. In K. Lamberts, & R. L. Goldstone (Eds.), Handbook of cognition (pp. 161-182). Thousand Oaks, CA: Sage. Electronic sources should include the URL of the website at which they may be found, as shown: Sillick, T. J., & Schutte, N. S. (2006). Emotional intelligence and self-esteem mediate between perceived early parental love and adult happiness. E-Journal of Applied Psychology, 2(2), 3848. Retrieved from http://ojs.lib.swin.edu.au/index.php/ejap Unpublished dissertation/ paper: Uddin, K. (2000). A Study of Corporate Governance in a Developing Country: A Case of Bangladesh (Unpublished Dissertation). Lingnan University, Hong Kong. Article in newspaper: Yunus, M. (2005, March 23). Micro Credit and Poverty Alleviation in Bangladesh. The Bangladesh Observer, p. 9. Article in magazine: Holloway, M. (2005, August 6). When extinct isn't. Scientific American, 293, 22-23. Website of any institution: Central Bank of India (2005). Income Recognition Norms Definition of NPA. Retrieved August 10, 2005, from http://www.centralbankofindia.co.in/ home/index1.htm, viewed on 7. The submission implies that the work has not been published earlier elsewhere and is not under consideration to be published anywhere else if selected for publication in the journal of Indian Academicians and Researchers Association. 8. Decision of the Editorial Board regarding selection/rejection of the articles will be final.
PUBLICATION FEE
The International Journal of Advance & Innovative Research is an online open access journals, which provides free instant, worldwide and barrier-free access to the full-text of all published manuscripts to all interested readers in the best interests of the research community. Open access allows the research community to view, any manuscript without a subscription, enabling far greater distribution of an author's work than the traditional subscription based publishing model. The review and publication fee of a manuscript is paid from an author's research budget, or by their supporting institutions. As costs are involved in every stage of the publication process, like manuscript handling form submission to publication, peer-review, copy-editing, typesetting, tagging and indexing of articles, Electronic composition and production, hosting the final article on dedicated servers, electronic archiving, server and website update and maintenance and administrative overheads, each author is asked to pay certain fee as follows. The publication fee for the Online journal is Rs 1000. If the author wants a printed copy of the journal, then additional Rs.500/- have to be pay (which includes printing charges of the journal, hard copy of publication certificate for all authors, packaging and courier charges ). The publication fee for the Online journal is Rs $50. If the author wants a printed copy of the journal, then additional $50 have to be pay (which includes printing charges of the journal, hard copy of publication certificate for all authors, packaging and courier charges ). The principal author will get one complimentary copy of journal ( online / print ) based on fee paid along with publication certificate ( e copy / hard copy) after publication of the paper. The publication fee, you can direct deposit / online transfer in favour of IARA at HDFC bank ( IFS code : HDFC0001474, SWIFT code / BIC Code : HDFCINBBCAL, HDFC Bank, Nezone Plaza, Near Sohum Shoppe, Christian Basti, G. S. Road, Guwahati, Assam, India) Current Account no 50200006808986 If anybody do not have funds to pay publication fee, he/she will have an opportunity to request the Editor for fee waiver through the Head of his/her Institution/Department/University with the reasons, because IARA does not want fee to prevent the publication of worthy work, however fee waivers is granted on a case-to-case basis to authors who lack funds. To apply for a waiver author/s must request during the submission process. Any request received thereafter will not be considered.
Indian Academicians and Researchers Association 1, Shanti Path ,Opp. Darwin Campus II, Zoo Road Tiniali, Guwahati, Assam email :
[email protected] /
[email protected]