DINA M. FONSECA, SCOTT CAMPBELL,1 WAYNE J. CRANS,2 MOTOYOSHI MOGI,3 ... RICHARD L. BERRY,7 BENEDICT PAGAC,8 MICHAEL R. SARDELIS,9.
RAPID COMMUNICATION
Aedes (Finlaya) japonicus (Diptera: Culicidae), a Newly Recognized Mosquito in the United States: Analyses of Genetic Variation in the United States and Putative Source Populations DINA M. FONSECA, SCOTT CAMPBELL,1 WAYNE J. CRANS,2 MOTOYOSHI MOGI,3 ICHIRO MIYAGI,4 TAKAKO TOMA,4 MARK BULLIANS,5 THEODORE G. ANDREADIS,6 RICHARD L. BERRY,7 BENEDICT PAGAC,8 MICHAEL R. SARDELIS,9 AND RICHARD C. WILKERSON Department of Entomology, Division of Communicable Diseases and Immunology, Walter Reed Army Institute of Research, 503 Robert Grant Avenue, Silver Spring, MD 20910 Ð7500
J. Med. Entomol. 38(2): 135Ð146 (2001)
ABSTRACT Introduction of potential disease vectors into a new geographic area poses health risks to local human, livestock, and wildlife populations. It is therefore important to gain understanding of the dynamics of these invasions, in particular its sources, modes of spread after the introduction, and vectorial potential. We studied the population genetics of Aedes (Finlaya) japonicus japonicus (Theobald), an Asian mosquito that was recognized for the Þrst time in the United States in 1998. We examined patterns of genetic diversity using random ampliÞed polymorphic DNA and sequences of ND4 of mtDNA by comparing samples from populations spanning the range of this mosquito in Japan (six samples) and the United States (nine samples) as well as specimens intercepted in New Zealand in 1999. We found geographically differentiated populations in Japan, indicating limited gene ßow even on small spatial scales. In the United States, we found evidence of signiÞcant genetic differentiation between samples from New York, Connecticut, and New Jersey and those from mid-Pennsylvania and Maryland. We were unable to pinpoint the source location(s) in Japan, although some of the U.S. samples are genetically close to samples from south Honshu and western Kyushu. Further studies should include samples from Korean populations. Distinct genetic signatures in U.S. populations undergoing expansion suggest the possibility of local increases in genetic diversity if and where they meet. KEY WORDS Aedes japonicus japonicus, introduced disease vectors, population genetics, sources and genetic diversity
INVADING NONINDIGENOUS SPECIES cause public health problems and major environmental damage; and as trade and travel increase the number of unwanted introductions is expected to rise (OTA 1993). From a medical perspective, some of the most worrisome introductions are mosquitoes or other potential disease 1
Suffolk Vector Control, 335 Yaphank Avenue, Yaphank, NY 11980. Department of Entomology, Rutgers University, 180 Jones Avenue, New Brunswick, NJ 08901Ð 8536. 3 Division of Parasitology, Department of Microbiology, Saga Medical School, Nabeshima 5-1-1, Saga 849 Ð 8501, Japan. 4 Laboratory of Medical Zoology, School of Health Sciences, Faculty of Medicine, University of the Ryukyus, 207 Uehara, Nishiharacho, Okinawa 903Ð 0215, Japan. 5 AgriQuality New Zealand, Plant Protection Centre, PO Box 41, Auckland, New Zealand. 6 The Connecticut Agricultural Experiment Station, P.O. Box 1106, 123 Huntington Street, New Haven, CT 06504. 7 Ohio Department of Health, 900 Freeway Drive North, Columbus, OH 43229. 8 Army Center for Health Promotion and Preventive MedicineNorth, Entomological Sciences Division, Building 4411, Fort Meade, MD 20755Ð5225. 9 Virology Division, U.S. Army Medical Research Institute of Infectious Diseases, 1425 Porter Street, Fort Detrick, MD 21702Ð5011. 2
vectors. The impact of diseases on formerly naõ¨ve human and wildlife populations due to introduced mosquitoes is well-documented (Morgan 1981, Bryan 1999). Furthermore, newly established associations between vectors and local parasites may result in deadly combinations (Cheng et al. 1999). There is, therefore, the potential for major disease epidemics fueled by newly established associations of parasites, hosts, and vectors. To develop the tools to prevent and control such epidemics there is a need to understand invasion dynamics. That is, what happens to a population shortly after it has become isolated from other populations of the same species in an unfamiliar and possibly ecologically distinct area. In February 1999, EL Peyton identiÞed four mosquitoes collected in Suffolk County, NY, and Ocean County, NJ, in late summer of 1998, as Aedes (Finlaya) japonicus japonicus (Theobald), establishing a Þrst record for the species in the United States (Peyton et al. 1999). Subsequently, Munstermann and Andreadis (1999) reported Ae. j. japonicus in Connecticut collected in July 1998. In the spring and summer of 1999, large numbers of larvae or adults of Ae. j. japonicus
136
JOURNAL OF MEDICAL ENTOMOLOGY
were collected in New Jersey, New York, and Connecticut, and a few eggs and larvae were collected in Pennsylvania and Ohio. In June of 2000, Ae. japonicus was also found in Frederick, MD (M.R.S., unpublished data). Aedes j. japonicus is considered one of four morphologically similar subspecies that occur throughout most of Japan, Taiwan, Korea, eastern China, and Russia (Tanaka et al. 1979). Ae. j. japonicus is relatively common in Palearctic Japan (Hokkaido, Honshu, Shikoku, Kyushu, Yakushima, and Tsushima) and Korea (Peninsula and Cheju Do). Ae. j. japonicus is known to feed on chickens and mice (Miyagi 1972) and although it is usually found in forested areas it will readily bite if humans encroach on its habitat (Knight 1969). Ae. j. japonicus breeds in a variety of natural and artiÞcial containers very much like the better-known Ae. (Stegomyia) albopictus (Skuse). This has lead to the suspicion that Ae. j. japonicus, like the above-mentioned species, was introduced into the United States by the used tire trade (Peyton et al. 1999). Unlike Ae. aegypti and to some degree Ae. albopictus, which are found predominantly in warm climates, Ae. j. japonicus is a species adapted to colder conditions and capable of surviving snowy winters (Tanaka et al. 1979). Although Ae. j. japonicus is not considered an important disease vector in Japan and Korea, laboratory experiments have shown that it is capable of transmitting Japanese encephalitis to mice (Takashima and Rosen 1989). Because of differences between habitats, changes in predators, and possible alterations in the genetic makeup of the populations as a result of the introduction, the potential for Ae. j. japonicus becoming a major pest and disease vector in the northeastern forested suburbs or even urban areas should not be underestimated. Recent studies have demonstrated that Ae. j. japonicus is a good laboratory vector of West Nile virus (M. J. Turell, U.S. Army Medical Research Institute of Infectious Diseases, Fort Detrick, MD, personal communication), an encephalitis recognized for the Þrst time in the United States in 1999 and responsible for several deaths in New York City (Sampson et al. 2000). Indeed, pools of Þeld-collected Ae. j. japonicus have been found positive for West Nile virus in New York (http://www. health.state.ny.us/nysdoh/westnile/index.htm). Our objectives were to infer the type of introduction (unique or multiple) and the geographical origin of such introduction(s). Information such as this will aid in the development of effective means of controlling further introductions. We also aimed to examine patterns of genetic diversity among the currently known U.S. populations so we can begin to develop predictive models of the expansion of this, and possibly other, nonindigenous species. Ultimately, our objectives are to predict patterns of spread of nonindigenous species and their potential roles in the occurrence and spread of emerging diseases.
Vol. 38, no. 2 Materials and Methods
Included in this study are specimens of Ae. j. japonicus from all U.S. populations sampled in 1999 and a population sampled in 2000 in Frederick, MD (Table 1). We also include samples from populations spanning the full range of the distribution of Ae. j. japonicus in Japan (Table 1), as well as Ae. j. japonicus found in a bucket of water on a cargo ship docked in Auckland, New Zealand. This species has been intercepted several times in New Zealand (Laird et al. 1994) but is not established there. Finally, as an out-group we used specimens of Ae. j. yaeyamensis from the Iriomote Islands (Table 1). This subspecies only occurs in the Yaeyama Retto˜ in the Ryukyu Archipelago. Recent work on the Ae. japonicus species complex shows that of the three other subspecies Ae. j. yaeyamensis is the closest genetically to Ae. j. japonicus but has a unique genetic signature (D.M.F., unpublished data), making it suitable as an out-group. We deposited voucher specimens in the National Museum of Natural History, Smithsonian Institution (accession #1701, 1703Ð1705, 1708 Ð1709). Because all populations of an introduced species may be recently derived from the same genetic stock, to detect unique genetic signatures among populations it is necessary to use genetic markers that have either very high rates of mutation or were highly polymorphic in the original population. Therefore, as a Þrst step we chose to examine the genetic diversity of Ae. j. japonicus using random ampliÞed polymorphic DNA (RAPD). This method is relatively easy and fast to implement (Kambhampati et al. 1992), and it allows the simultaneous probing of the entire genome. RAPD bands can be highly polymorphic because the technique screens coding and noncoding areas of the genome (Williams et al. 1990), the latter of which may include middle or highly repetitive DNA sequences with high mutation rates (Williams et al. 1990, Kazan et al. 1993). Unfortunately, analysis of RAPD frequency distributions may also underestimate genetic distances and predicted rates of gene ßow between populations if mutations frequently result in the independent loss or gain of RAPD bands in different populations (Gorrochotegui-Escalante et al. 2000). This problem should, however, be less important when examining recently established populations like those resulting from an introduction. As a second class of marker, we sequenced 424 bp of ND4, a mitochondrial gene (NADH dehydrogenase subunit 4). mtDNA is maternally inherited (Avise 1994) and mtDNA variants segregate rapidly between generations leading to relatively high rates of polymorphism (Howell et al. 1996, Jenuth et al. 1996). From the sequence data one can recover both rates of gene ßow and phylogenetic relationships between populations. For these reasons, mtDNA has been used extensively in population genetic studies (e.g., Conn et al. 1993, Besansky et al. 1997, Fonseca et al. 2000). In particular the ND5 and ND4 mtDNA loci have been shown to be highly polymorphic in both Anopheles and
March 2001
FONSECA ET AL.: POPULATION GENETICS OF Ae. japonicus japonicus
137
Table 1. Aedes japonicus samples, list of locations with latitude and longitude, date and life stage at which specimens were collected, and sample sizes for RAPD and ND4-mtDNA analyses
1 2 3 4 4 4 4 4 5 6 7 8 9 10 11 12 13 14 15 16 17
Country
Location
Latitude/Longitude
Date
Stagea
NR
NN
USA USA USA USA USA USA USA USA USA USA USA USA USA Japan Japan Japan Japan Japan Japan NZ Japan
Southold, NY Shelter Island, NY Manorville, NY Essex, CT Kent, CT Portland, CT Roxbury, CT Stamford, CT New Egypt, NJ Vernon, NJ Chambersburg, PA Frederick, MD Oak Hill, OH Nagasaki, Kyushu Saga, Kyushu Hiroshima, Honshu Tokyo, Honshu Sapporo, Hokkaido Chitose, Hokkaido Auckland Iriomote Island
41⬚03⬘N, 72⬚24⬘W 41⬚06⬘N, 72⬚32⬘W 40⬚86⬘N, 72⬚79⬘W 41⬚35⬘N, 72⬚41⬘W 41⬚73⬘N, 73⬚45⬘W 41⬚58⬘N, 72⬚62⬘W 41⬚55⬘N, 73⬚30⬘W 41⬚09⬘N, 73⬚55⬘W 40⬚04⬘N, 74⬚26⬘W 41⬚24⬘N, 74⬚49⬘W 39⬚93⬘N, 77⬚66⬘W 39⬚23⬘N, 77⬚23⬘W 38⬚90⬘N, 82⬚57⬘W 32⬚48⬘N, 129⬚55⬘E 33⬚15⬘N, 130⬚18⬘E 42⬚59⬘N, 141⬚34⬘E 35⬚42⬘N, 139⬚46⬘E 43⬚03⬘N, 141⬚21⬘E 42⬚49⬘N, 141⬚39⬘E 36⬚52⬘S, 174⬚46⬘E 24⬚20⬘N, 123⬚50⬘E
6/22Ð7/30/99 8/03/99b 8/02/99 6/21/99 5/19/00 6/24/99 8/09/99 7/19/99 6/08/99 7/02/99 6/14/99 6/15/00 8/23Ð9/05/99 7/6/99 9/29/98 11/4/99 Sept. 98 8/26/99 6/20/99 2/8/98 and 3/15/99 June 99
Larvae Larvae Larvae Larvae Pupae Larvae Larvae Adults Larvae Larvae Eggs Larvae Eggs Larvae Larvae Larvae & Adults Adults Larvaec Adults Larvae Adults Total
5 5 5 Ñ 4 Ñ Ñ Ñ 5 5 5 5 4 4 4 4 4 4 Ñ Ñ 2 65
5 5 5 3 4 1 1 1 5 5 6 4 4 5 5 5 5 5 4 4 Ñ 82
Numbers in the leftmost column correspond to those in the pie charts in Fig. 4. NR and NN are the numbers of individuals from each population used for the RAPD and ND4 analysis, respectively. Ñ, Specimens not included in the analyses. a All specimens were examined as adults except when noted. b Month/day/year. c DNA extracted from larval stages.
Aedes species (Lehmann et al. 1997, De Merida et al. 1999, Gorrochotegui-Escalante et al. 2000). Because we only had four to six individuals from Ohio, Pennsylvania, Maryland, and New Zealand, we chose to examine a minimum of four and a maximum of six specimens from all locations and we favored analyses that treat specimens individually. Once we established the degree of similarity between individuals we combined specimens from several locations to achieve sample sizes large enough to support population level analyses (Nei 1978). When we had large samples (New York, New Jersey, Connecticut, and Japanese locations), we chose specimens from as many different sources and collecting trips within a location as possible (e.g., different dates, water cavities, or pools of mosquitoes). The specimens collected in Chitose, a city in Hokkaido, Japan, and those intercepted in Auckland, New Zealand, did not amplify well with the RAPD primers possibly because of DNA degradation during transport to the United States. Specimens from several locations in Connecticut where improperly preserved and had developed fungi. For that reason we excluded them from the RAPD analysis. Since we were able to amplify ND4 successfully from many of these specimens, however, they were included in the ND4 analysis. Because there were only one to three specimens from Essex, Portland, Roxbury, or Stamford we combined them with the four specimens from Kent to form a “Connecticut” sample (Table 1). RAPD Loci. We extracted DNA from individual specimens using a phenol/chloroform method (Fonseca et al. 2000). We screened 30 decamer primers (A01Ð 07, 09, 10, 12Ð16, 20; B01Ð 05, 16 Ð18; C03, 04, 13,
18, 19; D11, 13, Operon Technologies, Alameda, CA), and used nine in the analyses. Procedures followed very closely those described in Wilkerson et al. (1995) except that we used a PE Biosystems 9700 thermocycler (PE Biosystems, Foster City, CA) and we ran the gels for 5 h. The polymerase chain reaction (PCR) parameters were 5-min denaturation at 94⬚C followed by 45 cycles of 1 min at 94⬚C, 1 min at 35⬚C, and 2 min at 72⬚C. Minimum ramp times were used at all stages except between 35 and 72⬚C, where we delayed the ramp by 25% to achieve a rate of 4⬚C/s. Molecular weight standards to size the RAPD bands were mostly provided by phiX174 DNA digested with HaeIII (Sigma, St. Louis, MO). In the few instances in which the RAPD bands were larger than 1,350 bp (primers A20 and C13), we used a 3:1 mix of phiX174Hae III and lambda DNA digested with HindIII (Sigma). The molecular weight of each RAPD band was estimated by comparison with the co-migrating size standards using a least-squares polynomial regression analysis. For each primer a minimum of 15 randomly chosen samples were rerun at least once, in some cases two to three times. Only bands shown to be reproducible, and in the intermediate molecular weight range, were scored. Because the preservation of specimens differed somewhat across samples, the choice of primers was based on their ability to consistently produce bands of equivalent size range and intensity across all the samples examined. Although this may result in an underestimate of differences between samples, we felt the known sensitivity of the RAPD method to DNA quality (Koch et al. 1998) made such a concession necessary. We also examined specimens carefully under a dissecting microscope before DNA extraction
138
JOURNAL OF MEDICAL ENTOMOLOGY
and discarded the entire sample for RAPD analysis if any specimens had fungi or signs of possible contamination with other sources of DNA. The RAPD bands were analyzed as genetic markers assuming that recessive “band absent” alleles are identical among and within individuals, and dominant “band present” alleles are identical among and within individuals (Gorrochotegui-Escalante et al. 2000). When performing exact tests we also assumed that RAPD bands of different sizes result from independent mutations. The analyses were performed either by considering specimens individually or by combining them into groups. For the analysis of individuals the binary data matrix was converted to a similarity matrix using Nei and Li (1985) similarity index and then to a distance matrix (D ⫽ 1-S), in RAPDPLOT. The statistical package RAPDPLOT was developed by William C. Black and is available by anonymous ftp (ftp://lamar.colostate.edu/pub/wcb4/). Specimens were combined into groups based on the individual analysis. We used TFPGA version 1.3 (Miller 1997) to calculate NeiÕs (1978) unbiased heterozygosity and the percent of polymorphic RAPD loci in each sample. We also used TFPGA to calculate exact tests of population differentiation (Raymond and Rousset 1995). RAPDDIST in RAPDPLOT was used to compute pairwise distances between samples. We analyzed the data using all the genetic distance measures available in RAPDDIST with the correction Lynch and Milligan (1994) proposed for dominant markers like those derived from RAPD analyses. As a graphic representation of the relationships among specimens and samples, dendrograms were constructed by unweighted pair group method with arithmetic averaging (unweighted pair-group method with arithmetic average, UPGMA Swofford et al. 1996) using the NEIGHBOR and CONSENSUS programs from PHYLIP version 3.57c (Felsenstein 1995). To evaluate the relative strength of the tree nodes we analyzed 1,000 bootstrap replicate matrices generated with RAPDPLOT. Trees were visualized with TreeViewPPC (Page 1996). We tested for the possibility of isolation by distance (Slatkin 1993) by comparing distance matrices with a matrix of geographic distances between locations in Japan and the United States with a Mantel test (Mantel and Valand 1970) in Arlequin version 2000 (10,000 permutations, Schneider et al. 2000). ND4 Sequencing. Based on the universal primers reported by Simon et al. (1994) and the complete mitochondrial sequence for Anopheles gambiae (Beard et al. 1993) and An. quadrimaculatus (Mitchell et al. 1993) we designed two new primers: N4J-8502D 5⬘-CGTAGGAGGAGCAGCTATATT-3⬘ and N4N-8944D 5⬘-AAGGCTCATGTTGAAGCTCC-3⬘. These primers amplify a 424-bp fragment between positions 8398 and 8821 in the An. gambiae sequence (GenBank accession #L20934). For the ampliÞcation we used 5 ng of genomic DNA in a 50-l reaction. The Þnal concentrations of the PCR reagents were as follows: 1 ⫻ PCR Buffer, 300 nM of each primer, 250 M of each dNTP, 2 mM MgCl2, and 1.5 U of Taq Gold polymerase (PE Biosystems). The PCR ampliÞcation was preceded by
Vol. 38, no. 2
a 10-min denaturation at 96⬚C. The ampliÞcation consisted of 35 cycles of 40 s at 94⬚C, 40 s at 55⬚C, and 60 s at 72⬚C, and ended with a Þnal extension step of 7 min at 72⬚C. Some individuals that did not amplify under these conditions were subsequently ampliÞed by lowering the annealing temperature to 53⬚C. After cleaning the PCR products with QiaQuick columns (Qiagen, Valencia, CA), cycle sequencing was done in both directions using the PCR primers and ABI Prism BigDye Terminators (PE Biosystems). We used one-half of the 1:4 dilution conditions described in PE Biosystems Application Note #107PAB01Ð 01 in a total volume of 10 l. Sequences were visualized and scored on a 373 PE Biosystems Automatic Sequencer (PE Biosystems). Alignment and assembly of sequences were performed with Sequencher 3.0 (Gene Codes, Ann Harbor, MI). Arlequin version 2.000 (Schneider et al. 2000) was used to calculate haplotype frequencies, gene diversity (H) and its sampling variance, and mean number and variance of pairwise differences between haplotypes in each sample (). H is equivalent to the expected heterozygosity for diploid data (Nei 1987) and is deÞned as the probability that two randomly chosen haplotypes are different in a sample. The total variance of is an estimate over the stochastic and the sampling processes (Tajima 1983). After these initial analyses by sample, we combined the specimens into groups based on putative haplotype discontinuities and used Arlequin to estimate pairwise FST values from haplotype frequencies and perform exact tests of population differentiation. Because of the large number of tests performed we used a sequential Bonferroni correction to adjust the ␣ value for each test (Rice 1989). Basic statistical tests were performed with JMP version 3.1.6 (SAS Institute 1995). Results RAPD Analyses. The nine primers used are A01Ð 03, A20, B17, B18, C13, C18, and D11 and together they yielded a total of 112 RAPD bands (93 bands in analyses that did not require an out-group) after we removed from the analyses those bands that occurred in only one individual. Only three bands were larger than 1,350 bp (from primers A20 and C13) and only two were smaller than 310 bp (both from D11, found exclusively in the Pennsylvania and Maryland samples). The presence/absence matrix is available (http:// wrbu.si.edu/wrbu.html). The trees that resulted from the UPGMA analysis did not vary with the type of genetic distance being used although occasionally a bootstrap value changed from ⬍50% to ⬎50%, depending on the analysis. In these cases we report the lower value. There were consistently only three RAPD bands in common between Ae. j. japonicus and Ae. j. yaeyamensis, which underlines the genetic distinctness of the latter subspecies and its usefulness as an out-group in these analyses. Analysis of the Þve Japanese samples revealed signiÞcant differences between locations. All specimens
March 2001
FONSECA ET AL.: POPULATION GENETICS OF Ae. japonicus japonicus
139
Fig. 1. Dendrogram based on RAPD loci constructed by UPGMA showing the relationships among Japanese specimens of Ae. j. japonicus. Specimens are given the name of the location where they were collected. Outgroup is the subspecies Ae. j. yaeyamensis. Numbers near nodes in the tree are percent bootstrap support for the node based on 1000 permutations. Only bootstrap values higher than 50% are shown. Scale is distance (D) based on Nei and LiÕs similarity index, S (D ⫽ 1-S).
from Sapporo, Tokyo, Nagasaki, and most of those from Saga and Hiroshima formed separate groups (Fig. 1). One specimen from Saga and one from Hiroshima, however, did not cluster within their respective locations (Fig. 1). Either considering Saga and Hiroshima as separate populations or not, pairwise measures of genetic distance are signiÞcantly correlated to geographic distance (r2 ⫽ 0.40, Mantel probability ⫽ 0.041 for NeiÕs (1978) unbiased genetic distance with Saga and Hiroshima as separate samples). In the United States, we found an association between the specimens collected in New York, Connecticut, and northern New Jersey (Vernon) locations (Fig. 2). The specimens from New Egypt, NJ, form a separate cluster, as do those from Oak Hill, OH, but Pennsylvania and Maryland samples cluster together (Fig. 2). Still, the degree of differentiation between locations is considerably less than that found in the analysis of the Japanese samples (Fig. 1) and we found no correlation between genetic distance and geographic distance (r2 ⫽ 0.02, Mantel probability ⫽ 0.32). ND4 Analysis. We sequenced this locus for 82 specimens of Ae. j. japonicus, including those used in the
RAPD analysis. We found 15 haplotypes that result from 15 transitions (Fig. 3, GenBank accession #AF305879). Five haplotypes were only found in Japan, one is unique to New Zealand, and six are unique to the United States (Fig. 3). Only one haplotype, H1, is common to the United States, Japan, and New Zealand. On average we found 2.3 ⫾ 0.3 (mean ⫾ 1 SE) ND4 haplotypes in each location in Japan and 2.2 ⫾ 0.2 in the United States analysis of variance (ANOVA; P ⫽ 0.78). Three haplotypes were found in the four specimens obtained in Auckland, New Zealand (Fig. 4). The gene diversity is not signiÞcantly different between Japanese and U.S. samples (0.61 ⫾ 0.10 in Japan and 0.47 ⫾ 0.85 in the United States, ANOVA, F ⫽ 0.99; df ⫽ 8, 5; P ⫽ 0.20) nor is the mean number of pairwise differences between haplotypes (1.53 ⫾ 0.36 in Japan and 1.38 ⫾ 0.29 in the U.S. samples, ANOVA, F ⫽ 0.11; df ⫽ 8, 5; P ⫽ 0.44). In Japan, the patterns of ND4 diversity mirror those found with RAPDs. Samples from Hokkaido, the northernmost island in Japan (Sapporo and Chitose), have unique haplotypes although the ubiquitous haplotype H1 was found in the Chitose sample. Likewise, Tokyo specimens have unique haplotypes, although
140
JOURNAL OF MEDICAL ENTOMOLOGY
Vol. 38, no. 2
Fig. 2. Dendrogram based on RAPD loci showing the relationships among Ae. j. japonicus specimens collected in the United States. Details are as in Fig. 1.
the presence of haplotype H3 indicates possible genetic exchange with the southwestern populations. In the United States, two patterns are evident. First, the Þve samples of populations clustered on and around Long Island (Shelter Island, Southold, Manorville, New Egypt, and Vernon, in New Jersey and the Þve locations in Connecticut) all appear to be successive samplings from the same gene pool. The highest genetic diversity occurs in Long Island, where Þve haplotypes can be found (Table 2). Second, Pennsylvania (PA) and Maryland (MD) have one unique haplotype, H9, which occurs with high frequency (Fig. 4) and a second haplotype, H12, also found nowhere else in the United States, although it occurs in one individual from Chitose in Northern Japan (Fig. 4). Ohio has one unique haplotype, H4, but the most common haplotype there is H1. If present, haplotypes H4, H9, and H12 must occur with frequencies lower than 0.1 in the New York, Connecticut, and New Jersey populations because, after sampling 35 individuals, they
have still not been detected (the probability of not sampling a haplotype if that haplotype is present ⫽ [1-frequency]N, where N is the number of specimens tested). Combined Analysis. Based on the analyses done separately for Japanese and U.S. samples, we combined specimens into eight groups (Table 2) and performed a population level analysis with all specimens and the out-group. The RAPD analysis shows a pattern of interspersion (Fig. 5). The NY/Vernon/CT group is more closely related to specimens from southwestern Japan (Hiroshima and Saga) than to other U.S. groups. SigniÞcant FST values and exact tests of population differentiation with the ND4 and RAPD data, respectively (Table 3), show differentiation between NY/Vernon/CT and Pennsylvania/Maryland as well as between NY/Vernon/CT and Hokkaido samples. At the mtDNA-ND4 locus, 68% of the pairs of samples analyzed were statistically different.
March 2001
FONSECA ET AL.: POPULATION GENETICS OF Ae. japonicus japonicus
141
Fig. 3. Mitochondrial (ND4) DNA haplotypes found in this study and their observed frequencies. Only variable loci are shown and the numbers above each represent its position along the 424-bp length of the ND4 gene sequenced. Haplotypes found in the United States (except for Pennsylvania and Maryland) are shown in black, those found in Japan are shown in white. Haplotypes from the Pennsylvania/Maryland samples are in gray and haplotypes from New Zealand are in light stippled.
Discussion In Japan, both RAPD and mtDNA analyses reveal differentiation among populations. We found unique RAPD banding patterns and mtDNA haplotypes in most locations and a systematic and signiÞcant decrease in genetic similarity with distance between locations, a signature of long-established populations isolated by distance (Rousset 1997). Because Ae. japonicus specimens have been able to arrive in the United States and were found in cargo ships in New Zealand, we were surprised by not Þnding extensive gene ßow between Japanese locations. Although movement across Japan might be precluded by its insular nature, there were signiÞcant differences even between locations in the same island (e.g., Hiroshima and Tokyo). The distribution of Ae. japonicus in Japan suggests therefore that this mosquito has a relatively short ßight range and is not commonly transported by humans. Still, the presence of the mtDNA haplotype H1 in the sample from Chitose in northern Japan could indicate that some human mediated gene ßow between Japanese locations is occurring. Based on a minimum spanning tree analysis (data not shown), however, H1 is putatively the haplotype from which 50% of the remaining haplotypes evolved. It is then possible that the high frequency of H1 across most populations reßects not contemporaneous gene ßow but an ancestral common source of all populations. That would also explain its abundance in the U.S. samples, although most of the remaining haplotypes are unique to either the U.S. or Japanese populations. It should be noted that the presence of haplotype H5 in the New Zealand sample, a haplotype only found in Hokkaido samples, does appear to indicate a northern Japanese source for those mosquitoes. Therefore,
some human-associated trafÞc of Ae. japonicus from Japan is occurring. In the United States, different RAPD patterns and mtDNA haplotypes, particularly between NY/NJ/CT and Pennsylvania/Maryland specimens, but also the uniqueness of RAPD patterns in New Egypt, NJ, and Oak Hill, OH, might suggest multiple introductions. Because the sample sizes in these analyses, the Þrst performed on this species, were constrained by the small number of specimens available, the power (Cohen 1988) of the analysis is relatively low. Nevertheless, it is undeniable that there are indications of at least two independent foci of expansion of Ae. j. japonicus in the USA, one located in the northeastern states of New York, Connecticut, and New Jersey, and the second in the main axis of Pennsylvania and Maryland. These two foci are signiÞcantly genetically differentiated as evidenced by the signiÞcant FST values and exact tests for population differentiation (Table 3). Although ND4-mtDNA haplotypes are very distinct between New York/New Jersey/Connecticut and Pennsylvania/Maryland, RAPD patterns between these two groups of samples do not appear as distinct as those found between locations in Japan. The RAPD patterns may therefore reßect a common source for all U.S. populations that, once isolated, will develop very different ND4-mtDNA haplotype frequencies. On the one hand, the fact that a single gravid mosquito may start a new population makes such a scenario feasible. On the other hand, the virtual absence of haplotypes H9 and H12 from the New York/New Jersey/Connecticut samples, makes the coincidence of two gravid mosquitoes (each female carries a single mtDNA haplotype), with very rare haplotypes founding the Pennsylvania/Maryland population, an unlikely scenario at
142
JOURNAL OF MEDICAL ENTOMOLOGY
Vol. 38, no. 2
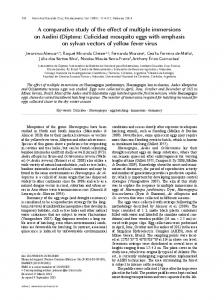
Fig. 4. MtDNA-ND4 haplotype distribution and geographic location of all populations sampled for this study. (a) U.S. locations. (b) Japanese locations. Numbers in the pie charts correspond to column one of Table 1. Each color represents a different haplotype (H1-H15, Fig. 3), and in each pie chart the area of a color corresponds to the proportion of the respective haplotype in that sample.
best. It remains possible, however, that both New York/New Jersey/Connecticut and Pennsylvania/ Maryland populations derived from an original introduction in which all U.S. ND4-mtDNA haplotypes were relatively common. Such a population would have an mtDNA genetic diversity similar to that encountered in some Japanese locations (e.g., Tokyo or Chitose) and it still might be present in the United States, undetected or at least untested. After a founder event like a new introduction, one might expect to Þnd reduced genetic diversity (Hartl
and Clark 1997). Instead, neither RAPD nor ND4mtDNA analyses show evidence of an overall reduced genetic diversity in the United States when compared with Japanese samples (Table 2). Although the samples from Pennsylvania and Maryland have a signiÞcantly lower ND4-mtDNA diversity than samples from southern Japan (ANOVA, F ⫽ 12.57; df ⫽ 9, 19; P ⫽ 0.02) this pattern is not mirrored in the RAPD band diversity. There are at least three possible explanations for the high genetic diversity found in U.S. populations of Ae. japonicus: (1) the species arrived in
March 2001 Table 2.
FONSECA ET AL.: POPULATION GENETICS OF Ae. japonicus japonicus
143
Measures of genetic variation in population level analyses using both RAPDs and mtDNA-ND4 RAPDs
ND4
Locations
n
H
%P
n
#h
H ⫾ V(H)
⫾ V()
Southold, NY Shelter Island, NY Manorville, NY Connecticut Vernon, NJ All Long Island locations, Vernon (NJ), Connecticuta Chambersburg, PA Frederick, MD Pennsylvania⫹Marylanda New Egypt, NJa Oak Hill, OHa All US locations Nagasakia Saga Hiroshima Saga⫹Hiroshimaa Tokyoa Sapporoa Chitosea All Japanese locations Auckland, NZ
5 5 5 4 5
0.12 0.13 0.12 0.11 0.11
33.3 34.4 32.1 29.0 26.9
5 5 5 10 5
2 2 3 3 3
0.60 ⫾ 0.18 0.40 ⫾ 0.24 0.70 ⫾ 0.22 0.51 ⫾ 0.16 0.70 ⫾ 0.22
1.20 ⫾ 1.07 1.20 ⫾ 2.40 2.20 ⫾ 3.07 0.91 ⫾ 1.00 1.20 ⫾ 1.07
24 5 5 10 5 4 43 4 4 4 8 4 4 Ñ 20 Ñ
0.15 0.13 0.11 0.14 0.09 0.11 0.17 0.10 0.14 0.13 0.15 0.16 0.12 Ñ 0.19 Ñ
55.9 34.4 30.1 43.0 22.6 25.8 75.3 24.7 37.6 33.3 51.6 37.6 30.1 Ñ 77.4 Ñ
30 6 4 10 5 4 49 5 5 5 10 5 5 4 29 4
5 2 2 2 1 2 8 2 2 3 4 3 1 3 8 3
0.73 ⫾ 0.05 0.33 ⫾ 0.22 0.50 ⫾ 0.27 0.36 ⫾ 0.16 0.00 ⫾ 0.00 0.50 ⫾ 0.27 0.83 ⫾ 0.03 0.60 ⫾ 0.18 0.70 ⫾ 0.22 0.70 ⫾ 0.22 0.73 ⫾ 0.10 0.80 ⫾ 0.16 0.00 ⫾ 0.00 0.83 ⫾ 0.22 0.84 ⫾ 0.04 0.83 ⫾ 0.22
1.55 ⫾ 1.42 1.67 ⫾ 5.95 2.50 ⫾ 7.50 1.78 ⫾ 5.86 0.00 ⫾ 0.00 1.50 ⫾ 2.70 2.41 ⫾ 2.55 2.40 ⫾ 4.27 2.00 ⫾ 4.00 0.80 ⫾ 0.40 1.56 ⫾ 2.89 2.80 ⫾ 2.40 0.00 ⫾ 0.00 1.17 ⫾ 0.57 2.13 ⫾ 2.71 1.67 ⫾ 1.47
n, sample size for each analysis; H, NeiÕs (1987) unbiased heterozygosity; %P, percent RAPD loci not Þxed; #h, number of haplotypes; H, gene diversity; V(H), sampling variance; , mean number of pairwise differences between haplotypes; V(), total variance in mean number of pairwise differences. a Samples were used to examine the similarity between US and Japanese populations (Fig. 5).
large numbers, (2) there were multiple introductions, and (3) Ae. japonicus has been in the United States for quite some time, undetected. Black et al. (1988), Kambhampati et al. (1990) and Urbanelli et al. (2000) argued that large introductions might explain why they failed to Þnd reduced genetic diversity in U.S. and
Italian populations of Ae. albopictus. The two most common scenarios for the arrival of mosquitoes are as adults in passenger planes or as desiccated eggs in tires or other similar containers in cargo ships. The number of mosquitoes that arrive on a plane is almost certainly small (Raymond et al. 1991, Qiao and Raymond 1995)
Fig. 5. UPGMA dendrogram based on RAPD loci using NeiÕs standard genetic distance showing putative relationships among groups of Ae. j. japonicus specimens from all the locations included in this study. Outgroup is Ae. j. yaeyamensis. Sample sizes (N) are shown in front of each group label. Bootstrap support is based on 1,000 permutations. Only bootstrap values higher than 50% are shown.
144 Table 3.
JOURNAL OF MEDICAL ENTOMOLOGY Pairwise FST values between populations and exact tests for population differentiation 1
1 2 3 4 5 6 7 8
Vol. 38, no. 2
0.545a 0.092 0.552a 0.199 0.278a 0.258a 0.179a
2
3
4
5
6
7
8
0.301
0.303 0.794
0.000a 0.140 0.834
0.636 0.984 1.000 0.924
0.375 0.992 1.000 0.201 1.000
0.038 0.753 1.000 0.603 1.000 1.000
0.000a 0.192 1.000 0.015 0.743 0.984 1.000
0.761a 0.756a 0.665a 0.667a 0.533 0.862a
0.389a ⫺0.013 ⫺0.094 0.027 0.433
0.498a 0.177a 0.452a 0.634a
0.161 0.156 0.470a
0.174a 0.419a
0.448a
Values below and above the midline are FST values from the mtDNA-ND4 analysis and P-values from exact tests for population differentiation from the RAPD data, respectively. 1, NY/Vernon/CT; 2, New Egypt; 3, Ohio; 4, PA/MD; 5, Nagasaki; 6, Saga⫹Hiroshima; 7, Tokyo; 8, Sapporo (RAPD) or Sapporo⫹Chitose (ND4). Sample sizes as in Table 2. a SigniÞcant value using sequential Bonferroni corrected ␣ values.
but may happen repeatedly, whereas eggs in tires could result in large populations if the tires get ßooded, although, the effective population size may be considerably smaller. Of notice is the fact that although the tire trade has been implicated in the introduction of many species of mosquitoes to many places (Craven et al. 1988, Reiter 1998), extensive examinations of tire transport into the United States did not reveal the presence of Ae. japonicus. Laird et al. (1994) found Ae. japonicus in only three out of 8,549 tires inspected that arrived in New Zealand between November 1992 and January 1993. Overall, therefore, Ae. japonicus might not be as common an occurrence in tires as Ae. albopictus. How Ae. japonicus is moving between locations within the United States is also not clear. Certainly the tire trade within the United States might be an important source of new foci. Another possibility is that mosquito movement is associated with the Standardbred horse trade. Suffolk County, NY, and New Egypt, NJ, where Ae. japonicus were Þrst collected, are breeding centers of Standardbred horses. The location in Vernon, NJ, where Ae. japonicus were collected in large numbers is also near a Standardbred farm. Adult Ae. japonicus may use Standardbread trailers as resting areas and be distributed between racing areas and farms. If rare, this form of distribution might decrease the vigor of the Ae. japonicus colonization of the United States and increase the effectiveness of control measures. Indeed, it does appear that Ae. japonicus is spreading more slowly than Ae. albopictus did. In 1987, “year two” after its detection in large numbers in Texas, Ae. albopictus was already known from 12 separate states (Moore et al. 1988). In contrast, by July 2000 the number of states with conÞrmed Ae. japonicus records has only increased from two to six. It should be noted, however, that the Þrst U.S. Ae. albopictus was actually caught in Tennessee in 1983. That introduction was traced to the used-tire trade but thought to be an isolated incident (Reiter and Darsie 1984). Furthermore, Ae. albopictus had been identiÞed in tires arriving in American ports as early as 1946 (Pratt et al. 1946, Eads 1972). It is then possible that by 1987, Ae. albopictus had already been multiplying in the United States for several years, undetected. We suspect that the extensive network of Vector Control Agencies and protocols established after the introduction of Ae. al-
bopictus to the continental United States (Moore 1986, Moore et al. 1988, Francy et al. 1990) allowed the identiÞcation of Ae. japonicus soon after its arrival. Still, the evidence of high levels of genetic diversity of U.S. Ae. japonicus populations suggests that better measures have to be implemented to control the importation of exotic species. We did not Þnd a perfect match in Japan for any of the U.S. samples. Excepting the putatively ancestral and very common ND4-mtDNA H1 haplotype and the presence of haplotype H12 in the sample from Chitose, which warrants a broader sampling effort in northern Japan, no other haplotype was found in common between U.S. and Japanese samples. Although the high diversity of mtDNA-ND4 haplotypes in Japan suggests we may simply have missed sampling the source populations, the RAPD band patterns correlate the NY/NJ/CT samples closest with southwestern Japanese locations, which we sampled repeatedly. Because these areas have extensive commercial contact with South Korea (D. Strickman, Walter Reed Army Institute of Research, Silver Spring, MD, personal communication), it is clear that we need to do a broader reconnaissance of the genetic diversity of this species, including analysis of Korean populations, to address the question of source and means of transportation. Our study shows at least two genetically independent foci of expansion of Ae. japonicus in the United States. It is unclear at this point if they originated from separate introductions or if populations have diverged since they have arrived. More extensive sampling and testing of U.S. populations will be needed to address this question. If several introductions are involved, their present location has placed distinct genotypes close enough that hybridization is now most probable. Hybridization might result in localized increases in genetic diversity and in the generation of new genetic combinations with unknown vectorial capacity. Although when compared with Ae. j. yaeyamensis, Ae. j. japonicus appears to be a single and distinct genetic unit, we have identiÞed discontinuities that may be correlated to variation in vectorial potential. Because we may have been able to examine the genetic diversity of Ae. japonicus early in its introduction history to the United States we may also be able to pinpoint populations to target for control. We will be pursuing
March 2001
FONSECA ET AL.: POPULATION GENETICS OF Ae. japonicus japonicus
our work on the genetics of this group both to understand its importance as a vector of human disease and as a model of mosquito invasion dynamics. Acknowledgments We express our gratitude to Dan Strickman who supported and encouraged this research from the very beginning. Thank you to William Black for providing us with unpublished information about putatively useful RAPD primers; Tom GafÞgan for his technical help with the RAPD gels; Yiau-Min Huang, Jim Pecor, and Maria Anice Sallum for discussions about Aedes in general and Ae. albopictus in particular; Scott Gordon for facilitating contact with our colleagues from Ohio; Jan Conn, Phil Lounibous, and Josephine Birungi for their expert comments on an earlier version of the manuscript. Our many thanks also to Yoshio Tsuda (Nagasaki University), Ikuo Takashima (Hokkaido University), Mutsuo Kobayashi (National Institute of Infectious Diseases, Tokyo), Bisyo Sakumoto (Otaru Quarantine OfÞce, Hokkaido, Japan), Robert Restifo (Ohio Department of Health), and Ken L. Malick (Dunham Army Health Clinic, Carlile, PA) for providing us with samples of Ae. japonicus populations. Sequencing facilities and expert advice were provided by the National Natural History MuseumÕs Laboratory of Molecular Systematics, Smithsonian Institution.
References Cited Avise, J. C. 1994. Molecular markers, natural history and evolution. Chapman & Hall, New York. Beard, C. B., D. M. Hamm, and F. H. Collins. 1993. The mitochondrial genome of the mosquito Anopheles gambiae: DNA sequence, genome organization, and comparisons with mitochondrial sequences of other insects. Insect Mol. Biol. 2: 103Ð124. Besansky, N. J., T. Lehmann, G. T. Fahey, D. Fontenille, L. E. Braack, W. A. Hawley, and F. H. Collins. 1997. Patterns of mitochondrial variation within and between African malaria vectors, Anopheles gambiae and An. arabiensis, suggest extensive gene ßow. Genetics 147: 1817Ð1828. Black IV, W. C., J. A. Ferrari, K. S. Rai, and D. Sprenger. 1988. Breeding structure of a colonising species: Aedes albopictus (Skuse) in the United States. Heredity 60(Pt 2): 173Ð181. Bryan, R. T. 1999. Alien species and emerging infectious diseases: past lessons and future implications, pp. 163Ð175. Invasive species and biodiversity management. Kluwer Academic, Dordrecht. Cheng, L. L., J. D. Rodas, K. T. Schultz, B. M. Christensen, T. M. Yuill, and B. A. Israel. 1999. Potential for evolution of California serogroup bunyaviruses by genome reassortment in Aedes albopictus. Am. J. Trop. Med. Hyg. 60: 430Ð438. Cohen, J. 1988. Statistical power analysis for the behavioral sciences. L. Erlbaum, Hillsdale, NJ. Conn, J., A. F. Cockburn, and S. E. Mitchell. 1993. Population differentiation of the malaria vector Anopheles aquasalis using mitochondrial DNA. J. Hered. 84: 248Ð253. Craven, R. B., D. A. Eliason, D. B. Francy, P. Reiter, E. G. Campos, W. L. Jakob, G. C. Smith, C. J. Bozzi, C. G. Moore, G. O. Maupin, and T. P. Monath. 1988. Importation of Aedes albopictus and other exotic mosquito species into the United States in used tires from Asia. J. Am. Mosq. Control. Assoc. 4: 138Ð142. De Merida, A. M., M. Palmieri, M. Yurrita, A. Molina, E. Molina, and W.C.T. Black. 1999. Mitochondrial DNA
145
variation among Anopheles albimanus populations. Am. J. Trop. Med. Hyg. 61: 230 Ð239. Eads, R. B. 1972. Recovery of Aedes albopictus from used tires shipped to United States ports. Mosq. News 32: 113Ð114. Felsenstein, J. 1995. PHYLIP (phylogeny inference package). University of Washington, Seattle. Fonseca, D. M., D. A. LaPointe, and R. C. Fleischer. 2000. Bottlenecks and multiple introductions: population genetics of the vector of avian malaria in Hawaii. Mol. Ecol. 9: 1803Ð1814. Francy, D. B., C. G. Moore, and D. A. Eliason. 1990. Past, present and future of Aedes albopictus in the United States. J. Am. Mosq. Control Assoc. 6: 127Ð132. Gorrochotegui-Escalante, N., M. L. Munoz, I. FernandezSalas, B. J. Beaty, and W. C. Black IV. 2000. Genetic isolation by distance among Aedes aegypti populations along the northeastern coast of Mexico. Am. J. Trop. Med. Hyg. 62: 200 Ð209. Hartl, D. L., and A. G. Clark. 1997. Principles of population genetics. Sinauer, Sunderland, MA. Howell, N., I. Kubacka, and D. A. Mackey. 1996. How rapidly does the human mitochondrial genome evolve? Am. J. Hum. Genet. 59: 501Ð509. Jenuth, J. P., A. C. Peterson, K. Fu, and E. A. Shoubridge. 1996. Random genetic drift in the female germline explains the rapid segregation of mammalian mitochondrial DNA. Nat. Genet. 14: 146 Ð151. Kambhampati, S., W. C. Black IV, and K. S. Rai. 1992. Random ampliÞed polymorphic DNA of mosquito species and populations (Diptera: Culicidae): techniques, statistical analysis, and applications. J. Med. Entomol. 29: 939 Ð 945. Kambhampati, S., W. C. Black IV, K. S. Rai, and D. Sprenger. 1990. Temporal variation in genetic structure of a colonizing species: Aedes albopictus in the United States. Heredity 64(Pt 2): 281Ð287. Kazan, K., J. M. Manners, and D. F. Cameron. 1993. Inheritance of random ampliÞed polymorphic DNA markers in an interspeciÞc cross in the genus Stylosanthes. Genome 35: 50 Ð56. Knight, K. L. 1969. Contributions to the mosquito fauna of Southeast AsiaÑIV: Species of the subgroup Chrysolineatus of group D, genus Aedes, subgenus Finlaya Theobald. Contrib. Am. Entomol. Inst. 2: 1Ð 45. Koch, D. A., G. A. Duncan, T. J. Parsons, K. P. Pruess, and T. O. Powers. 1998. Effects of preservation methods, parasites, and gut contents of black ßies (Diptera: Simuliidae) on polymerase chain reaction products. J. Med. Entomol. 35: 314 Ð318. Laird, M., L. Calder, R. C. Thornton, R. Syme, P. W. Holder, and M. Mogi. 1994. Japanese Aedes albopictus among four mosquito species reaching New Zealand in used tires. J. Am. Mosq. Control Assoc. 10: 14 Ð23. Lehmann, T., N. J. Besansky, W. A. Hawley, T. G. Fahey, L. Kamau, and F. H. Collins. 1997. Microgeographic structure of Anopheles gambiae in western Kenya based on mtDNA and microsatellite loci. Mol. Ecol. 6: 243Ð253. Lynch, M., and B. G. Milligan. 1994. Analysis of population genetic structure with RAPD markers. Mol. Ecol. 3: 91Ð99. Mantel, N., and R. S. Valand. 1970. A technique of nonparametric multivariate analysis. Biometrics 26: 547Ð558. Miller, M. P. 1997. Tools for population genetic analysis (TFPGA): a windows program for the analysis of allozyme and molecular population genetic data (http:// www.public.asu.edu/⬃mmille8/) distributed by the author. Mitchell, S. E., A. F. Cockburn, and J. A. Seawright. 1993. The mitochondrial genome of Anopheles quadrimaculatus
146
JOURNAL OF MEDICAL ENTOMOLOGY
species A: complete nucleotide sequence and gene organization. Genome 36: 1058 Ð1073. Miyagi, I. 1972. Feeding habits of some Japanese mosquitoes on cold-blooded animals in the laboratory. Trop. Med. 4: 203Ð217 (in Japanese with English abstract). Moore, C. G. 1986. The Centers for Disease ControlÕs perspective of the introduction of Aedes albopictus into the United States. J. Am. Mosq. Control Assoc. 2: 416 Ð 417. Moore, C. G., D. B. Francy, D. A. Eliason, and T. P. Monath. 1988. Aedes albopictus in the United States: rapid spread of a potential disease vector. J. Am. Mosq. Control Assoc. 4: 356 Ð361. Morgan, N. O. 1981. Potential impact of alien arthropod pests and vectors of animal diseases on the U.S. livestock industry, pp. 129 Ð135. In Handbook of pest management in agriculture. CRC, Boca Raton, FL. Munstermann, L. E., and T. G. Andreadis. 1999. Vect. Ecol. News 30: 7. Nei, M. 1978. Estimation of average heterozygosity and genetic distance from a small number of individuals. Genetics 89: 583Ð590. Nei, M. 1987. Molecular evolutionary genetics. Columbia University Press, New York. Nei, M., and W. H. Li. 1985. Mathematical model for studying genetic variation in terms of restriction endonucleases. Proc. Natl. Acad. Sci. USA 76: 5269 Ð5273. [OTA] Office of Technology Assessment. 1993. Harmful non-indigenous species in the United States. OfÞce of Technology Assessment, United States Congress, Washington, DC. Page, R.D.M. 1996. TREEVIEW: an application to display phylogenetic trees on personal computers. Comput. Appl. Biosci. 12: 357Ð358. Peyton, EL, S. R. Campbell, T. M. Candeletti, M. Romanowski, and W. J. Crans. 1999. Aedes (Finlaya) japonicus japonicus (Theobald), a new introduction into the United States. J. Am. Mosq. Control Assoc. 15: 238 Ð 241. Pratt, J. J., R. H. Heterick, J. B. Harrison, and L. Haber. 1946. Tires as factors in the transportation of mosquitoes by ships. Mil. Surg. 99: 785Ð788. Qiao, C. L., and M. Raymond. 1995. The same esterase B1 haplotype is ampliÞed in insecticide-resistant mosquitoes of the Culex pipiens complex from the Americas and China. Heredity 74(Pt 4): 339 Ð345. Raymond, M., A. Callaghan, P. Fort, and N. Pasteur. 1991. Worldwide migration of ampliÞed insecticide resistance genes in mosquitoes. Nature (Lond.) 350: 151Ð153. Raymond, M. L., and Rousset, F. 1995. An exact test of population differentiation. Evolution 49: 1280 Ð1283. Reiter, P. 1998. Aedes albopictus and the world trade in used tires, 1988 Ð1995: the shape of things to come? J. Am. Mosq. Control Assoc. 14: 83Ð94. Reiter, P., and R. F. Darsie. 1984. Aedes albopictus in Memphis, Tennessee (USA): an achievement of modern transportation. Mosq. News 44: 396 Ð399.
Vol. 38, no. 2
Rice, W. R. 1989. Analyzing tables of statistical tests. Evolution 43: 223Ð225. Rousset, F. 1997. Genetic differentiation and estimation of gene ßow from F-statistics under isolation by distance. Genetics 145: 1219 Ð1228. Sampson, B. A., C. Ambrosi, A. Charlot, K. Reiber, J. F. Veress, and V. Armbrustmacher. 2000. The pathology of human West Nile virus infection. Hum. Pathol. 31: 527Ð 531. SAS Institute. 1995. JMP userÕs manual, p. 3.1. SAS Institute, Cary, NC. Schneider, S., D. Roessli, and L. Excoffier. 2000. Arlequin, version 2.000: a software for population genetics data analysis. Genetics and Biometry Laboratory, University of Geneva, Geneva, Switzerland. Simon, C., F. Frati, A. Beckenbach, B. Crespi, H. Liu, and P. Flook. 1994. Evolution, weighting, and phylogenetic utility of mitochondrial gene sequences and a compilation of conserved polymerase chain reaction primers. Ann. Entomol. Soc. Am. 87: 651Ð701. Slatkin, M. 1993. Isolation by distance in equilibrium and non-equilibrium populations. Evolution 47: 264 Ð279. Swofford, D. L., G. J. Olsen, P. J. Waddell, and D. M. Hillis. 1996. Phylogenetic inference, pp. 407Ð514. In Molecular systematics. Sinauer, Sunderland, MA. Tajima, F. 1983. Evolutionary relationship of DNA sequences in Þnite populations. Genetics 105: 437Ð 460. Takashima, I., and L. Rosen. 1989. Horizontal and vertical transmission of Japanese encephalitis virus by Aedes japonicus (Diptera: Culicidae). J. Med. Entomol. 26: 454 Ð 458. Tanaka, K., K. Mizusawa, and E. S. Saugstad. 1979. A revision of the adult and larval mosquitoes of Japan (including the Ryukyu Archipelago and the Ogasawara islands) and Korea (Diptera: Culicidae). Contrib. Am. Entomol. Inst. 16: 1Ð987. Urbanelli, S., R. Bellini, M. Carrieri, P. Sallicandro, and G. Celli. 2000. Population structure of Aedes albopictus (Skuse): the mosquito which is colonizing Mediterranean countries. Heredity 84(Pt 3): 331Ð337. Wilkerson, R. C., T. J. Parsons, T. A. Klein, T. V. Gaffigan, E. Bergo, and J. Consolim. 1995. Diagnosis by random ampliÞed polymorphic DNA polymerase chain reaction of four cryptic species related to Anopheles (Nyssorhynchus) albitarsis (Diptera: Culicidae) from Paraguay, Argentina, and Brazil. J. Med. Entomol. 32: 697Ð704. Williams, J. G., A. R. Kubelik, K. J. Livak, J. A. Rafalski, and S. V. Tingey. 1990. DNA polymorphisms ampliÞed by arbitrary primers are useful as genetic markers. Nucleic Acids Res. 18: 6531Ð 6535.
Received for publication 30 July 2000; accepted 23 October 2000.