Report No: ACS14621 .
Africa Socioeconomic Impact of Mining on Local Communities in Africa
. June 25, 2015
. AFRCE AFRICA .
Document of the World Bank
. . Standard Disclaimer:
. This volume is a product of the staff of the International Bank for Reconstruction and Development/ The World Bank. The findings, interpretations, and conclusions expressed in this paper do not necessarily reflect the views of the Executive Directors of The World Bank or the governments they represent. The World Bank does not guarantee the accuracy of the data included in this work. The boundaries, colors, denominations, and other information shown on any map in this work do not imply any judgment on the part of The World Bank concerning the legal status of any territory or the endorsement or acceptance of such boundaries.
. Copyright Statement:
. The material in this publication is copyrighted. Copying and/or transmitting portions or all of this work without permission may be a violation of applicable law. The International Bank for Reconstruction and Development/ The World Bank encourages dissemination of its work and will normally grant permission to reproduce portions of the work promptly. For permission to photocopy or reprint any part of this work, please send a request with complete information to the Copyright Clearance Center, Inc., 222 Rosewood Drive, Danvers, MA 01923, USA, telephone 978-750-8400, fax 978-750-4470, http://www.copyright.com/. All other queries on rights and licenses, including subsidiary rights, should be addressed to the Office of the Publisher, The World Bank, 1818 H Street NW, Washington, DC 20433, USA, fax 202-522-2422, e-mail
[email protected].
SOCIOECONOMIC IMPACT OF MINING ON LOCAL COMMUNITIES IN AFRICA June 25, 2015
Contents Acknowledgements ..................................................................................................................... 1 Chapter 1: Overview .................................................................................................................... 2 1.1 Introduction ....................................................................................................................... 2 1.2 Analytical framework ........................................................................................................ 4 1.3 Case Studies ....................................................................................................................... 8 1.4 Empirical methodology.................................................................................................... 12 1.5 Results ............................................................................................................................. 15 1.6 Conclusion ....................................................................................................................... 27 References ............................................................................................................................. 30 Chapter 2 Local Impacts of Resource Abundance: What Have We Learned? ........................... 32 2.1 Theory and evidence on the impact of resource abundance at the country level ......... 33 2.2 Assessing the local impacts of resource abundance .......................................... 38 2.3 Conclusion ....................................................................................................................... 57 Annex .................................................................................................................................... 59 References .......................................................................................................................... 60 Chapter 3: Insights from Three Country Case Studies............................................................... 67 3.1. Introduction .................................................................................................................... 67 3.2. Country Background: Gold Mining in the three Countries ............................................. 68 3.3. Channel 1: Employment, Linkages, and Positive Spillovers............................................ 70 3.4. Channel 2: Government Revenue .................................................................................. 76 3.5. Negative externalities: The costs borne by mining areas............................................... 81 3.6. Outcomes ....................................................................................................................... 82 3.7. Conclusions ..................................................................................................................... 85 References ............................................................................................................................. 86 Chapter 4 Socioeconomic Effects of Large-Scale Gold Mining: Evidence from Ghana, Mali, and Tanzania..................................................................................................................................... 87 4.1 Introduction ..................................................................................................................... 87 4.2 Empirical Methodology ................................................................................................... 93 4.3 Results ............................................................................................................................. 99 Annex ................................................................................................................................... 134 References ........................................................................................................................... 143
Chapter 5 Does Large-Scale Gold Mining Reduce Agricultural Growth? Case studies from Burkina Faso, Ghana, Mali, and Tanzania................................................................................ 145 5.1 Introduction ................................................................................................................... 145 5.2 Remote sensing and economic activities ...................................................................... 146 5.3 Data ............................................................................................................................... 149 5.4 Growth Model and Results ............................................................................................ 152 5.5 Conclusions .................................................................................................................... 164 Annex ................................................................................................................................... 166 References ........................................................................................................................... 171
Acknowledgements This report was prepared by a core team led by Punam Chuhan-Pole, Andrew Dabalen, and Bryan Christopher Land and comprising Aly Sanoh, Gregory Smith, and Anja Tolonen. The principal authors and contributors to the various parts of the report include Fernando Arag´on, Magnus Andersson, Ola Hall, Andreas Kotsadam, Michael Lewin, and Niklas Olén. Additional contributions were made by Nazli Aktakke, Meltem A. Aran, Joseph R.A. Ayee, Massaoly Coulibaly, Armstrong Dumisa Dlamini, Godbertha Kinyondo, and Beyza Polat. Stuti Khemani and Jamele Rigolini provided careful and insightful peer review comments. Several World Bank Group staff, including Kathleen Beegle, William Maloney, and Sanjay Srivastava, provided comments at various stages of development of this report. The report was prepared under the general guidance of Francisco H. G. Ferreira., Chief Economist, Africa Region. Any errors or omissions are the responsibility of the team.
1
Chapter 1 Overview 1.1 Introduction For more than a decade, Africa has enjoyed a mineral boom1. This has fueled exports, government finances and hope for a sustainable growth trajectory (figure 1.1). During 2001-12 extractive industries (including oil) comprised three-quarters of exports—with metals and minerals alone accounting for 60 percent. This gain in export share, and by consequence government revenues, went to some (but not all) countries, which explains partly why resource-abundant countries have grown faster than non-resource rich countries.2 And although there has been a recent slowdown in exploration due to the weakness in the global economy, natural resource extraction, is expected to contribute significant shares of exports and public finance in all but five of the region’s countries in the years ahead (Devarajan and Fengler 2013). Figure 1.1: Mineral extraction has fueled exports and GDP growth
Number of mines opening
GDP growth by country groups (in percent)
Minerals and metals as share of exports SSA Merchandise Export (Median Values) Manufacturing Commodities (% of Merchandise Export) Primary Commodities (% of Merchandise Export) Fuel and Metals (*% Merchandise Export) Agricultural Commodties (% Merchandise export) Source: WITS, September, 2014
1990-00 2001-10 2011-13 22% 22% 14% 73% 74% 75% 48% 59% 64% 24% 15% 11%
In general, African countries do not collect sub-national economic data. Therefore, it is often difficult to assess how much of the growth that is reported is happening at the local The FDI inflow that is driving this boom has been dubbed “The Second Scramble for Africa,” after the first scramble, also attracted by natural resource, which preceded European colonialism. The recent sharp drop in commodity prices is believed to have reined in this boom, but the slowdown is expected to be temporary. 2 See Africa’s Pulse, Volume 8, World Bank, Washington, DC, October 2013. 1
2
level. In particular, is the growth mostly happening in isolated places, sectors and periods? We use geo-referenced data collected by satellite to estimate local economic activity, using nighttime lights and vegetation index as proxies for economic activities. Since these satellite data can be collected at very small geographic areas, we can aggregate them to any administrative level and measure progress. We find that local-level economic activity confirms the observed growth in aggregate economic output (figure 1.2). Figure 1.2: Local economic activity predicts aggregate economic trends
Although Africa’s resource boom has spurred growth, questions remain whether it has also improved living standards. The conversion of growth into poverty reduction is considered to be much lower in Africa than in the rest of the developing world (Christiaensen, Chuhan-Pole, and Sanoh 2014), and the low growth elasticity of poverty is attributed to natural-resource-led growth, a factor that underlies the disappointment that is often felt following a natural-resource-led boom. The disappointment is all too familiar at the national level, but increasingly there is a growing interest in understanding whether local mining communities benefit from the resource boom and, if they do not, what the possible reasons are that might explain it. The focus on local impacts of this study is motivated by the observation that, in general, the socioeconomic effects of large-scale mining are not well understood. In fact, to the extent that there is a public opinion on impacts of gold mining on local communities, it is likely to be unfavorable. This is partly because, despite contributing substantially to 3
countries’ gross domestic product (GDP) and export revenue, the total employment numbers generated country-wide by mines are generally modest. For instance, in Mali, large-scale mining activity accounted for about 7 percent of GDP in 2013, but less than 1 percent of the population was employed by the industry (Sanoh and Coulibaly 2015). Adding to the negative perception of the sector is the concern that the industry also brings with it negative environmental and health impacts, which the community feels is not adequately compensated. Furthermore, mining and oil companies want government concessions and often require government cooperation. They will, therefore, have a tendency to exaggerate (or hype) the local and national benefits. To navigate divergent, and sometimes motivated thinking, this study develops a simple framework to evaluate the welfare impacts of large-scale gold mining on local communities in three African countries—Ghana, Mali, and Tanzania. The approach adopted in this study is two-pronged. First, through case studies, including the results of fieldwork, mining’s impacts are examined in a country-specific context for each of three countries, Ghana, Mali, and Tanzania; and second, a statistical analysis is used to test whether the indicators of welfare improve with proximity to a mine.
1.2 Analytical framework The avenues for extractive industries to impact local communities and regions are somewhat restricted in developing countries. In most of these countries, local residents and landowners do not have property rights to subsurface minerals. These are “owned” by the country and all its citizens, and the national government is the guardian of this wealth on their behalf. With this in mind, Chapter 2 of this report provides a framework for understanding how the benefits from the mineral sector are captured by local communities. Drawing on Aragón, Chuhan-Pole and land (2015), it delineates three broad channels through which the local areas and regions may be affected:
Income, employment, and linkages. Extractive industries employ local workers and purchase some goods and services locally and regionally. This should raise nominal wages and other incomes and increase non-mine employment opportunities and generally improve local welfare and reduce poverty. There could, however, also be some negative spillovers from this. Often, the start of an extractive industry, say, the opening of a mine, will attract workers from other districts. This could temper the rise in wages, put a strain on local services such as health and education, and raise the price of nontradable goods and services such as housing rents and, therefore, actually reduce the real incomes of some local residents. Figure 1.3 presents an analytical framework of market-based transmission channels and possible outcomes of a natural resource boom.
4
Government as the owner of the resources on behalf of the people, and collector of public revenues from resources, is the conduit of the benefits to the rest of the economy (via public spending). The benefits from a natural resource will depend to a large extent on whether the revenues received are put to good use. A fiscal revenue windfall eases the hard budget constraint of local governments, and supports higher public spending. If history is a guide, there is ample reason to be cautious. In particular, the areas where mines are located have no property rights to the minerals and may feel deprived of the benefits while bearing the bulk of the costs. In all three cases, the central government owns the resources and therefore the revenues. The fiscal arrangements between the central and local governments at various levels will therefore determine how much of the benefits from mining find their way back to the mining areas. Among the case studies, Mali had the highest degree of fiscal decentralization and, therefore, the local authorities received the largest proportion of the revenues compared to the other two. Ghana is in the middle of the three in this regard, but its decentralization efforts are relatively new, so it may be premature to evaluate them. Tanzania has a rather rigid centralized mechanism. All revenues are garnered by the central government. Transfers from the central budget fund 90 percent of local government. The funds are allocated according to criteria and priorities unrelated to the location of mines or the source of the funds. In so far as the windfall is used to improve the quantity or quality of local public goods and services, there would be the potential to improve human welfare, such as health and education outcomes. Moreover, to the extent that public goods are productive inputs, or create positive spillovers, as in the case of transport infrastructure, a resource boom could also increase local income and growth. The positive effect of revenue windfalls is underpinned by several assumptions: namely, local politicians are responsive to the broad population, which requires wellfunctioning local institutions and a healthy degree of political competition3; and local bureaucracies have the technical capacity to provide those public goods and services. Therefore, the general competence, honesty, and, overall implementation capacity of the local-level government will be key to enhancing welfare and development. Lacking these, may undermine the positive effect of revenue windfalls on public good provision and local living conditions.4 Hence, both nationally and locally, the quality of governance and the influence on it of resource revenues will be a key determinant of the welfare impacts of resource exploitation.
3
In the absence of good democratic checks and balances, the revenue windfall can fail to significantly improve public good provision (Caselli and Michaels, 2013) and lead instead to corruption and worsening of political selection (Brollo et al. 2013). Also see Besley and Burgess 2002. 4 The “rapacity” and “opportunity cost” effects discussed in the country-level literature on conflict, may also explain a failure of resource windfalls to be converted into welfare gains at the local level.
5
Figure 1.3 depicts some of the paths discussed in the literature through which a revenue windfall would impact local welfare.
Externalities. There may be positive spillovers from the extractive industry in addition to the wage and linkage effects noted above. These could include improvements to productivity through worker training and education, which often spread beyond the mine or oil field. Also, there may be improvement to public goods through investment in roads, bridges, ports, and similar facilities, which are required by the extractive industry. However, there are always some negative externalities, such as pollution, congestion, pressure on other scarce natural resources, and social dislocation. Environmental and health issues are a big concern (see box 1.1).
Figure 1.3: Channels through which natural resource abundance affects welfare at local level NATURAL RESOURCE ABUNDANCE
Fiscal channel
Market channel If strong enough backward linkages
Increase in local labor demand and nominal wages
Increase in fiscal revenue
If good local institutions
Increase in public spending
Improve public services and infrastructure
if weak local institutions
Attracting workers from other cities, increase in population
Increase in rent-seeking opportunities
Increase in corruption
Decrease in nominal wages; increase in housing costs; no significant effect on real wages
Increase in violent conflict
Congestion in public services (i.e. education)
Agglomeration economies
Increase living standard Increase in nontradables sectors output, ambiguous effect on tradables sectors output
6
Increase in productivity
Box 1.1 Environmental and health issues in gold mining areas Like many other industries, gold mining (both industrial and artisanal) is associated with environmental degradation and pollution which have severe health implications. The environmental degradation is manifest through effects on landscape and land use, spread of gold ore-related heavy metals such as arsenic and lead to nature, discharge of cyanide to nature, spread of mercury from artisanal mining, or air pollution. In Ghana, air pollution around industrial gold mine has been linked to increased cough incidence (Aragon and Rud, 2013a). Similarly, pollution from heavy metals contamination has been shown to have detrimental health impacts. For example, von der Goltz and Barnwal (2014) in their study of 800 mines in 44 developing countries found that lead and other heavy metal pollution are linked to a 3 to 10 percentage points increase in anemia incidence among women living in mining communities. In addition, children of the same communities experience a 5 percentage point increase in the incidence of stunting. In general, there are controversies surrounding studies linking environmental degradation around mines to health outcomes due to the possibility of omitted variable bias where exposure to these pollutions may be linked to individual lifestyles habits (Tolonen, 2014). In 2008, a Ghanaian environmental impact assessment of 61 major mines and several smaller-scale operations sites found that mining areas have higher concentration of arsenic particularly within the areas of old, large mines like Obuasi, Bibiani and Prestea. For example, in the influence area of Obuasi mine, the mean arsenic concentration over one year of sampling is 525 μg/l, which is more than 50 times the WHO guideline for drinking water. High concentration of cyanide is infrequent in Ghana because the great majority of companies stick to stringent procedures. Environmental and health issues for artisanal scale miners are concerned with the use of mercury to cheaply separate gold from other minerals. Mercury usage tends to always exceed the World Health Organization (WHO) limit for public exposure of 1.0 μg/m3. In southwest Ghana, artisanal and small-scale gold miners have a significantly higher burden of mercury than other residents who live or work in mining areas (Kwaansa-Ansah et al., 2014). In Tanzania, a review of several studies points to the existence of major health and safety risks for mining communities (World Bank, 2015). In the artisanal mining areas of Matundasi and Makongolosi, mean mercury level in hair samples among miners is 2.7times higher than the 4-5 μg/L reference limit of the U.S. EPA. Approximately two-thirds of the hair samples exceeded this reference limit. In addition, another study in Tanzania looked at mercury levels in breast milk of mothers living at ASGM sites and found that 22 of the 46 children from these mothers had a higher total mercury intake.
7
Local impact of gold mining The mineral sector in Sub-Saharan Africa is large and diverse. The aim of the research is to apply the above framework (from Chapter 2) to a single mineral. The choice of gold for this study was predicated on the following important factors:
Gold mining is now an important industry in several countries in Africa, and is behind only crude oil as a top export earner for the region. In 2013, four African countries—Ghana, Mali, South Africa, and Tanzania—were among the top 20 gold-producing countries in the world. Since the aim of the research is to assess the socioeconomic impact of the mining activity on local communities, it is relevant to select an activity that can have a potentially important local footprint. Gold mining is onshore, unlike oil drilling, which is often offshore, so it can be expected to have an impact on local populations.
Three countries were selected for study: Ghana, Mali, and Tanzania. Gold mining in each of the three countries has a number of common characteristics that make them suitable for this study. While industrial gold mining has a long history in Africa (especially for Ghana), there has been a sharp acceleration in gold production in the last two decades in each of these countries (figure 1.3), which makes a study of its impact timely. It also lends itself to the “before” and “after” type of analysis reported in Chapter 4.
1.3 Case Studies Every country is a special case As noted above, gold mining activity in the three case study countries has accelerated in recent years. Overall, these three countries are among the top gold-producing countries in the region, collectively accounting for about 35 percent of the region’s gold production in 2015. In addition, gold is a large component of export earnings in all three countries. Along with an increase in gold production, government revenue from gold has been on an upward trend (figure 1.4). Gold production is an important contributor to government revenue, particularly in Mali, and its share is rising in Ghana and Tanzania. However, these elements are national and do not directly impact local communities. A key channel for transmitting benefits to the local community is through direct employment by the mining companies and also the indirect effects through linkages with other sectors and increased expenditure due to higher wages (these are sometimes called multipliers). However, gold mining is capital-intensive and the country studies show that the linkages are likely to be quite small. Direct employment in gold mining in Tanzania, for example, was around 7,000 in 2013. The direct employment figures are likewise low for Ghana (about 17,100 in 2014) and Mali 8
(averaging about 3,635 during 2008–13). If the “multiplier” is 2 (and it is probably lower), then the total number of jobs supported by mines would be 14,000 in Tanzania, which is trivial in a workforce with 70,000 new entrants per year. So, other than the immediate vicinity of the gold mine, it is not likely to be a large employment generator.5
Figure 1.3 Trends in gold production (tons) in Ghana, Mali, and Tanzania 90 80 70 60 50 40 30 20 10
Ghana
Mali
2010
2008
2006
2004
2002
2000
1998
1996
1994
1992
1990
1988
1986
1984
1982
1980
0
Tanzania
Figure 1.4 Fiscal revenues from mining (US$ millions and as % of total revenue) 900 800 700 600 500 400 300 200 100
Mali
Ghana
2013
2012
2011
2010
2009
2008
2007
2006
2005
2004
2003
2002
2001
0
Tanzania
5
The absolute size of employment is also important. In South Africa, the mining linkages are thought to be minor, that is, they have low multipliers. But half a million workers are employed in gold mining, so any shock, positive or negative, will have a significant impact on income and employment in the country. In Tanzania, Ghana, and, perhaps, Mali, the absolute numbers are not (yet) that significant.
9
40% 35% 30% 25% 20% 15% 10% 5%
Mali
Ghana
2013
2012
2011
2010
2009
2008
2007
2006
2005
2004
2003
2002
2001
0%
Tanzania
The multiplier effects are limited partly because of the capital intensity of the industry, but mostly because of the lack of local cost-effective procurement opportunities. This could change over time as the companies become better acquainted with local markets and suppliers, and also as local entrepreneurs learn to take advantage of the relatively new developments. In Tanzania, efforts have been made to improve the potential for local procurement, including in services such as catering, vehicle repair, machine shop services, welding, metal work, electrical work, and plumbing (Smith and Kinyondo 2015). However, the proportions of inputs sourced locally remain low, a situation mirrored in Ghana and Mali. Being capital-intensive and in the absence of strong backward linkages, the key benefits from gold mining will lie in its contribution to exports and government revenues. The central government is the key local recipient of the rents. During 2005–13, gold mining provided the government with US$362 million per year on average in Mali, compared to US$300 million per year in Ghana and US$137 million per year in Tanzania. Therefore, much of the local benefit from the industry will depend on how much of this revenue finds its way back into the local community, and also on the quality of public sector expenditure. Thus, fiscal arrangements for transfers—specifically, redistribution of resource revenues— are important in understanding the local impact of mining activity. The fiscal arrangements differ in all three countries. Tanzania and Ghana tend to be more centralized, while Mali is more decentralized. However, in Ghana, the government has mandated that 10 percent of revenues (mining royalties) be returned to the local government in the areas of the mines. In Tanzania, all revenue accrues to the central government (with the exception of recent annual payments of US$200,000 per mine), and there is no link between government transfers to the local authorities and the revenues 10
raised from mining in those areas: Funds are allocated according to criteria and priorities unrelated to the location of mines or the source of the funds. In Mali, the fiscal system is decentralized, so fixed percentages (ranging from 60 percent to 15 percent on various taxes and licensing fees) are transferred back to the local area governments. There may be some payoff from this in Mali, since school enrollment rates in mining areas exceed those of nonmining areas.6 Positive externalities are also few and far between. Corporate social responsibility spending by mining companies has had limited impact, according to the data examined. The case studies show that while investment in schools and public health facilities has occurred, the results have been disappointing.7 The effect of mining on investment in local roads and bridges, while not zero, has not had a large impact in any of the countries. The mines tend to build infrastructure just sufficient for their needs, and the case studies show that these are rather limited. Negative externalities are always present in mining, including pollution, particularly from cyanide, and other environmental and social risks.8 Corporate responsibility and regulatory vigilance are important to ensure that these costs, borne entirely by local communities, are minimized.9 The case studies do not note any evidence of local Dutch disease symptoms, however. For example, in Tanzania, there was a slight increase in manufacturing employment in mining areas. While this shows only minor linkages from mining to manufacturing, the fact that manufacturing did not decline reveals an absence of Dutch disease affects. The country studies suggest that overall, the effects of mining are not likely to be harmful to the local areas (although pollution is always a danger that needs monitoring). Mining is also likely to be somewhat transformative in terms of the quality and quantity of employment in mining areas. However, these effects are quite limited. The key beneficiary of mining is the government, which therefore is the conduit of benefits to the country as a whole, and to the local communities as well. Transparency of governance and extractive industry revenue collection is therefore fundamental to guarding against the governance curse that so often accompanies resource-based economies. An important caveat is that the focus of the study is on large-scale “industrial” gold mining and not artisanal and small-scale gold mining that often takes place in proximity to large-scale mining. The data cannot be disaggregated to distinguish between these two 6
See Chapter 7. See Chapter 6. 8 A best practice international code for the use of cyanide in gold mining was established in 2002 following a tailing spill in Romania: http://en.wikipedia.org/wiki/International_Cyanide_Management_Code. 9 von der Goltz and Barnwal 2014 found that negative pollution impacts were likely to be disproportionately borne by households close to the mine implying that net benefits could vary significantly between the average household in a local community and the particular impacted households. 7
11
classes of mining, nevertheless, large-scale mining, in all but a few mining areas, accounts for a very high percentage of the volume and value of gold produced in such areas.
1.4 Empirical methodology Measuring local effects of mining: Proximity of mines The aim of the research is to assess whether local communities benefit from mining activity or not. The empirical approach builds on the earlier studies that used quasi-experimental events to estimate the impact of localized shocks on economic outcomes (Card and Krueger 1994). The identification strategy in these approaches is based on comparing outcomes in local units of observation (districts, municipalities, regions, and so forth) affected by a particular event or intervention to units where such events or interventions are absent. The empirical approach adopted treats industrial gold mining as a quasi-experiment similar to a clinical trial. The vicinity of the mine can be thought of as the “treatment area,” and areas outside of this as nontreatment areas. In addition, since the areas chosen represent relatively recent gold mine starts (or restarts), it is also possible to compare outcomes “before treatment”’ and “after treatment,” the “treatment,” of course, being the start or existence of a mine. The object of the exercise is to discern differences in the outcomes of those in mining and non-mining areas. Specifically, regression analysis is used to test whether indicators of welfare show improvement with proximity to a mine. This is done on different levels. First, the size of the treatment area—that is, the area in the vicinity of a mine—has to be determined. How large the mine’s influence extends is an empirical exercise. The analysis includes households within 100 kilometers (km) of a mine location, with the baseline treatment distance being 20 km from a mine (figure 1.5). In order to allow for nonlinear effects with distance, the analysis also employs a spatial lag model. The spatial lag model divides the area around a mine into small concentric distances (or bins), such as 0–10 km, 10–20 km, 20–30 km and so on, up to within 100 km of a mine.10 As argued earlier, mining can have additional impacts beyond the neighborhood of the mine if mining royalties and revenues are spent on populations living in districts where the mine is located. Injection of additional expenditures into the district could increase spending on welfare-enhancing services, such as schooling or health care. Thus, a second level of analysis is done with the treatment area as the district in which the mine is located. District refers to political or administrative units that have spending authority. For some of 10
In the regression specification, each distance bin can have its own coefficient. The model thus allows for nonlinear effects with distance. Moreover, it allows us to understand whether there are spillovers from large-scale gold mining farther away than the baseline treatment distance.
12
the selected countries, the district has authority to raise revenue and spend it. In some, it has no taxing authority but instead implements projects on behalf of the central government as part of devolved functions. Districts themselves are relatively arbitrary, and looking for impacts in only the districts that have a mine could miss the potential spillovers that result from mining. So spillover effects across districts are also considered, and the analysis compares outcomes in mining districts, neighboring districts, and non-mining districts. Thus, the study identifies both local- and district-level effects of large-scale gold mining in Ghana, Mali, and Tanzania. As with clinical trials, it is important to be able to choose a control group (in this case, the non-mining group) that is as similar as possible in all other characteristics to the control group (in this case, to the group in the mining area). Only then can the researcher reasonably attribute any statistical difference between the two groups to the “treatment,” in this case the mine. The control group is chosen by the characteristics of the individuals so as to maximize their similarity to those of the treatment group. The groups chosen in this way are called “synthetic.”11 The synthetic control group is one of the methods used in the study to define a comparison group. Figure 1.5 Gold mines in Mali and spatial buffers
11
The method of constructing the synthetic group is described in Chapter 3 and the references therein.
13
A difference-in-differences estimation strategy is used,12 which compares districts with and without gold mines (or groups based on their distance), before and after the mines started producing. The method allows for initial differences across districts. However, it makes a crucial assumption—called the parallel trends assumption—which is the idea that these initial differences will not affect estimates of outcomes that will be due to the presence of a mine, as long as the trends of the socioeconomic development in the districts were similar before the extraction from the mines began. Under this assumption, it can be deduced that the change that happened in mining districts at the same time as the mine opening is in fact a result of the mine (assuming that no other confounding changes happened at the same time). The regression shows the change in the chosen indicators as a function of proximity to a mine.
Mining and household data The analysis combines mine-specific information and a rich dataset collected from various sources (household surveys). Mine-level data on first year of production and production volumes are from the Raw Materials Database of IntierraRMG; mine location information (GPS coordinates) is obtained from online sources such as mine-atlas.com and google.maps, and IntierraRMG for Ghana. Data on households and/or individuals are from the following main sources: Demographic and Health Surveys (DHS), Household Budget Surveys (HBS), Living Standard Surveys (LSS), and Censuses of Population.13 Some of the surveys, especially the DHS and LSS, are geocoded. Since the mines are also georeferenced, it is easy to determine how far a household observed in such surveys is from the mine. The estimation strategy that uses individuals and households makes use of this information to identify the impacts of the mines. Table 1.1 shows the survey years that were used. Table 1.1 Household survey data DHS LSMS Census 1993, 1998, 2003, 2008 1999, 2004, 2012 1995, 2006, (2001) 1989, 2001, 2010 1987, 1998, 2009 1999, 2010, (2007, 2012) 1992, 2001 1988, 2002 Individual analysis Individual analysis Synthetic control analysis District analysis District analysis Note: Survey years in parentheses are used in some parts of the analysis.
Ghana Mali Tanzania used for
12 13
The methodology is described in Chapter 3 and the references therein. See Chapter 3 for details.
14
1.5 Results The purpose of the analysis, as noted above, is to test for improvement or deterioration in welfare in areas close to a mine. Four areas are considered as indicative of welfare:
Occupation indicators for both men and woman. Whether there is expansion of employment opportunities and increases in incomes.
Asset accumulation. If there is a discernable increase in family asset accumulation (for example, a radio, bicycle, car, or toilet) with proximity to a mine, then one could conclude that the mine, at least in this respect, is welfare enhancing.
Child health outcomes. Again, the analysis tries to determine whether there are improvements in key indicators of child health. The key indicators here are infant mortality, fever, cough persistence, and diarrhea in children under age 5.
Access to infrastructure. The key variables here are access to electricity and water, which is indicative of provision of services by local governments.
In short, the study takes a close look at the impacts of mines on individuals’ employment prospects and wages, asset accumulation, child health outcomes, and access to infrastructure when they live closer to a mine or in a mining district.
Occupation – Is local structural transformation occurring? Using the methods outlined above, the study analyzes how gold mining has changed the livelihoods of people (in mining areas) in Ghana, Mali, and Tanzania. The econometric results from the spatial lag model, which allows for nonlinear effects with distance, shows service sector employment for women is significantly higher close to active mines (figure 1.6). In fact, the effects are stronger 0 to 10 km from a mine than 10 to 20 km from a mine. In Mali, the probability that a woman works in services and sales increases by 30 percentage points, and in Ghana by 17 percentage points, in the very closest distance. For Ghana and Mali, agricultural participation drops close to mines, at roughly 20 to 10 percentage points, respectively. In Tanzania, there is no evidence of a clear change either in services and sales or in agricultural employment. For Ghana, where data are available on mining employment from the Ghana Living Standards Survey (GLSS) dataset, the results show that there is a 10-percentage-point increase in the likelihood that a man living close to a mine works in mining (figure 1.7). This contrasts with the findings for women, who are not benefiting (or benefiting very
15
little) from direct employment in mining.14 The GLSS data also show that men have (marginally) significantly higher wages. The DHS data for Ghana and Mali reveal that men are less likely to work in agriculture if they live within 10 km of a mine (statistically significant in Mali). There is a pattern in the data that indicates that there might be a geographic displacement of farming activities from very close to a mine to slightly farther away (20 to 30 km), especially in Ghana. Results also show that men are not more likely to work in manual labor in Ghana or in Mali.
Figure 1.6 Spatial lag model illustrating geographic distribution of effects on service and agricultural sector employment
District-level analysis, which compares outcomes between mining and nonmining districts, for all three countries confirms the above finding that agricultural employment decreases in mining districts. For Ghana, the results indicate that agricultural employment decreases in mining districts relative to nonmining districts, by 5.2 percentage points for men and 8.5 percentage points for women. In addition, the probability of a woman working all year increases by 5.4 percentage points, as does the probability of working in manual work. 14
Chuhan-Pole et al. (2015) find that, using GLSS data, women are 7.4 to 10.4 percentage points more likely to work in services or sales if they live close to a mine, and 2.5 to 2.6 percentage points more likely to work in mining.
16
There are no such significant increases in employment in other sectors for men (the DHS does not have information on employment in mining for men).15 Figure 1.7 Agriculture, manual labor, mining, and wage earnings for men
15
However, the insignificant point estimates indicate that men might be shifting toward service sector employment and manual work.
17
Results from a district analysis for Tanzania and Mali show that there are significant increases in the likelihood of mining employment. In Mali, men are almost 10 percentage points more likely to work as miners, and women 2.3 percentage points more likely to work as miners, compared with before. Note, however, that these changes can also be due to increases in small-scale mining in these districts over the same time period. Overall, men’s and women’s agricultural employment decreases insignificantly. For Tanzania, there is no recorded information on mining employment, but as in Mali, we see a decrease in agricultural employment—8 percentage points for men and 11 percentage points for women—but these estimates are not statistically significant. The empirical evidence provides signs of an incipient structural transformation around mines. Essentially, there are some visible shifts in the structure of employment of the local economy away from “traditional” farming—defined by low inputs and low capital per worker—to mining, services, and other activities.16 The increase in service sector employment as well as other sectors can be understood as “local multipliers” (Moretti 2011), where for each job created directly in mining, there are additional jobs created in the tradable or nontradable sector. The size of the multiplier will depend on total mine employment, miners’ wages and spending habits, and how the mining company sources inputs (such as food, electricity, and housing for its workers). Companies can try to boost the multiplier, for example, by ensuring that it sources inputs from local suppliers. In addition, there are local fiscal multipliers. A mine may result in local tax contributions which, when spent by the local government, can help stimulate the local economy. The study provides another perspective on the impact of resource extraction on agriculture by using remote sensing data to estimate levels and changes in agricultural production in mining and non-mining localities in Burkina Faso, Ghana, Mali, and Tanzania (chapter 5). It investigates the spatial relationship between mining activities and local agricultural development by using a vegetation index (the Normalized Difference Vegetation Index) as a proxy for agricultural production. The issue of interest is whether the opening of mines has spillover effects on the agricultural sector. Agricultural production could be affected by mining activities in several ways. Mining could lead to a rise in local wages, reduce profit margins in agriculture, and lead to the exit of many families from farming—something akin to a localized Dutch disease problem. Negative environmental spillovers such as pollution (as found by Aragón and Rud 2015) or local health problems could also dampen productivity of the land and of the farmers, and thereby reduce the viability of farming. Alternatively, mining could create a miniboom in the local economy through higher employment and higher wages that can lead to an increase in local area aggregate demand, including for regional food crops. 16
Results show that in some countries, women shift from agriculture to service sector employment in the close vicinity of mines. These results have previously been confirmed for different minerals and in more countries (see Kotsadam and Tolonen 2013, and Tolonen 2015).
18
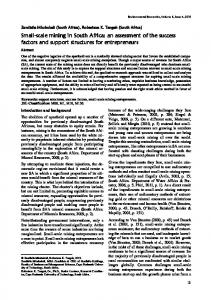
Figure 1.8 explores the change in the different distances from the mine, over the lifetime of the mine. On the horizontal axis is the mine year, counting from 10 years before mine opening, highlighted by the red vertical line, to 10 years after mine opening. The figures are based on summary statistics, and do not control for any systematic differences across the mines. Overall, it seems like areas very close to mines are on a steeper trend in nightlights than are areas farther away, especially as one gets closer to the mine opening year, which is highlighted by the red vertical line. One interpretation of this pattern is that from a few years before the mine starts extracting gold, economic activity that emits nightlight increases in these areas. One reason why this happens before the actual mine opening year is because mines are capital-intensive and the local economy is stimulated during this investment phase, a pattern confirmed in previously mentioned econometric studies. For NDVI, no big difference in patterns is observed across the areas. Although both areas seem to be on an upward sloping trend, this needs to be interpreted with caution, because it can be driven by the unbalanced sample17. If anything, we detect that areas close to mines are getting relatively greener over time compared with areas further away. Figure 1.8 Nightlight and vegetation index over mine lifetime
Note: Nonparametric (local polynomial smooth) measures of nightlight and NDVI close to mines. Years since mine opening on the x-axis counts the number of years from mine opening, with before the opening on the left of the 0, and years after mine opening to the right of the 0. Nightlights and NDVI are measured as averages across limited geographic areas, varying from within 10 km from the mine center point, to 20 km, 30 km, 50 km, and 100 km.
17
The sample is unbalanced as the data on nighlights start in 2002, but mines may have opened long before 2002, as well as after. If the mines opened before 2002, we will have night lights data only during the active period of the mine. Such mines would then add to the estimates of night lights on the right side of the red line, but not to the left. There are too few mines for which we have night lights the whole 20-year period to do these figures on a perfectly balanced subsample.
19
The difference-in-differences analysis for 32 mines across four countries does not find a robust decrease in NDVI in mining communities (20 km) compared with farther away (20 to 100 km). The treatment coefficient active_close (table 1.2) is negative but not statistically significant, meaning that there was no major difference in agricultural output per area between areas near the mines and those further away (the control areas). In light of the finding from the spatial lag model where we saw workers exiting agriculture, the finding that mining has had no impact on agriculture when using NDVI may seem contradictory. However, there are two things to keep in mind. One, the results from the spatial lag model are about employment on the extensive margin—that is, the fraction of workers in agriculture. By contrast, the results from the remote sensing data are about yields (production—proxied by NDVI —per area). It is possible to have a net exit of workers without lowering agricultural yields if the productivity of the entrants is marginally higher than those who are exiting. A similar result will obtain if there is now more land per worker, and the marginal productivity is higher. Therefore, these two results actually are consistent with a story of nascent structural transformation.
Income, wages, and expenditure in mining communities in Ghana While there are signs that there is a shift out of nonfarm activities, is there similar evidence available for wages? The available household surveys listed above have two drawbacks for understanding wages and mining. First, they are not geocoded, so the workers cannot be linked to a mine. Second, most have no wage data. The exception is Ghana, where household data have geocoordinates. Therefore, how wages, income, and expenditure evolve in mining communities can be mapped. The analysis shows that household total wages increase, as do women’s wages (table 1.2). Men’s wages increase too, but the increase is not precisely estimated. (Note wage earnings are only recorded for those who are engaging in wage labor; in fact, only 13.3 percent of people in the GLSS sample for Ghana have recorded wage earnings.) The data also show that regional food prices are higher in mining areas, which is similar to the findings in Peru (Aragón and Rud 2013), but regionally deflated food expenditures do not increase, nor does the share of food in total household expenditure (column 6). By contrast, total household expenditure on housing increases by 31.6 percent (not regionally deflated prices) with the onset of mining, as does the share of this component in total expenditure. The same is true for energy costs, such as electricity and gas, which rise by 29.7 percent with the onset of mining. This might be due to the rise in electrification that is noted below.
20
Table 1.2 Mapping changes in income, wages, and expenditure in Ghana (1)
(2)
(3)
(4)
(5)
(6)
(7)
(8)
(9)
Ln
Ln
Ln
Ln
Total
Food
Education
Housing
Electricity
Wages
Wages
wages
pc
Household
share
& health
share
and gas
All
Men
women
exp.
exp.
active*mine
0.520** (0.226)
0.391 (0.238)
0.694*** (0.241)
-0.178* (0.093)
-0.126 (0.089)
-0.022 (0.053)
-0.097 (0.186)
0.404*** (0.121)
0.267** (0.129)
controls
Y
Y
Y
Y
Y
Y
Y
Y
Y
share
share
Note: (1) Annual wages and salaries for individuals in all ages (nondeflated). (2) Annual wages and salaries for women in all ages (nondeflated). (3) Annual wages and salaries for men in all ages (nondeflated). (4) Real per capita annual food and nonfood expenditure (regionally deflated). (5) Total annual regionally adjusted household expenditure (local currency). (6)–(9) All expenditure and food share variables are used in natural logarithms. All regressions control for household head, household size, district fixed effects, and year fixed effects. ***p