methods. Indeed, most available software tools for graph drawing use force- ..... angles ar are forced to be equal to 180â¦; this leads to an increased total edge .... edges in a finer grid as sequences of horizontal and vertical line segments. A.
AGD: A Library of Algorithms for Graph Drawing , Michael J¨ unger1 , Gunnar W. Klau2 , Petra Mutzel3 , and Ren´e Weiskircher3 1
2
3
1
University of Cologne, Department of Computer Science, Pohligstraße 1, D-50969 K¨ oln, Germany Konrad–Zuse–Zentrum f¨ ur Informationstechnik Berlin, Takustraße 7, D-14195 Berlin, Germany Vienna University of Technology, Institute of Computer Graphics and Algorithms, Favoritenstraße 9–11, A-1040 Wien, Austria
Introduction
The development of the AGD software, an object-oriented C++ class library of Algorithms for Graph Drawing, has started in 1996. AGD is a general purpose graph drawing tool suited for beginners as well as for advanced users. It contains a variety of layout algorithms leading to different layout styles. However, the primary goal of development has been to provide users with a toolbox for creating their own implementations of graph drawing algorithms according to their specific needs. Since, in many cases, users want the layouts to satisfy application-specific requirements that are not foreseen in generic graph drawing methods. AGD is designed in such a way that it is easy to add user-specific changes to the layout algorithms. Another important goal of AGD was to bridge the gap between theory and practice in the area of graph drawing. E.g., for drawing general graphs, Batini et al. [3,2] suggested a method based on planarization which often leads to good drawings for many applications. However, until 1996, no publically available software layout tool used the planarization method. The reason for this was twofold: On the one hand, a lot of expertise is necessary concerning planarity testing algorithms, combinatorial embeddings, planar graph drawing algorithms, and (often NP-hard) combinatorial optimization problems. On the other hand, great effort is needed to implement all necessary algorithms and data structures, since the planarization method consists of various phases that require complex algorithms. Recently, major improvements have been made concerning the use of the planarization method in practice (e.g., [33,19,26–28]). Today, there exist some (publically available) software libraries using the planarization method successfully for practical graph layout [1,22,23]. In AGD, the planarization method is implemented in a modular form, so that it is easy to experiment with different approaches to the various subtasks of the whole approach. This enables experimental comparisons between various algorithms in order to study and understand their impact on the final drawing. Not only in graph
2
M. J¨ unger et al.
drawing, the empirical study of combinatorial algorithms is getting increasing attention. Also the Sugiyama-style method for drawing graphs with preferred direction is rather a methodological frame than a fixed algorithm. For each phase layer assignment, crossing minimization, and coordinate assignment, a variety of possible implementations exists. AGD allows users to simply switch among a variety of implementations, and gives software programmers the possibility to introduce new algorithms. Another reason for building AGD was our intention to show how mathematical methods can help to produce good layouts. Many of the optimization problems in graph drawing are NP-hard. However, this does not mean that it is impossible to solve them in practice. AGD shows that problem instances can often be solved to provable optimality within short computation time by using polyhedral combinatorics and branch-and-cut algorithms.
2
Applications
We can distinguish two groups of users of AGD: The first group uses only the algorithms that are already implemented without making any changes or extensions while the second group writes new modules in order to change the behavior of the drawing algorithms already contained in AGD. The first group only needs the executables of the demo programs. The agd demo executable contains only algorithms working without additional software packages while agd opt demo contains the exact optimization algorithms that only work on systems where ABACUS [35] and CPLEX are installed. Both demo programs have graphical user interfaces that are based on the class graph win of the LEDA-library [43]. This class already contains methods for loading and storing graphs in different formats and also for creating and manipulating them. The demo programs extend the menus of graph win by the methods implemented in AGD for generating and drawing graphs. Since graph win allows drawings to be exported in Postscript format, drawings generated using AGD algorithms can easily be used as illustrations in documents. The demos thus constitute a very general graph drawing environment. Data we collected from people who downloaded the demos show a diverse range of applications. In the field of biology, AGD is used to visualize metabolic networks, protein interactions, gene regulatory networks, and plant distributions. In social science, uses include drawing genealogical trees, collective labor agreements and net structures in cognitive models. Other applications include the visualization of neural networks, electrical grids, flowcharts and the dependency graph of university courses. The disadvantage of the generality of the demos is that they are not suitable for applications where the drawings have to meet a very restrictive set of requirements. Therefore, the second group of users writes new modules
AGD: A Library of Algorithms for Graph Drawing
3
or classes that are derived from AGD-classes to modify the behavior of the algorithms that already exist in the library. In this way, users can address their specialized layout needs. AGD is also used as a platform for research in the area of graph drawing, e.g., [15,38]. Because of its modular construction, researchers can concentrate on the innovative part of their drawing algorithm while leaving standard tasks to the algorithms implemented in AGD. One example is the comparison of different methods for the compaction of orthogonal drawings done by Klau, Klein, and Mutzel [38]. It was only necessary to implement the different compaction methods that should be compared as AGD-modules, while the computation of the orthogonal representation for each graph and the visualization of the computed drawing was left to the corresponding classes already implemented in AGD. This enabled the authors to save more than half of the programming work compared to starting the project from scratch.
3
Algorithms
AGD contains a variety of implementations of methods for drawing graphs with the planarization method (see Section 3.1). A basic ingredient to the planarization method are planar graph drawing methods. AGD includes implementations of many different planar graph drawing algorithms, some of which can be combined with the planarization method (see Section 3.2). Relatively new are orthogonal planar drawing methods for clustered graphs (see Section 3.3). For Sugiyama-style layout, AGD contains many different implementations of the phases layer assignment, crossing minimization, and coordinate assignment (see Section 3.4). 3.1
Algorithms for Planarization
In this section we will mainly focus on the planarization method and its implementation in AGD. General graphs can also be drawn using force-directed methods. Indeed, most available software tools for graph drawing use forcedirected methods. These are especially useful for drawing very sparse, treelike graphs. AGD contains implementations of the spring-embedder algorithm by Fruchterman and Reingold [20], and the algorithm by Tutte [51]. However, for many applications, e.g., data base visualization or software design, the planarization method leads to much nicer layouts. E.g., in general the planarization method leads to grid drawings having a small number of edge crossings. AGD contains a very flexible implementation of the planarization method (PlanarizationGridLayout). So far, all planar layout routines in AGD generate grid drawings, i.e., the computed coordinates are integer. This is supported with the GridLayoutModule. The AGD modules involved in the planarization method are shown in Fig. 1.
4
M. J¨ unger et al. LayoutModule
PlanarizationGridLayout
planar_layouter planarizer
GridLayoutModule PureOrthogonalLayout
CompactionModule
compactor post_compactor
TurnRegularityCompaction
OrthogonalLayout compactor post_compactor
PostCompactionModule
QuasiOrthogonalLayout
LongestPathCompaction
compactor post_compactor
FlowCompaction
GiottoLayout
OptCompaction
compactor post_compactor
PlanarizerModule
SubgraphModule
PlanarSubgraph
subgraph inserter
EdgeInsertionModule ShortestPathInserter
runs
OptPlanarSubgraph
SubgraphPlanarizer
embeddings remove_reinsert
SPQRTree
OneEdgeMinCrossInserter embeddings
Fig. 1. Modules for the planarization method
In the planarization phase, any procedure transforming the given graph G into a planar graph G0 is allowed. One can imagine that a method generating a random or a force-directed layout and then substituting the crossings by artificial vertices could be a PlanarizerModule. AGD offers the possibility of adding and creating any new method for planarizing a graph via substituting edge crossings by artificial vertices. Our experiments have shown that, in order to keep the number of crossings small, it is advantageous to use planarization via edge removal (Subgraph Planarizer). AGD contains a heuristic PlanarSubgraph [30] based on PQtrees that achieves good results in practice, and a branch-and-cut algorithm OptPlanarSubgraph to solve this NP-hard problem to optimality [33]. Any other planar subgraph heuristic can easily be added to AGD. For the edge re-insertion phase, AGD contains the standard procedure ShortestPathInserter described in Algorithm 2, Section [TF4.3], as well as the optimal embedding re-insertion algorithm OneEdgeMinCrossInserter (Algorithm 3, Section [TF4.3]) [28]. All edge insertion modules provide optional heuristics that can improve the quality of the solution significantly. The two algorithms that fix an embedding allow calling the algorithm for several randomly generated embeddings and select the best solution. The number
AGD: A Library of Algorithms for Graph Drawing
5
of embeddings is controlled by the parameter embeddings. Generating random combinatorial embeddings requires computing the SPQR-tree for each biconnected component [9]. AGD provides a linear-time implementation of SPQR trees [27] in the class SPQRTree. Experiments show that significant improvements are achieved if, in a postprocessing step, a set S of edges is removed from the graph and reinserted [34,53]. In each such step, the number of crossings can only decrease. All three edge insertion algorithms support this heuristic that is controlled by the parameter remove reinsert. Possible settings are none (skip postprocessing), inserted (apply postprocessing with all reinserted edges), and all (apply postprocessing with all edges in the graph).
17
11
7 9 32
4
10
0
32
42 11
7 30
10
4
35 43
0
9
16
16
33
47 38
30 41
1
5
46
2
26
18
18 29
24
31
1
33
28 34
13
47
20
25
35
6
38
17
5
49 13 6
25
48
21
20
36
8
24
46
42
45
26
2
15 41
31
29
28
27 19
34
14
3
44
40
22 3
40 44
23
43
48
27 19
14
23
12 37
12
45
39
8
22
37 21
36
15
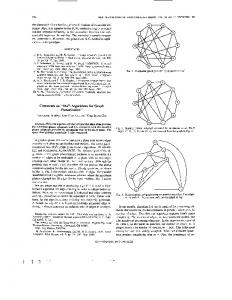
(a) Fixed embedding
(b) Optimal embedding
Fig. 2. The influence of the combinatorial embedding
Figure 2(a) shows a graph for which the standard iterative edge insertion leads to 14 crossings if a random combinatorial embedding is chosen. In this case the drawing has a grid size of 22×22. However, when taking the optimum one edge insertion module and adding the remove and reinsert algorithm for all edges, the resulting drawing has only 11 crossings and has size 16×22 (see Fig. 2(b)). This is a good example that shows how the size of the drawing increases with the number of crossings.
6
3.2
M. J¨ unger et al.
Planar Graph Drawing Algorithms
The planarization phase leads to a planar graph G0 that contains artificial vertices. Now, any planar graph drawing algorithm may be used for G0 . Replacing all artificial vertices with edge crossings in a drawing of G0 results in a drawing of the input graph G. We prefer to use orthogonal or quasiorthogonal algorithms because, in this case, an edge crossing is drawn as two crossing horizontal and vertical line segments. In orthogonal graph drawing, an important goal is to keep the number of bends small. Many minimum cost flow-based algorithms are available for this task (see Fig. 1. In a first step (bend minimization) a flow in an underlying network determines the shape of the orthogonal drawing. A second step (compaction) deals with assigning the coordinates to the vertices and bends. The library contains Tamassia’s classical bend-minimizing algorithm (see [TF4.4]) [49] that is applicable if the maximum degree of the input graph is at most four (PureOrthogonalLayout). For graphs with vertices of higher degree, AGD contains three extensions of Tamassia’s algorithm: Giotto (GiottoLayout) [50] and two variations of the quasi-orthogonal drawing algorithm presented in [39] (QuasiOrthogonalLayout and OrthogonalLayout). Quasi-orthogonal drawings. In the following we will describe the algorithm for generating quasi-orthogonal drawings. First, we introduce the quasiorthogonal drawing model. Furthermore we present an extension of Tamassia’s algorithm that constructs drawings in this model. In the quasi-orthogonal model, vertices are represented by grid points. This implies that we can no longer stick to pure orthogonal grid embeddings. Unlike in the Kandinsky model (see [TF4.4])), vertices and edges share a common grid in the quasi-orthogonal model. These two requirements enforce some edges to leave the grid lines. We require, however, that 4-planar subgraphs are still drawn according to the pure orthogonal standard. We call vertices with degree greater than four high-degree vertices. Our proposal is to allow the first segment of any edge leaving a high-degree vertex to run diagonally through the grid. The following definition provides a formal description of the quasi-orthogonal standard: A quasi-orthogonal grid embedding of a planar graph G = (V, E) is a function Γ that maps V to points in the grid and E to sequences of segments whose endpoints lie on the grid. The following properties hold: (Q1) Γ (v) 6= Γ (w) for v, w ∈ V, v 6= w. (Q2) The endpoints of Γ (e) are Γ (v) and Γ (w) for all e = (v, w) ∈ E. (Q3) For two different edges e1 and e2 the paths Γ (e1 ) and Γ (e2 ) do not intersect except possibly at their endpoints. (Q4) Γ (G − {v ∈ V | δ(v) > 4}) is an orthogonal grid embedding. Note that property (Q4) of this definition ensures pure orthogonal grid embeddings for 4-planar graphs. This implies that every orthogonal grid em-
AGD: A Library of Algorithms for Graph Drawing
7
bedding is also a quasi-orthogonal grid embedding. Figure 3 shows an example for a drawing respecting the properties of the above definition.
Fig. 3. Quasi-orthogonal grid embedding of a 6-planar graph with 7 bends
In the following we describe an algorithm that computes quasi-orthogonal grid embeddings for planar graphs, see also [39] and [37]. Similar to the related Giotto algorithm, high-degree vertices v are replaced by faces fv with δ(fv ) = δ(v). The vertices on the boundary of such a representative face fv correspond to the adjacencies of the former vertex v, reflecting the order of the neighbours. We call these special faces cages, in a later phase of the algorithm every high-degree vertex will be placed in its corresponding cage. Unlike in Giotto, we do not prescribe on which side of fv the edges adjacent to v have to leave. We refer to the transformation as T1 (see Algorithm 1 and Figure 4). Algorithm 1: Transformation T1 Data : Planar graph G = (V, E), vertex v ∈ V Result : Transformed graph G (v is replaced by a cage) for all edges e = (v, w) ∈ E adjacent to v do split edge (v, w); end for all faces f adjacent to v do link pair of new vertices in f by an edge; end delete v and incident edges;
After applying T1 (G, v), the newly created face fv represents the former vertex v. Note that v has been replaced by a structure of δ(v) vertices, each e be the graph that results from of which has exactly three neighbours. Let G applying T1 to every high-degree vertex in G. In the following analysis, Vi
8
M. J¨ unger et al.
w1
w1
w2
w2
wδ(v)
wδ(v) v
w5
w3 w4
fv w5
w3 w4
Fig. 4. Transformation T1 : Replacing a high-degree vertex v by a cage fv
denotes the set {v ∈ V | δ(v) = i}. It is obvious that T1 does not change e is the planarity of the graph and that the resulting number of vertices of G in O(|V |) since T1 introduces for each edge in E at most two new vertices. Furthermore one can easily verify that the inverse operation of transformation T1 results in the original graph. e Since Now we can apply Tamassia’s algorithm for 4-planar graphs to G. e |V | = O(|V |), the asymptotical notion of running time does not change. If we, however, do not distinguish between cages and normal faces, the result is a pure orthogonal grid embedding in which the cages have arbitrary rectilinear shape. Since we want to place the high-degree vertices inside their corresponding cages, it would not be a good idea to let the shapes of the cages get too complicated. Therefore we force cages to be of rectangular shape by modifying the network of Tamassia’s original algorithm. We then show that our modifications indeed achieve the desired results and that our formulation always provides a solution meeting our constraints. A rectilinear polygon Π has rectangular shape if neither of the angles inside Π exceeds 180◦ . We exploit this fact to formulate a modification of network N as introduced in Section [TF4.4]. Consider the set of elements R = {r ∈ H(f )|f is a cage}. For every element r ∈ R we must ensure ar ≤ 180 and sr = 0∗ . These two constraints guarantee that there will be neither a concave angle nor a concave bend in a cage. In [11] a similar method is proposed resulting in drawings according to the Giotto standard. In this approach the angles ar are forced to be equal to 180◦ ; this leads to an increased total edge length compared to our approach. Note that the first requirement (ar ≤ 180◦ ) is automatically satisfied. Each vertex v bounding a cage has degree δ(v) = 3 and thus can only form angles of at most 180◦ . We formulate the second constraint by deleting certain arcs in N . We have to avoid a flow χ(ug ,uf ) in the case that f represents a cage. Deleting the arc (ug , uf ) makes such a flow impossible. We have now modified the network of Tamassia’s algorithm for 4-planar graphs so that each legal flow in it corresponds to an orthogonal representation with rectangular cages. The following lemma states that these modifications have no influence on the feasibility of the minimum cost flow problem:
AGD: A Library of Algorithms for Graph Drawing
9
Lemma 1. The minimum cost flow in the modified network corresponds to an orthogonal representation with the minimum number of bends under the constraint that every cage has a rectangular shape. Proof. Let N be the modified network. The modification concerns only the arcs in AF . To prove the lemma we only have to show that the conservation rule at nodes uf ∈ UF still holds. Therefore we consider three cases: 1. Face f is a cage. P P The incoming flow is uv χ(uv ,uf ) , the outgoing flow is ug χ(uf ,ug ) . There are exactly four angles of 90◦ in the cage occurring either at vertices or at bends. Thus X |{uv | χ(uv ,uf ) = 1}| + χ(uf ,ug ) = 4 . ug
We get X X X χ(uv ,uf ) − χ(uf ,ug ) = 2δ(f ) − |{uv | χ(uv ,uf ) = 1}| − χ(uf ,ug ) uv
ug
ug
= 2δ(f ) − 4 = buf . 2. Face f is the neighbor of a cage. According to their construction, cages can never be neighbors to other cages, neither can they enclose other faces. For this reason the demand of uf can be satisfied by adjacent normal faces. 3. Face f is neither a cage nor a neighbor of a cage. In this case there is no difference from the unmodified network. Conservation is guaranteed. u t We now construct an initial orthogonal embedding Γ for the auxiliary e with one of the methods for the compaction phase of the topologygraph G shape-metrics method (see Section [TF 4.4]). During this step we ensure that both the height and the width of a cage measure at least two grid units which can easily be incorporated in any of the compaction methods. At this point, we want to reverse the changes of transformation T1 . Therefore, we define a second transformation T2 (see Alg. 2) that operates on grid embeddings and places the high-degree vertices in their cages. The aim is to minimize the number of bends arising at the boundary of a cage during the process of connecting a high-degree vertex v with its adjacent edges. Let w1 , . . . , wδ(v) be the vertices on the boundary of the corresponding cage fv and let Γ (fv ) characterize the set of grid points covered by fv . Using straight line edges for the connection of v with its neighbors, we can save at most four bends. For the detailed and somewhat tedious description of finding the best grid point for v, see [37]. A final compaction step might help to further reduce the area of the drawing.
10
M. J¨ unger et al.
Algorithm 2: Transformation T2 Data : Orthogonal drawing Γ , cage fv with boundary w1 , . . . , wδ(v) Result : Γ in which fv is replaced by the appropriate vertex v place v in Γ (fv ); // creating a minimum number of bends in Γ (fv ) for i = 1 to δ(v) do connect v with wi ; end
The whole method is summarized in Alg. 3. The procedure tamassia mod refers to the modified bend minimizing algorithm of Tamassia (see [TF4.4] for a description of the original algorithm) where each cage is forced to be of rectangular shape. Algorithm 3: Quasi-orthogonal drawing algorithm Data : Planar graph G = (V, E) with planar embedding P Result : Quasi-orthogonal grid embedding Γ of G e = G; G while ∃ vertex v ∈ Ve with δ(v) > 4 do e = T1 (G, e v); G end e Pe); Γ = Γe; Γe = tamassia mod(G, e for all faces f ∈ F if f is a cage do Γ = T2 (Γ, f ); end return Γ ;
Compaction algorithms. The AGD library contains several algorithms for the compaction phase within the topology-shape-metrics approach. Construction heuristics assign coordinates to vertices and bends of a given orthogonal representation that encodes the shape of a planar orthogonal drawing. Improvement heuristics operate directly on a layout and try to decrease its total edge length and area. This division is reflected in the library: The user chooses a construction method (from CompactionModule or PostCompactionModule) and optional improvement heuristics (from PostCompactionModule). The former transforms the orthogonal representation by introducing artificial edges and vertices. By changing the options of the compaction algorithms, there are different techniques available for this transformation. AGD’s constructive heuristics include longest path-based or flow-based compaction with rectangular dissection (LongestPathCompaction and FlowCompaction) [49] and two variants of a flow-based compaction technique based on the property of turn-regularity (TurnRegularityCompaction) [4]. For the improvement phase, AGD offers iterative application of compaction with longest path or
AGD: A Library of Algorithms for Graph Drawing
11
flow computations (LongestPathCompaction and FlowCompaction) as used in the area of VLSI-design, see, e.g., [41]. In addition, AGD provides an implementation of the integer linear programming-based approach by Klau and Mutzel (OptCompaction) [40] that produces an optimum drawing in terms of minimum total length or maximum edge length. The modular design of the compaction phase proved very useful in a recent experimental study [38]. All combinations of constructive and improvement heuristics could easily be compared against each other and against the optimum values provided by the integer linear programming-based algorithm. One of the main insights of this study has been that flow-based compaction should always be used as an improvement method. Figure 5 shows the output of two different compaction strategies and a corresponding optimum solution.
(a) Longest-path
(b) Flow-based
(c) Optimal
Fig. 5. The influence of different compaction algorithms
Alternative planar drawing algorithms. In addition to the orthogonal and quasi-orthogonal planar drawing algorithms described above, the following planar drawing algorithms are contained in AGD (the corresponding AGD modules are shown in Fig. 6). AGD contains an implementation of the Kandinsky algorithm Kandinsky Layout) (see [TF4.4]) [19] that is not yet available as a module in the planarization method, but can be used for planar graphs with arbitrary vertex degrees. Unlike other flow-based orthogonal drawing methods, the Kandinsky algorithm places vertices and bends as points on a coarse grid and routes the edges in a finer grid as sequences of horizontal and vertical line segments. A variant of the algorithm uses a common grid for vertices and edges. Vertices are represented as boxes whose size is bounded by the vertex degree. Probably, the best known planar graph drawing algorithm is the one by de Fraysseix et al. [8]. This seminal paper shows that a planar graph with
12
M. J¨ unger et al.
CanonicalOrder LayoutModule GridLayoutModule
ConvexLayout ConvexDrawLayout
KandinskyLayout MixedModelLayout
AugmentationModule
augmenter
FPPLayout PlanarStraightLayout SchnyderLayout
LEDAMakeBiconnected
augmenter
PlanAug VisibilityRepresentation
PlanarDrawLayout augmenter
OptPlanAug
Fig. 6. Modules for drawing planar graphs
n vertices can always be drawn without bends and crossings on a grid of size polynomially bounded in n. The idea is to first augment the graph by additional edges in order to obtain a triangulated planar graph. Then, a socalled canonical ordering for triangulated planar graphs is computed, and finally, the vertices are placed iteratively according to this ordering. Theoretically, the straight-line planar drawing problem was solved. However, the drawings do not look nice, especially not after the deletion of edges added in the augmentation step. Also, the angular resolution is not good. Recently, some work has been done to improve the aestetic quality of the drawings. Generalizing the canonical ordering to triconnected [36] and to biconnected planar graphs [25] already leads to a big improvement. AGD provides implementations of all three canonical orderings (CanonicalOrder) and the corresponding placement algorithms (FPPLayout, ConvexLayout, and PlanarStraightLayout). The algorithms of this paragraph run in linear time. The problem of the angular resolution has been solved by introducing some bends within the edges, leading to pleasant polyline drawings [36,26]. AGD contains a linear implementation of the mixed-model algorithm by Gutwenger and Mutzel [26] (MixedModelLayout). Figure 11 on page 20 shows a screenshot of AGD displaying a graph drawn with the mixed-model algorithm. In order to apply the drawing algorithms to planar graphs that are not necessarily biconnected, augmentation algorithms are used for augmenting a planar graph to a biconnected planar graph. The augmentation problem consisting of adding the minimum number of edges is NP-hard. AGD provides a simple heuristic using depth-first-search (LEDAMakeBiconnected), the 5/3approximation algorithm by Fialko and Mutzel [18] (PlanAug) that in most
AGD: A Library of Algorithms for Graph Drawing
13
cases yields a solution that is very close to an optimum solution, and a branchand-cut algorithm for exact optimization (OptPlanAug) [44,31,17]. In addition, AGD contains linear implementations of two algorithms for producing convex drawings of triconnected planar graphs (ConvexLayout [36] and ConvexDrawLayout [6]), generalizations of these algorithms to general planar graphs [25] (PlanarDraw Layout), and an algorithm for producing weak visibility representations [47] (VisibilityRepresentation). 3.3
Algorithms for Planar Cluster Drawings
Recently, we integrated planar cluster drawing algorithms into the library. In the following we describe our approach in more detail. We use the notation of sections [TF2.5] and [TF3.3]. A grid drawing of a clustered graph is called orthogonal if the underlying graph is drawn orthogonal and the cluster regions are drawn as rectangles where the corners lie on integer grid points. Given a c-planar embedding of C = (G, T ) (e.g., obtained via the cluster planarity algorithm described in [16]), we apply a modified version of Tamassia’s algorithm to obtain an orthogonal grid drawing of C. To make use of Tamassia’s algorithm, we generate the graph G0 from C as follows: We start with a c-planar embedding of C. Beginning with the leaves of T , we traverse the cluster tree from bottom to top (level order traversal). For a non-trivial cluster ν ∈ T we insert an artificial vertex on every incident edge of ν and afterwards connect the artificial vertices by virtual edges along the cluster boundary (see Fig. 7). This information is given by the c-planar embedding. It is obvious that this operation preserves the given c-planar embedding.
Fig. 7. Generation of the graph G0 from the clustered graph C
Then we apply the modified algorithm of Tamassia to G0 . In order to achieve rectangular regions in the final drawing, we need to modify the flow network. Note that the representation of the regions of the cluster in G0 are very similar to the cages that have been introduced in the description of the quasi-orthogonal drawing algorithm (see Section 3.2). We can use almost the same modification of Tamassia’s network in order to guarantee the minimum
14
M. J¨ unger et al.
number of bends with the additional requirement that the clusters are drawn as rectangular regions. Finally, we construct an orthogonal grid drawing of C from the orthogonal grid drawing of G0 . It is obvious that we can use the positions of the original vertices and edges of C that are not incident to clusters of C. In the drawing, we replace each path containing artificial vertices and representing an original edge of G incident to a cluster with the drawing of a single edge. We also replace the virtual edges representing the cluster boundaries by rectangles. Since the corners of these rectangles correspond to bends in the virtual edges, they are positioned on integer grid points. The result is an orthogonal grid drawing of C. An example is shown in Fig. 8.
C2
C4 C6
C1 C3
C5
Fig. 8. Example for a drawing of a clustered graph produced by the algorithm
Let h(T ) be the height of the cluster hierarchy T . Then the running time 7√ of the drawing algorithm is O(˜ n 4 log n ˜ ) where n ˜ = O(nh(T )). 3.4
Algorithms for Sugiyama-Style Layout
AGD provides a flexible implementation of the Sugiyama algorithm [48] represented by the module SugiyamaLayout that consists of three phases. For each phase, various methods have been proposed in the literature. The available AGD modules and their dependencies are shown in Fig. 9. In the first phase, handled by modules of type RankAssignment, the vertices of the input graph G are assigned to layers. If G is not acyclic, then we
AGD: A Library of Algorithms for Graph Drawing
15
LayoutModule SugiyamaLayout TwoLayerCrossMin BarycenterHeuristic MedianHeuristic WeightedMedianHeuristic SifitingHeuristic SplitHeuristic
ranking cross_min comp_coord runs transpose
HierarchyLayoutModule
RankAssignment LongestPathRanking subgraph
OptNodeRanking
LEDAMakeAcyclic
subgraph
GreedyCycleRemoval
FastHierarchyLayout CoffmanGrahamRanking OptCompCoord
SubgraphModule
subgraph
OptAcyclicSubgraph
DfsRanking
GreedySwitchHeuristic GreedyInsertHeuristic OptCrossMin
Fig. 9. Modules for Sugiyama-style layout
compute a maximal acyclic subgraph and reverse the edges not contained in the subgraph. AGD contains two linear-time heuristics for solving the NPhard maximal acyclic subgraph problem (LEDAMakeAcyclic based on depthfirst-search and a greedy algorithm (GreedyCycleRemoval) [13]), as well as a branch-and-cut algorithm (OptAcyclicSubgraph) [24] that is able to solve the problem to provable optimality within short computation time. Currently, AGD contains the following algorithms for computing a layer assignment for an acyclic graph in which the edges are directed from vertices on a lower level to vertices on a higher level. LongestPathRanking is based on the computation of longest paths and minimizes the number of layers (height of the drawing), OptNodeRanking minimizes the total edge length [21] (here the length of an edge is the number of layers it spawns), CoffmanGrahamRanking computes a layer assignment with a predefined maximum number of vertices on a layer (width of the drawing) [7], and DfsRanking simply uses depth-first-search and handles general graphs (see [TF4.2]). If edges spawn several layers, they are split by inserting additional artificial vertices such that edges connect only vertices on neighboring layers. The second phase determines permutations of the vertices on each layer such that the number of edge crossings is small. SugiyamaLayout contains a sophisticated implementation that uses further improvements like calling the crossing minimization several times (controlled by the parameter runs) with different starting permutations, or applying the transpose heuristic described in [21]. AGD provides implementations of the barycenter heuristic (see [TF4.2]) [48], median heuristic (see [TF4.2]) [14], weighted median heuristic [21], sifting heuristic [42], split heuristic [12], greedy switch heuristic [12], and greedy insert heuristic [12]. Furthermore, a branch-and-cut algorithm for optimum solutions based on [32] is implemented (OptCrossMin).
16
M. J¨ unger et al. -XXX-
X X
X XXXX
X
X
n169
n170
n172
n171
X
XXXXX
XXX X
n11
n57
n61
XXXXXXXXX
n62
XXXXX
n174
X
X
X XX
X XX
n8
n7
n59
X XX X
input9
XXXXXXXXX
X XX
n64
X
n92
X
X
n175
n63
X
XX X XX
n16
n15
XXXX
n17
n176
n177
XXXXX
X XXXXX
X XXXXX
XXXXX
n129
n20
n32
n30
XXXXXXXX
n21
XXXX
X
XX X
n13
XXXXXXXX
XXXX
n26
XXXXXXXX
n28
XXXXXXXX
n120
n152
XXXXXXXX
n146
n118
XXXXX
n125
n119
n153
n94
n126
n121
n95
n148
n109
XXXXXX
XXXX
n127
n140
n110
n128
n138
n142
n141
XXXX
n104
n102
XXXXXXX
n143
n101
n103
n136
XXXXXX
XXXX
XXXX
XXXX
XXXXX
XXXXX
XXXXX
XXX
XXXXX
XXX
n53
n54
n55
n56
XX
XXXX
X XX X
n72
XXXXX
n2
XXXXX X
X XX XX
input3
n74
n75
XXXXX X
XXXXX X
n76
XXXXXX
XXXXXX
-XXXXX-
n73
XXXXXX
n77
XXXXX X
XXXXXX
X XX X
input86
-XXX-
-XXX-
X X
X
n169
n170
n57
n171
XXXXX
XXX X
n8
X XX X
n7
n59
input9
n63
XXXXXXXXX
X XX
n64
X
X
n92
n11
X
n175
X
X
n129
n15
n20
n32
n30
n13
n26
n28
n21
XXXXXXXX
XXXXXXXX
XXXXXXXX
XXXXXXXX
XXXXXXXX
XXXX
XXXX
XXXX
n17
n176
n177
XXXXX
X XXXXX
X XXXXX
XXXXX
X
XX X
XX X XX
n16
X
X XX
n61
n62
XXXXX
n174
X
X XX
XXXXXXXXX
n172
X XXXX
X
XXXX
n152
n153
n120
n146
XXXXX
XXXX
n118
n125
n119
n126
n94
n95
n121
XXXXXX
n148
n109
n140
n127
n128
n141
n110
n138
n142
n143
XXXX
n104
XXXXXXX
n102
n103
n101
n136
XXXXXX
XXXX
XXXX
XXXXX
XXXXX
XXXXX
XXX
XXXXX
XXX
n53
n54
n55
XXXX
X XX X
XXXXX
n72
XXXXX X
n2
X XX XX
-XXXXX-
XXXXXX
X XX X
n56
XX
n74
input3
n75
XXXXX X
XXXXX X
XXXXXX
XXXXXX
n73
n76
n77
XXXXX X
XXXXXX
input86
-XXX-
Fig. 10. Two Sugiyama-style layouts of the same graph drawn with different modules for the coordinate assignment phase
AGD: A Library of Algorithms for Graph Drawing
17
AGD contains two implementations for the final coordinate assignment phase. The first (OptCompCoord) tries to let edges run as vertical as possible by solving a linear program (see [TF4.2]), the second (FastHierarchyLayout) proposed by Buchheim, J¨ unger, and Leipert [5] guarantees at most two bends per edge and draws the whole part between these bends vertically. Figure 10 shows two Sugiyama-style layouts of the same graph for which different algorithms for the coordinate assignment phase have been used: the method proposed in [5] (top), and the LP-based approach (bottom). Some more specific classes of graphs require algorithms that exploit their special structure. E.g., trees can be drawn nicely in AGD using the algorithm by Reingold and Tilford [46] and Walker [52] (see [TF4.1]). Moreover, stplanar graphs can be drawn by the algorithm suggested in [10].
4
Implementation
AGD [1] is an object-oriented C++ class library, which is based on the two libraries LEDA [43] and ABACUS [35]. LEDA provides basic data types and algorithms, e.g., the data type for the representation of graphs. ABACUS is a framework for the implementation of branch-and-cut algorithms. The ABACUS library is only used by branch-and-cut algorithms, whereas the whole basic functionality of AGD is independent of ABACUS. Therefore, we split the library into two parts, the basic part AGD and the part AGDopt that contains all ABACUS dependent classes. This makes it possible to use a subset of the algorithms in AGD without having an ABACUS installation – a LEDA installation is sufficient in this case. The most important design feature in AGD for algorithm engineering is the representation of algorithms as classes that provide one or more methods for calling the algorithm. Thus, a particular instance of an algorithm is an object of that class, which can also maintain optional parameters of the algorithm as member variables. Algorithms providing basically the same functionality (e.g., computing a subgraph or drawing a graph) are derived from a common base class, which we call the type of the algorithm, i.e., algorithms of the same type support a common call interface. This allows to write generic functions that only know the type of an algorithm. The type is rather general, but can be refined by declaring a precondition (e.g., the input graph has to be biconnected or planar) and a postcondition (e.g., the produced drawing is straight-line and contains no crossings). The precondition specifies how the algorithm can be applied safely. We call an instance of an algorithm together with its pre- and postcondition a module. Pre- and postconditions are sets of basic properties (e.g., properties of graphs like planar, acyclic or biconnected, or properties of drawings like orthogonal or straight-line). AGD maintains dependencies between these properties, such as “biconnected implies connected”, or “a tree is a connected forest”, in a global rule system.
18
M. J¨ unger et al.
AGD provides a general concept for modeling subtasks of algorithms as exchangeable modules. Such a subtask is represented by a module option that knows the module type, a guaranteed precondition (which always holds when the algorithm is called), and a required postcondition (which must hold for the output of the algorithm). The current module itself is stored as a pointer. In order to set a module option, a particular module is passed and automatically checked if it satisfies the requirements, i.e., it has the correct type, the guaranteed precondition implies its precondition, and its postcondition implies the required postcondition. These implications are checked using the global rule system for properties. Graph drawing algorithms that are tightly connected with a particular visualization component (e.g., a graph editor) or use very specialized data structures for representing a drawing (e.g., with many graphical attributes like line styles, text fonts, . . . ) are of limited use because it is difficult to integrate them into an application program. Each application is forced to support at least the same set of graphical attributes. Therefore, we decided to define a basic set of attributes which are required by graph drawing algorithms. An application must support these basic attributes, but can also use many more. Basic attributes of a node are the width and height of a rectangular box surrounding its graphical representation and the position of the center of this representation. Considering only the rectangular outline is convenient and sufficient for graph drawing algorithms. Basic attributes of an edge are simply the bend points of its line representation and the two anchor points connecting the line to its source and target nodes. The graph drawing algorithms in AGD access the basic attributes using a generic layout interface class. For a particular visualization component, an implementation is derived from the generic class and some virtual functions are overridden. The implementation class is responsible for storing the attributes. When a graph drawing algorithm is called, an object of this implementation class is passed and used by the algorithm to produce the layout. An implementation of the generic layout interface for LEDA’s graph editor GraphWin is already part of AGD, as well as a simple data structure for storing a layout. The latter is particularly useful for testing algorithms when it is not necessary to display the computed layout. AGD comes with the demo programs, agd demo, agd opt demo, cluster demo und spqr viewer based on GraphWin, that realize a graph editor with sophisticated layout facilities. The programs allow to experiment with the various algorithms of AGD, i.e., changing options and using different algorithms for subproblems. They can also be extended and adapted by developers, since their source code is part of AGD. The program agd server, written by Stefan N¨aher is also part of the AGD package. The server allows to use AGD algorithms via a file or socket interface. The program reads the graph in GML format [29] from a given input file and loads the AGD options that specify the layout algorithm from
AGD: A Library of Algorithms for Graph Drawing
19
a second file. Then, the selected algorithm is applied and the result is written back to the input file, again in GML format. The following code fragment gives a programming example with AGD. It shows how to set the planarizer option for the planarization layout. OptPlanarSubgraph optSub; OneEdgeMinCrossInserter optInsert; optInsert.removeReinsert(EdgeInsertionModule::all); SubgraphPlanarizer planarizer; planarizer.set_subgraph(optSub); planarizer.set_inserter(optInsert); PlanarizationLayout plan; plan.set_planarizer(planarizer); We use a subgraph planarizer called planarizer and set its subgraph option to a module for computing an optimal planar subgraph and its edge insertion option to the OneEdgeMinCrossInserter with the removeReinsert option set to all. Finally, we call the planarization layout algorithm plan for a graph myGraph with the layout information myLayout (containing information on the size of the vertices, the position of the vertices, and the position of the bend points): plan.call(myGraph,myLayout);
5
Examples
Figure 11 shows a screenshot of AGD displaying a graph with 62 vertices and 89 edges drawn with the planar mixed model drawing algorithm (see Section 3.2). Figure 12 shows a quasi-orthogonal drawing (see Section 3.2) of a data base graph from the literature [45] generated by AGD.
6
Software
AGD is freely distributed for non-commercial use to Universities and academic institutions from the AGD home page (http://www.ads.tuwien.ac. at/AGD/) as platform-dependent binary packages containing precompiled libraries and executable demos. The demos can be used without any additional software or tools. The same holds for the AGD server. This program is command line based and reads a graph from a file. Depending on the parameters given in the command line, a new layout is computed and written into an output file. The library is based on LEDA (currently versions 4.1 and 4.3) [43].
20
M. J¨ unger et al.
Fig. 11. A screenshot of AGD showing a mixed-model drawing and its options
The AGD library comes in two versions, a standard version that fits the need of most users, and the version agd opt with additional layout and optimization algorithms that need special purpose optimization software, namely ABACUS (version 2.3) and the LP-solver CPLEX (http://www.ilog.com). ABACUS is currently distributed via OREAS (http://www.oreas.com) and will soon become open source. The following list shows the currently available distributions. Linux • • • •
Standard AGD-R: g++ 2.95.3, LEDA 4.1 AGD-R OPT: g++ 2.95.3, LEDA 4.1, ABACUS 2.3, CPLEX 6.5+ The AGD server program Demo programs
Windows 95/98/NT • Standard AGD-R: MS Visual C++ 6.0 (multi-threaded), LEDA 4.1 • The AGD server program • Demo programs
AGD: A Library of Algorithms for Graph Drawing
21
KL contract BS contract
ZV contract
RL contract
normal contract UK contract
DL contract
estate agent
EL contract
product stock
condition stock
contract
person
price
account
contract holder / contract contract holder
mediator
mediator / event
booking
event
product event
commission / product event
commission
representative / event representative structure
Fig. 12. A quasi-orthogonal drawing of a data base graph
References 1. AGD User Manual (Version 1.2), 2000. Max-Planck-Institut Saarbr¨ ucken, Technische Universit¨ at Wien, Universit¨ at zu K¨ oln, Universit¨ at Trier. See also http://www.ads.tuwien.ac.at/AGD/. 2. C. Batini, E. Nardelli, and R. Tamassia. A layout algorithm for data-flow diagrams. IEEE Trans. Soft. Eng., SE-12(4):538–546, 1986. 3. C. Batini, M. Talamo, and R. Tamassia. Computer aided layout of entity relationship diagrams. J. Syst. and Softw., 4:163–173, 1984. 4. S. Bridgeman, G. Di Battista, W. Didimo, G. Liotta, R. Tamassia, and L. Vismara. Turn-regularity and optimal area drawings of orthogonal representations. Computational Geometry: Theory and Application, 16(1):53–93, 2000. 5. C. Buchheim, M. J¨ unger, and S. Leipert. A fast layout algorithm for k-level graphs. In J. Marks, editor, Graph Drawing 2000, volume 1984 of LNCS, pages 229–240. Springer-Verlag, 2000. 6. M. Chrobak and G. Kant. Convex grid drawings of 3-connected planar graphs. Internat. Journal on Comput. Geometry and Applications, 7(3):211–224, 1997. 7. E. G. Coffman and R. L. Graham. Optimal scheduling for two processor systems. Acta Informatica, 1:200–213, 1972. 8. H. De Fraysseix, J. Pach, and R. Pollack. How to draw a planar graph on a grid. Combinatorica, 10(1):41–51, 1990. 9. G. Di Battista and R. Tamassia. On-line planarity testing. SIAM J. Comput., 25(5):956–997, 1996. 10. G. Di Battista, R. Tamassia, and I. G. Tollis. Area requirement and symmetry display of planar upward drawings. Discrete Comput. Geom., 7:381–401, 1992. 11. M. Doorley. Automatic Levelling and Layout of Data Flow Diagrams. PhD thesis, University of Limerick, Ireland, 1995. 12. P. Eades and D. Kelly. Heuristics for reducing crossings in 2-layered networks. Ars Combinatoria, 21(A):89–98, 1986.
22
M. J¨ unger et al.
13. P. Eades and X. Lin. A new heuristic for the feedback arc set problem. Australian Journal of Combinatorics, 12:15–26, 1995. 14. P. Eades and N. Wormald. The median heuristic for drawing 2-layers networks. Technical Report 69, Dept. of Comp. Sci., University of Queensland, 1986. 15. T. Eschbach, W. G¨ unther, R. Drechsler, and B. Becker. Crossing reduction by windows optimization. In M.T. Goodrich and S.G. Kobourov, editors, Graph Drawing (Proc. GD ’02), LNCS, pages 285–294. Springer-Verlag, 2002. 16. Q.-W. Feng, R.-F. Cohen, and P. Eades. Planarity for clustered graphs. In P. Spirakis, editor, Algorithms – ESA ’95, Third Annual European Symposium, volume 979 of LNCS, pages 213–226. Springer-Verlag, 1995. 17. S. Fialko. Das planare Augmentierungsproblem. Master’s thesis, Universit¨ at des Saarlandes, Saarbr¨ ucken, 1997. 18. S. Fialko and P. Mutzel. A new approximation algorithm for the planar augmentation problem. In Proc. Ninth Annual ACM-SIAM Symp. Discrete Algorithms (SODA ’98), pages 260–269, San Francisco, California, 1998. ACM Press. 19. U. F¨ oßmeier and M. Kaufmann. Drawing high degree graphs with low bend numbers. In F.J. Brandenburg, editor, Graph Drawing ’95, volume 1027 of LNCS, pages 254–266. Springer, 1996. 20. T. Fruchterman and E. Reingold. Graph drawing by force-directed placement. Softw. – Pract. Exp., 21(11):1129–1164, 1991. 21. E. R. Gansner, E. Koutsofios, S. C. North, and K. P. Vo. A technique for drawing directed graphs. IEEE Trans. Softw. Eng., 19(3):214–230, 1993. 22. Graph Drawing Toolkit: An object-oriented library for handling and drawing graphs. http://www.dia.uniroma3.it/~gdt. 23. N. Gelfand and R. Tamassia. Algorithmic patterns for orthogonal graph drawing. In S. Whitesides, editor, Graph Drawing ’98, volume 1547 of LNCS, pages 138–152. Springer-Verlag, 1998. 24. M. Gr¨ otschel, M. J¨ unger, and G. Reinelt. On the acyclic subgraph polytope. Mathematical Programming, 33:28–42, 1985. 25. C. Gutwenger and P. Mutzel. Grid embedding of biconnected planar graphs. Max-Planck-Institut f¨ ur Informatik, Saarbr¨ ucken, Germany, 1997. 26. C. Gutwenger and P. Mutzel. Planar polyline drawings with good angular resolution. In S. Whitesides, editor, Graph Drawing ’98, volume 1547 of LNCS, pages 167–182. Springer-Verlag, 1998. 27. C. Gutwenger and P. Mutzel. A linear-time implementation of SPQR-trees. In J. Marks, editor, Graph Drawing 2000, volume 1984 of LNCS, pages 77–90. Springer-Verlag, 2000. 28. C. Gutwenger, P. Mutzel, and R. Weiskircher. Inserting an edge into a planar graph. In Proceedings of the Ninth Annual ACM-SIAM Symposium on Discrete Algorithms (SODA ’2001), pages 246–255, Washington, DC, 2001. ACM Press. 29. M. Himsolt. GML: A portable graph file format. Technical report, Universit¨ at Passau, 1997. See also http://www.uni-passau.de/Graphlet/GML. 30. M. J¨ unger, S. Leipert, and P. Mutzel. A note on computing a maximal planar subgraph using PQ-trees. IEEE Trans. on Computer-Aided Design, 17(7), 1998. 31. M. J¨ unger and P. Mutzel. The polyhedral approach to the maximum planar subgraph problem: New chances for related problems. In DIMACS Graph Drawing ’94, volume 894 of LNCS, pages 119–130. Springer, 1994. 32. M. J¨ unger and P. Mutzel. 2-layer straightline crossing minimization: Performance of exact and heuristic algorithms. J. Graph Algorithms and Applications (JGAA) (http://www.cs.brown.edu/publications/jgaa/), 1(1):1–25, 1996.
AGD: A Library of Algorithms for Graph Drawing
23
33. M. J¨ unger and P. Mutzel. Maximum planar subgraphs and nice embeddings: Practical layout tools. Algorithmica, 16(1):33–59, 1996. 34. M. J¨ unger and P. Mutzel. Automatic graph drawing: Exact optimization helps! MPS-SIAM Series on Optimization, 2003. to appear. 35. M. J¨ unger and S. Thienel. The ABACUS system for branch-and-cut and price algorithms in integer programming and combinatorial optimization. Software – Practice and Experience, 30:1325–1352, 2000. 36. G. Kant. Drawing planar graphs using the canonical ordering. Algorithmica, Special Issue on Graph Drawing, 16(1):4–32, 1996. 37. G. W. Klau. Quasi–orthogonales Zeichnen planarer Graphen mit wenigen Knicken. Master’s thesis, Universit¨ at des Saarlandes, Saarbr¨ ucken, 1997. 38. G. W. Klau, K. Klein, and P. Mutzel. An experimental comparison of orthogonal compaction algorithms. In Graph Drawing 2000, LNCS. Springer, 2001. 39. G. W. Klau and P. Mutzel. Quasi-orthogonal drawing of planar graphs. Technical Report MPI-I-98-1-013, Max–Planck–Institut f. Informatik, Saarbr¨ ucken, 1998. 40. G. W. Klau and P. Mutzel. Optimal compaction of orthogonal grid drawings. In G. P. Cornu´ejols, R. E. Burkard, and G. J. Woeginger, editors, Integer Programming and Combinatorial Optimization (IPCO ’99), volume 1610 of LNCS, pages 304–319. Springer, 1999. 41. T. Lengauer. Combinatorial Algorithms for Integrated Circuit Layout. John Wiley & Sons, New York, 1990. 42. C. Matuszewski, R. Sch¨ onfeld, and P. Molitor. Using sifting for k-layer crossing minimization. In J. Kratochvil, editor, Graph Drawing ’99, volume 1731 of LNCS, pages 217–224. Springer, 1999. 43. K. Mehlhorn and S. N¨ aher. The LEDA Platform of Combinatorial and Geometric Computing. Cambridge University Press, 1999. 44. P. Mutzel. A polyhedral approach to planar augmentation and related problems. In Paul Spirakis, editor, Algorithms – ESA ’95, Third Annual European Symposium, volume 979 of LNCS, pages 494–507. Springer, 1995. 45. O. Rauh and E. Stickel. Fallstudien zum Datenbankentwurf. Th. Gabler, Wiesbaden, 1997. 46. E. Reingold and J. Tilford. Tidier drawing of trees. IEEE Trans. Softw. Eng., SE-7(2):223–228, 1981. 47. P. Rosenstiehl and R. E. Tarjan. Rectilinear planar layouts and bipolar orientations of planar graphs. Discrete Comput. Geom., 1(4):343–353, 1986. 48. K. Sugiyama, S. Tagawa, and M. Toda. Methods for visual understanding of hierarchical systems. IEEE Trans. Syst. Man Cybern., SMC-11(2):109–125, 1981. 49. R. Tamassia. On embedding a graph in the grid with the minimum number of bends. SIAM J. Comput., 16(3):421–444, 1987. 50. R. Tamassia, G. Di Battista, and C. Batini. Automatic graph drawing and readability of diagrams. IEEE Trans. Syst. Man Cybern., SMC-18(1):61–79, 1988. 51. W. T. Tutte. How to draw a graph. Proc. London Mathematical Society, 13(3):743–768, 1963. 52. J. Q. Walker II. A node-positioning algorithm for general trees. Software – Practice and Experiments, 20(7):685–705, 1990. 53. T. Ziegler. Crossing Minimization in Automatic Graph Drawing. PhD thesis, Max-Planck-Institut f¨ ur Informatik, Saarbr¨ ucken, 2000.