AfJARE Vol 7 No 1 October 2012
Khalid HA Siddig, Babiker I Babiker
Agricultural efficiency gains and trade liberalization in Sudan
KHALID H A SIDDIG Department of Agricultural Economics, University of Khartoum, Sudan, and Agricultural and Food Policy Group, Hohenheim University, Germany
BABIKER I BABIKER Department of Agricultural Economics, University of Khartoum, Sudan
Abstract Traditional agriculture in Sudan occupies 60% of the cultivated land and employs 65% of the population engaged in agricultural production, but yields are low and productivity is threatened by drought and civil conflicts. Traditional agriculture has therefore contributed an average of only 16% to the total agricultural GDP in the last decade. This paper examines the implications of improving the efficiency of traditional agriculture in Sudan and assesses efficiency gains brought about by trade liberalization. Efficiency improvement experiments are implemented by augmenting the efficiency parameters of labor, capital and land in a computable general equilibrium (CGE) framework. The CGE model uses the most recent Sudanese social accounting matrix (SAM) that comprises 10 agricultural sectors. The results show that improving the agricultural efficiency improves the GDP, welfare, trade balance, output and competitiveness of agricultural exports. Moreover, the resilience of traditional agriculture in Sudan improves with liberalization. Keywords: agricultural efficiency; trade liberalization; Sudan social accounting matrix (SAM); computable general equilibrium (CGE) model JEL codes: E2; F1; F2; F3; F4; J3; J6
Au Soudan, l’agriculture traditionnelle occupe 60 pour cent des terres cultivées et emploie 65 pour cent de la population engagée dans la production agricole, mais le rendement est faible et la productivité est menacée par la sécheresse et les conflits civils. L’agriculture traditionnelle n’a donc représenté, en moyenne, que 16 pour cent de l’ensemble du PIB agricole lors des dix dernières années. Cet article examine les implications d’une amélioration de l’efficacité de l’agriculture traditionnelle au Soudan, et évalue les bénéfices en matière d’efficacité découlant
Corresponding author:
[email protected] 51
AfJARE Vol 7 No 1 October 2012
Khalid HA Siddig, Babiker I Babiker
d’une libéralisation du commerce. Des expérimentations en vue d’améliorer l’efficacité sont mises en place en augmentant les paramètres de l’efficacité du travail, du capital et des terres dans un modèle d’équilibre général calculable (EGC). Le modèle EGC utilise la matrice de comptabilité sociale (MCS) la plus récente du Soudan, qui comprend 10 secteurs agricoles. Les résultats montrent qu’une amélioration de l’efficacité agricole entraine une amélioration du PIB, du bien-être, de l’équilibre commercial, du rendement et de la compétitivité des exportations agricoles. De plus, la résilience de l’agriculture traditionnelle au Soudan se renforce avec la libéralisation. Mots-clés : efficacité agricole ; libéralisation du commerce; matrice de comptabilité sociale (MCS) du Soudan ; modèle d’équilibre général calculable (EGC) Catégories JEL : E2; F1 ; F2 ; F3 ; F4 ; J3 ; J6
1. Introduction Sudan is an agricultural country endowed with enormous resources, such as arable land, animal resources, fresh water sources and varying climates. These resources qualify Sudan to contribute significantly to the Arab world’s food security. Moreover, the extraction of oil since 1999 and the signing of the Comprehensive Peace Agreement (CPA) in 2005, which ended a 20-year civil war and helped establish peace in southern Sudan, have created a climate conducive to foreign investment. The volume of foreign investment, particularly from Arab countries, has thus increased considerably (MoI, 2009). Agriculture remains an important sector of Sudan’s economy. It has contributed an annual average of 45% to total GDP in the last 10 years. Moreover, agriculture and its related activities employ about 80% of the total labor force (Siddig, 2009a). Agriculture contributes to other activities as well, such as transport, agro-industries, commerce, trade and the service sector. These too account for a large share of the GDP. However, the contribution of agriculture to GDP has recently begun to deteriorate, falling from 48% in 1997 to 31% in 2009 (CBoS, 2007, 2008, 2009). Concerns have been raised about the decreased emphasis on the agricultural sector and the increased emphasis on natural oil resources, which is reminiscent of the famous Dutch Disease. The share of agriculture in total exports has deteriorated as a result of an increase in oil exports, dropping from 73% in 1998 to 5% in 2008. The decreasing share of agriculture in GDP will result in a need to increase food imports. This decline in the sector’s contribution to total GDP is of course only in percentage terms: the value of agricultural GDP has increased, implying that the agricultural sector is not deteriorating in value, but rather in importance since other sectors are growing faster. For example, the share of the industrial sector in total GDP grew from 15% in 1997 to 31% in 2008 (CBoS, 2007, 2008, 2009). Agriculture in Sudan is composed of three main farming systems: traditional rain-fed, mechanized rain-fed and irrigated. During the last 10 years, the traditional rain-fed sector has occupied an average of 60% of the total cultivated land and employed about 65% of the agricultural population. Nevertheless, yields in this sector are low, largely because of low 52
AfJARE Vol 7 No 1 October 2012
Khalid HA Siddig, Babiker I Babiker
technical efficiency. As a result, in the last 10 years its average contribution to the total agricultural GDP has been only about 16% (Siddig, 2009a). Traditional agriculture is very important in Sudan. Apart from contributing to the export sector, it provides staple food for the majority of subsistence farmers and other domestic consumers. In this paper we simulate improvements in the efficiency of major crops grown by the traditional sector and discuss the results in terms of their relevance for policymakers. To raise awareness of the links between efficiency and competitiveness, in a separate analysis we also assume unilateral trade liberalization. This assumption is also relevant to the Sudan’s ongoing negotiations to join the World Trade Organization (WTO).1 The study uses a single country computable general equilibrium (CGE) model together with a detailed social accounting matrix (SAM) for Sudan. The basic assumption behind our experiments using this model is that efficiency could be improved by improving labor skills, enhancing land use and farming practices and increasing capital flows into the sector and into relevant infrastructure. Land use can be improved through better use of inputs, better land preparation practices supported by additional capital, better agricultural practices, new technologies and the adoption of high yielding varieties. We argue that this paper is timely given the increased demand for renewable energy worldwide and the resulting increase in food prices.
2. Literature review The literature on efficiency in Sudan reveals that technical efficiency in Sudanese agriculture as a whole is low, especially in the traditional sector. Siddig et al. (2011) use a multiregional CGE model to investigate the national and regional implications of improving the efficiency of cereal and oilseed production in Sudan. They use the Africa database of the Global Trade Analysis Project (GTAP) (Hertel, 1997), which includes the Sudanese input/output table (IOT)2 as the underlying database representing several neighboring countries in the analysis, for example Egypt, Ethiopia and other sub-regions such as COMESA (Common Market of Eastern and Southern Africa) and MENA (Middle East and North Africa). The comprehensive literature review and the findings of the analysis in their study confirm the low technical efficiency of the agricultural sector. They also show that improvements in efficiency at the national and regional levels could have significant positive effects. In a global assessment of agricultural efficiency, Trueblood and Coggins (2001) use the Malmquist index to examine inter-country agricultural efficiency and productivity. This index can distinguish between two sources of productivity growth: technical efficiency and technical change. The results of their inter-country agricultural productivity and efficiency survey of 151 countries, including Sudan, covering the period 1961 to 1991, show that developing countries’ productivity declined over the study period. Table 1 shows the productivity weighted growth rates for aggregated groups of countries and regions from 1963 to 1990. 1
Sudan submitted its application to the WTO 15 years ago; however, progress is slow. In our analysis we were careful to ensure that our intended liberalization scenario was unilateral and did not consider any negotiation-related reductions of trade distortions. 2 For details of the construction of the Sudanese input/output table see Siddig (2009a). 53
AfJARE Vol 7 No 1 October 2012
Khalid HA Siddig, Babiker I Babiker
Table 1: Productivity weighted growth rates by geographical region (1963–1990) Regions
1963–1965 1966–1970 1971–1975 1976–1980 1981–1985 1986–1990
World
-2.3
-1.9
-2.4
-1.6
0.0
0.2
North America and Oceania
-0.4
1.4
0.7
2.8
2.6
2.7
Latin America
-3.2
-1.6
0
-0.7
0.0
0.9
Western Europe
1.6
2.5
1.3
1.5
2.9
2.4
Eastern Europe and the Soviet Union
-1.1
0.2
-0.8
-1.4
0.4
2.6
North Africa and the Middle East
-1.5
-1.7
-1.2
-2.2
1.3
1.5
Sub-Saharan Africa
-2.8
-2.3
-2.8
-1.1
0.5
2.1
Asia
-3.4
-1.9
-1.8
-1.2
0.6
-0.1
People’s Republic of China Source: Trueblood & Coggins (2001)
6.1
-0.8
-2.3
1.2
4.7
3.9
Sudan’s decrease in agricultural productivity compared with other countries like Afghanistan, Korea, Nicaragua, Nigeria and Turkey has been due to decreases in both efficiency and technology adoption. Trueblood and Coggins’s study (2001) finds that the mean technical efficiency score under the scale assumption from 1961 to 1990 was 0.67. The productivity profile of Sudan in their study reports a multifactor productivity of -1.21, an efficiency change of -1.21 and a technical change of -0.10. Table 2 shows a comparison between the productivity profiles of 19 selected countries, including Sudan, several African countries and countries from the Middle East, Europe and the US.
Table 2: Productivity profiles of selected countries
Country
Multifactor productivity
Efficiency change
Technical change
Argentina
-2.8
-2.5
-0.3
Bangladesh
-2.6
0.0
-2.6
Brazil
2.6
-0.1
2.8
Canada
4.1
0.5
3.7
China
1.3
0.9
0.4
Egypt
1.0
1.0
0.0
Ethiopia
-0.6
-1.3
0.7
Germany
-13.9
0.0
-13.9
Jordan
0.6
1.1
-0.5
Kenya
-1.5
0.0
-1.5
54
AfJARE Vol 7 No 1 October 2012
Country
Khalid HA Siddig, Babiker I Babiker
Multifactor productivity
Efficiency change
Technical change
Netherlands
1.6
0.2
1.3
South Africa
2.7
1.2
1.4
Sudan
1.6
0.6
1.0
Syria
3.7
0.6
3.2
Thailand
-0.6
0.0
-0.6
Turkey
0.2
0.0
0.2
Uganda
0.3
-0.7
0.9
United States
-1.0
-1.0
0.0
Zimbabwe
3.1
-0.3
3.4
Source: Trueblood & Coggins (2001)
At the crop level, several studies have addressed the efficiency of crop production in Sudan. Mohamed et al. (2008) find that the mean technical efficiency of sorghum production in western Sudan was 0.65, which is very close to the technical efficiency of 0.67 estimated for Sudan by Trueblood and Coggins (2001). In a similar study, Mohamed, Ahmed et al. (2008) find that the mean technical efficiency of sesame production in Kordofan State was 0.72. These studies indicate that sorghum and sesame farmers can increase their level of production by 35% and 28%, respectively, at the given set of inputs and technology. In a single country CGE model study of the effects of improvements in Sudan’s agricultural efficiency under an unstable exchange rate regime, Siddig (2009a) simulates several efficiency improvement experiments at different levels of devaluation or appreciation of the exchange rate. The results show that improving efficiency by 5% under a devalued Sudanese pound would improve Sudan’s exports, trade balance and GDP. However, the devaluation component of the experiment would have major inflationary effects, which would increase domestic prices for imported and domestic goods. This brief review of the literature shows that Sudan could improve the technical efficiency of its agricultural production, particularly in the traditional sector. Advanced technologies, improved seeds and better extension services could enhance the sector’s performance and hence people’s livelihoods. The sector’s contribution to agricultural GDP falls short relative to the proportion of the population depending on it: the traditional sector contributed an average of 15% to agricultural GDP between 2000 and 2006, while during the same period 70% of the total agricultural population depended on it. Efficiency improvements are needed not only to decrease costs to consumers and increase per capita incomes but also, at the macro-level, to contribute to development by helping the country to produce more food at a lower cost, improve nutrition and welfare and release resources to other sectors (Abbadi & Ahmed, 2006).
55
AfJARE Vol 7 No 1 October 2012
Khalid HA Siddig, Babiker I Babiker
3. Methodology and data A CGE model of Sudan was constructed and used for this study. This is an open-economy single-country model that treats the rest of the world as one region. The model allows for twoway trade, assuming that imports and domestic demand are imperfect substitutes, as are exports and domestic supply. Producers maximize profits subject to a Leontief production function, and households maximize utility with respect to interlinked linear expenditure systems (LES). The model is static in nature, solving for a new equilibrium within a single period, given a specified policy change. This is a reasonable approach for the objectives of this paper given that we lacked the data that would have allowed for a dynamic model. The paper analyzes the way the economy would adjust and the nature of the new equilibrium of the economy under certain efficiency and trade liberalization policy changes according to macroeconomic constraints and assumptions. The macroeconomic closure rules of the model and the specification of its factor markets3 are crucial to describe this convergence process properly and to determine the short-, medium- and long-term character of the model. Thus, within a certain period, under some given conditions and some applied policies, the shocked economy adjusts to achieve a new state of equilibrium. Generally, this approach to CGE modeling follows that of Dervis et al. (1982) and is based on the model developed at IFPRI and documented in Lofgren et al. (2002). To implement the intended simulations, a modified closure of the model is used. For the government balance of the model, the closure assumes that government savings are flexible, while tax rates, which represent a major component of government revenue, are fixed. Total government revenue (YG) is defined in equation (1) as the sum of revenues from taxes, production factors (land, labor and capital) and transfers from the rest of the world. Taxes ), taxes on factors of production ( ), value added tax include income tax ( ( , taxes on production ( ), import tariffs ), export taxes ( ), sales tax ( ) and transfers ( from the rest of the world ( ).
3
The factor market is the settings and assumptions governing the supply, demand and movement of production factors (land, labor and capital) across sectors. 56
AfJARE Vol 7 No 1 October 2012
Khalid HA Siddig, Babiker I Babiker
(1)
On the other hand, equation (2) defines the government consumption demand for commodity (c) ), which is the base-year quantity of government demand (qgc) multiplied by an as ( adjustment factor (GADJ) that is exogenous. Hence, the quantity of government consumption is fixed.
(2)
For the external balance, which is expressed in foreign currency, the real exchange rate is flexible, while foreign savings (the current account deficit) is fixed. Given that all other items are fixed in the external balance (transfers between the rest of the world and domestic institutions), the trade balance is also fixed. If, ceteris paribus, foreign savings are below the exogenous level, a depreciation of the real exchange rate would correct this situation by simultaneously reducing spending on imports (implying a decrease in import quantities at fixed world prices) and increasing earnings from exports (implying an increase in export quantities at fixed world prices). This could be described as: (import expenditure + transfers to the rest of the world = export revenue + transfers from the rest of the world + foreign savings), where foreign savings will adjust to assure equilibrium. The balance of payments equation that is expressed in foreign currency requires that total payments for imports and transfers from production factors to the rest of the world are equal to total receipts for exports plus foreign savings ( ) and transfers from the rest of the world, as shown in equation (3):
57
AfJARE Vol 7 No 1 October 2012
Khalid HA Siddig, Babiker I Babiker
(3)
where is the world imports price of commodity (c), is the imported quantity of commodity (c), is transfers to the rest of the world, is the world export are transfers from the rest of the world price times the quantity of commodity (c), are foreign savings. and Finally, for the savings-investment balance, the model assumes an investment-driven environment in which the value of base savings adjusts with the same percentage points as the investment (Siddig, 2009a). In the end, the model should close so that total savings and total investment are equal. As defined in equation (4), total savings is the sum of savings from domestic non-government institutions (e.g. private houses, rest of the world) (YI), the government (GSAV) and the rest of the world (FSAV), which is converted into domestic currency using the exchange rate. Total investment equals the sum of the values of fixed investment and . stock changes (
(4)
CGE models are known to be very demanding in terms of data requirements because they rely on the social accounting matrix (SAM). The SAM is a consistent data framework that captures information contained in the national income and product accounts and the input/output table (IOT) as well as the monetary flows between institutions within the economy under consideration (Pyatt & Round, 1985). Moreover, it is a self-controlled accounting framework because total receipts must equal total payments for each account contained within the square matrix. It follows the principle of double entry bookkeeping, presenting expenditures in the columns and receipts in the rows; that is, each entry represents a monetary flow from a column to a row (Pyatt & Round, 1985). To develop the SAM, an IOT is required. Unfortunately, it is difficult to find recent IOTs as they are normally developed only every few years because a large amount of data and effort is required. This problem is more severe in a developing country where advanced tools and experts for data collection, monitoring and processing are always scarce. In Sudan, the only IOT that was developed by the statistical authorities was produced in 1961. Nonetheless, the CGE model and SAM of this study benefits from the most recent IOT for Sudan which is developed and
58
AfJARE Vol 7 No 1 October 2012
Khalid HA Siddig, Babiker I Babiker
documented in Siddig (2009b) for the year 2004.4 The SAM and IOT from 2004 are based on data collected from the following official sources in Sudan: the Central Bureau of Statistics, Central Bank of Sudan, Ministry of Finance and National Economy, Ministry of Agriculture and Forestry and several relevant administrative departments such as customs and taxes. The Sudanese IOT and SAM contain data on 33 sectors and commodities including 10 agricultural sectors, 10 industrial sectors and 13 service sectors. Each activity in the SAM is assumed to produce only one commodity, i.e. there are 33 commodities. Production factors are disaggregated into labor, land and capital, and households are grouped into three income groups (high, middle and low). The government account is divided into four sub-accounts: current government accounts, tariffs, direct taxes and indirect taxes (excluding tariffs). In addition, the SAM includes accounts for saving-and-investment, enterprises and the rest of the world.
4. Simulation set-up and discussion of results To implement the intended changes in Sudan’s agricultural efficiency, two different simulation scenarios are required. Both scenarios assume that the efficiency parameters of the value added functions of the sectors for which efficiency will be improved are exogenously augmented. Sectors considered for the efficiency change are wheat, other cereals, cotton, oilseed and other crops. The level of augmentation in the efficiency parameters is 10% from the base value. More specifically, Scenario 1 simulates a 10% increase in the efficiency parameters of the value added functions of the predetermined sectors and is designed to reflect pure efficiency improvement effects, while Scenario 2 simulates a situation where import tariffs and production taxes are completely eliminated in addition to efficiency improvements. The two scenarios are introduced unilaterally against the status quo with respect to the rest of the world. The following sub-sections present and discuss the simulation results. The effects of the two efficiency improvement scenarios on the Sudanese economy are represented by macroeconomic indicators such as GDP, trade balance, government revenue and household income. The subsections describe the possible changes in the production structure, production factors demand and intermediate input use, and discuss the impact of the two scenarios on the sectoral output, trade balance and final demand and the consequences for producers and consumers reflected through welfare changes. 4.1 Effects of efficiency improvements and liberalization on macroeconomic indicators The results of the two scenarios show that improvements in agricultural efficiency would improve most macroeconomic indicators, including private income and consumption, total absorption, GDP, total imports and total exports. Scenario 1 (a 10% increase in efficiency) improves GDP, private income and consumption, government income and the overall balance of trade. This is attributed to the improvements in agricultural output shown in Table 3. The average change in the output across all sectors is 9%, which in turn increases factors income (i.e. returns to production factors) by an average of 5% and hence increases private income. When 4
The detailed Sudanese SAM for the year 2004 is available from the corresponding author on application. Detailed documentation of the SAM can also be found in Siddig (2009a). 59
AfJARE Vol 7 No 1 October 2012
Khalid HA Siddig, Babiker I Babiker
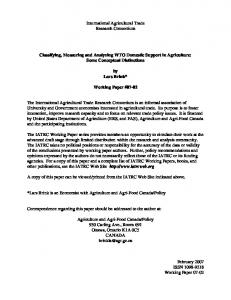
efficiency improvement is combined with trade liberalization (Scenario 2), the impact is even more apparent, especially in terms of net indirect tax revenue. The increase in net indirect tax revenue is driven by increased tariff revenue that is in turn a result of more imports. The efficiency scenario (Scenario 1) results in an increase in total exports of 3%, and when efficiency is combined with trade liberalization (Scenario 2) the increase in total exports is 7%. Scenarios 1 and 2 would increase total imports by 2.4% and 5.4%, respectively (Figure 1).
Figure 1: Effects of efficiency improvements and liberalization on macroeconomic indicators
4.2 Effects of efficiency improvements and liberalization on output and value added At the individual commodity level, increasing agricultural efficiency would lead to an average change in the domestic output of 3%, while the GDP at production factor cost would increase by 4%. These increases are further increased in Scenario 2 (Table 3). Scenarios 1 and 2 result in an increase in agricultural production, as a whole, by 9% and 10%, respectively. In the agricultural 60
AfJARE Vol 7 No 1 October 2012
Khalid HA Siddig, Babiker I Babiker
sector, export oriented crops show a significant increase in output under the two scenarios. Cotton, oilseed and forestry5 production increase the most (13%, 14% and 9%, respectively, under Scenario 1 and 19%, 18% and 13%, respectively, under Scenario 2). The results also show that all agricultural sectors that have competitive imports have lower increases in their output under Scenario 2 than under Scenario 1, while the reverse is true for export oriented sectors. Siddig (2009a) simulates a separate trade liberalization scenario and finds that liberalization would cause the output of most of the agricultural sectors to decline. Therefore, the increasing outputs of the different agricultural sectors under Scenario 2 (Table 3) confirm that agricultural efficiency improvements will enhance the competitiveness of Sudanese agricultural exports worldwide. Table 3: Effects of efficiency improvements and liberalization on sectoral output Produced commodities
Base value (Sudanese pounds: SG million)
Percentage changes from the base Scenario 1
Scenario 2
9.3 7.0 12.8 14.4
10.3 9.9 6.6 18.7 18.2 9.2 9.4 6.3 12.8 6.5 6.8
Agriculture (average) Wheat Cereals Cotton Oilseeds Other crops
42.0 183.6 106.7 93.1 765.6
Livestock Milk Forestry Sugar Fishery
1547.5 11.8 19.6 197.5 54.4
302.2 9.5 8.4 9.3 7.3 5.5
Industry (average) Food industries Other mining
241.2 801.1 65.1
-0.1 1.5 1.6
-0.7 3.9 1.4
Petrol Textile Wood Paper Chemical Metal Machinery Other manufactured products
924.1 82.7 14.7 35.7 286.4 90.7 71.2 40.7
-2.6 -0.3 0.1 0.2 2.1 -1.5 -1.4 -0.7
-0.6 -5.5 -2.6 -1.0 1.0 -1.9 -0.7 -0.9
Service (average) Electricity Water Construction
307.0 271.0 63.7 653.1
1.5 1.3 2.3 0.1
1.2 -1.7 1.2 -0.2
5
It is important to note that the major component of this sector is gum arabic, which is one of Sudan’s major agricultural exports. 61
AfJARE Vol 7 No 1 October 2012
Produced commodities
Khalid HA Siddig, Babiker I Babiker
Base value (Sudanese pounds: SG million)
Percentage changes from the base Scenario 1
Scenario 2
Trade Other transport Water transport Air transport Communication
643.2 676.3 39.8 41.1 75.6
1.1 1.1 2.0 2.0 1.6
1.7 0.3 2.5 2.2 2.0
Finance Insurance Business services Other services Public services
84.9 18.1 252.3 474.8 697.2
2.0 2.9 1.6 1.4 0.2
2.2 3.3 1.8 0.4 -0.4
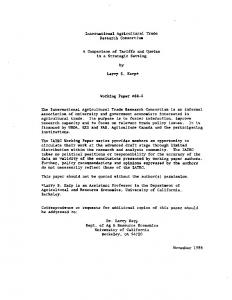
All service sectors benefit from the efficiency scenario (Scenario 1) with an average change of 2%, as well as from Scenario 2 with an average change of 1%. This could be attributed to shifts in production factors from agriculture to services, which is confirmed by the results of the total value added which is demanded by each sector as well as by the settings of the model which allow for limited amounts of production factors to move freely between sectors (Figure 2). Nonetheless, Scenario 2 would lead to a slight deterioration in the output of construction and public service sectors.
Figure 2: Effects of efficiency improvements and liberalization on value added
62
AfJARE Vol 7 No 1 October 2012
Khalid HA Siddig, Babiker I Babiker
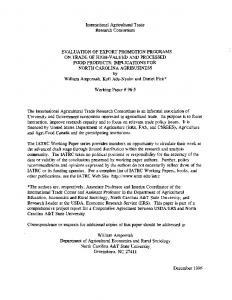
In the industrial sector, the liberalization scenario would lead to decreases in the output of all three sectors. This could be a result of the increased competitiveness of imports after the elimination of tariffs as well as the low influence from eliminating production taxes given their previously low impact in the Sudanese industrial sector. Moreover, the impact of efficiency improvements on the industrial sector is less in Scenario 2 because efficiency improvements in the agricultural sector only were included in the scenario. Thus, impacts on the industrial sector are indirect and confined to cheaper agricultural intermediate inputs. 4.3 Effects of agricultural efficiency improvements and liberalization on foreign trade A 10% increase in agricultural efficiency increases agricultural exports by an average of 20%, but reduces industrial exports by 5% and service exports by 8%. Figure 3 shows the average percentage changes in the agricultural, industrial and service sectors from Scenarios 1 and 2. The trade liberalization scenario would increase agricultural exports by an average of 27% and industrial exports by an average of 4%. These results reflect the tied relations between the agricultural and industrial sectors in Sudan, such as the tendency for agricultural exports to reduce the share of agricultural commodities used as intermediate inputs in the industrial sector. This is also confirmed by the declining domestic intermediate input quantities and the increasing intermediate input prices in the industrial sector. Furthermore, the 4% average increase in the industrial exports under Scenario 2 confirms the previous argument because liberalization of trade would allow imported intermediate inputs to be used (instead of domestic intermediates) by the industrial sector, provided that imported intermediates are less expensive than domestic intermediates.
Figure 3: Effects of efficiency improvements and liberalization on exports 63
AfJARE Vol 7 No 1 October 2012
Khalid HA Siddig, Babiker I Babiker
Siddig (2009a) combines efficiency improvements with various exchange rate policies in an attempt to address efficiency and agricultural trade. The paper simulates efficiency improvements first with exchange rate devaluation and then with appreciation. The results show that devaluation would lead efficiency improvements to increase exports from the agricultural, industrial and service sectors by 80%. However, the conclusions of this paper confirm the huge negative inflationary effects that devaluation would have on the welfare levels of the Sudanese people. On the import side, the reverse is more or less true, as depicted in Figure 4, which shows the average percentage changes in commodity imports of the agricultural, industrial and service sectors. Given a 10% increase in agricultural efficiency, agricultural imports would decline by 4% and industrial and service imports would increase by 5% each. Combining the efficiency improvement with trade liberalization would further boost industrial and service sector imports by 10% and 22%, respectively. Moreover, agricultural imports would increase by an average of 9%.
Figure 4: Effects of efficiency improvements and liberalization on imports
64
AfJARE Vol 7 No 1 October 2012
Khalid HA Siddig, Babiker I Babiker
Agricultural imports decline under Scenario 1 as result of the ability of the domestic agricultural output to satisfy a bigger amount of the domestic demand due to more efficient production capacities. In the industrial and service sectors, the increase in imports is explained by the fact that these sectors need more imports which are complementary to available agricultural inputs because of their increased output. Figure 5 shows the percentage changes in the imports of individual commodities under the two scenarios. Wheat is the only agricultural commodity that exhibits an increase in imports under Scenario 1, while imports of the other agricultural commodities decline. The largest decline in imports is for livestock, followed by cereals and milk products. The increase in wheat imports can be attributed to the combined factors of wheat being a non-export commodity and the increased domestic demand for wheat which resulted from substitution effects for wheat from higher incomes under both scenarios. Thus, increased domestic demand for wheat is met mainly by imports supplemented by domestic production.
Figure 5: Effects of efficiency improvements and liberalization on imports
The percentage changes in the imports of cereals and livestock products could be misleading in the context of imports because their value in the baseline database is very small and they are basically non-import commodities. With regard to Scenario 2, the results are similar for the 65
AfJARE Vol 7 No 1 October 2012
Khalid HA Siddig, Babiker I Babiker
direction of change, though the magnitude is higher. Imports of most of the industrial and service commodities will further increase due to tariff elimination. This is especially true for sugar imports since they have the highest trade protection (a 30% tariff rate) of all Sudanese commodities. Other commodities also have increased imports under the scenarios from their base import values. For example, imports of chemicals, food products and transport increase by 11%, 9% and 7%, respectively, under Scenario 1 and by 20%, 11% and 14%, respectively, under Scenario 2. 4.4 Effects of agricultural efficiency improvements and liberalization on welfare The two scenarios are found to enhance the welfare of the Sudanese people, which is represented by the household’s private income and equivalent variation (EV).6 The EV changes with respect to three categories of household (high, middle and low income) caused by the scenarios are shown in Figure (6). Scenario 2 (liberalization and efficiency together) results in a slightly greater increase in household welfare than Scenario 1 (efficiency only) for all three categories of household. In Scenario 1, at the producers’ level the increases in welfare are from efficiency gains and increases in factors income on the production side, while in Scenario 2 at the producers’ level the increases in welfare are from the elimination of production taxes that reduce the cost of production as well as from the removal of tariffs which increase the availability of cheaper intermediate imports.
Figure 6: Effects of efficiency improvements and liberalization on welfare
6
The EV values represented here are the percentage change from the base consumption values of households due to the two scenarios. 66
AfJARE Vol 7 No 1 October 2012
Khalid HA Siddig, Babiker I Babiker
At the consumer level, welfare gains are from increases in the two components of the domestic supply, namely domestic output and imports. The former is driven by efficiency improvements and the latter by liberalization, particularly tariff removal. In the context of the effects of efficiency improvements on the welfare level in Sudan, Siddig (2009a) investigates the impact of several combined efficiency experiments. Among the scenarios in this paper, the one that combines efficiency improvements with different exchange rate policies, in particular the appreciation of the Sudanese pound, is the most effective in boosting welfare levels in Sudan. However, this policy also has the most negative effect on Sudan’s balance of trade and current account balance.
5. Conclusions and policy implications This study aims to make policymakers in Sudan and other concerned people aware of the effectiveness and importance of improving the country’s agricultural efficiency. It also aims to demonstrate the importance of this issue in the context of Sudan’s ongoing negotiation process to join the WTO, by analyzing the way efficiency improvements and trade liberalization can improve the competitiveness of Sudan’s agricultural commodities. These two aims are introduced in the context of the CGE model based on a comprehensive literature review which confirms the low technical efficiency of Sudan’s agriculture, particularly in the traditional agricultural sector. Accordingly, the value added efficiency parameters of the agricultural sectors concerned are simulated to improve by 10% from the status quo in Scenario 1. Scenario 2 builds on Scenario 1 by also including an elimination of production taxes and tariffs to simulate changes which may result from trade liberalization. These changes could be realized by introducing modern farming techniques, high yielding varieties, advanced machinery and improved extension services. The results from the scenarios show that efficiency improvements can increase the GDP, private income and consumption and government income, besides improving the balance of trade. These positive changes are mainly attributed to improvements in agricultural output, which in turn increase factor income and hence individual welfare. Combining the efficiency improvements with trade liberalization shows the importance of efficiency improvements for increasing the competitiveness of Sudan’s agricultural commodities. Output and exports of Sudanese agricultural commodities would increase, benefiting from the more efficient use of production factors and cheaper intermediate and machinery imports. Therefore, the welfare level under the combined scenario is slightly higher for all households, low, middle and high income. It is also important to clarify the possible negative effects of trade liberalization on some industrial and service sectors, which is represented by the tariff removal in Scenario 2. The removal of tariffs leads to a decline in the output of most domestic industrial and service sectors, especially the food industry, chemicals and transport sectors. These output declines are mainly due to increases in imports after the tariff elimination since most industrial sectors in Sudan have 67
AfJARE Vol 7 No 1 October 2012
Khalid HA Siddig, Babiker I Babiker
a low level of production taxes in the base scenario. In Scenario 2, efficiency is improved in the agricultural sector only, while it eliminates production taxes and imports tariff in all sectors. This confirms the need to assess the importance of efficiency improvements in the industrial sector to face challenges of trade liberalization or to draw red lines for Sudan’s negotiators in the WTO with respect to tariff cuts for the industrial and services sector. This paper recommends that technical efficiency in the Sudanese agricultural sector be improved by enhancing labor skills. This would require more effective extension services and more advanced farming practices such as using agricultural machinery and improved seeds. Efficiency improvements could lead to better utilization of the huge portion of agricultural land devoted to traditional agriculture. Moreover, improving the productive capacity of subsistence farmers by public investment in rural infrastructure could increase additional private and foreign investments. Accordingly, continuing to make the environment more favorable for investment in the agricultural sector is crucial. In particular, the recent investment flows need to be fairly distributed throughout the country, especially in rural areas. In the context of trade liberalization, this study demonstrates that efficiency improvements in agriculture improve the competitiveness of agricultural commodities. However, improving the competitiveness of the industrial and service sectors, although not specifically investigated in this paper, is critical. Further investigation is required, especially with respect to tariff cuts that the Sudanese negotiating team could consider acceptable or at least not harmful to domestic industries.
References Abbadi, K & Ahmed, A, 2006. Brief overview of Sudan economy and future prospects for agricultural development. Paper presented at the Khartoum Food Aid Forum, 6–8 June, Khartoum. CBoS (Central Bank of Sudan), 2007. 47th Annual Report. http://cbos.gov.sd/sites/default/files/annual07.pdf Accessed 26 September 2010. CBoS (Central Bank of Sudan), 2009. 49th Annual Report. http://cbos.gov.sd/sites/default/files/annual_09_0.pdf Accessed 26 September 2010. CBoS (Central Bank of Sudan), 2008. 48th Annual Report. http://cbos.gov.sd/sites/default/files/annual_08.pdf Accessed 26 September 2010. Dervis, K, De Melo, J & Robinson, S, 1982. General Equilibrium Models for Development Policy. Cambridge University Press, Cambridge. Hertel, T, 1997. Global Trade Analysis: Modeling and Applications, Cambridge University Press, New York. Lofgren, H, Harris, R & Robinson, S, 2002. A Standard Computable General Equilibrium (CGE) Model in GAMS. Microcomputers in Policy Research, Vol. 5. IFPRI (International Food Policy Research Institute),Washington, DC. Pyatt, G & Round, JI, 1985. Social Accounting Matrices: A Basis for Planning. World Bank, Washington, DC.
68
AfJARE Vol 7 No 1 October 2012
Khalid HA Siddig, Babiker I Babiker
Mohamed, E, Ahmed, A & Siddig, K, 2008. Technical efficiency of producing sorghum in Kordofan State: Case study Habila mechanized rain-fed sector. Bangladesh Journal of Agricultural Sciences 35(1), 17–22. Mohamed, EI, Ahmed, A, Siddig, K & Pervin, S, 2008. Technical efficiency measurement in sesame production using stochastic production frontier in Nuba Mountains in Sudan. Bangladesh Society for Agricultural Science and Technology 5(1&2), 209–12. MoI (Ministry of Investment), 2009. Foreign investment flows to Sudan by country. Unpublished report, Ministry of Investment, Sudan. Siddig, K, 2009a. Macroeconomy and agriculture in Sudan: Analysis of trade policies, external shocks, and economic bans in a computable general equilibrium approach. Farming & Rural Systems Economics 108. Siddig, K, 2009b. GTAP Africa Data Base Documentation – Chapter 2 I-O Table: Sudan. www.gtap.agecon.purdue.edu/access_member/resources/res_display.asp?RecordID=2986 Accessed 1 June 2009. Siddig K, Ahmed A & Woldie G, 2011. National and regional implications of agricultural efficiency improvement in Sudan. Journal of Development and Economic Policies 13(2), 5–26. Trueblood, M & Coggins, J, 2001. Inter-country agricultural efficiency and productivity. www.apec.umn.edu/faculty/jcoggins/documents/malmquist.pdf Accessed 20 December 2008.
69