air changes per hour â an estimator of building ventilation rate. AES .... forced expiratory volume â a measure of lung response to air pollutants. FGD ..... Cr, Cu, Hg, Ni, Pb, Zn, PM10, Benzene, HCl, HF, PAHs, ...... seen on a flag or wind-vane.
Air Pollution
A one stop, comprehensive textbook, covering the three essential components of air pollution science. This third edition has been updated with the latest developments, especially the inclusion of new information on the role of air pollutants in climate change. The authors give greater coverage to the developing economies around the world where air pollution problems are on the rise. The third edition continues to cover a wide range of air quality issues, retaining a quantitative perspective. Topics covered include: • • • • • •
gaseous and particulate air pollutants measurement techniques meteorology and dispersion modelling mobile sources indoor air effects on plants, materials, humans and animals.
Moving away from classical toxic air pollutants, there is a chapter on climate change and another on the depletion of stratospheric ozone. A special feature of this new edition is the inclusion of a fresh chapter on air pollution mitigation by vegetation, mainly its role in maintaining a sustainable urban environment. The book is recommended for upper-level undergraduate and postgraduate courses specialising in air pollution, both for environmental scientists and engineers. The new material included in this edition extends its usefulness for practitioners in consultancies or local authorities. Abhishek Tiwary is a Chartered Scientist and a Chartered Environmentalist involved in issues related to urban air pollution management and sustainable development. He is based at the University of Newcastle, UK. Jeremy Colls is Professor Emeritus in Atmospheric Environment at the University of Nottingham, UK. He authored the previous two editions of Air Pollution.
Air Pollution
Measurement, modelling and mitigation Third edition
Abhishek Tiwary and Jeremy Colls
First edition published 1997 by E. & F.N. Spon Second edition published 2002 by Spon Press This edition published 2010 by Routledge 2 Park Square, Milton Park, Abingdon, Oxon OX14 4RN Simultaneously published in the USA and Canada by Routledge 270 Madison Avenue, New York, NY 10016, USA Routledge is an imprint of the Taylor & Francis Group, an informa business This edition published in the Taylor & Francis e-Library, 2009. To purchase your own copy of this or any of Taylor & Francis or Routledge’s collection of thousands of eBooks please go to www.eBookstore.tandf.co.uk. © 2010 Abhishek Tiwary and Jeremy Colls All rights reserved. No part of this book may be reprinted or reproduced or utilised in any form or by any electronic, mechanical, or other means, now known or hereafter invented, including photocopying and recording, or in any information storage or retrieval system, without permission in writing from the publishers. This publication presents material of a broad scope and applicability. Despite stringent efforts by all concerned in the publishing process, some typographical or editorial errors may occur, and readers are encouraged to bring these to our attention where they represent errors of substance. The publisher and author disclaim any liability, in whole or in part, arising from information contained in this publication. The reader is urged to consult with an appropriate licensed professional prior to taking any action or making any interpretation that is within the realm of a licensed professional practice. British Library Cataloguing in Publication Data A catalogue record for this book is available from the British Library Library of Congress Cataloging-in-Publication Data Tiwary, Abhishek. Air pollution: measurement, modelling, and mitigation / Abhishek Tiwary and Jeremy Colls.—3rd ed. p. cm. Rev. ed. of: Air pollution / Jeremy Colls. 2002. Includes bibliographical references and index. 1. Air—Pollution. I. Colls, Jeremy. II. Colls, Jeremy. Air pollution. III. Title. TD883.A4713 2010 363.739’2—dc22 ISBN 0-203-87196-0 Master e-book ISBN
ISBN10: 0- 415-47933-9 (hbk) ISBN10: 0- 415-47932-0 (pbk) ISBN10: 0- 203-87196-0 (ebk) ISBN13: 978-0- 415-47933-2 (hbk) ISBN13: 978-0- 415-47932-5 (pbk) ISBN13: 978-0- 203-87196-6 (ebk)
2009007820
To Our Family & Friends
Contents
Acronyms and abbreviations Preface
xi xix
1 Air pollutants: sources and control of gases 1.1 1.2 1.3 1.4 1.5 1.6 1.7 1.8 1.9
1
Units for expressing pollutant concentration The basic atmosphere 5 The vertical structure of the atmosphere 8 Anthropogenic emissions 11 Primary emission summary 35 Adsorption and absorption of gases 37 Other air pollutants 38 Secondary gaseous pollutants 43 Emission inventories 51
2
2 Air pollutants: particulates 2.1 2.2 2.3 2.4 2.5 2.6 2.7
Particle terminology 54 Particle size distributions 55 Aerosol mechanics 63 Particle sources 78 Abatement of primary particle emissions Secondary particles 86 Trends in particle emissions 88
54
82
3 Mobile sources 3.1 3.2 3.3 3.4 3.5
91
Motor vehicle emissions 93 Train emissions 129 Shipping emissions 130 Aircraft emissions 131 Different modes of transport 137
4 Measurement of gases and particles 4.1 4.2
Methods of describing pollutant concentration Sampling requirements 140
139 139
viii
Contents
4.3 4.4 4.5 4.6 4.7 4.8 4.9 4.10 4.11
Gas sampling 141 Gas concentration measurement 147 Quality control 157 Particle sampling 160 Particle measurement methods 162 Chemical composition of aerosol 175 Measurement of coarse particle deposition 178 Emission measurement from stationary sources 181 Measurement uncertainty 188
5 Concentrations and deposition 5.1 5.2 5.3 5.4 5.5 5.6 5.7
Gaseous pollutants 191 Patterns of occurrence 198 Particulate matter 205 Dry deposition of gases 207 Wet deposition 212 Total deposition and budgets 220 Analysis of an air pollution episode
191
221
6 Meteorology and modelling 6.1 6.2 6.3 6.4 6.5 6.6 6.7 6.8
Meteorological factors 225 Dispersion models 237 Gaussian dispersion theory 238 Dispersion theory in practice 249 Dispersion of vehicle emissions and exposure modelling Receptor models 258 Box models 259 Statistical models 260
7 Analysis of an air-quality data set 7.1 7.2 7.3 7.4 7.5 7.6 7.7
256
261
The raw data set 261 Period averages 264 Roses 265 Diurnal variations 267 Short-term events 270 Frequency distributions 271 Further statistical analyses 274
8 Indoor air quality 8.1 8.2 8.3 8.4
225
Building ventilation 276 Combustion 281 Indoor organics sources 284 Bioaerosols 286
275
Contents
8.5 8.6 8.7
Sick building syndrome 290 Odour and ventilation 291 Clean rooms 291
9 Mitigation of air pollution: the role of vegetation 9.1 9.2 9.3 9.4
Forest canopy intervention 294 Particle deposition to vegetation 299 Filter strips 301 Practical concerns of vegetation intervention
10 Effects on plants, visual range and materials 10.1 10.2 10.3
355
387
427
Ozone in the stratosphere 427 Destructive chemistry 433 The current situation 439 Ozone and ultraviolet 442 Clothing protection from UV 450
14 Standards and legislation 14.1 14.2 14.3 14.4 14.5 14.6
317
Our radiation environment 388 The role of gases 393 The role of aerosol 405 Gases and aerosol combined 410 Future scenarios 412 The main predictions 413 Feedbacks 420 Global responses 422
13 Ozone depletion and ultraviolet radiation 13.1 13.2 13.3 13.4 13.5
307
Responses of people 355 Effects on other animals 382
12 Greenhouse gases and climate change 12.1 12.2 12.3 12.4 12.5 12.6 12.7 12.8
293
Effects on plants 317 Visual range 344 Damage to materials 351
11 Responses of humans and other animals 11.1 11.2
ix
UK legislation 458 EU air-quality legislation 462 UNECE 464 World Health Organization (WHO) 466 EU industrial emission legislation 467 EU vehicle emissions 470
457
x
Contents
14.7 14.8 14.9 Index
US legislation 475 Legislation in the Asian region Air pollution indices 486
483
489
Acronyms and abbreviations
AA AAS ACE ACH AES ACGIH AMIS ANC AOT40 APHEA AQCD AQI AQMA AQRV AQS ARN AR4 AUN BAF BaP BART BATNEEC BC BCC BFO BPEO BPM BS Btu BTX
ambient air – usually refers to plants growing in the open for comparison with those in chambers atomic absorption spectroscopy Aerosol Characterisation Experiment air changes per hour – an estimator of building ventilation rate atomic emission spectroscopy American Conference of Government Industrial Hygienists air management information system acid neutralising capacity accumulation over threshold – the measure currently favoured by UNECE for estimating ozone impact on plants Air Pollution and Health: A European Approach Air Quality Criteria Document (US) Air Quality Index Air Quality Management Area (UK) Air Quality Related Value (US) Air Quality Standards (US) Automated Rural Network Assessment Report 4 – referred to the fourth assessment report of the IPCC Automated Urban Network biological amplification factor – used to describe the overall response of biological systems to ozone changes benzo[a]pyrene Best Available Retrofit Technology Best Available Techniques (or Technology) not Entailing Excessive Cost black carbon basal cell carcinoma bunker fuel oil Best Practicable Environmental Option Best Practicable Means – the long-established UK philosophy for pollution control British Standard British thermal unit – unit of energy used in power, steam generation, heating and air conditioning industries benzene, toluene and xylene
xii
Acronyms and abbreviations
BUN BVOC CAA CAAA CAFE CAI CALINE CARB CCN CE CEC CEH CF CFC CFD CHESS CHP CLRTAP CNC COH COHb COMEAP COP COPD CORINAIR CPB CPC CPCB CPF CRT DALR DALY DDT DEFRA DEP DERV DI DIAL DMA DME
Basic Urban Network – urban sites in the UK national network of 24-hour air pollutant samplers biogenic volatile organic carbon Clean Air Act (US) Clean Air Act Amendments (US) Clean Air for Europe Clean Air Initiative – mainly used in the context of air pollution in Asia California Line Source Model – one of the most widely used dispersion models for vehicle emissions California Air Resources Board cloud condensation nuclei – the particles on which condensation initially occurs to form cloud droplets collection efficiency Commission of the European Communities Centre for Ecology and Hydrology, UK charcoal-filtered – an OTC supplied with cleaned air chlorofluorocarbon – family of chemicals responsible for depleting ozone in the stratosphere computational fluid dynamics Community Health and Surveillance System (US) combined heat and power – used in the context of thermal energy generation Convention on the Long Range Transport of Air Pollutants condensation nucleus counter coefficient of haze carboxyhaemoglobin – produced when blood haemoglobin absorbs CO Committee on the Medical Effects of Air Pollutants (UK) Conference of Parties (for UNFCCC) chronic obstructive pulmonary disease CORe Inventory of AIR emissions – the EU programme to collect and map emissions data for all significant sources of eight gaseous pollutants Canyon Plume Box Model for calculating dispersion in urban areas condensation particle counter Central Pollution Control Board (India) clothing protection factor continuously regenerating trap dry adiabatic lapse rate – the rate of decrease of temperature with height in the atmosphere applicable to a parcel of air that contains no liquid water. Value 9.8 °C km–1 disability adjusted life years dichloro-diphenyl-trichloroethane – one of the synthetic pesticides Department for the Environment, Food and Rural Affairs (UK) diesel exhaust particles diesel engine road vehicle – diesel fuel used for road vehicles direct injection differential absorption LIDAR differential mobility analyser dimethyl ether
Acronyms and abbreviations
DMS DOAS DOC DoE DOM DPF DRAM DTLR DU DVI EA EAA EC ECD ECE EDAX EDU EEA EEC EER EESC EF EGR EIONET ELISA ELPI ELR ELV EMEP ENSO EPA EPA EPAQS ERBS ESP ETC/AQ ETS EU EUDC EUROAIRNET FACE FAR
xiii
dimethyl sulphide – organic sulphur compound released from marine phytoplankton that is eventually oxidised to sulphur dioxide and particulate sulphate in the atmosphere differential optical absorption spectroscopy diesel oxidation catalyst Department of the Environment (UK) dissolved organic matter diesel particulate filter direct-reading aerosol monitor Department for Transport, Local Authorities and the Regions (UK) Dobson unit – for the column depth of ozone in the atmosphere Dust Veil Index Environment Agency (UK) electrical aerosol analyser European Community electron capture detector Economic Commission for Europe (same as UNECE) energy dispersive analysis of X-rays ethylenediurea – a chemical that protects plants from ozone European Environment Agency European Economic Community erythemally effective radiation – sun-burning potential of a given radiation environment equivalent effective stratospheric chlorine emission factor – e.g. g km–1 exhaust gas recirculation European Environmental Information and Observation Network enzyme-linked immunosorbent assay electrostatic low pressure impactor environmental lapse rate – the vertical profile of temperature in the atmosphere emission limit value European Monitoring and Evaluation Programme El Niño Southern Oscillation Environmental Protection Act (UK) Environmental Protection Agency (USA) Expert Panel on Air Quality Standards (UK) Earth Radiation Budget Satellite electrostatic precipitator European Topic Centre on Air Quality environmental tobacco smoke – the combination of MTS and STS that makes up the atmospheric load European Union extra-urban drive cycle (EC) European Air Quality Monitoring Network Free-Air Carbon Dioxide Enrichment – the system developed in the US for elevating the CO2 concentration above field crops First Assessment Report (by IPCC on climate change)
xiv
Acronyms and abbreviations
FEAT FEV FGD FID FTIR FTP GC GCM GCTE GHG GVW GWP HAP Hb HCB HCFC HDV HEPA HFC HGV HMIP HPLC HVAC IARC ICAO ICP IDI IGAC INDOEX IPC IPCC IPPC IR ISO LA LAI LAPC LAQM LCA LCPD LDV LEV LGV LIDAR LNG
Fuel Efficiency Automobile Test – an optical gas sensor that scans across the road width forced expiratory volume – a measure of lung response to air pollutants flue gas desulphurisation – a range of chemical process plant that strips sulphur dioxide from flue gases before they are released to the atmosphere flame ionisation detector Fourier transform infrared Federal Test Program (US) gas chromatography General Circulation Model Global Change and Terrestrial Ecosystems project greenhouse gas gross vehicle weight global warming potential hazardous air pollutants (US) haemoglobin hexachloro benzene – a pesticide hydrochlorofluorocarbon – substitute for CFCs heavy duty vehicle – such as a truck high efficiency particulate air hydrofluorocarbon – substitute for CFCs heavy goods vehicle Her Majesty’s Inspectorate of Pollution (UK) high pressure liquid chromatography heating, ventilating and air conditioning International Agency for Research on Cancer International Civil Aviation Organization inductively coupled plasma indirect injection International Global Atmospheric Chemistry project The Indian Ocean Experiment – an international study conducted to assess the anthropogenic aerosols released from the Asian region Integrated Pollution Control Inter-Governmental Panel on Climate Change Integrated Pollution Prevention and Control infrared International Organization for Standardization local authority (UK) Leaf Area Index Local Air Pollution Control Local Air Quality Management (UK) Life Cycle Assessment Large Combustion Plant Directive (EC) light duty vehicle – such as a van Low Emission Vehicle program (US) light goods vehicle light detection and ranging liquefied natural gas
Acronyms and abbreviations
LRTAP LTO MACT MATES MDO MFA MMT MEET MOUDI MRGR MSW MTBE MTS NAA NAAQS NAEI NADP NAME NAPAP NAQS NCLAN NETCen NF NMHC NMMAPS NMVOC NOTLINE NRPB OAF OCD ODP ODS OECD OTC PAH PAMS PAN PAR PBDE
xv
long-range transboundary air pollution landing and take-off Maximum Achievable Control Technology (US) Multiple Air Toxics Exposure Study marine diesel oil material flow analysis methylcyclopentadienyl manganese tricarbonyl – organometallic manganese compound added to maintain the combustion properties of petrol Methodology for Calculating Transport Emissions and Energy Consumption project micro-orifice uniform deposit impactor mean relative growth rate – a measure of plant or animal vitality municipal solid waste methyl tertiary butyl ether mainstream tobacco smoke – drawn from the cigarette during puffing neutron activation analysis National Ambient Air Quality Standards (US) National Atmospheric Emissions Inventory (UK) National Atmospheric Deposition Program (US) Nuclear Accident ModEl National Acid Precipitation Assessment Program – the major coordinated programme in the US to understand the processes of, and responses to, acid rain National Air Quality Strategy (UK) National Crop Loss Assessment Network – the US experimental programme on plant responses to air pollutants National Environmental Technology Centre non-filtered – an OTC supplied with ambient air non-methane hydrocarbons – a sub-category of VOCs, defined by compounds containing H and C but excluding methane because of its relatively high background concentration in the atmosphere National Morbidity, Mortality and Air Pollution Study (US) non-methane volatile organic carbon University of Nottingham Line Source Dispersion Model National Radiological Protection Board optical amplification factor – used to describe the response of UV to ozone changes ozone column depth ozone depletion potential ozone depleting substances Organisation for Economic Co-operation and Development open-top chamber – field chamber for plant pollution exposure polycyclic aromatic hydrocarbons – a family of carcinogenic chemicals, including benzopyrenes particle analysis by mass spectroscopy peroxyacyl nitrate – an irritant gas formed by the same photochemical processes as ozone photosynthetically active radiation – in the waveband 400–700 nm polybrominated diphenyl ether – one of the persistent organic pollutants
xvi
Acronyms and abbreviations
PBL PCA PCB PCDF PCDD PCR PEC PEM PIB PIXE PM PM10 PM2.5 POP ppb ppm ppt PSC PSI PTFE PVC QALY QA/QC RAF RAG RCEP Re RH RIOPA RPK RVP SAGE SALR SAR SBLINE SBS
planetary boundary layer – the vertical region of the Earth’s atmosphere from ground level up to about 1500 m within which the physical and chemical interactions with the surface mainly occur principal component analysis polychlorinated biphenyls – carcinogenic pollutants released from PCB handling and poor PCB incineration polychlorinated dibenzofurans (known as furans for short) – a toxic pollutant produced in small quantities by incinerators polychlorinated dibenzodioxins (known as dioxins for short) – as above polymerase chain reaction particulate elemental carbon proton exchange membrane – used in the context of hydrogen fuel cells polyisobutylene – a 2-stroke petrol additive to reduce smoke production proton-induced X-ray emission particulate matter particulate matter having an aerodynamic diameter less than 10 µm particulate matter having an aerodynamic diameter less than 2.5 µm persistent organic pollutant parts per billion, or parts per 109, by volume parts per million, or parts per 106, by volume parts per trillion, or parts per 1012, by volume polar stratospheric cloud – ozone depletion reactions occur on the surfaces of cloud particles Pollution Standards Index (US) polytetrafluorethylene – an inert plastic used for sample pipes when reactive gases such as ozone are present polyvinyl chloride quality-adjusted life years – method for assessing benefits of air quality improvements quality assurance/quality control reactivity adjustment factor – a measure of the ozone-forming potential of different fuel mixtures radiatively active gas Royal Commission on Environmental Pollution (UK) Reynolds number relative humidity Relationships of Indoor, Outdoor and Personal Air – US project on seasonal concentrations of air pollutants in homes revenue passenger kilometres Reid Vapour Pressure – used in the context of estimating the evaporative losses of fuel Stratospheric Aerosol and Gas Experiment saturated adiabatic lapse rate – the rate of decrease of temperature with height in the atmosphere applicable to a parcel of air that contains liquid water (typical range 4–9.8 °C km–1) Second Assessment Report (by IPCC on climate change) University of Nottingham (Sutton Bonington campus) Vehicle Emission and Dispersion Model sick building syndrome
Acronyms and abbreviations
SCA SCC SCR SED SEM SI SIP SMPS SOA SOF SOI SOS SPM SRES SST Stk STP STS SUM60 SUV SVP TAR TEA TEF TEAM TEM TEOM TEQ THC TOE TOMPS TRL TSP TWC UARS UFORE ULPA ULSP UNECE
xvii
specific collection area squamous cell carcinoma selective catalytic reduction – used in abatement of nitrogen oxides standard erythemal dose (of UV radiation) scanning electron microscopy Système International – the internationally recognised system of physical units based on the metre, kilogram, second and Coulomb State Implementation Plan (US) scanning mobility particle sizer secondary organic aerosols soluble organic fraction Southern Oscillation Index Southern Oxidants Study (US) suspended particulate matter Special Report on Emission Scenarios – referred to the IPCC predicted scenarios for GHG emissions supersonic transport Stokes’ number Standard temperature and pressure – 0 °C and 1 atmosphere sidestream tobacco smoke – released from the cigarette between puffing sum of hourly-mean ozone concentrations > 60 ppb sport utility vehicle saturated vapour pressure Third Assessment Report (by IPCC on climate change) triethanolamine – a strong absorbent for NO2 toxic equivalent factor Total Exposure Assessment Methodology study transmission electron microscopy tapered element oscillating microbalance toxic equivalent – a standardisation of the toxicity of TOMPS total hydrocarbon tonnes oil equivalent toxic organic micro-pollutants – generic term that includes PCDD, PCDF and other minority chemicals with recognised toxicity at low (ppt) concentrations Transport Research Laboratory (UK) total suspended particulate – all the particles in the air, regardless of diameter three-way catalyst – converts the three harmful gases in petrol-engined vehicle exhaust to carbon dioxide, nitrogen and water Upper Atmosphere Research Satellite Urban Forest Effects – a model, originally developed by the US Department of Agriculture, to assess forest canopy pollution uptake potential ultra low penetration air ultra low sulphur petrol United Nations Economic Commission for Europe – a group of countries, larger than the EU and including the United States, that has a wide-ranging remit to organise joint ventures in European affairs
xviii
Acronyms and abbreviations
UNEP UNFCC USEPA UV VEI VOC
WHO WID WMO WRI WTP XRF ZEV
United Nations Environmental Programme United Nations Framework Convention on Climate Change see EPA ultraviolet radiation, conventionally defined as occurring in the wavelength range below 400 nm. Subdivided into UVA, UVB and UVC Volcanic Explosivity Index volatile organic compound – molecules, mainly containing hydrogen and carbon, that are released from sources such as motor fuels and solvents. They are toxic in their own right and serve as precursors for ozone formation World Health Organization Waste Incineration Directive World Meteorological Organization World Resources Institute willingness to pay – method for assessing the benefits of air quality improvements X-ray fluorescence zero emission vehicles – presumed to be electric, and required by law to make up a certain proportion of the fleet in California
Preface
Air pollution has been with us since the first fire was lit, although different aspects have been important at different times. While many of us would consider air pollution to be an issue that the modern world has resolved to a greater extent, it still appears to have considerable influence on the global environment. In many countries with ambitious economic growth targets the acceptable levels of air pollution have been transgressed, resulting in an urban skyline characterised by smog and dust clouds. Recent pictures of Beijing’s skyline during the 2008 Summer Olympics bear the hallmarks of this degradation, and reinforce the imperative need to assess and mitigate the underlying causes more effectively for long-term benefits to the resident populations. According to the World Bank, in 2007 air pollution cost about 3.8% of China’s gross domestic product, mainly from diseases and loss of lives. In several Indian cities with population of over a million, air pollution levels exceed World Health Organization standards. It has been estimated that in India alone about 500,000 premature deaths are caused each year by indoor air pollution, mainly affecting mothers and their children under 5 years of age. Serious respiratory disease-related problems have been identified for both indoor and outdoor pollution in major cities of several countries. There is now a growing body of literature linking air pollution with short- and long-term effects on human health. On a small scale, point source releases of individual pollutants can cause localised responses ranging from annoyance to physical injury. In urban areas, high concentrations of gases and particles from coal combustion and, in more recent decades, motor vehicles have produced severe loss of air quality and significant health effects. On a regional scale, tropospheric ozone formation and acid deposition have been the major threats. Finally, emissions of carbon dioxide and other radiatively active gases, together with stratospheric ozone depletion, represent planet-scale assaults on the quality of our atmospheric environment. In the Western world, stringent environmental legislations have been able to overcome the erstwhile ‘conventional’ air pollution problems of foul and sooty skylines reminiscent of the industrial revolution. In addition, the recent fuel crisis and growing awareness of sustainable development have also contributed to reduction in aerial emissions of noxious pollutants. It may be said that the lesson has been learned by a relative few but in order to restore air quality that we need for our very survival the extent of the crisis has to be appreciated and addressed by the population at large. This book is designed to cover the whole gamut of air pollution issues, in most cases from a quantitative standpoint. The revised third edition has brought the information up to date with changes in legislation and air pollution science. In Chapters 1 and 2, the major sources of gaseous and particulate air pollution, together with an outline of possible control measures, are described. Mobile sources, which have taken over from stationary emitters as the major threat to local air quality, are specifically addressed in Chapter 3. Chapter 4 describes some commonly used methods for measuring the most wide-spread air pollutants. The temporal
xx
Preface
and geographical variations of concentrations and deposition on a national and international scale are outlined in Chapter 5. Once released, the effects of these pollutants depend critically on their dilution during dispersion, a process which is covered along with the fundamentals of meteorology and air dispersion modelling in Chapter 6. Chapter 7 gives an extended example of the data processing techniques that can be used to extract different types of information from a set of air pollution measurements. Although people tend to associate air quality, or the lack of it, with the outdoors, most of us spend up to 90% of our lives indoors, and specific aspects of this specialised environment are highlighted in Chapter 8. The new Chapter 9 extends the coverage of the previous editions by including information on air pollution mitigation approaches, specifically the role of vegetative interventions. The effects of air pollution on plants, animals, materials and visual range are described in Chapters 10 and 11, and the recent issues of climate change and ozone depletion in Chapters 12 and 13. The effects of pollutants on the environment have led to a wide variety of standards and legislations for their control, and these are reviewed in Chapter 14. In the previous two editions, limitation to data access has resulted in a UK bias, followed in order of emphasis by Europe, the US and the world at large. However, in the 3rd edition, air pollution has been acknowledged as an international issue; additional efforts were expended in balancing the amount of information provided for the developing world. Readers are encouraged to pursue other sources for greater depth of coverage on any particular issue. Some suggestions are given as ‘Further Reading’ at the end of each chapter. These are not only useful documents in their own right, but also contain references to many more specialist research papers. Similarly, the figure captions cite many books, reports and research papers from which Figures for this book have been taken. This book is aimed at a wide target audience, mainly universities – both at undergraduate and at post-graduate levels with students from a wide range of academic backgrounds. We hope it will be useful to our readers! Abhishek Tiwary Jeremy Colls
Chapter 1
Air pollutants Sources and control of gases
Air pollution has remained a major problem in the modern society. However, in its conventional form of smoke and fumes, it dates back to the Middle Ages and is closely associated with the Industrial Revolution and the use of coal. Pollution (in the general sense) was defined in the Tenth Report of the Royal Commission on Environmental Pollution as: The introduction by man into the environment of substances or energy liable to cause hazard to human health, harm to living resources and ecological systems, damage to structure or amenity or interference with legitimate use of the environment. This is a very broad definition, and includes many types of pollution that we shall not cover in this book, yet it contains some important ideas. Note that by this definition, chemicals such as sulphur dioxide from volcanoes or methane from the decay of natural vegetation are not counted as pollution, but sulphur dioxide from coal-burning or methane from rice-growing are pollution. Radon, a radioactive gas that is a significant natural hazard in some granitic areas, is not regarded as pollution since it does not arise from people’s activities. The boundaries become more fuzzy when we are dealing with natural emissions that are influenced by our actions – for example, there are completely natural biogenic emissions of terpenes from forests, and our activities in changing the local patterns of land use have an indirect effect on these emissions. The pollution discussed in this book is the solid, liquid or gaseous material emitted into the air from stationary or mobile sources, moving subsequently through an aerial path and perhaps being involved in chemical or physical transformations before eventually being returned to the surface. The material has to interact with something before it can have any environmental impacts. This interaction may be, for example, with other molecules in the atmosphere (photochemical formation of ozone from hydrocarbons), with electromagnetic radiation (by greenhouse gas molecules), with liquid water (the formation of acid rain from sulphur dioxide), with vegetation (the direct effect of ozone), with mineral surfaces (soiling of buildings by particles) or with animals (respiratory damage by acidified aerosol). Pollution from our activities is called anthropogenic, while that from animals or plants is said to be biogenic. Originally, air pollution was taken to include only substances from which environmental damage was anticipated because of their toxicity or their specific capacity to damage organisms or structures; in the last two decades, the topic has been broadened to include substances such as chlorofluorocarbons, ammonia or carbon dioxide that have more general environmental impacts. Table 1.1 provides the most recently updated list of local and transboundary air pollutants along with the details of the international and legislative directives that regulate them in the UK. Most of these standards and the legislation are described in greater detail in Chapter 14. This chapter exclusively deals with the gaseous components of the air pollutants listed in the table; the particulate matter components are dealt with in Chapter 2.
2
Air pollutants: sources and control of gases
Table 1.1 Local and transboundary air pollutants along with their regulatory international and UK legislative directives Air pollutants
Directive
PM – PM 10, PM 2.5, NO x, O 3, SO 2, PAHs, Benzene, 1,3-butadiene, CO, Pb
Air Quality Strategy
SO 2, NH 3, NO x, NMVOC
NECD (National Emissions Ceilings Directive)
SO 2, NH 3, NO x, NMVOC, Heavy Metals, POPs
CLRTAP (Convention on Long Range Transboundary Air Pollutants)
91 compounds including: CH 4, CO, CO 2 HFCs, N 2O, E-PRTR (European Pollutant Release and SF 6, NH 3, NMVOC, NO x, PFCs, SO x, CFCs, As, Cd, Transfer Register) which succeeds the EPER Cr, Cu, Hg, Ni, Pb, Zn, PM 10, Benzene, HCl, HF, PAHs, (European Pollutant Emission Register) PCBs, PCDD, PCDF, Gamma HCH, PCP, HCB SO 2, NO x, CO, VOCs, metals, dust, asbestos, chlorine and its compounds
IPPC (Integrated Pollution Prevention and Control)
SO x, NO x, PM
LCPD (Large Combustion Plants Directive)
Dust (PM), HCl, HF, SO 2, NO x, Heavy metals, dioxins WID (Waste Incineration Directive) and furans, CO VOC
Solvent Emissions Directive
VOC
Paints Directive
SO 2
The Sulphur Contents of Liquid Fuels Directive
VOC
Petrol vapour recovery
SO 2, NO x, PM, lead, benzene, CO, ozone, PAH, Cadmium, Arsenic, Nickel, Mercury
EU Air Quality Directives
1.1 UNITS FOR EXPRESSING POLLUTANT CONCENTRATION
Before we go any further, we must make a short detour to explain the units in which pollutant concentrations are going to be discussed throughout this book. Two sets of concentration units are in common use – volumetric and gravimetric. If all the molecules of any one pollutant gas could be extracted from a given volume of the air and held at their original temperature and pressure, a certain volume of the pure pollutant would result. Volumetric units specify the mixing ratio between this pollutant volume and the original air volume – this is equivalent to the ratio of the number of pollutant gas molecules to the total number of air molecules. Owing to historical changes in the systems used for scientific units, there are at least three notations in common use for expressing this simple concept. Originally, the concentration would be expressed, for example, as parts of gas per million parts of air. This can be abbreviated to ppm, or ppmv if it is necessary to spell out that it is a volume ratio and not a mass ratio. Later, to make the volumetric aspect more explicit and to fit in with standard scientific notation for submultiples, the ratio was expressed as µl l–1. Unfortunately, the litre is not a recognised unit within the Système International (SI). The SI unit for amount of substance (meaning number of molecules, not weight) is the mol, so that µmol mol–1 becomes the equivalent SI unit of volumetric concentration. This is correct but clumsy, so ppm (together with ppb (parts per billion, 10–9) and ppt (parts per trillion, 10–12)) have been retained by many authors for convenience’s sake and will be used throughout this
Air pollutants: sources and control of gases
3
Table 1.2 Abbreviations for volumetric and gravimetric units Volumetric
Gravimetric
Parts per million (micro)
10 –6
ppm
µl l –1
µmol mol –1
mg m –3
Parts per billion (nano)
10 –9
ppb
nl l –1
nmol mol –1
µg m –3
Parts per trillion (pico)
10 –12
ppt
pl l –1
pmol mol –1
ng m –3
book. Gravimetric units specify the mass of material per unit volume of air. The units are more straightforward – µg m–3, for example. Unlike volumetric units, gravimetric units are appropriate for particles as well as for gases. These relationships are summarised in Table 1.2 for the typical concentration ranges of ambient gaseous pollutants. Both volumetric and gravimetric systems have their uses and their advocates. The volumetric concentration is invariant with temperature and pressure, and therefore remains the same, for example, while warm flue gas is cooling in transit through exhaust ductwork. When gas enters a leaf, the effects may depend primarily on the number of molecular sites occupied by the pollutant gas molecules – this is better indicated by the volumetric than by the gravimetric concentration. However, if concentration is being determined by extracting the gas onto a treated filter for subsequent chemical analysis, or health effects are being related to the mass of pollutant inhaled, the result would normally be calculated as a gravimetric concentration.
1.1.1 Conversion between gravimetric and volumetric units Since both gravimetric and volumetric systems are in use and useful, we need to be able to convert between the two. The basic facts to remember are that 1 mol of a pure gas (an Avogadro number of molecules, 6.02 × 10²³) weighs M kg, where M is the relative molar mass, and takes up a volume of 0.0224 m3 at standard temperature and pressure (STP – 0°C, 1 atmosphere). For example, sulphur dioxide (SO2) has M = 32 × 10–3 + (2 × 16 × 10–3) = 64 × 10–3 kg, so that pure SO2 has a density (= mass/volume) of 64 × 10–3/0.0224 = 2.86 kg m–3 at STP. But pure SO2 is 106 ppm, by definition. Therefore: 106 ppm ≡ 2.86 kg m–3 1 ppm ≡ 2.86 × 10⁻⁶ kg m–3 = 2.86 mg m–3 and 1 ppb ≡ 2.86 µg m–3 Hence we can convert a volumetric concentration to its gravimetric equivalent at STP.
1.1.2 Correction for non-standard temperature and pressure The temperature and pressure are unlikely to be standard, so we also need to be able to convert gravimetric units at STP to other temperatures and pressures. At STP, we have 1 m3 containing
4
Air pollutants: sources and control of gases
a certain mass of material. When the temperature and pressure change, the volume of the gas changes but it still contains the same mass of material. Hence we need only to find the new volume from the Ideal Gas Equation: PV PV 1 1 = 2 2 T1 T2
(1.1)
where P1, V1 and T1 are the initial pressure, volume and absolute temperature and P2, V2 and T2 are the final pressure, volume and absolute temperature. In our case: P1 = 1 atmosphere V1 = 1 m3 T1 = 273 K and we need to find V2. Therefore, rearranging equation (1.1): V2 =
T2 PV T2 × 1 1= 273 P2 P2 T1
For example, the highest ambient temperature that we might find in practice is 50°C, and the lowest ambient pressure at ground level might be 950 mbar. Hence: T2 = 273 + 50 = 323K and P2 = 950/1013 = 0.938 atmosphere (because standard atmospheric pressure = 1013 mbar)
Table 1.3 Conversion factors between volumetric and gravimetric units Pollutant
Molecular weight M/g
To convert ppb to µg m –3
µg m –3 to ppb
0°C
20°C
0°C
20°C
SO 2
64
2.86
2.66
0.35
0.38
NO 2
46
2.05
1.91
0.49
0.52
NO
30
1.34
1.25
0.75
0.80
O3
48
2.14
2.00
0.47
0.50
NH 3
17
0.76
0.71
1.32
1.43
CO
28
1.25
1.16
0.80
0.86
Air pollutants: sources and control of gases
5
Therefore: V2 =
323 = 1.26 m3 273 × 0.938
The original volume of 1 m3 has expanded to 1.26 m3. This is physically reasonable because we have raised the temperature and reduced the pressure – both changes will increase the volume. The increased volume will still contain the same number of molecules, which will have the same mass. Hence the concentration must decrease by the same factor, and 1 ppm of SO2, for example, would now be equal to 2.86/1.26 mg m–3 or 2.27 mg m–3. The volumetric concentration, of course, would remain at 1 ppm. For the pollutant gases discussed most frequently in this book, Table 1.3 gives the conversion factors from ppb to µg m–3, and vice versa, at 0°C and 20°C. For example, to convert 34 ppb of SO2 at 20°C to µg m–3, multiply by 2.66 to get 90 µg m–3. 1.2 THE BASIC ATMOSPHERE
1.2.1 The origins of our atmosphere What we experience today as our atmosphere is a transient snapshot of its evolutionary history. Much of that history is scientific speculation rather than established fact. The planet Earth was formed around 4600 million years ago by the gravitational accretion of relatively small rocks and dust, called planetesimals, within the solar nebula. There was probably an initial primordial atmosphere consisting of nebula remnants, but this was lost to space because the molecular speeds exceeded the Earth’s escape velocity of 11.2 km s–1. A combination of impact energy and the radioactive decay of elements with short half-lives raised the temperature of the new body sufficiently to separate heavier elements such as iron, which moved to the centre. The same heating caused dissociation of hydrated and carbonate minerals with consequent outgassing of H2O and CO2. As the Earth cooled, most of the H2O condensed to form the oceans, and most of the CO2 dissolved and precipitated to form carbonate rocks. About one hundred times more gas has been evolved into the atmosphere during its lifetime than remains in it today. The majority of the remaining gases was nitrogen. Some free oxygen formed (without photosynthesis) by the photolysis of water molecules. Recombination of these dissociated molecules was inhibited by the subsequent loss of the hydrogen atoms to space (hydrogen is the only abundant atom to have high enough mean speed to escape the gravitational attraction of the Earth). The effect of atomic mass makes a huge difference to the likelihood of molecules escaping from the Earth. The Maxwell distribution means that there is a most likely velocity which is relatively low, and a long tail of reducing probabilities of finding higher speeds. For example, a hydrogen atom at 600 K (typical temperature at the top of the atmosphere) has a 10–6 chance of exceeding escape speed, while the corresponding figure for an oxygen atom is only 10–84. This process will result in a steady attrition of lighter atoms. The first evidence of single-celled life, for which this tiny oxygen concentration was an essential prerequisite, is shown in the fossil record from around 3000 million years ago. Subsequently, the process of respiration led to a gradual increase in the atmospheric oxygen concentration. This in turn allowed the development of O3 which is thought to have been a necessary shield against solar UV. Subsequent evolution of the atmosphere has been dominated by the balance between production and consumption of both CO2 and O2.
6
Air pollutants: sources and control of gases
1.2.2 Natural constituents of air People tend to refer to air as though it consists of ‘air’ molecules, which is evidence of the spatial and temporal constancy of its properties that we take for granted. Consider first the molecular components that make up unpolluted air. Air consists of a number of gases that have fairly constant average proportions, both at different horizontal and vertical positions and at different times. Table 1.4 gives the proportions of the gases that are present at concentrations of around and above 1 ppm. The average molar mass of dry air can be found by summing the products of the proportions by volume and molar masses of its major components, i.e. Ma = (0.781 × 28.01) + (0.209 × 32.00) + (0.0093 × 39.95) + (0.00037 × 44.01) = 28.95 g mol–1 Mixed into the quite uniform population of atmospheric molecules is a large range of additional materials that vary greatly in concentration both in space and time: • • • • • • • • •
sulphur dioxide may be released directly into the atmosphere by volcanoes, or formed as the oxidation product of the dimethyl sulphide released by oceanic phytoplankton oxides of nitrogen are created when anything burns nitrous oxide is emitted from the soil surface by bacterial denitrification hydrogen sulphide is produced by anaerobic decay ammonia is released from animal waste products ozone is formed in the stratosphere, by the action of UV radiation on oxygen ozone is also found in the troposphere, via both diffusion down from the stratosphere and local natural photochemistry volatile organic compounds (VOCs) are emitted from many different species of vegetation, especially coniferous and eucalyptus forests persistent organic pollutants (POPs) are organic compounds of anthropogenic origin that do not readily break down in the environment. As a consequence of their long lifetime they are transported over long distances, can accumulate in the food chain and can cause chronic human health impacts Table 1.4 Proportions of molecules in clean dry air Molecule
Symbol
Proportion by volume
Nitrogen
N2
78.1%
Oxygen
O2
20.9%
Argon
Ar
0.93%
Carbon dioxide
CO 2
370 ppm
Neon
Ne
18 ppm
Helium
He
5 ppm
Methane
CH 4
1.7 ppm
Hydrogen
H2
0.53 ppm
Nitrous oxide
N 2O
0.31 ppm
Air pollutants: sources and control of gases
• •
7
non-biogenic particles are generated by volcanoes or entrainment from the soil biogenic particles include pollen, spores, and sea salt.
We shall come back to these additional materials, and others, throughout this book when we consider them as pollutants rather than as naturally occurring substances.
1.2.3 Water in the atmosphere The proportions given in Table 1.4 are for dry air – without water vapour molecules. The gases listed have long residence times in the atmosphere, are well mixed and their concentrations are broadly the same everywhere in the atmosphere. Water is very different, due to its unusual properties at normal Earth temperatures and pressures. It is the only material which is present in all three phases – solid (ice), liquid and gas (water vapour). There is continuous transfer between the three phases depending on the conditions. We take this situation very much for granted, but it is nevertheless remarkable. Certainly, if we found pools of liquid nitrogen or oxygen on the surface of the Earth, or drops of these materials were to fall out of the sky, it would get more attention. The proportion of water vapour in the atmosphere at any one place and time depends both on the local conditions and on the history of the air. First, the temperature of the air determines the maximum amount of water vapour that can be present. The water vapour pressure at this point is called the saturated vapour pressure (SVP), and varies roughly exponentially with temperature (Table 1.5). Various mathematical expressions have been used to describe the relationship; an adequate one for our purposes is: ⎛ 19.65T ⎞ es (T ) = 611exp ⎜ Pa ⎝ 273 + T ⎟⎠ where es(T) is the saturated vapour pressure in Pa and T is the air temperature in degrees Celsius. Second, the ambient (meaning local actual) vapour pressure ea may be any value between zero and es. The ratio of actual to saturated vapour pressure is called the relative humidity hr, often expressed as a percentage. If water vapour is evaporated into dry air (for example, as the air blows over the sea surface or above a grassy plain), then the vapour pressure will increase towards es, but cannot exceed it. If air is cooled, for example by being lifted in the atmosphere, then a temperature will be reached at which the air is saturated due to its original water content. Any further cooling results in the ‘excess’ water being condensed out as cloud droplets. If the cooling occurs because the air is close to a cold ground surface, then dew results. The complexity of this sequence for any air mass is responsible for the variability of water vapour concentration in space and time. For comparison with the proportions given in Table 1.4 for the well-mixed gases, we can say that the highest vapour concentrations occur Table 1.5 Variation of saturated water vapour pressure with temperature Units
Pa mbar
Temperature (ºC) –10
0
10
20
30
289
611
1223
2336
4275
3
6
12
23
43
8
Air pollutants: sources and control of gases
in the humid tropics, with temperatures of 30°C and relative humidities of near 100%. The vapour pressure will then be 4300 Pa, corresponding to a mixing ratio of 4.3/101 = 4.3%. At the low end, an hr of 50% at a temperature of –20°C would correspond to a mixing ratio of around 0.1%. The global average mixing ratio is around 1%, so the abundance of water vapour is similar to that of argon.
1.3 THE VERTICAL STRUCTURE OF THE ATMOSPHERE
1.3.1 Pressure The pressure of a gas is due to the momentum exchange of individual molecules when they collide with the walls of their container. In the atmosphere, only the molecules at the surface have got a container – the remainder simply collide with other gas molecules. At any height in the atmosphere, the upward force due to this momentum exchange must equal the downward force due to gravity acting on all the molecules above that height. Since this force decreases with height, pressure decreases with height. Considering the force dF acting on a small vertical column of height dz, area A and density ρ, with the acceleration due to gravity of g, we have dF = –gρA dz (the minus sign is because the force acts downwards, but z is usually taken to be positive upwards). Hence: dp = df /A = –gρ dz But for an ideal gas at temperature T: ρ = mp/kT where m is the molecular mass and k is the Boltzmann constant. Hence: 1 mg dp = – dz p kT which integrates to give the hydrostatic equation: z ⎪⎧ mg ⎫⎪ p = p0 exp ⎨− ∫ dz ⎬ ⎪⎩ 0 kT ⎪⎭
where p0 is the surface pressure. The average atmospheric pressure at sea level over the surface of the Earth is 101.325 kPa = 1013.25 mbar (or hPa). The equation in this form allows for the variation of m, g and T with height z. In practice, the atmosphere is remarkably shallow, having a thickness of only 0.2% of the Earth’s radius up to the tropopause and 1.4% even at the mesopause. Hence for practical purposes g can be taken as constant and equal to its value at the surface, g0. Also, the major components – nitrogen, oxygen and argon – are well mixed by turbulent diffusion, so m is nearly constant at 28.95. If T were constant as well, the integration would give:
Air pollutants: sources and control of gases
9
⎧ mg ⎫ p = p0 exp ⎨− 0 z ⎬ ⎩ kT ⎭ The exponent in brackets in this equation must be dimensionless, so that kT/mg must have the same dimensions as z, which is length. Hence we can write: P(z) = P0 e
−
z H
where H = kT/mg is the scale height of the atmosphere. H corresponds to the height over which the pressure decreases to 1/e = 0.37. At the surface, where the temperatures are around 20°C or 290K, the scale height is 8.5 km. At the tropopause, where T ~220K, the scale height has fallen to 6 km. The total atmospheric pressure is the sum of the partial pressures from each of the gases present according to its proportion by volume or mixing ratio (e.g. as % or ppm). Hence the great majority of the pressure is due to nitrogen, oxygen and argon. Superimposed on this long-term average situation are short-term variations due to weather. These may cause the sea level pressure to decrease to 95 kPa in the centre of a severe depression or increase to 106 kPa in an anticyclone. Looked at the other way round, pressure = force per unit area, so that the surface atmospheric pressure is just the total force (= mass of the atmosphere × acceleration due to gravity) divided by the total surface area of the Earth (4πR2): Psea level =
Matm g 4πR2
By rearranging and substituting the known value of average sea level pressure (101.325 kPa), g = 9.81 m s–2 and R = 6.37 × 10⁶ m we can calculate the total mass of the atmosphere to be around 5.3 × 10¹⁸ kg. This is useful for understanding the significance of differing rates of input of atmospheric pollutants.
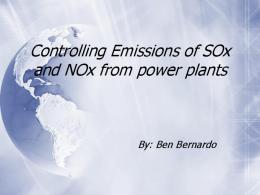
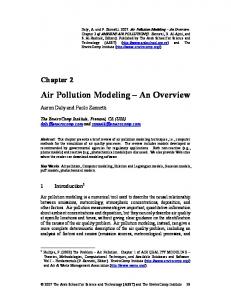
1.3.2 Temperature The temperature structure of the atmosphere, which is shown in Figure 1.1, is more complex than the pressure structure, because it is the result of several competing processes. First, the Earth’s surface is emitting longwave thermal radiation, some of which is absorbed and re-radiated by the atmosphere. Because the atmospheric pressure and density decrease exponentially with height, the absorption and emission decrease as well, which establishes a non-linear decrease of the equilibrium radiative temperature with height. Second, convective forces come into play. Below an altitude of 10–15 km, the lapse rate of radiative temperature exceeds the adiabatic lapse rate. This promotes overturning and defines the well-mixed region known as the troposphere. The mixing process establishes the adiabatic lapse rate (see Chapter 6) of around 6.5°C km–1 within this region. Above that altitude, the lapse rate of radiative temperature has dropped to a value well below the adiabatic lapse rate, resulting in the stable poorly mixed conditions characteristic of the stratosphere. Third, warming due to solar energy absorption by the layer of ozone between 20 and 50 km reverses the temperature decline, so that air temperature increases up to the stratopause at 50 km, further increasing the atmospheric stability. The stratosphere is dry throughout because the main source of moisture is the troposphere, and any air moving into the stratosphere from the troposphere must have passed through
10
Air pollutants: sources and control of gases
Figure 1.1 The average vertical profile of temperature in the atmosphere, related to other atmospheric features. Note that the vertical scale is linear up to 40 km, and logarithmic above. Source: Lawes, H. D. (1993) ‘Back to basics’, Weather 48(10): 339–44.
the tropopause, where the very low temperatures act as a cold trap. Some additional water molecules are created by the oxidation of CH4. Above the stratopause, in the mesosphere, the warming effect is offset by decreasing air density, and the temperature falls again. Although the temperature is falling, the rate of decrease is small at around 4K km–1 and the mesosphere is also stable, but only just. Finally, above the mesopause at 90 km the air becomes so thin, and
Air pollutants: sources and control of gases
11
collisions so infrequent, that unequal energy partition between vibrational and translational modes result in very high temperatures. It is these high translational energies that allow light particles such as hydrogen atoms to escape from the Earth altogether.
1.4 ANTHROPOGENIC EMISSIONS
The three major groups of gaseous air pollutants by historical importance, concentration, and overall effects on plants and animals (including people), are sulphur dioxide (SO2), oxides of nitrogen (NOx = NO + NO2) and ozone (O3). Sulphur dioxide and nitric oxide (NO) are primary pollutants – they are emitted directly from sources. We shall start by looking at the main sources of these and other primary gases, and also consider some of the methods of control that can be used to reduce emissions and concentrations when required. Then we will move on to ozone, which is referred to as a secondary pollutant because it is mainly formed in the atmosphere from primary precursors, and emissions of the gas itself are negligible. Nitrogen dioxide (NO2) is both primary and secondary – some is emitted by combustion processes, while some is formed in the atmosphere during chemical reactions. Production of SO2 is commonly associated with that of black smoke, because it was the co-production of these two materials during fossil fuel combustion that was responsible for severe pollution episodes such as the London smogs of the 1950s and 1960s.
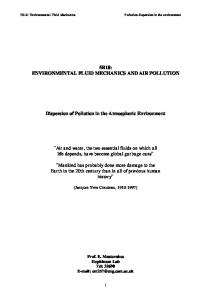
1.4.1 Energy consumption During most of recorded history, the population of the world has grown slowly, reaching 200 million in AD 1, 250 million in AD 1000 and 450 million in 1600. In the seventeenth century, we started to learn how to keep people alive before we realised the consequences, and the rate of growth increased explosively. The population reached 6 billion in 2000, and is now forecast to reach 7.5 billion by 2020 and to cross the 9 billion mark in 2050 (Figure 1.2) before stabilising. Ninety eight per cent of the future growth will be in developing countries, and most of that will be in urban areas. This rapidly increasing population has also been increasing its standard of living, underpinned by energy obtained from fossil fuels – initially from coal burning and later by oil and gas. Although increased energy efficiency in the developed nations
Figure 1.2 The growth of world population between 1950 and 2050. Source: US Census Bureau, International Data Base, December 2008 update.
12
Air pollutants: sources and control of gases Table 1.6 Typical energy contents of widely-used fuels Energy source
Energy density (MJ kg –1)
Natural gas
51
Petroleum
37
Coal Anthracite
30
Bituminous
30
Sub-bituminous (brown)
20
Lignite
10–15
Animal dung (dry weight)
17
Wood (dry weight)
15
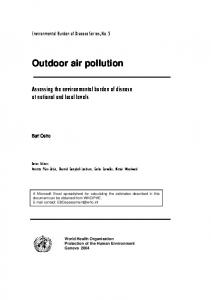
stabilised the use per person after 1970, the continuing increase in total population is still driving up the total energy use. We each use about 2 kW as a long-term average – equivalent to one fan heater – although this single average conceals a wide range between intensive users such as the US (10 kW) or Western Europe (5 kW), and less developed countries having very small energy inputs. The combustion of fossil fuels to generate this energy converts carbon into carbon dioxide and releases it into the atmosphere. Guideline energy contents of fossil fuels, and of alternatives, are shown in Table 1.6. Figure 1.3 shows the parallel growth in carbon release (as CO2) in the nineteenth and twentieth centuries. Coal was the original fossil fuel used, then oil from 1900 and gas from 1930. Also visible are major disturbances to the drive for growth – the recession in the 1930s, the Second World War and the oil price crisis of 1974.
Figure 1.3 Global carbon release 1750–1995. Source: Wuebbles, D. J., Jain, A., Edmonds, J., Harvey, D. and Hayhoe, K. (1999) ‘Global change: state of the science’, Environmental Pollution 100: 57–86.
Air pollutants: sources and control of gases
13
Table 1.7 Global consumption of energy by fuel between 1990–2030 (×1015 Btu) Energy source
History
Projection
Average annual per cent change
1990
2003
2030
2003–30
136.1
162.1
239.1
1.4
Natural Gas
75.2
99.1
189.9
2.4
Coal
89.4
100.4
195.5
2.5
Nuclear
20.4
26.5
34.7
1.0
Others (includes renewables)
26.3
32.7
62.4
2.4
347.3
420.7
721.6
2.0
Oil
Total
Source: Energy Information Administration (2006) Annual Energy Outlook 2006. US Department of Energy, DOE/ EIA-0383.
Coal is the fuel that underpinned successive industrial revolutions from the Bronze Age through to the eighteenth century. It is the most abundant fossil fuel, with huge reserves of some 1000 billion tonnes that are expected to last another 300 years at present rates of use. What were originally peat deposits became buried and compressed under accumulating sediments. The increased pressure and temperature caused the peat to pass through a series of stages called the coal series, characterised by decreasing moisture content and volatiles and a higher carbon content. The members of this series are called lignite, sub-bituminous brown coal, bituminous coal and anthracite. The earlier members of the coal series (from younger deposits, Cretaceous rather than Carboniferous) are poor quality low-calorific value fuels which need to be burnt in large tonnages. However, coal use as a proportion of total is declining, because of the handling advantages of fluid fuels such as oil and gas. The origin of the world’s oil deposits is far less well understood than is coal’s. Oil itself consists of thousands of different organic molecules, mainly hydrocarbons. Whereas coal formed from the action of sediments on accumulating vegetable matter in a terrestrial environment, it is thought that oil formed in a parallel process acting on accumulating microscopic animal remains in a marine environment. Although fluid, the oil could sometimes be trapped below a domed cap of impermeable rock. As well as these deposits of pure liquid oil, there are extensive deposits of oil shales and sands, in which the oil soaks through a permeable rock much like water through a sponge. These types of deposit will be much more expensive to extract. Crude oil as extracted is not useable as a fuel, but has to be refined by the process of fractional distillation. This process yields not only fuels such as heavy fuel oil, diesel, petrol and paraffin, but a wide range of chemicals which can be used to make plastics and other materials. Natural gas, which is mainly the simplest hydrocarbon methane, is associated with both the formation of coal seams and oil deposits. With coal it is usually just a safety issue, being present in sufficient concentrations to foul the air and cause risk of explosions. With oil it is usually present in large volumes, overlying the oil deposit, that have been exploited as a fuel in their own right. Table 1.7 provides a breakdown of historical and projected global consumption of energy up to 2030. It includes renewables such as wind turbines or biofuels. The overall energy consumption is projected to rise with an average annual increase of up to 2.5% between 2003 and 2030 for natural gas, coal and renewables. The per capita energy use varies widely between countries according to their stage of development, from 7–8 toe (tonnes oil equivalent) per year in North America (where 5% of the world’s population uses 25% of the energy), and 4 toe in Europe,
14
Air pollutants: sources and control of gases
to 0.2 toe in India. Developing countries also offer very different fuel combustion profiles, especially in the domestic sector. Whereas domestic energy supply in developed countries is likely to be from burning gas in a centralised boiler for a central heating system, developing countries are much more likely to be using fuels such as kerosene, wood, roots, crop residues or animal dung. Furthermore, these are likely to be burnt in an unflued indoor stove with poor combustion efficiency. Hence the potential for pollutant emissions and enhanced indoor pollutant concentrations is much greater. Ironically, if the renewable fuels could be combusted without pollutant emissions, they would be superior to fossil fuels because they have no net impact on CO2 concentrations. In some countries, for example China, national programmes have been used to increase the availability of higher efficiency flued stoves. Although, these still generate significant emissions to the atmosphere, they certainly reduce the indoor concentrations and consequent health impacts.
1.4.2 Sulphur emissions All fossil fuels contain sulphur, most of which is released as sulphur dioxide during combustion. Almost all the anthropogenic sulphur contribution is due to fossil fuel combustion. Different fuels offer a wide range of sulphur contents: • • • •
Oil and its by-products contain between 0.1% sulphur (paraffin) and 3% (heavy fuel oil) in the form of sulphides and thiols. Petrol contains negligible sulphur in the context of overall mass emissions, although there can be an odour problem from conversion to hydrogen sulphide (H2S) on catalytic converters. Coal contains 0.1% – 4% sulphur, mainly as flakes of iron pyrites (FeS2). The average sulphur content of UK coal is 1.7%. Natural gas (mainly methane, CH4) can be up to 40% H2S when it is extracted from the well. The sulphur is taken out very efficiently at a chemical processing plant before distribution, so natural gas is effectively sulphur-free – one of the reasons for the ‘dash for gas’.
Using a combination of bottom-up and available inventory methods, including all anthropogenic sources, a global estimate of sulphur dioxide emissions from different meta-regions between 1850 and 2000 is presented in Figure 1.4. It suggests that global sulphur dioxide emissions peaked about 1980 and since then have been declining in most parts of the world. However, emissions from the developing region rose again around 1990, due largely to coal combustion. Emissions from China are now comparable to those from the US, and in 2000 emissions from Asia, North America and Europe accounted for over half the global total. The major natural sulphur emissions are in the reduced forms of H2S (hydrogen sulphide), CS2 (carbon disulphide) or COS (carbonyl sulphide), and the organic forms CH3SH (methyl mercaptan), CH3SCH3 (dimethyl sulphide, or DMS) and CH3SSCH3 (dimethyl disulphide, or DMDS). Dimethyl sulphide is produced by marine phytoplankton and oxidised to SO2 in the atmosphere; H2S from decay processes in soil and vegetation; and SO2 from volcanoes. Whatever their original form, much of these sulphur compounds eventually get oxidised to gaseous SO2 or to sulphate aerosol. The natural sources are now heavily outweighed by human ones, principally fossil fuel combustion, as shown in Figure 1.5. Note that the emission strengths are given as mass of sulphur, not of sulphur dioxide. If these values are compared with others expressed as SO2, then they must be multiplied by the ratio of the molecular weights, which is 2.0 (64/32) in this case. Table 1.8 gives the regional split of anthropogenic SO2 emissions projected up to 2030.
Air pollutants: sources and control of gases
15
Figure 1.4 Global sulphur dioxide emissions by meta-region between 1850 and 2000. Source: Smith, S. J., Andres, R., Conception, E. and Lurz, J. (2004) ‘Historical sulfur dioxide emissions 1850–2000: Methods and Results’, US Department of Energy, PNNL Report No. 14537, USA.
Figure 1.5 Anthropogenic sources of global sulphur dioxide emissions between 1850 and 2000. Source: Smith, S. J., Andres, R., Conception, E. and Lurz, J. (2004) ‘Historical sulfur dioxide emissions 1850–2000: Methods and Results’, US Department of Energy, PNNL Report No. 14537, USA.
Note that the projections are based on two distinct assumptions – one, where the reductions follow the current legislation and two, where maximum feasible reductions can be achieved. Both the scenarios show marked reductions in SO2 emissions for 2030 for Western and Eastern Europe, Latin America and Russia but a significant increase in the emissions for Central and South Asian countries. Information about the budgets of reduced sulphur components is less soundly based than that for oxidised S. Approximate total emissions are given in Table 1.9.
16
Air pollutants: sources and control of gases
Table 1.8 Anthropogenic emissions of SO2 by world regions to 2030 (Tg SO2 yr–1) Region
1990
24 North America 18 Western Europe Central and Eastern Europe 11 19 Russia and NIS 21 Central Asia 5 Other Pacific Asia 5 South Asia 7 Latin America 3 Middle East 5 Africa 120 World total
2000
19 8 6 10 21 4 7 8 5 5 96
Reduction based on current legislation
Maximum feasible reductions
2010
2020
2030
2010
2020
2030
11 4 4 7 25 6 11 6 3 5 85
8 3 2 6 22 7 17 5 3 5 82
8 3 2 6 22 9 22 5 2 6 87
3 1 1 2 6 2 2 2 1 1 21
3 1 0 2 6 2 3 2 1 1 22
3 1 0 2 6 2 3 2 1 2 22
Source: Cofala, J., Amann, M., Klimont, Z., Kupiainen, K. and Höglund-Isaksson, L. (2007) ‘Scenarios of global anthropogenic emissions of air pollutants and methane until 2030’, Atmospheric Environment 41: 8486–99.
Table 1.9 Global emissions of reduced sulphur Compound
Emission (Tg yr –1)
Carbonyl sulphide (OCS)
1.3
Carbon disulphide (CS 2)
1.0
Hydrogen sulphide (H 2S)
8.0
Dimethyl sulphide (DMS)
25
Table 1.10 provides the annual UK SO2 emissions for 1970 and 2006 broken down by UNECE source categories followed by fuel categories. The final column indicates the percentage contributions to each category for 2006 (separately summed for source and fuel types). The SO2 emissions have fallen dramatically in almost all the categories since 1970, due to the combined influence of lower sulphur fuels, the switch from coal to gas and increased energy efficiency. A substantial part of the overall emissions is due to public electricity and heat generation and transport contributes only a negligible proportion (contrast this with NOx in Section 1.4.3). The two main contributors by fuel type are solid fuel and petroleum products. The most important factors associated with the fall in emissions from petroleum use are the decline in fuel oil use and the reduction in the sulphur content of gas oil and DERV (diesel fuel specifically used for road vehicles). Between 1994 and 2006 the SO2 emissions from DERV are estimated to have been reduced by as much as 98%. Emissions are not usually spread uniformly across the country. In the UK the National Atmospheric Emissions Inventory (NAEI) compiles very detailed maps of estimated emissions on a 10 × 10 km grid. These estimates are updated annually. Two factors drive SO2 emissions – population and power stations. There are clusters of emissions around the large urban centres, because these areas are industrial as well as population centres. There are also clusters around the group of coal-fired power stations in the English East Midlands. Areas of low population density, such as the Highlands of Scotland and central Wales, have correspondingly low emission densities. We will see in Chapter 5 how such a concentration of emissions also results in a concentration
Air pollutants: sources and control of gases
17
Table 1.10 UK emissions of SO2 in 1970 and 2006, by aggregated UNECE source category and fuel (ktonnes yr–1)
By source category Public electricity and heat production Petroleum refining Stationary combustion Other industrial combustion Transport (includes road, rail and civil aviation) National navigation (includes Inland Waterways and Maritime activities) Residential combustion Production Processes & Waste Incineration By fuel category Solid Petroleum Gas Non-fuel
1970 emissions
2006 emissions
Percentage of 2006 total
2919 199 958 1511 81
360 75 26 87 14
53 11 4 13 2
34 521 146
50 22 41
7 3 6
3728 2468 19 155
429 175 14 58
64 26 2 9
Source: NAEI (2008) UK Emissions of Air Pollutants 1970 to 2006, National Atmospheric Emissions Inventory, October 2008.
of deposition and effects. In industrialised countries, emissions have been falling in recent decades, mainly from application of efficient tail-pipe cleaning technologies and from investment in alternative combustion technologies. Figure 1.4 showed that, even while global emissions continued to rise, European emissions peaked in about 1980 and have been falling since then. This trend was anticipated by UK emissions (Figure 1.6), which rose fairly consistently until the late 1960s before starting to decline. Total UK emissions of SO2 were 6.3 Mt in 1970; they declined to 3.7 Mt in 1980 and have continued to fall since. Figure 1.7 shows how these changes have been distributed between
Figure 1.6 UK SO2 emissions 1850–1988. Source: Eggleston, S., Hackman, M. P., Heyes, C. A., Irwin, J. G., Timmis, R. J. and Williams, M. L. (1992) ‘Trends in urban air pollution in the United Kingdom during recent decades’, Atmospheric Environment 26B: 227–39.
18
Air pollutants: sources and control of gases
Figure 1.7 UK SO2 emissions by source category 1970–2020. Source: National Expert Group on Transboundary Air Pollution (2001) Transboundary Air Pollution: Acidification, Eutrophication and Ground-level Ozone in the UK, Centre for Ecology and Hydrology, Edinburgh.
different source categories since 1970, together with forecast emissions until 2020. Ninety five per cent of UK SO2 emissions in 1998 were due to combustion of solid fuel or petroleum products, with emissions from these two sources having declined by 68 and 86% respectively between 1970 and 1998. Emissions from the power station sector were almost constant until the early 1990s, and then fell steadily under the combined influence of desulphurisation and the switch to gas from coal. Industrial and domestic emissions fell throughout the period. This decline conceals a major redistribution of source types – the power stations have been moved out of the urban areas into greenfield rural sites near the coalfields, while domestic coal combustion for space heating has been almost completely replaced by gas central heating. Again, political influences can also be seen on the total emission curve. The sharp reduction in 1974 was caused by the oil price increase imposed by the Gulf States, and that in 1980 by the economic recession. Future emissions targets have been set by the 1999 Gothenburg Protocol, and declines already underway due to improved energy efficiency, reduced S in fuels and other factors are expected to achieve these. 1.4.2.1 Abatement of sulphur dioxide emissions Burn less fuel!
It is self-evident that, other things being equal, we can always reduce pollutant emissions by burning less fuel. However, for several hundred years, as we have already seen, the rising standards of living of the developed countries have been based fundamentally on production and consumption of energy that has mostly been derived from fossil fuel. We live in an increasingly energy-intensive society, and reductions to our quality of life in order to save energy are not yet politically acceptable. Many measures, such as improved thermal insulation and draught proofing of buildings, offer enormous potential for improved quality of life and reduction of emissions. Wonderful opportunities for change have been missed. For example, the price of oil was arbitrarily quadrupled by the Gulf States in the 1970s; this incentive could have been used to redirect society quite painlessly, raising the price of energy over a twenty-year period and encouraging people to live closer to their work and relatives and travel on public transport.
Air pollutants: sources and control of gases
19
Nevertheless, in 2008 the UK government prioritised long-term initiatives to make homes less energy-wasteful through adequate insulation. In addition, combined heat and power (CHP) generation units, that can potentially raise the overall energy efficiency of fossil fuel combustion from below 40% to above 80%, have been identified as a vital part of the energy mix. Fuel substitution
Since, apart from smelting of metal ores, sulphur oxides are mainly formed from combustion of fuels (coal, natural gas, oil, peat, wood) the most straightforward method for their mitigation would involve minimising the oxidation of sulphur-containing fuels. Fuel sulphur content generally falls in the order coal > oil > wood. In natural gas most of the sulphur is in the form of H2S, which can be removed through chemical separation from the other constituent gases. This involves the use of a lower-S fuel to reduce emissions, and is very logical, but may have other implications. For example, we have seen from the above data that power stations must be the first target for sulphur control. In the UK, a large investment in coal-fired stations was made in the 1960s, with coal sourced from the nationalised British coal pits. Most British coal, particularly in the Trent Valley where the power stations are concentrated, is not low-sulphur. When acid deposition and the sulphur content of coal became an issue in the 1970s, there was little flexibility for these stations to import low-sulphur coal. In the 1980s and 1990s, the British coal industry collapsed under both economic and political pressures, increasing the freedom of power stations to import low-sulphur coal. In addition, this led to increased reliance on gas fired power stations that emit much less sulphur dioxide. In the UK coal was dominant in 1970, and remained so until 1990. By 1996, however, gas generation had taken 21% of the market and coal had declined to around 45%. The effects of changes in sulphur content can be dramatic. In Hong Kong, the use of fuel oil containing more than 0.5% S by weight was prohibited in July 1990. Ambient SO2 concentrations in the most polluted areas dropped from around 120 µg m–3 to around 30 µg m–3 within weeks. Fuel cleaning
In recent years there has been more emphasis on lowering the sulphur content of conventional fuels or, if possible, removing sulphur from the fuel altogether. To the latter end techniques such as ‘coal cleaning’ (removing pyritic sulphur) or ‘solvent refining’ (dissolving coal in strong solvents followed by catalytic hydrogenation) have been developed to mitigate SO2 emissions to the ambient air. The coal used in large-scale generating plant is ground in a ball mill to the texture of a fine powder so that it can be blown down pipes and mixed with air before combustion. Since the sulphur-containing pyrites occur as physically-distinct particles having a different density to the coal, a process such as froth flotation can be used to separate the relatively dense flakes of pyrites from the powdered coal. Reductions of 80% in S content can be achieved, but 40% is more typical and this process is not widely used. Chemical reduction
Reduction of sulphur oxides can produce inert products that are harmful to humans. Sulphur in reduced form can be removed from a gas stream through the ‘absorption and stripping’ method. The liquid solvent used is required to have higher affinity for the gaseous component containing reduced sulphur than the rest of the components in the gas stream. This method can be used to mitigate sulphur dioxide emissions from oil refineries and coal gasification.
20
Air pollutants: sources and control of gases
Concentration
This method is used to mitigate SO2 concentrations in off-gases from smelting of metal sulphide ores. The general procedure is to convert incoming SO2 to H2SO4 which is then used to produce phosphate fertiliser. Flue gas desulphurisation (FGD)
Chemical engineering plant can be built into or added onto power stations to remove most of the sulphur dioxide from the combustion (flue) gases before they are exhausted to the atmosphere. Several different methods are available. In the most popular, a finely divided limestone slurry is sprayed into the flue gas (Figure 1.8). The calcium carbonate from the limestone reacts with the SO2 to produce hydrated calcium sulphate (gypsum), which can be used to make plasterboard for the building industry: CaCO3 + SO2 → CaSO4 · 2H2O
Figure 1.8 Calcium carbonate FGD system. Source: Johnsson, J. E. (1998) ‘Urban sources of air pollution’. In: J. Fenger, O. Hertel and F. Palmgren (eds) Urban Air Pollution: European Aspects, Kluwer Academic Publishers, Dordrecht, The Netherlands.
Air pollutants: sources and control of gases
21
In a modification of the above, a lime slurry is atomised by a spinning disc. Although the reaction between the absorbent and the acid gas takes place mainly in the aqueous phase, the water content and rate of evaporation are controlled to give dry calcium sulphite which is captured in a conventional dust collector and can be used for landfill or cement manufacture: SO2 + CaO + ½ H2O → CaSO3 · ½ H2O Finally, for plants located near the sea, the natural alkalinity of sea water can be utilised to form sulphuric acid in a packed bed absorber: SO2 + H2O + ½ O2 → H2SO4 The acid effluent is normally disposed of at sea, which may or may not be environmentally acceptable. This process is a good example of the need to consider air, water and land pollution as a whole when evaluating different control strategies. Although the underlying chemistry of this method is quite simple, it has high installation and operational costs. Limestone must be quarried in, and transported from, rural areas, and the gypsum may have to be disposed of to landfill if a market cannot be found for it. Apart from this, using limestone scrubbers has a number of operational problems – including corrosion, plugging, poor reagent utilisation and poor solid-liquid separation. There is also a consequent risk of leachate creating a water pollution problem. As a consequence, alternative approaches (other wet systems) have been developed to overcome these limitations. In addition, several dry and dry-wet systems have also been in practice to treat SO2-containing flue gases in order to mitigate their aerial emissions. Although the old industrialised countries have the wealth and level of technology to lower SO2 emissions to whatever value they choose, we cannot be complacent on a global basis. For example, China currently burns around 1400 Mt coal, accounting for 66% of its total primary energy consumption, and emits around 25 Mt SO2. About half of China’s SO2 emissions are attributed to burning coal. By 2020, around 2000 Mt coal will be burned, emitting up to 55 Mt SO2 depending on the sulphur content of the coal and the level of sulphur emission control installed on new plants. The 1999 Gothenburg Protocol of the Convention on Long-range Transboundary Air Pollution (CLRTAP) has set a combined EU annual emissions ceiling of 4.044 Mt SO2, to be achieved by 2010. Remarkably, this is similar to the SO2 emission from the UK alone during the 1980s. 1.4.2.2 Sulphur trioxide
A small proportion of the fuel sulphur (typically up to a few per cent) may be further oxidised to sulphur trioxide (SO3). This has three main consequences: first, a blue mist of sulphuric acid droplets can be emitted from boiler chimneys; second, water vapour and SO3 combine to condense out sulphuric acid on cool parts of the ductwork, accelerating the corrosion of metal parts; third, smoke particles accumulate on these sticky areas of the ductwork. Small lumps of this acidified deposit, known as ‘acid smuts’, are entrained into the gas stream, ejected from the chimney, and may then fall onto and damage local sensitive surfaces such as car paintwork or clothes. The conversion to SO3 is catalysed by vanadium, so that some fuel oils that are high in vanadium can convert 20–30% of the initial sulphur into SO3. Proprietary chemical oil additives are available that can help to control this problem.
22
Air pollutants: sources and control of gases
1.4.3 Nitrogen oxide production Nitrogen oxides are acid gases and ozone precursors. The two principal oxides of nitrogen are nitric oxide (NO) and nitrogen dioxide (NO2). The sum of these two is known as NOx (pronounced either as ‘en-oh-ex’ or as ‘knocks’). Despite their quite different physical properties, chemical affinities and environmental impacts, they are often lumped together. Combustion always produces a mixture of NO2 and NO, although typically more than 90% of combustion NOx production is in the form of NO. Nitric oxide is formed in two distinct ways: •
Thermal NO is formed from reactions between the nitrogen and oxygen in the air. The reactions can be summarised by the Zeldovitch mechanism: N2 + O → NO + N N + O2 → NO + O
This is highly endothermic, so that thermal NO production is at a maximum in the highesttemperature regions of a combustion chamber. •
Fuel NO is formed from nitrogen in the fuel. Typically, fuel nitrogen contents are 0.5–1.5% in oil and coal, and rather less in gas.
Total UK NOx emissions were quite steady until the 1940s, when they started to increase sharply. Emissions from coal combustion fell during the recession in the 1930s before reviving, while those from oil products increased steadily until curtailed in 1974. More recently, the transport sector has become the dominant source of NOx emissions. Figure 1.9 shows that road vehicle emissions rose steadily between 1970 and 1989; during this period emission from total petrol consumption, mainly by cars, rose by 106% from the 1970 level and emission from diesel consumption rose by 38%. However, since 1989 there has been a steady decline in emissions due to the introduction of three-way catalytic converters on petrol cars and stricter
Figure 1.9 NOx emissions in the UK from Road Transport by Vehicle Type (ktonnes) and projections to 2010. Source: NAEI (2008) UK Emissions of Air Pollutants 1970 to 2006, National Atmospheric Emissions Inventory, October 2008.
Air pollutants: sources and control of gases
23
Figure 1.10 UK NOx emissions by type 1970–2020. Source: National Expert Group on Transboundary Air Pollution (2001) Transboundar y Air Pollution: Acidification, Eutrophication and Ground-level Ozone in the UK, Centre for Ecology and Hydrology, Edinburgh.
regulations on truck emissions. By 2010 the cumulative emissions from all transport categories are projected to reach almost half their corresponding level in 1970. Figure 1.10 shows data since 1970, together with predicted emissions up to 2020. Note that the data in this figure are expressed as Mt nitrogen, whereas those in Figure 1.9 were in terms of ktonnes NO2. Between 1970 and 1984 the total was almost constant, although there was a redistribution between sources, with motor vehicle emissions increasing and industrial emissions falling. Between 1984 and 1990 total emissions increased steadily, due entirely to the increase in vehicular emissions. After peaking in 1989, a decline started which has continued ever since, primarily owing to the fitting of low-NOx burners in power stations and to catalytic control of vehicle exhaust gases. Nitric oxide is also emitted from soils, but it has proved harder to quantify the source strength. Nitrifying bacteria produce both nitric and nitrous oxide – anaerobic production of NO is thought to dominate overall. Guesstimates based on rather sparse data suggest that UK soil production of NO may be equivalent to 2–5% of the production from fuel combustion. Table 1.11 gives the UK emissions of nitrogen by aggregated UNECE source categories followed by fuel categories for 1970 and 2006. The final column indicates the percentage contributions to each category for 2006 (separately summed for source and fuel types). Power stations make up only a fifth of the total emissions by source type; while road transport, which contributed only a tiny proportion of the SO2 emissions (Section 1.4.2), contributes to much of the NOx emissions. In 2006 the contributions from the transport sector, including road vehicles and off-road vehicles, were estimated to be nearly half of the total emission. The similarity of the road transport emissions in 1970 and 2006 conceals a large rise to a peak of 400 kt in 1989 (Figure 1.9) before they were controlled by catalytic converters. Among fuel categories, in 2006 petroleum has been the most dominant source with over 50% contributions while solids (including coal) and gas have contributions of around 20% each. This balance naturally affects the priority areas for control measures. It is important to note that, despite the precision with which the emissions are quoted, the error on these figures (and on those
24
Air pollutants: sources and control of gases
Table 1.11 UK emissions of NOx (as NO2) in 1970 and 2006, by aggregated UNECE source category and fuel (ktonnes yr–1) 1970 emissions By source category Public electricity and heat production Stationary combustion Other industrial combustion Passenger cars Heavy duty vehicles Other road transport Other transport Residential combustion plants Other By fuel category Solid Petroleum Gas Non-fuel
2006 emissions
Percentage of 2006 total
813 692 500 371 358 36 202 120 32
389 118 220 195 264 56 242 104 7
24 7 14 12 17 3 15 7 1
979 1488 532 126
367 891 289 48
23 56 18 3
Source: NAEI (2008) UK Emissions of Air Pollutants 1970 to 2006, National Atmospheric Emissions Inventory, October 2008.
Table 1.12 Anthropogenic emissions of NOx by world regions (Tg NO2 yr–1) Region
North America Western Europe Central and Eastern Europe Russia and NIS Central Asia Other Pacific Asia South Asia Latin America Middle East Africa World total
1990
24 15 3 11 8 4 3 6 3 3 84
2000
22 11 2 7 11 6 6 7 4 4 83
Reduction based on current Maximum feasible legislation reductions 2010
2020
2030
2010
2020
2030
18 8 2 6 14 6 7 6 3 4 78
12 6 1 5 14 6 9 7 3 5 71
12 6 1 6 15 7 10 8 4 8 80
6 3 1 1 4 2 2 2 1 1 24
6 3 0 2 5 2 3 2 1 1 26
7 3 1 2 5 3 3 2 1 2 30
Source: Cofala, J., Amann, M., Klimont, Z., Kupiainen, K. and Höglund-Isaksson, L. (2007) ‘Scenarios of global anthropogenic emissions of air pollutants and methane until 2030’, Atmospheric Environment 41: 8486–99.
of corresponding emissions of other gases) has been estimated to be 15–20%. It should also be anticipated that the emitted nitrogen, once returned to the surface, will have a significant impact on both managed and natural ecosystems. Recent estimates based on GOME satellite data attribute over 60% of global NOx to fuel combustion emissions (fossil + biofuel), 15% to biomass burning and over 20% to soil emissions. Table 1.12 shows the global distribution of anthropogenic NOx emissions by world regions. Although most of the direct emission will be as NO, the source strengths are given as NO2 equivalent since all the NO is potentially available for oxidation to NO2. Low emissions indicate either an immature economy which is not energy-intensive, or a mature economy which is energy-intensive but has extensive pollution controls in place.
Air pollutants: sources and control of gases
25
Figure 1.11 The temporal evolution of tropospheric NO2 columns from GOME for selected areas. Source: Richter, A., Burrows, J. P., Nüβ, H., Granier, C. and Niemeier, U. (2005) ‘Increase in tropospheric nitrogen dioxide over China observed from space’, Nature 437: 129–32.
1.4.3.1 Nitrogen dioxide formation
As has been described in Section 1.4, only a small proportion of the NO2 found in the atmosphere was released in that form from sources. The remainder has been created in the atmosphere as part of the same photochemical activity that is responsible for ozone formation. The nitric oxide from fossil fuel combustion reacts with ozone: NO + O3 → NO2 + O2 During daylight, the NO2 absorbs blue and UV radiation