Biogeosciences, 12, 5793–5809, 2015 www.biogeosciences.net/12/5793/2015/ doi:10.5194/bg-12-5793-2015 © Author(s) 2015. CC Attribution 3.0 License.
Air-sea CO2 fluxes and the controls on ocean surface pCO2 seasonal variability in the coastal and open-ocean southwestern Atlantic Ocean: a modeling study R. Arruda1 , P. H. R. Calil1 , A. A. Bianchi2,3 , S. C. Doney4 , N. Gruber5 , I. Lima4 , and G. Turi5,a 1 Laboratório
de Dinâmica e Modelagem Oceânica (DinaMO), Instituto de Oceanografia, Universidade Federal do Rio Grande, Rio Grande, RS, Brazil 2 Departamento de Ciencias de la Atmósfera y los Oceános, Universidad de Buenos Aires, Buenos Aires, Argentina 3 Departamento Oceanografía, Servicio de Hidrografía Naval, Av. Montes de OCA2124-Buenos Aires, Argentina 4 Department of Marine Chemistry and Geochemistry, Woods Hole Oceanographic Institution, Woods Hole, MA, USA 5 Institute of Biogeochemistry and Pollutant Dynamics, ETH Zurich, Zurich, Switzerland a now at: CIRES, University of Colorado at Boulder, and NOAA/ESRL, Boulder, CO, USA Correspondence to: R. Arruda (
[email protected]) Received: 5 March 2015 – Published in Biogeosciences Discuss.: 19 May 2015 Revised: 26 September 2015 – Accepted: 2 October 2015 – Published: 12 October 2015
Abstract. We use an eddy-resolving, regional ocean biogeochemical model to investigate the main variables and processes responsible for the climatological spatio-temporal variability of pCO2 and the air-sea CO2 fluxes in the southwestern Atlantic Ocean. Overall, the region acts as a sink of atmospheric CO2 south of 30◦ S, and is close to equilibrium with the atmospheric CO2 to the north. On the shelves, the ocean acts as a weak source of CO2 , except for the mid/outer shelves of Patagonia, which act as sinks. In contrast, the inner shelves and the low latitude open ocean of the southwestern Atlantic represent source regions. Observed nearshoreto-offshore and meridional pCO2 gradients are well represented by our simulation. A sensitivity analysis shows the importance of the counteracting effects of temperature and dissolved inorganic carbon (DIC) in controlling the seasonal variability of pCO2 . Biological production and solubility are the main processes regulating pCO2 , with biological production being particularly important on the shelves. The role of mixing/stratification in modulating DIC, and therefore surface pCO2 , is shown in a vertical profile at the location of the Ocean Observatories Initiative (OOI) site in the Argentine Basin (42◦ S, 42◦ W).
1
Introduction
Shelf regions are amongst the most biogeochemically dynamical zones of the marine biosphere (Walsh, 1991; Bauer et al., 2013). Even though they comprise only 7–10 % of the global ocean area (Laruelle et al., 2013), continental shelves could contribute to approximately 10–15 % of the ocean primary production and 40 % of the ocean’s carbon sequestration through particulate organic carbon (Muller-Karger et al., 2005). Global discussions about the role of continental margins as a sink of atmospheric CO2 gained momentum after Tsunogai et al. (1999) suggested that these shelf regions take up as much as 1 Pg C yr−1 of atmospheric CO2 . Recent estimates range from 0.2 Pg C yr−1 (Laruelle et al., 2013) to roughly 0.6 Pg C yr−1 (Yool and Fasham, 2001), somewhat more modest than initially thought (Gruber, 2015), but still relevant to the global ocean sink estimated around 2.3 Pg C yr−1 (Ciais et al., 2014). Continental shelves tend to act as a sink of carbon at high and medium latitudes (30–90◦ ), and as a weak source at low latitudes (0–30◦ ) (Chen et al., 2013; Hofmann et al., 2011; Bauer et al., 2013; Laruelle et al., 2014), i.e., they tend to follow similar meridional trends as the open ocean CO2 fluxes (Landschützer et al., 2014; Takahashi et al., 2009). However, continental shelves present a higher spatiotemporal variability of air-sea CO2 fluxes than the adjacent
Published by Copernicus Publications on behalf of the European Geosciences Union.
5794 open ocean, with the inner shelf and near coastal regions generally acting as a source of CO2 to the atmosphere, while the mid/outer shelf and the continental slope generally act as sinks (Cai, 2003). This pattern can be explained by the increased primary production and decreased terrestrial supply towards the outer shelf (Walsh, 1991). Seasonality of the upper ocean (e.g. mixing and stratification) may also be important to the air-sea exchange of carbon. For example, the United States southeast continental shelf acts as a sink of CO2 in the winter and as a source in the summer (Wang et al., 2005). In the southwestern Atlantic Ocean, the shelf region presents distinct features. To the south, the Patagonian shelf is one of the world’s largest shelves with an area close to 106 km2 , broadening to more than 800 km from the coastline (Bianchi et al., 2009). To the north, the Brazilian shelf narrows to around 100–200 km from the coastline. This region is one of the most energetic regions of the world’s ocean with the confluence of the warm southward-flowing Brazil Current (BC) and the cold Malvinas Current (MC) flowing northward (Piola and Matano, 2001). The extension of the confluence roughly divides the subtropical and subantarctic oceanic gyres in the South Atlantic and might be a hotspot for shelf-open ocean exchange (Guerrero et al., 2014). In the open-ocean, the South Atlantic is thought to absorb between 0.3–0.6 Pg C yr−1 south of 30◦ S, while acting as a source to the atmosphere north of 30◦ S (Takahashi et al., 2002). Aside from global open-ocean estimates, only a few local studies were conducted on the continental shelves in this region. The Patagonia shelf was characterized as a source of CO2 to the atmosphere on the inner shelf, and as a sink in the mid-outer shelf (Bianchi et al., 2009). The southeast Brazilian shelf and continental slope were characterized as sources of CO2 to the atmosphere during all seasons (Ito et al., 2005). Such regions are often neglected, or poorly resolved, on relatively coarse global modeling assessments, although they may contribute up to 0.2 Pg C yr−1 of global ocean CO2 uptake (Laruelle et al., 2014). Regional marine biogeochemical models have been used to assess the ocean carbonate system and CO2 fluxes, including the continental margins. For example, along the US east coast, the seasonality of pCO2 was found to be controlled mainly by changes in the solubility of CO2 and biological processes (Fennel and Wilkin, 2009). Along the California coast, biological production, solubility and physical transport (e.g. circulation) were found to be the most influential processes on pCO2 variability, both spatially and temporally (Turi et al., 2014). In this study we use a regional marine biogeochemical model coupled to a hydrodynamic model to investigate the parameters and processes regulating the variability of ocean surface pCO2 in the southwestern Atlantic Ocean. Our model domain includes the location of the global node mooring that is soon to be deployed as part of the
Biogeosciences, 12, 5793–5809, 2015
R. Arruda et al.: pCO2 controls Table 1. Statistical indicators of model skill for surface ocean pCO2 in the three areas (A1, A2 and A3 – Fig. 4). The indicators are the following: ME (Model Efficiency); CF (Cost Function) and PB (Percentage of Bias). Additionally, showing total bias (µatm), correlation and total number of observations (N) available on each area. Bold values indicate “good/reasonable” model skill. Area A1 A2 A3
ME 0.23 −0.18 −4.70
CF
PB
Bias
0.52 0.61 1.83
2.88 4.23 11.59
10.26 15.0 40.4
Correlation
N
0.80 −0.34 −0.13
77 60 40
Ocean Observatories Initiative (OOI) at 42◦ S, 42◦ W (www. oceanobservatories.org). We compare modeled surface pCO2 distribution with observations and use the results to investigate the relative importance of the parameters (DIC, temperature, alkalinity and salinity) and processes (biological production, air-sea CO2 flux, CO2 solubility and physical transport) in controlling surface pCO2 distribution and variability on the continental shelf and open ocean in the southwestern Atlantic Ocean. 2 2.1
Materials and methods Model
The physical model used in this study is the Regional Ocean Modeling System (ROMS) (Shchepetkin and McWilliams, 2005). Our model domain spans from 15 to 55◦ S, and from 70 to 35◦ W, i.e., covering the southwestern Atlantic from its subtropical to subantarctic latitudes and from the continental shelf all the way out to the open ocean. The horizontal grid resolution is 9 km, with 30 vertical levels with increasing resolution towards the surface. The biogeochemical model is an NPZD type, including the following state variables: phytoplankton, zooplankton, nitrate, ammonium, small and large detritus, and a dynamic chlorophyll-to-carbon ratio for the phytoplankton (Gruber et al., 2006). A carbon component is also coupled to the model, with the addition of calcium carbonate, DIC and alkalinity to the system of state variables (Gruber et al., 2011; Hauri et al., 2013; Turi et al., 2014). Parameters and values used in the biogeochemical model are listed in Table 1 of Gruber et al. (2006). The CaCO3 cycle was parametrized as in Hauri et al. (2013). Phytoplankton types as parametrized in the model correspond to the microplankton with large nutrient requirements and relatively fast growth rates (Gruber et al., 2006). Since our domain encompasses several ecological provinces (Gonzalez-Silvera et al., 2004), we may not represent all regions equally well with only one phytoplankton functional type. The initial and boundary conditions used for the physical variables were obtained from a climatology of the Simple Ocean Data Assimilation (SODA) (Carton and Giese, www.biogeosciences.net/12/5793/2015/
R. Arruda et al.: pCO2 controls
5795
(a)
(b)
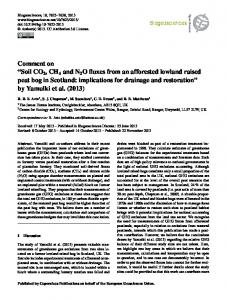
Figure 1. Areas utilized for the temporal analysis, (a) shows the three continental shelves (SEBS, SBS and PS) analyzed in a map with annual mean ocean surface pCO2 . The green circle represents the location of the vertical profile at the OOI site. (b) shows the two oceanic regions (ST and SA) in a map with bathymetry.
2008), and for the biogeochemical variables from a Community Earth System Model (CESM) climatological model product (Moore et al., 2013). The model is forced at the surface with climatological winds from QuikSCAT (Risien and Chelton, 2008) and heat and freshwater surface fluxes from the Comprehensive Ocean-Atmosphere Data Set (COADS) (Da Silva et al., 1994). We used a fixed atmospheric pCO2 of 370 µatm without CO2 incrementation throughout the years and without seasonal variations. We ran the model for 8 years and used a climatology from years 5 through 8 in our analyses. Even though processes such as river runoff and tides are locally relevant (i.e., La Plata River, and Patagonia shelf), we are not considering them in the present study (see conclusions section). The low salinity waters from the La Plata river are included in the climatological forcing from COADS which are “nudged” into the model. These shortcomings may affect the results in some regions, but it is unlikely that they will affect the overall pCO2 results in the wider domain. 2.2
Analysis
Ocean surface pCO2 is the most important variable determining the air-sea CO2 flux. This is because the variability of ocean pCO2 is much greater than that of atmospheric pCO2 , and the impact of variations in the gas transfer coefficient are usually several times smaller than those of ocean surface pCO2 (Takahashi et al., 2002). Seawater pCO2 is regulated by the concentration of dissolved inorganic carbon (DIC), alkalinity (ALK), temperature (T ) and salinity (S). While T and S are controlled solely by physical factors, DIC and ALK are affected both by biological production and physical transport. DIC concentration is also affected by air-sea CO2 fluxes (Sarmiento and Gruber, 2006). In our model, ocean surface pCO2 is calculated through a full model implementation of the seawater inorganic carbon system, i.e., as a function of the state variables T , S, DIC, and ALK, with the dissociation constants k1 and k2 from Millero www.biogeosciences.net/12/5793/2015/
(1995). In order to assess the impact of different parameters on pCO2 variability, we decompose pCO2 with respect to T , S, DIC and ALK, following the approach of Lovenduski et al. (2007); Doney et al. (2009); Turi et al. (2014) and Signorini et al. (2013), 1pCO2 =
∂pCO2 ∂pCO2 1DICs + 1ALKs ∂DIC ∂ALK ∂pCO2 ∂pCO2 1T + 1FW, + ∂T ∂FW
(1)
where the 1’s are anomalies, either spatial or temporal, relative to a domain or an annual mean, respectively. DICs and ALKs are the variable concentrations normalized to a domain-averaged surface salinity of 34.66, therefore the effects of dilution on DIC and ALK through freshwater input are not included in DICs and ALKs . The dilution effect is considered instead in the freshwater component (FW) that includes the effects of precipitation and evaporation on DIC and ALK concentrations. The partial derivatives were calculated following Doney et al. (2009). pCO2 was recalculated four times adding a small perturbation to the spatial, or temporal, domain average for each variable (T , S, DIC, ALK) while maintaining the other three variables fixed to the domain-averaged surface values. The perturbation applied here was 0.1 % of the domain mean. In order to investigate the parameters and processes controlling pCO2 on the continental margin, we limited our temporal analysis to three regions with depths shallower than 1000 m: the Southeast Brazilian Shelf (SEBS) in the northern part of the domain, the South Brazilian Shelf (SBS) in the middle of the domain that encompasses the Uruguayan Shelf, and the Patagonia Shelf (PS) to the south of the domain (Fig. 1a). We also selected two open ocean regions for comparison with the continental shelves: a subtropical (ST) and a subantarctic (SA) region (Fig. 1b). In each of these regions, we estimated the monthly contribution of each parameter to the modeled pCO2 variability by spatially averaging Biogeosciences, 12, 5793–5809, 2015
5796 the parameters within each region, and using the temporal anomalies (subtracting the annual mean) on Eq. (1). For the spatial analysis, we used the whole study area and then calculated in each grid cell the spatial anomalies (subtracting the domain mean of that grid cell), finally applying it to Eq. (1). In order to identify the main processes responsible for the variability of surface pCO2 , we used a progressive series of sensitivity experiments as in Turi et al. (2014), focusing on the processes of biological production, CO2 solubility, airsea CO2 fluxes, and physical transport. To quantify these processes, we made three additional model runs, progressively excluding each process. In the first experiment (E1), we set the CO2 gas exchange flux coefficient between the atmosphere and the ocean to zero, inhibiting gas exchange in the surface layer. In the second experiment (E2), we started from E1 and also turned off the photosynthetically available radiation (PAR), preventing phytoplankton growth. Finally, in experiment E3, the CO2 solubility was set to a constant value, calculated with the domain-averaged surface salinity and temperature of 34.66 and 12.33 ◦ C, respectively, while maintaining the changes of E1 and E2. The control run minus E1 represents the impact of gas exchange between ocean and atmosphere, E1 minus E2 represents the impact of biology, E2 minus E3 represents the impact of variable solubility. The last experiment (E3), in which there is no air-sea flux, no biology and constant solubility represents the impact of physical transport (Turi et al., 2014). Given the short model integration times, the vertical gradients in the E3 simulation have not come in to steadystate with the processes. So our physical transport is working on the vertical DIC gradients established by the biological pump. Since the lateral boundary conditions are the same for all experiments, these simulations are therefore only approximations of the impact of each process on pCO2 . Furthermore, this separation assumes a linear additionality of each process, which is clearly a strong simplification given the non-linear nature of the inorganic carbonate system (Sarmiento and Gruber, 2006). The same spatial and temporal analysis described for the variables (ALK, DIC, T and FW) was also applied for the processes experiments (airsea CO2 flux, biology, CO2 solubility, physical transport). 3
Model evaluation and validation
Model results were evaluated against data from the Surface Ocean CO2 Atlas (SOCAT) version 2 (Bakker et al., 2013). SOCAT f CO2 observations were converted into pCO2 using the set of equations from Körtzinger (1999) and then compared with modeled pCO2 to assess the overall skill of the model. Due to the paucity of in situ observations, particularly on the continental shelves, we used monthly climatologies for the comparison. The seasonal model evaluation was made over the whole domain (Fig. 1). On the Patagonia Shelf, data from the Argentinian cruises ARGAU and GEF3 were used for a more focused comparison of the model results (Bianchi Biogeosciences, 12, 5793–5809, 2015
R. Arruda et al.: pCO2 controls et al., 2009). For the Brazilian continental shelves no data were found for local comparisons. Overall, our model simulates reasonably well the seasonality of ocean surface pCO2 , with the latitudinal and crossshelf gradients represented during all seasons (Fig. 2). Since our simulation has a fixed atmospheric pCO2 of 370 µatm, this value separates the source from the sink regions. In the northernmost oceanic region, between 16 and 30◦ S, the observations show pCO2 close to 370–380 µatm. Therefore this region acts as a weak source of CO2 to the atmosphere. This tendency is well captured by the model, particularly during summer and autumn. From 30 to 55◦ S, the whole offshore region acts as a CO2 sink, with pCO2 ranging from 250 to 350 µatm during all seasons in the model results. The observations show the same pattern down to 50◦ S. However in the southernmost region the observed pCO2 rises to values close to 400 µatm. On the Southeast Brazilian Shelf, there were no data for model evaluation, but the overall behavior of pCO2 agrees with previous results from Ito et al. (2005), who suggested that the continental shelf in this region acts as a source to the atmosphere across both inner and outer shelves during all seasons. The southernmost and northernmost regions are where our model has the largest biases, underestimating the ocean surface pCO2 . These biases could be due to a variety of reasons, including the high variability of the Antarctic Circumpolar Current and/or proximity to the model boundary with potential biases in the lateral boundary conditions used to force the model. On the Patagonia Shelf the model was evaluated using in situ observations from Bianchi et al. (2009) during the years 2000 to 2006 (Fig. 3). The model agrees very well with the seasonality of the observations of this shelf region, in particular the high pCO2 values along the inner shelf, which make these regions a source of CO2 during all seasons, but more intense during autumn/winter (Fig. 3b, c, f, g). In the midouter shelf the ocean generally acts as a sink, while to the north the ocean is in equilibrium with the atmosphere particularly during winter. The monthly analysis was restricted to three offshore areas (A1, A2 and A3 in Fig. 4a). We compared the spatial monthly mean modeled surface pCO2 with the monthly average of the SOCAT pCO2 data available in each area. Within these areas, we applied the following statistical indicators used in Dabrowski et al. (2014) in order to quantitatively assess model skill: model efficiency ME = 1−(6(O − ¯ 2 ) (Nash and Sutcliffe, 1970), cost funcM)2 )/(6(O − O) tion CF = (6 | M − O |)/(nσo ) (Ospar et al., 1998) and percentage of bias PB =| (6(O − M).100)/6O | (Allen et al., 2007), where M stands for modeled pCO2 and O for observations from SOCAT database, n is the number of observations and σo is the standard deviation of all observations. These statistics are indicators of the model’s performance and provide complementary information of the model skill. ME relates model error with observational variability, CF is the ratio of mean absolute error to standard deviation www.biogeosciences.net/12/5793/2015/
R. Arruda et al.: pCO2 controls
5797
(a) Summer (JFM)
(b) Autumn (AMJ)
(c) Winter (JAS)
(d) Spring (OND)
(e) Summer (JFM)
(f) Autumn (AMJ)
(g) Winter (JAS)
(h) Spring (OND)
Figure 2. Seasonal climatology of modeled ocean surface pCO2 (upper row) and observations of pCO2 from the SOCAT database (lower row). The white separation between red and blue is set to 370 µatm which is the atmospheric pCO2 used in this study. Blue represents a sink of atmospheric CO2 and red a source.
(a) Summer (JFM)
(b) Autumn (AMJ)
(c) Winter (JAS)
(d) Spring (OND)
(e) Summer (JFM)
(f) Autumn (AMJ)
(g) Winter (JAS)
(h) Spring (OND)
Figure 3. Model evaluation on the Patagonia Shelf (PS) (zoom in from model domain in Fig. 2a). Seasonal climatology of modeled ocean surface pCO2 (upper row) and pCO2 observations from ARGAU and GEF3 cruises(lower row) (Bianchi et al., 2009). The white separation between red and blue is set to 370 µatm which is the atmospheric pCO2 used in this study. Blue represents a sink of atmospheric CO2 and red a source.
www.biogeosciences.net/12/5793/2015/
Biogeosciences, 12, 5793–5809, 2015
5798
R. Arruda et al.: pCO2 controls
(a) areas
(c) A2
(b) A1
(d) A3
Figure 4. Location of the three areas used for the monthly comparison with SOCAT database (a) in a map with annual mean eddy kinetic energy. In panels (b), (c) and (d), green lines are the modeled monthly mean pCO2 and black lines are the monthly mean pCO2 from SOCAT. Error bars are two standard deviations.
of observations, and PB is the bias normalized by the observations (Dabrowski et al., 2014; Stow et al., 2009). Basically if ME > 0.5, CF < 1 and PB < 20, this indicates that the model is “good/reasonable” when comparing to observations. If ME < 0.2, CF > 3 and PB > 40 the model is classified as “poor/bad”. Modeled pCO2 results for A1 agree very well with the observations, representing the pCO2 evolution throughout the year with maximum values in summer (Fig. 4b). All statistical indicators characterized the model with a good/reasonable skill in A1 (Table 1). A2 is the region with the largest pCO2 standard deviation from both model and observations (Fig. 4c). This region is near the confluence between the warm Brazil Current and the cold Malvinas Current, generating one of the most energetic regions of the world’s oceans. Moreover, this region comprises the shelfbreak front, with differences in stratification, local dynamics and salinity between shelf waters and Malvinas current waters (Fig. 4a). Consequently, ME was estimated as poor/bad in this region, probably due to the high pCO2 data variability. But CF and PB were both rated as “good/reasonable” (Table 1). In A3 the model consistently underestimated pCO2 (Fig. 4d). This bias is seen in the seasonal comparison and in the monthly analysis, where summer is the only season for which modeled pCO2 is within the standard deviation of the observations. ME was estimated as poor/bad in A3, but PB and CF rated our model as reasonable and good, respectively.
Biogeosciences, 12, 5793–5809, 2015
(Table 1). Both A2 and A3 regions are close to an area of elevated eddy kinetic energy (Fig. 4a), which could explain the large standard deviation and biases in these regions. The Taylor diagram is consistent with the model efficiency (ME) estimate, showing good/reasonable results in A1, with a correlation of 0.8, and poor results in A2 and A3, with negative correlations (Fig. 5). Only in A1 the correlation was found to be statistically significant. Aside from greater pCO2 variability in these regions, the poor results found in A2 and A3 could also be due to the paucity of the observational data both in space and time. Furthermore, in order to validate the baseline of our model, seasonal climatologies of modeled sea-surface temperature and chlorophyll a were compared with climatologies from AVHRR and MODIS-aqua, respectively. Results and a detailed discussion of this validation are shown in the Appendix. In conclusion, our model reproduces the most important north-south and inner-outer shelf gradients seen in the pCO2 observations. While there is clearly room for improvement, we deem this level of agreement as sufficient for proceeding to the analysis of the processes and parameters affecting pCO2 variability in this region.
www.biogeosciences.net/12/5793/2015/
R. Arruda et al.: pCO2 controls
5799
Figure 5. Taylor Diagram showing the three areas used for comparison with SOCAT observational data. A1 is the only area with statistically significant correlation.
(a) pCO2 Anomalies
(b)
∂pCO2 ∆ALK s ∂ALK
(c)
∂pCO2 ∆F W ∂F W
(d)
∂pCO2 ∆T ∂T
(e)
∂pCO2 ∆DIC s ∂DIC
Figure 6. pCO2 spatial anomalies – difference between annual mean and domain mean (a) and the contribution of the main drivers: ALKs (b), FW (c), T (d) and DICs (e). Computed using spatial anomalies for 1.
4 4.1
Results and Discussion pCO2 drivers – spatial analysis
Modeled pCO2 spatial anomalies relative to the domain average are shown in Fig. 6a, with positive anomalies prevailing on the Brazilian continental shelves, inner-mid Patagonia Shelf and North of 32◦ S, while the negative anomalies are www.biogeosciences.net/12/5793/2015/
found in the open ocean south of 32◦ S and in the mid-outer Patagonia Shelf. DICs has the highest impact on the spatial variations, being counteracted by ALKs and T (Fig. 6). In contrast, the fresh water flux has a minor influence on the spatial anomalies of pCO2 , agreeing with Turi et al. (2014) and Doney et al. (2009). Despite its smaller role, the influence of ALKs on pCO2 anomalies was higher (−100 to 100 µatm) than those found in previous studies in other re-
Biogeosciences, 12, 5793–5809, 2015
5800
R. Arruda et al.: pCO2 controls
(a) Air-Sea CO2 flux
(b) CO2 solubility
(c) Physical transport
(d) Biology
Figure 7. Processes driving the annual mean surface pCO2 . Contribution of Air-sea flux of CO2 [Control–E1] (a), CO2 solubility [E2–E3] (b), physical transport [E3] (c) and biological production [E1–E2] (d).
gions (Lovenduski et al., 2007; Turi et al., 2014). The higher contribution of both DICs and ALKs to the spatial variations in pCO2 could be explained by the more heterogeneous domain that encompasses several distinct surface water masses and frontal zones. Also, the elevated contribution of ALKs could be due to our relatively high CaCO3 to biological production ratio of 0.07. The changes in the state variables affecting pCO2 are ultimately being driven by physical and biogeochemical processes. We investigate the role of each of these processes in controlling the changes in surface pCO2 from our sensitivity experiments (E1, E2, E3). The most important processes affecting the spatial distribution of pCO2 are biological production (E1–E2) and physical transport (E3) (Fig. 7). When physical transport (vertical and horizontal) is the only process altering pCO2 , we observe an increase in pCO2 of up to 800 µatm on the continental shelves, due to the upwelling and vertical mixing of DIC-rich subsurface waters. At the same time, the effect of biological production on the uptake of DIC and changes in ALK due to nitrate uptake and production/dissolution of CaCO3 accounts for a decrease of up to −600 µatm on the continental shelves. Solubility effects (E2– E3) are responsible for a decrease in pCO2 south of 45◦ S and an increase in pCO2 to the north, ranging from −50 to 50 µatm. Finally, air-sea CO2 fluxes (Control–E1) have little impact on regulating the ocean surface pCO2 . The effect of both biological production and physical transport is highest on the continental shelves. The balance between these processes also largely control pCO2 in the open ocean. North of 45◦ S, biological production is counteracted by physical transport and, to a minor extent, solubility, whereas south of 45◦ S physical transport is counteracted by biological production and solubility. The strong effect of biological production on the shelf region is a result of the elevated nutrient supply and high primary production found in these regions, with increasing contribution towards the inner shelves. Physical transport also presents a higher contribution on the continental shelves,
Biogeosciences, 12, 5793–5809, 2015
where the mixed layer often spans the entire water column, showing the importance of vertical mixing in bringing DIC as well as nutrients to the surface waters, therefore increasing pCO2 . These results are in agreement with previous studies (c.f. Turi et al. (2014)), showing the importance of the biological net community production and advection of ALK and DIC (physical transport) in controlling ocean surface pCO2 . This suggests a major role of net community production in reducing ocean pCO2 in the region. 4.2
pCO2 drivers – temporal analysis
In order to identify the seasonal variability of the contribution of each parameter, we used local grid temporal anomalies over the seasonal cycle (Fig. 8). DICs and T are still the most influential parameters, with increasing importance on the continental shelves. The contribution by ALKs is relevant only on continental shelves south of 32◦ S, and FW have a minor influence (not shown). It is important to highlight that the magnitude of the signals seen in this analysis is one order of magnitude smaller than the previous spatial analysis. This is likely due to our large and heterogeneous domain, which results in large spatial gradients as compared to the range found over the seasonal cycles. The contribution of the state variables in each continental shelf region (Fig. 9) shows that these three regions have distinct characteristics, with different contributions from each parameter. In all three regions, DICs and T are the most important parameters affecting pCO2 anomalies, albeit with opposing and seasonally varying contributions. While in summer the T contribution increases pCO2 , that of DICs acts to diminish pCO2 . The opposite occurs in winter. The Southeast Brazilian Shelf (SEBS) is the region with the least variability in pCO2 anomalies, with the contributions of both DICs and T in this region ranging from −10 to 10 µatm. The South Brazilian Shelf (SBS) is the region with the largest variability in pCO2 anomalies, with ALKs having the most prominent impact on pCO2 as compared to the other www.biogeosciences.net/12/5793/2015/
R. Arruda et al.: pCO2 controls
(a)
5801
∂pCO2 ∆ALK s ∂ALK
(b)
∂pCO2 ∆T ∂T
(c)
∂pCO2 ∆DIC s ∂DIC
Figure 8. Sensitivity of pCO2 computed with grid point anomalies in time to local annual means. Annual mean contribution of the main drivers: ALKs (a), T (b) and DICs (c).
(a) PS
(b) SBS
(c) SEBS
Figure 9. Temporal evolution of pCO2 anomalies and their drivers in each continental shelf (right hand side of Eq. (1) using temporal anomalies), red line represents the effects of Temperature, blue line the effects of DICs , green line FW, and yellow line ALKs .
regions (up to 15 µatm in spring). DICs is the most important parameter in this area, with a contribution of up to 70 µatm, followed by temperature, with a contribution of up to 60 µatm in the winter. On the Patagonia Shelf (PS) and South Brazilian Shelf (SBS), although the contributions by DICs and T are large, the tendency of these two terms to cancel each other out results in smaller pCO2 anomalies. In both SBS and PS, pCO2 is predominately controlled by T and DICs , with small contributions from ALK and FW. Seasonal warming/cooling largely controls pCO2 anomalies throughout the continental shelves. This signal is dampened by DICs , but also by ALKs in the case of the South Brazilian Shelf (SBS). This pattern of seasonal variation of the parameters on continental shelves agrees with the results from Signorini et al. (2013) and Turi et al. (2014), although with different absolute values. The pattern of diminwww.biogeosciences.net/12/5793/2015/
ishing variability towards subtropical continental shelves is also shown by Signorini et al. (2013). This pattern of opposing contributions of T and DIC was also found along the North American east coast by Signorini et al. (2013), who attributed winter mixing and the springsummer biological drawdown as the processes responsible for pCO2 and DIC variability. In the offshore subtropical region (ST) the pCO2 anomalies have higher amplitudes than in the adjacent continental shelf (SEBS), and are driven mainly by temperature, with the other variables having minor contributions (Fig. 11). In the offshore southern region (SA), DICs controls pCO2 variability, with T and ALKs dampening pCO2 anomalies (Fig. 11), similar to the adjacent shelf (PS). The analysis of the processes underlying this seasonal variability using our progressive sensitivity simulations Biogeosciences, 12, 5793–5809, 2015
5802
R. Arruda et al.: pCO2 controls
(a) PS
(b) SBS
(c) SEBS
Figure 10. Temporal evolution of the monthly anomalies of each process in regulating pCO2 anomalies, green line represents the biological production, red line the physical transport, light blue line the air-sea CO2 fluxes and dark blue line the CO2 solubility. Black lines represent the temporal pCO2 anomalies.
(a) ST
(b) ST
(c) SA
(d) SA
Figure 11. Panels (a) and (b) show the temporal evolution of pCO2 anomalies and its drivers in each oceanic regions (ST and SA) (right hand side of Eq. (1) using temporal anomalies), red line represents the effects of T , blue line the effects of DICs , green line the FW and yellow line ALKs . Panels (c) and (e) show the temporal evolution of the monthly anomalies of each process in regulating temporal pCO2 anomalies, green line represents the biological production, red line the physical transport, light blue line the air-sea CO2 fluxes and dark blue line the CO2 solubility. Black lines represent the temporal pCO2 anomalies.
shows that on all shelf regions, biological production and CO2 solubility mostly control pCO2 variability (Fig. 10). Physical transport, although weaker than biological produc-
Biogeosciences, 12, 5793–5809, 2015
tion, acts to diminish the pCO2 variability by counteracting the effects of biology and increasing DIC concentrations. In our case, physical transport controls pCO2 spatially, but the
www.biogeosciences.net/12/5793/2015/
R. Arruda et al.: pCO2 controls
5803
(a) annual mean flux
(b) SBS
(c) SEBS
(d) PS
Figure 12. Panel (a) is the annual mean of air-sea CO2 fluxes. Panels (b), (c) and (d) show the monthly average of surface CO2 fluxes constrained to bathymetry levels of 100, 200 and 1000 m.
temporal effects of physical transport are much weaker than in Turi et al. (2014) along the California coast. This is probably due to the much stronger upwelling in that region that dampens the effects of biology by bringing DIC rich waters to the surface. Along western boundaries, upwelling is weaker and more localized. Physical transport is therefore more related to processes that modulate vertical mixing and stratification (thereby controlling the seasonal enrichment of surface waters) and horizontal advection due to the presence of two major western boundary currents. Finally, air-sea CO2 fluxes show only a minor contribution to the pCO2 anomalies. In conclusion, on the Patagonia Shelf (PS), the biological production is the most important contributor to pCO2 variability, with a peak summer contribution of −80 µatm and a maximum in the winter of 70 µatm. On the South Brazilian Shelf (SBS), solubility is the most influential process (up to 90 µatm), followed by biological production and physical transport, during all seasons. On the Southeast Brazilian Shelf (SEBS), the pattern is the same as in the SBS, although with a smaller magnitude and variability. Physical transport, although large in absolute contributions in the spatial analysis, has a lower contribution to pCO2 variability in the temporal analysis. In the subtropical region, processes that control the temporal variability of pCO2 on the shelf and offshore are different. In the open ocean (ST) (Fig. 11) pCO2 is mainly controlled by solubility, with biological production having the least effect on pCO2 . This contrasts with the importance of biology at mid/low latitude continental shelves (SEBS). In the subantarctic region, the processes controlling pCO2 are similar www.biogeosciences.net/12/5793/2015/
for both the offshore region (SA) and the adjacent continental shelf (PS) (Figs. 10 and 11). In this case biological production is the most important process countered mainly by solubility, although with a smaller magnitude in the offshore region. 4.3
Air-sea CO2 fluxes
On the continental margins, we investigate monthly averaged air-sea CO2 fluxes on the inner shelf (0–100 m depth), midouter shelf (100–200 m depth) and shelf break-slope (200– 1000 m depth) (Fig. 12a). As shown in the previous sections, the inner shelves have a potential to act as a source of CO2 , while the mid/outer shelves tend to act as a sink of CO2 . On the Brazilian shelves (SBS and SEBS) the flux density of CO2 in the inner shelves is around 0 and 0.5 mol C m−2 yr−1 , thus this region acts as a weak source. On the mid/outer shelf a shift towards CO2 sink occurs, with a flux density of between −1 and 0 mol C m−2 yr−1 on the Southeast Brazilian shelf (SEBS) (Fig. 12c). On the mid/outer South Brazilian Shelf (SBS) the sink is slightly stronger with an average flux between −1.5 and −0.5 mol C m−2 yr−1 (Fig. 12b). The Patagonia Shelf (PS) acts on average as a sink of CO2 , with fluxes larger than on the Brazilian shelves. CO2 uptake intensifies from the inner Patagonian shelf (−1.0 to −0.5 mol C m−2 yr−1 ) to the outer shelf and continental slope (−2.0 to −4.0 mol C m−2 yr−1 ) (Fig. 12d). Although, overall the PS acts on average as a sink, there are some coastal regions that act as a source of CO2 , in agreement with the observations of Bianchi et al. (2009).
Biogeosciences, 12, 5793–5809, 2015
5804
R. Arruda et al.: pCO2 controls
(a)
(b)
(c)
Figure 13. Vertical profile at 42◦ S, 42◦ W. Upper panels showing monthly mean surface pCO2 (solid black line), pCO2 anomalies (dashed black line) and the contribution from T and DICs (red and blue dashed lines) and the contribution of biology and solubility (green and cyan dashed lines). Lower panels showing vertical profiles of DIC (a), T (b), and chlorophyll a (c), black line represents the mixed layer depth.
Annual mean modeled air-sea CO2 fluxes agreed reasonably well with global climatologies in the oceanic regions (not shown) (Takahashi et al., 2002; Landschützer et al., 2014). South of 30◦ S, the open ocean acts on average as a sink of atmospheric CO2 , uptaking up to 4 mol C m−2 yr−1 . North of 30◦ S, the open ocean is on average in equilibrium with the atmosphere (Fig. 12a). On the continental margins, our annual mean air-sea CO2 fluxes compare well with the global estimate from Laruelle et al. (2014), Biogeosciences, 12, 5793–5809, 2015
with the Patagonia Shelf acting as a CO2 sink (−1.0 to −3.0 mol C m−2 yr−1 ) and the Brazilian shelves as weak sources (0 to 1 mol C m−2 yr−1 ). Nevertheless, we found variability in these areas, with regions on the inner Patagonia Shelf acting as a source or in equilibrium with the atmosphere (0 to 2.0 mol C m−2 yr−1 ), and regions on the outer Brazilian shelves acting as sinks of CO2 .
www.biogeosciences.net/12/5793/2015/
R. Arruda et al.: pCO2 controls 4.4
Vertical structure – case study at Argentine OOI site
Seasonal variations in mixing and stratification control the evolution of the mixed layer depth and consequently the vertical structure of the state variables of the carbonate system. Diapycnal fluxes and uptake of DIC by primary producers are important processes regulating ocean surface pCO2 (Rippeth et al., 2014). Therefore, surface pCO2 variability is linked to variations in mixed layer depths. In order to understand the seasonal evolution of the upper ocean vertical distribution of the state variables in the region and how it affects surface pCO2 , we chose the location of the Ocean Observatory Initiative (OOI) site in the Argentine Basin at 42◦ S, 42◦ W (Fig. 1a), as it will soon become a testbed for the validation of biogeochemical models globally and regionally. We extracted modeled climatological vertical profiles of DIC concentration, temperature and chlorophyll a, and compared with the modeled surface pCO2 and mixed layer depth (Fig. 13). During the entire year, this location acts in our model as a sink for atmospheric CO2 , with modeled surface pCO2 ranging from 280 to 320 µatm. The contribution of DICs and T are again driving surface pCO2 anomalies. In this case DICs is controlling the anomalies signal, being modulated by temperature. The main processes affecting pCO2 in this location is biological production and solubility. Minimum pCO2 in summer coincides with strong stratification and elevated subsurface biological production, respectively, with the opposing contribution of DICs and T leading to pCO2 anomalies near zero. Maximum pCO2 occurs when the mixed layer depth deepens, during fall and winter, causing an increase in DIC concentrations in surface waters. This has a larger effect on pCO2 than the decrease in temperature, resulting in positive pCO2 anomalies. The excess of DIC is consumed by biological fixation during spring and summer, thus reducing surface pCO2 . 5
Conclusions
In this study, we used climatologies derived from a regional hydrodynamic model coupled to a biogeochemical model to investigate the main parameters and processes that control ocean surface pCO2 and air-sea CO2 fluxes in the southwestern Atlantic Ocean. Modeled ocean surface pCO2 compared well with the available in situ data, reproducing the expected meridional and cross-shelf gradients of pCO2 , with elevated pCO2 in the inner shelves and at lower latitudes. Our results highlight that the most important variables controlling the spatio-temporal variability of pCO2 are T and DICs . These two variables have opposing effects on pCO2 and have been shown to be the main drivers of pCO2 both in global (Sarmiento and Gruber, 2006; Doney et al., 2009) and in other regional studies (Turi et al., 2014; Signorini et al., 2013; Lovenduski et al., 2007). ALKs is of secondary imwww.biogeosciences.net/12/5793/2015/
5805 portance as a spatial regulator of pCO2 , with larger impacts particularly in the South Brazilian Shelf (SBS) and in the southern open ocean region (SA). The most important processes underlying changes on the state variables and thus on pCO2 are biological production and CO2 solubility. Biological production is particularly important on the continental shelves, with higher contribution at high latitudes. In the open ocean, CO2 solubility is the main process driving pCO2 variations in the subtropics, while in the subantarctic both CO2 solubility and biological production are important drivers of pCO2 variability. The southwestern Atlantic Ocean acts, on average, as a sink of atmospheric CO2 south of 30◦ S, and is close to equilibrium to the north. In the inner continental shelves the ocean acts either as a weak source or is in equilibrium with the atmosphere. To the outer shelf the ocean shifts to a sink of CO2 . The entire Patagonian shelf acts, on average, as a sink, but there are some particular regions in the inner shelf that acts as a source of CO2 . The total integrated flux agrees well with Laruelle et al. (2014), particularly on the Brazilian Shelves (SEBS and SBS). In the Patagonia Shelf (PS), we found a slightly stronger sink on the mid/outer Patagonian Shelf (−1.0 to −3.0 mol C m−2 yr−1 ) and more variability towards the inner shelf. Our model does not include river inputs of carbon, which are known to be an important factor regulating pCO2 (Bauer et al., 2013). The lack of tides may adversely affect our model results in the inner shelf of Patagonia, where tidal amplitudes can reach up to 12 m (Kantha, 1995; Saraceno et al., 2010) and tidal fronts are known to impact oceanic pCO2 (Bianchi et al., 2005). In future regional studies focused on the Patagonia shelf, tides and river run-off should be included. Modeling studies such as this one depend heavily on in situ observations, the lack of which hampers our ability to properly refine our model. This will certainly be improved by future efforts in data assimilation from vertical profiles of biogeochemical and physical variables collected at the OOI site in the Argentine basin. This study is a first step towards understanding the processes controlling surface pCO2 in an undersampled, yet highly important, region of the world’s ocean.
Biogeosciences, 12, 5793–5809, 2015
5806
R. Arruda et al.: pCO2 controls
Appendix A: Model validation (SST and chlorophyll a) Seasonal climatologies of 4 years of modeled sea surface temperature and chlorophyll a concentration were compared with climatologies from the sensors AVHRR (1985–2002) and Modis-aqua (2003–2013), respectively (Figs. A1 and A2). Modeled sea surface temperature compared well with AVHRR (Fig. A1) representing both subantarctic and subtropical oceanic regions during all seasons. Modeled chlorophyll a concentration reproduces the general pattern from MODIS-aqua (Fig. A2), with low concentrations in the oceanic regions and higher concentrations on the continental shelves. However, modeled chlorophyll a concentrations are overestimated in the open ocean regions (0.5 mg Chl a m−3 ), especially in the spring season (up to 1 mg Chl a m−3 ). In the coastal regions, we underestimate chlorophyll a on the Patagonia Shelf during spring and summer seasons. Expectedly, there was an underestimation in the La Plata region, since we are not modeling the nutrient and organic loads from the river. Finally, on the Brazilian shelf our model overestimates chlorophyll a, particularly during summer and spring seasons. These biases may be due to our application of a relatively simple ecosystem model with only one phytoplankton functional type in such a wide region, which encompasses several ecological provinces. Nevertheless, the general pattern is well reproduced in this first effort in modeling the biogeochemistry of the southwestern Atlantic Ocean, and the biases may not significantly compromise our analysis of drivers and processes of pCO2 variability.
Biogeosciences, 12, 5793–5809, 2015
www.biogeosciences.net/12/5793/2015/
R. Arruda et al.: pCO2 controls
5807
(a) Summer
(b) Autumn
(c) Winter
(d) Spring
(e) Summer
(f) Autumn
(g) Winter
(h) Spring
Figure A1. Seasonal climatology of modeled sea surface temperature ◦ C – 4 years average (upper row), and climatology from AVHRR sensor – from 1985 to 2002 (lower row).
(a) Summer
(b) Autumn
(c) Winter
(d) Spring
(e) Summer
(f) Autumn
(g) Winter
(h) Spring
Figure A2. Seasonal climatology of modeled chlorophyll a concentration mg Chl a m−3 – 4 years average (upper row), and climatology from Aqua-Modis sensor – from 2003 to 2013 (lower row).
www.biogeosciences.net/12/5793/2015/
Biogeosciences, 12, 5793–5809, 2015
5808 Acknowledgements. P. H. R. Calil acknowledges support from the Brazilian agencies Conselho Nacional de Desenvolvimento Científico e Tecnológico (CNPq), grants 483112/2012-7 and 307385/2013-2, and the Coordenação de Aperfeiçoamento de Pessoal de Nível Superior (CAPES Process 23038.004299/2014-53). R. Arruda acknowledges support from a CAPES scholarship. S. C. Doney and I. Lima acknowledge support from the National Science Foundation (NSF AGS-1048827). N. Gruber and G. Turi received support from ETH Zurich and from the EU FP7 project CarboChange (264879). The Surface Ocean CO2 Atlas (SOCAT) is an international effort, supported by the International Ocean Carbon Coordination Project (IOCCP), the Surface Ocean Lower Atmosphere Study (SOLAS), and the Integrated Marine Biogeochemistry and Ecosystem Research program (IMBER), to deliver a uniformly qualitycontrolled surface ocean CO2 database. The many researchers and funding agencies responsible for the collection of data and quality control are thanked for their contributions to SOCAT. We are greatly indebted with the Ministero de Defensa de Argentina that supported the project “Balance y variabilidad del flujo mar-aire en el Mar Patagónico” (PIDDEF 47/11). This work was carried out with the aid of a grant from the Inter-American Institute for Global Change Research (IAI) CRN3070 which is supported by the US National Science Foundation (Grant GEO-1128040). Supported by Global Environmental Facilities (GEF) in the frame of PNUD ARG/02/018-GEF BIRF No. 28385-AR, subproject B-B46, and by Servicio de Hidrografía Naval. Additional support was provided by the ARGAU Project, Instituto Antártico Argentino, Institut National de Sciences de l’Univers, Processus Biogeochimiques dans l’Océan et Flux, Université Pierre et Marie Curie. Edited by: C. Klaas
References Allen, J., Somerfield, P., and Gilbert, F.: Quantifying uncertainty in high-resolution coupled hydrodynamic-ecosystem models, J. Marine Syst., 64, 3–14, doi:10.1016/j.jmarsys.2006.02.010, 2007. Bakker, D. C. E., Pfeil, B., Smith, K. et al.: An update to the Surface Ocean CO2 Atlas (SOCAT version 2), Earth Syst. Sci. Data, 6, 69–90, doi:10.5194/essd-6-69-2014, 2014. Bauer, J. E., Cai, W.-J., Raymond, P. A., Bianchi, T. S., Hopkinson, C. S., and Regnier, P. A. G.: The changing carbon cycle of the coastal ocean, Nature, 504, 61–70, doi:10.1038/nature12857, 2013. Bianchi, A. A., Piola, A. R., Pino, D. R., Schloss, I., Poisson, A., and Balestrini, C. F.: Vertical stratification and air–sea CO2 fluxes in the Patagonian Shelf, J. Geophys. Res., 110, C07003, doi:10.1029/2004JC002488, 2005. Bianchi, A. A., Pino, D. R., Perlender, H. G. I., Osiroff, A. P., Segura, V., Lutz, V., Clara, M. L., Balestrini, C. F., and Piola, A. R.: Annual balance and seasonal variability of sea–air CO2 fluxes in the Patagonia Sea: their relationship with fronts and chlorophyll distribution, J. Geophys. Res., 114, C03018, doi:10.1029/2008JC004854, 2009. Cai, W.-J.: The role of marsh-dominated heterotrophic continental margins in transport of CO2 between the atmosphere, the
Biogeosciences, 12, 5793–5809, 2015
R. Arruda et al.: pCO2 controls land–sea interface and the ocean, Geophys. Res. Lett., 30, 1849, doi:10.1029/2003GL017633, 2003. Carton, J. A. and Giese, B. S.: A reanalysis of ocean climate using Simple Ocean Data Assimilation (SODA), Mon. Weather Rev., 136, 2999–3017, 2008. Chen, C.-T. A., Huang, T.-H., Chen, Y.-C., Bai, Y., He, X., and Kang, Y.: Air–sea exchanges of CO2 in the world’s coastal seas, Biogeosciences, 10, 6509–6544, doi:10.5194/bg-10-6509-2013, 2013. Ciais, P., Sabine, C., Bala, G., Bopp, L., Brovkin, V., Canadell, J., Chhabra, A., DeFries, R., Galloway, J., Heimann, M., Jones, C., Le Quéré, C., Myneni, R. B., Piao, S., and Thornton, P.: Carbon and other biogeochemical cycles, in: Climate Change 2013: the Physical Science Basis, Contribution of Working Group I to the Fifth Assessment Report of the Intergovernmental Panel on Climate Change, Cambridge University Press, Cambridge, UK and New York, NY, USA, 465–570, 2014. Da Silva, A., Young, C., and Levitus, S.: Atlas of Surface Marine Data 1994, vol. 1, Algorithms and Procedures, NOAA Atlas NESDIS 6, US Department of Commerce, NOAA, NESDIS, USA, p. 74, 1994. Dabrowski, T., Lyons, K., Berry, A., Cusack, C., and Nolan, G. D.: An operational biogeochemical model of the North-East Atlantic: model description and skill assessment, J. Marine Syst., 129, 350–367, doi:10.1016/j.jmarsys.2013.08.001, 2014. Doney, S. C., Lima, I., Feely, R. A., Glover, D. M., Lindsay, K., Mahowald, N., Moore, J. K., and Wanninkhof, R.: Mechanisms governing interannual variability in upper-ocean inorganic carbon system and air–sea CO2 fluxes: physical climate and atmospheric dust, Deep-Sea Res. Pt. II, 56, 640–655, doi:10.1016/j.dsr2.2008.12.006, 2009. Fennel, K. and Wilkin, J.: Quantifying biological carbon export for the northwest North Atlantic continental shelves, Geophys. Res. Lett., 36, L18605, doi:10.1029/2009GL039818, 2009. Gonzalez-Silvera, A., Santamaria-del Angela, E., Garcia, V. M. T., Garcia, C. A. E., Millan-Nunez, R., and Muller-Karger, F.: Biogeographical regions of the tropical and subtropical Atlantic Ocean off South America: classification based on pigment (CZCS) and chlorophyll-a (SeaWiFS), Cont. Shelf Res., 24, 983–1000, doi:10.1016/j.csr.2004.03.002, 2004. Gruber, N.: Ocean biogeochemistry: carbon at the coastal interface, Nature, 517, 148–149, 2015. Gruber, N., Frenzel, H., Doney, S. C., Marchesiello, P., McWilliams, J. C., Moisan, J. R., Oram, J. J., Plattner, G.-K., and Stolzenbach, K. D.: Eddy-resolving simulation of plankton ecosystem dynamics in the California Current System, Deep-Sea Res. Pt. I, 53, 1483–1516, doi:10.1016/j.dsr.2006.06.005, 2006. Gruber, N., Lachkar, Z., Frenzel, H., Marchesiello, P., Münnich, M., McWilliams, J. C., Nagai, T., and Plattner, G.-K.: Eddy-induced reduction of biological production in eastern boundary upwelling systems, Nat. Geosci., 4, 787–792, doi:10.1038/ngeo1273, 2011. Guerrero, R. A., Piola, A. R., Fenco, H., Matano, R. P., Combes, V., Chao, Y., James, C., Palma, E. D., Saraceno, M., and Strub, P. T.: The salinity signature of the cross-shelf exchanges in the Southwestern Atlantic Ocean: satellite observations, J. Geophys. Res.Oceans, 119, 7794–7810, 2014. Hauri, C., Gruber, N., Vogt, M., Doney, S. C., Feely, R. A., Lachkar, Z., Leinweber, A., McDonnell, A. M. P., Munnich, M., and Plattner, G.-K.: Spatiotemporal variability and long-term
www.biogeosciences.net/12/5793/2015/
R. Arruda et al.: pCO2 controls trends of ocean acidification in the California Current System, Biogeosciences, 10, 193–216, doi:10.5194/bg-10-1932013, 2013. Hofmann, E. E., Cahill, B., Fennel, K., Friedrichs, M. A. M., Hyde, K., Lee, C., Mannino, A., Najjar, R. G., O’Reilly, J. E., Wilkin, J., and Xue, J.: Modeling the dynamics of continental shelf carbon, Ann. Rev. Mar. Sci., 3, 93–122, doi:10.1146/annurev-marine-120709-142740, 2011. Ito, R., Schneider, B., and Thomas, H.: Distribution of surface f CO2 and air–sea fluxes in the Southwestern subtropical Atlantic and adjacent continental shelf, J. Marine Syst., 56, 227– 242, doi:10.1016/j.jmarsys.2005.02.005, 2005. Kantha, L.: Barotropic tides in the global oceans from a nonlinear tidal model assimilating altimetric tides: 1. Model description and results, J. Geophys. Res.-Oceans, 100, 283–308, doi:10.1029/95JC02578, 1995. Körtzinger, A.: Determination of carbon dioxide partial pressure (p(CO2 )), in: Methods of Seawater Analysis, 3rd edn., 149–158, 1999. Landschützer, P., Gruber, N., Bakker, D., and Schuster, U.: Recent variability of the global ocean carbon sink, Global Biogeochem. Cy., 28, 927–949, 2014. Laruelle, G. G., Dürr, H. H., Lauerwald, R., Hartmann, J., Slomp, C. P., Goossens, N., and Regnier, P. A. G.: Global multiscale segmentation of continental and coastal waters from the watersheds to the continental margins, Hydrol. Earth Syst. Sci., 17, 2029–2051, doi:10.5194/hess-17-2029-2013, 2013. Laruelle, G. G., Lauerwald, R., Pfeil, B., and Regnier, P.: Regionalized global budget of the CO2 exchange at the air–water interface in continental shelf seas, Global Biogeochem. Cy., 28, 1199–1214, 2014. Lovenduski, N. S., Gruber, N., Doney, S. C., and Lima, I. D.: Enhanced CO2 outgassing in the Southern Ocean from a positive phase of the Southern Annular Mode, Global Biogeochem. Cy., 21, GB2026, doi:10.1029/2006GB002900, 2007. Millero, F.: Thermodynamics of the carbon dioxide system in the oceans, Geochim. Cosmochim. Ac., 59, 661–677, 1995. Moore, J. K., Lindsay, K., Doney, S. C., Long, M. C., and Misumi, K.: Marine ecosystem dynamics and biogeochemical cycling in the Community Earth System Model [CESM1 (BGC)]: Comparison of the 1990s with the 2090s under the RCP4. 5 and RCP8. 5 scenarios, J. Climate, 26, 9291–9312, 2013. Muller-Karger, F. E., Varela, R., Thunell, R., Luerssen, R., Hu, C., and Walsh, J. J.: The importance of continental margins in the global carbon cycle, Geophys. Res. Lett., 32, L01602, doi:10.1029/2004GL021346, 2005. Nash, J. and Sutcliffe, J.: River flow forecasting through conceptual models Part I – a discussion of principles, J. Hydrol., 10, 282– 290, 1970. Ospar, V. M., De Vries, I., Bokhorst, M., Ferreira, J., GellersBarkmann, S., Kelly-Gerreyn, B., Lancelot, C., Mensguen, A., Moll, A., Pätsch, J., Radach, G., Skogen, M., Soiland, H., Svendsen, E., and Vested, H. J.: Report of the ASMO Modelling Workshop on Eutrophication Issues, The Hague, the Netherlands, 5–8 November 1996, OSPAR Commission Report, 102, 90, 1998. Piola, A. and Matano, R.: Brazil and Falklands (Malvinas) currents, in: Ocean Currents: a Derivative of the Encyclopedia of Ocean Sciences, 35–43, 2001.
www.biogeosciences.net/12/5793/2015/
5809 Rippeth, T., Lincoln, B., Kennedy, H., Palmer, M., Sharples, J., and Williams, C.: Impact of vertical mixing on sea surface pCO2 in temperate seasonally stratified shelf seas, J. Geophys. Res.Oceans, 119, 3868–3882, 2014. Risien, C. M. and Chelton, D. B.: A global climatology of surface wind and wind stress fields from eight years of QuikSCAT scatterometer data, J. Phys. Oceanogr., 38, 2379–2413, 2008. Saraceno, M., D’Onofrio, E., Fiore, M., and Grismeyer, W.: Tide model comparison over the Southwestern Atlantic Shelf, Cont. Shelf. Res., 30, 1865–1875, doi:10.1016/j.csr.2010.08.014, 2010. Sarmiento, J. and Gruber, N.: Ocean Biogeochemical Dynamics, Princeton University Press, Princeton, NJ, USA, 2006. Shchepetkin, A. and McWilliams, J.: The regional oceanic modeling system (ROMS): a split-explicit, free-surface, topographyfollowing-coordinate oceanic model, Ocean Model., 9, 347–404, 2005. Signorini, S. R., Mannino, A., Najjar, R. G., Friedrichs, M. A. M., Cai, W.-J., Salisbury, J., Wang, Z. A., Thomas, H., and Shadwick, E.: Surface ocean pCO2 seasonality and sea–air CO2 flux estimates for the North American east coast, J. Geophys. Res.Oceans, 118, 5439–5460, doi:10.1002/jgrc.20369, 2013. Stow, C. A., Jolliff, J., McGillicuddy, D. J., Doney, S. C., Allen, J. I., Friedrichs, M. A., Rose, K. A., and Wallhead, P.: Skill assessment for coupled biological/physical models of marine systems, J. Marine Syst., 76, 4–15, 2009. Takahashi, T., Sutherland, S. C., Sweeney, C., Poisson, A., Metzl, N., Tilbrook, B., Bates, N., Wanninkhof, R., Feely, R. A., Sabine, C., Olafsson, J., and Nojiri, Y.: Global sea–air CO2 flux based on climatological surface ocean pCO2 , and seasonal biological and temperature effects, Deep-Sea Res. Pt. II, 49, 1601– 1622, 2002. Takahashi, T., Sutherland, S. C., Wanninkhof, R., Sweeney, C., Feely, R. A., Chipman, D. W., Hales, B., Friederich, G., Chavez, F., Sabine, C., Watson, A., Bakker, D. C. E., Schuster, U., Metzl, N., Yoshikawa-Inoue, H., Ishii, M., Midorikawa, T., Nojiri, Y., Körtzinger, A., Steinhoff, T., Hoppema, M., Olafsson, J., Arnarson, T. S., Tilbrook, B., Johannessen, T., Olsen, A., Bellerby, R., Wong, C. S., Delille, B., Bates, N. R., and de Baar, H. J. W.: Climatological mean and decadal change in surface ocean pCO2 , and net sea–air CO2 flux over the global oceans, Deep-Sea Res. Pt. II, 56, 554–577, 2009. Tsunogai, S., Watanabe, S., and Sato, T.: Is there a “continental shelf pump” for the absorption of atmospheric CO2 ?, Tellus B, 51, 701–712, doi:10.1034/j.1600-0889.1999.t01-2-00010.x, 1999. Turi, G., Lachkar, Z., and Gruber, N.: Spatiotemporal variability and drivers of pCO2 and air–sea CO2 fluxes in the California Current System: an eddy-resolving modeling study, Biogeosciences, 11, 671–690, doi:10.5194/bg-11-671-2014, 2014. Walsh, J.: Importance of continental margins in the marine biogeochemical cycling of carbon and nitrogen, Nature, 350, 53–55, 1991. Wang, A. Z., Cai, W.-J., Wang, Y., and Ji, H.: The southeastern continental shelf of the United States as an atmospheric CO2 source and an exporter of inorganic carbon to the ocean, Cont. Shelf Res., 25, 1917–1941, doi:10.1016/j.csr.2005.04.004, 2005. Yool, A. and Fasham, M.: An examination of the “continental shelf pump” in an open ocean general circulation model, Global Biogeochem. Cy., 15, 831–844, doi:10.1029/2000GB001359, 2001.
Biogeosciences, 12, 5793–5809, 2015