Atmos. Meas. Tech., 5, 2003–2012, 2012 www.atmos-meas-tech.net/5/2003/2012/ doi:10.5194/amt-5-2003-2012 © Author(s) 2012. CC Attribution 3.0 License.
Atmospheric Measurement Techniques
Aircraft measurements of carbon dioxide and methane for the calibration of ground-based high-resolution Fourier Transform Spectrometers and a comparison to GOSAT data measured over Tsukuba and Moshiri T. Tanaka1,* , Y. Miyamoto1,** , I. Morino1 , T. Machida1 , T. Nagahama2 , Y. Sawa3 , H. Matsueda3 , D. Wunch4 , S. Kawakami5 , and O. Uchino1 1 National
Institute for Environmental Studies, 16-2 Onogawa, Tsukuba, Ibaraki, 305-8506, Japan Environment Laboratory, Nagoya University, Furo-cho, Chikusa-ku, Nagoya, 464-8601, Japan 3 Meteorological Research Institute, 1-1 Nagamine, Tsukuba, Ibaraki, 305-0052, Japan 4 California Institute of Technology, Pasadena, CA, 91125-2100, USA 5 Japan Aerospace Exploration Agency Earth Observation Research Center, 2-1-1 Sengen, Tsukuba, Ibaraki, 305-8505, Japan * now at: Japan Aerospace Exploration Agency Earth Observation Research Center, 2-1-1 Sengen, Tsukuba, Ibaraki, 305-8505, Japan ** now at: Graduate School of Natural Science and Technology, Okayama University, 3-1-1 Tsushima-naka kita-ku, Okayama, 700-8530, Japan 2 Solar-Terrestrial
Correspondence to: T. Tanaka (
[email protected]) Received: 28 December 2011 – Published in Atmos. Meas. Tech. Discuss.: 23 February 2012 Revised: 20 June 2012 – Accepted: 6 July 2012 – Published: 20 August 2012
Abstract. Aircraft measurements of carbon dioxide and methane over Tsukuba (36.05◦ N, 140.12◦ E) (February 2010) and Moshiri (44.36◦ N, 142.26◦ E) (August 2009) were made to calibrate ground-based high-resolution Fourier Transform Spectrometers (g-b FTSs) and to compare with the Greenhouse gases Observing SATellite (GOSAT). The aircraft measurements over Tsukuba in February 2010 were successful in synchronizing with both the g-b FTS and GOSAT for the first time. Airborne in situ and flask-sampling instruments were mounted on the aircraft, and measurements were carried out between altitudes of 0.5 and 7 km to obtain vertical profiles of carbon dioxide (CO2 ), methane (CH4 ), and other gaseous species. By comparing the g-b FTS measurements with the airborne measurements, the column-averaged dry air mole fractions of CO2 (XCO2 ) and CH4 (XCH4 ) retrieved from the g-b FTS measurements at Tsukuba were biased low by 0.33 ± 0.11 % for XCO2 and 0.69 ± 0.29 % for XCH4 . The g-b FTS values at Moshiri were biased low by 1.24 % for XCO2 and 2.11 % for XCH4 . The GOSAT data show biases that are 3.1 % ± 1.7 % lower for XCO2 and 2.5 % ± 0.8 %
lower for XCH4 than the aircraft measurements obtained over Tsukuba.
1
Introduction
Global warming by greenhouse gases is one of the most important environmental issues of our time. Atmospheric concentrations of carbon dioxide (CO2 ), methane (CH4 ), and nitrous oxide (N2 O) have been increasing since the beginning of the industrial era as a result of human activities. CO2 , in particular, is an important greenhouse gas, second only to water vapor, and the global-averaged concentration of atmospheric CO2 increased from 280 ppm in the pre-industrial era to 389.0 ppm in 2010 (World Meteorological Organization Greenhouse Gas Bulletin, 2011). Increases in these greenhouse gases enhance a radiative forcing of the atmosphere and affect global climate change. An accurate prediction of the CO2 concentration requires measurements for the quantification of the distribution and variability of CO2 sources and sinks. Ground stations and tall
Published by Copernicus Publications on behalf of the European Geosciences Union.
2004 towers with flask-sampling and/or in situ instruments using Non-Dispersive InfraRed (NDIR) analyzers and cavity ringdown spectroscopy (Inoue and Matsueda, 2001; Winderlich et al., 2010) currently measure atmospheric CO2 with high precision. In addition, ship- and aircraft-based measurements have been carried out, though less frequently. These measurements are precise but sparse, especially in Africa and South America. This sparseness causes large uncertainties in current estimates of the CO2 sources and sinks (Gurney et al., 2001). Rayner and O’Brien (2001) established the required precision of monthly averaged column data better than 2.5 ppm for the total of atmospheric CO2 data to be useful for reducing the uncertainties in regional (8◦ × 10◦ footprint) CO2 source and sink estimations. The feasibility of a global measurement of CO2 in the near-infrared region from space has been explored in the past (O’Brien and Rayner, 2002; Mao and Kawa, 2004). The authors determined that spacebased measurements are one of the most effective tools for CO2 source and sink estimations because of the wide spacial coverage they offer around the globe. The Greenhouse gases Observing SATellite (GOSAT) was developed jointly by the Japanese Ministry of the Environment (MOE), the National Institute for Environmental Studies (NIES), and the Japan Aerospace Exploration Agency (JAXA) to measure concentrations of CO2 and CH4 from space. After GOSAT was launched, it was placed in a sun-synchronous orbit at a 666-km altitude with a 3-day revisit time of around 12:50 LT (local time) (Yokota et al., 2009). The instruments onboard GOSAT are the Thermal And Near-infrared Sensor for carbon Observation Fourier Transform Spectrometer (TANSOFTS) and the TANSO Cloud and Aerosol Imager (TANSOCAI) (Kuze et al., 2009). TANSO-FTS measures the solar radiation reflected from the ground at three Short Wavelength InfraRed (SWIR) bands (0.76, 1.6, and 2.0 µm) and the emission from the ground and atmosphere at the wide Thermal InfraRed (TIR) band (5.5–14.3 µm) with a resolution of 0.2 cm−1 . Space-based instruments have to be validated using other measurements, such as in situ or sampling measurements by aircraft and remote sensing measurements by ground-based high-resolution Fourier Transform Spectrometers ((g-b) FTS). Measuring direct sunlight with a g-b FTS is one of the most precise remote sensing techniques to derive the total column of atmospheric CO2 under clear sky conditions (Washenfelder et al., 2003; Ohyama et al., 2009; Messerschmidt et al., 2010, 2011). The g-b FTS at Tsukuba is part of the Total Carbon Column Observing Network (TCCON) (Wunch et al., 2011) and is used to validate XCO2 and XCH4 retrieved from the GOSAT observation. The total column from space is directly validated by the total column measurement from the ground (i.e., the TCCON FTS instruments). For this reason the g-b FTS at Tsukuba must be calibrated against an instrument with high precision and accuracy obtained independently. For this work, we carried out aircraft Atmos. Meas. Tech., 5, 2003–2012, 2012
T. Tanaka et al.: FTS
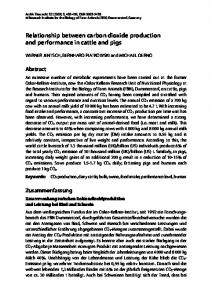
Fig. 1. Schematic diagram of the hand-operated air sampling equipment (HSE). The whole Fig. diagram ofmaterials the hand-operated air-sampling equipsystem1. is inSchematic a suitcase equipped with cushioning to reduce shocks by airframe vibrations. ment (HSE). The whole system is in a suitcase equipped with cushioning materials to reduce shocks by airframe vibrations.
21
measurements over Tsukuba and Moshiri. The purpose of these aircraft measurements was to calibrate the g-b FTS over Tsukuba and Moshiri and validate the GOSAT data. We installed hand-operated air-sampling equipment (HSE) and continuous CO2 measuring equipment (CME) on the aircraft in order to measure vertical profiles of CO2 and CH4 . The column-averaged dry air mole fractions of CO2 (XCO2 ) and CH4 (XCH4 ) were calculated from the aircraft measurements to compare with those derived from the g-b FTSs and GOSAT. We describe the measurement instruments onboard the aircraft in Sect. 2. The details of the aircraft measurements and the ground sites are described in Sect. 3. The calculation of XCO2 and XCH4 from the aircraft profiles is presented in Sect. 4, and the results of the g-b FTS and GOSAT comparison with the aircraft measurements are discussed in Sect. 5. 2 2.1
Aircraft and instruments Aircraft
The Beechcraft King Air 200T, operated by Diamond Air Service Inc., is a twin-turboprop aircraft with a pressurized cabin. We installed the CME for continuous CO2 measurement and the HSE for CO2 , CH4 , and other gases. Typical durations were 1.7–2.3 h while spiral descent flights between 7 km and 0.5 km were carried out. The position (latitude, longitude, and ellipsoid height) of the aircraft was monitored by GPS, and information on the outside temperature, static pressure, and ground speed was provided by the aircraft’s instruments. 2.2
Hand-operated air-sampling equipment (HSE)
The HSE is composed of Pyrex glass flasks and solenoid valves in a suitcase equipped with cushioning materials to reduce shocks by airplane vibrations. Figure 1 shows a schematic diagram of the HSE instrument. Eight 750-ml glass flasks are enclosed in the case. The solenoid valves www.atmos-meas-tech.net/5/2003/2012/
T. Tanaka et al.: FTS
2005
Fig. 2. Schematic diagram ofSchematic the continuous equipment (CME). The flow rate is controlled by a mass flow controller (MFC), 2 measuring Fig. 2. diagram CO of the continuous CO 2 measuring equipment (CME). The flow rate is controlled by a mass flow controller (MFC), and the absolute pressure ofby thean Non-Dispersive and the absolute pressure of the Non-Dispersive InfraRed (NDIR) cell is regulated automatic pressure controller (APC). InfraRed (NDIR) cell is regulated by an auto pressure controller (APC).
(SMC, SYJ314M-6LZ) were attached to both ends of the flask and actuated by high-pressure N2 gas from a gas cylinder. An air inlet port was placed in a front-facing position 22 at the top fuselage of the aircraft, and a stainless steel tube, used to flow air to the instruments, was placed in the aircraft. A diaphragm pump (Gast Manufacturing, Inc., MAA-P108HB) was connected to the stainless steel tube to pressurize sample air into the flask. The procedure of sampling air in the atmosphere was done as follows: Opening and closing actions for in/out solenoid valves at both ends of the flask were made by a valve controller. Sampling was started when the aircraft reached the desired altitude. First, both solenoid valves were left open to exchange the air inside the flask for 60 s. Then the solenoid valve (out) was closed to pressurize to 0.2 MPa in the flask for 45 s. Finally, the solenoid valve (in) was closed. After the flight, the HSE was unloaded from the aircraft and transported to NIES for high-precision analysis of the volume mixing ratios (VMRs) of CO2 , CH4 , CO, H2 , N2 O, and SF6 . The CO2 concentration was analyzed with a NDIR analyzer (LI-COR, either LI-6252 or LI-6262), and a gas chromatograph equipped with a flame ionization detector (GC-FID; Agilent Technologies, HP-5890) was used to analyze CH4 . The same gas chromatograph with a reduction gas detector (Trace Analytical, RGD-2) was used to analyze CO and H2 . A gas chromatograph with an electron capture detector (GC-ECD; Agilent Technologies, HP-6890) was used for N2 O and SF6 (Machida et al., 2008). The data from the NDIR and gas chromatographs were collected on the same PC. Analytical precisions are better than 0.03 ppm for CO2 , 1.7 ppb for CH4 , 0.3 ppb for CO, 3.1 ppb for H2 , 0.3 ppb for N2 O, and 0.3 ppt for SF6 . We prepared two sets of the HSE, so 16 samples were obtained in one flight. 2.3
Continuous CO2 measurement equipment (CME)
The CME instrument measures CO2 concentration continuously with a NDIR analyzer (LI-COR, LI-840) during the flight. Figure 2 shows a schematic diagram of the CME installed in the aircraft. The air inlet was placed together with www.atmos-meas-tech.net/5/2003/2012/
that of the HSE. The air was drawn through the stainless steel tube and pressurized by a diaphragm pump (Gast Manufacturing, Inc., MAA-P108-HB). Sintered filters were inserted to remove fine particles. Prior to the analysis by the NDIR analyzer, the sampled air was dehumidified using a Naflon dryer and a chemical dryer (magnesium perchlorate). The flow rate is kept at 150 standard cc per minute (sccm) by a mass flow controller (HORIBA STEC, Co. Ltd., SEC-E40). The absolute pressure of the NDIR cell was kept constant (110 hPa) by an automatic pressure controller (UR-7340ROB) in the back of the NDIR cell. The inflow of the sampled air to the NDIR cell was switched to two standard gases of 380.89 ppm and 402.44 ppm for 150 s per 60 min. A programmable controller/data logger device (Campbell Scientific, CR1000) controlled the solenoid valves (Koganei, GA010E1) for switching the introduced gas and monitored measurement parameters, such as flow rate, cell pressure, and so on. Measured CO2 concentrations by the NDIR analyzer were stored every 2 s in this device and were monitored by a notebook PC through an RS-232C connection. The standard gases were calibrated, before the aircraft measurement, against the CO2 calibration scale at NIES by the gravitational method (NIES95 scale). The NIES95 scale was compared with the World Meteorological Organization Global Atmosphere Watch (WMO GAW) CO2 standard scale at the National Oceanic and Atmospheric Administration’s Climate Monitoring and Diagnostic Laboratory (NOAA CMDL) in 1996 (Peterson et al., 1999). The differences in CO2 and CH4 between these scales (NIES–WMO) are 0.10 to 0.14 ppm in a range between 355 and 385 ppm and +4 to +5 ppb in a range between 1750 and 1838 ppb, respectively (Zhou et al., 2009). Switching to two standard gases by regular intervals (150 s per 60 min), analytical precision of the CME for the CO2 concentration is within ± 0.2 ppm including offset, linearity and drift for 10 s on average during the aircraft measurements.
Atmos. Meas. Tech., 5, 2003–2012, 2012
2006
T. Tanaka et al.: FTS Tokachi-Obihiro Airport
45 N
8000
Moshiri
7000 6000 Alt (m)
Latitude (deg.)
Taiki 40 N
Kumagaya
5000 4000 3000
Tsukuba
Nagoya Airport
2000
Nagoya Airport
36.4 36.2 36 35.8 35.6 0136.5 35.4 137 137.5 35.2 Latitude (deg.) 138 138.5 35 139 139.5 34.8 140 140.534.6 Longitude (deg.)
Kumagaya Tsukuba
1000
Narita Airport
35 N
135 E
140 E
Longitude (deg.)
145 E
Fig. 4. A flight pattern over Tsukuba performed on 14 February 2010.
Fig. 4. A flight pattern over Tsukuba performed on 14 February 2010.
23 the present aircraft measurements Fig. 3. Observation sites for (Tsukuba, Kumagaya, Moshiri, and Taiki).
Fig. 3. Observation sites for the present aircraft measurements (Tsukuba, Kumagaya, Moshiri, and Taiki).
3
Aircraft measurement and ground sites
The calibration with aircraft vertical profiles is necessary for the g-b FTS measurement to maintain high precision and accuracy. The aircraft measurements were carried out over Tsukuba (36.05◦ N, 140.12◦ E) and Moshiri (44.36◦ N, 142.26◦ E) at around 12:50 LT, which corresponds to GOSAT’s overpass time. The g-b FTSs (Bruker IFS 120 HR) were operated at both sites. Direct sunlight is introduced into the g-b FTS by a sun tracker and gold-coated mirrors. The g-b FTS measures direct solar spectra in the near-infrared region, and column-averaged abundances of atmospheric constituents are retrieved from the spectra. Measurements with the highresolution g-b FTS are performed according to the TCCON data protocol. A CaF2 beam splitter and an InGaAs detector are used for the 5500–10 500 cm−1 spectral region. A spectral resolution of 0.02 cm−1 , aperture size of 0.5 mm, and scanner velocity of 10 kHz (20 kHz in Moshiri) are used as standard parameters for the TCCON measurements. The pressure in the g-b FTS is kept at 3.9 × 10⁻² hPa by an oil-free scroll vacuum pump. The forward- and backwardscanned interferograms are separately integrated over a period of about 70 s. Vertical profiles of the meteorological parameters (pressure, temperature, relative humidity, wind speed, and wind direction) were measured with radio sondes around the aircraft measurements by the Japan Weather Association under contract with the NIES. Figure 3 shows the location of both observation sites. Tsukuba is 50 km northeast of Tokyo in the Kanto Plain and includes forests, agricultural lands, and urban areas. Tsukuba is one of the most important sites for validation of GOSAT data, because in addition to the g-b FTS, several instruments are in operation, such as meteorological Atmos. Meas. Tech., 5, 2003–2012, 2012
24
instruments, surface in situ measurements for CO2 and CH4 , lidar, and a sky radiometer. CO2 and CH4 concentrations at 1.5, 25, 100, and 200 m altitudes from the ground were continuously observed at the meteorological tower of the Meteorological Research Institute (MRI), Tsukuba, Japan (Inoue and Matsueda, 2001). The Moshiri site is located in a mountainous forest region and can provide validation for GOSAT data recorded over topography different from that of Tsukuba. The flight routes over both sites are described below. For the flight over Tsukuba, the aircraft took off from Komaki Airport, Aichi, Japan. Air traffic control over Tsukuba is strict because of the controlled airspace for the Narita and Haneda international airports, so the flight over Tsukuba was restricted to altitudes below 2 km. Consequently, the altitudes from 7 km to 2 km were sampled over Kumagaya, about 70 km west of Tsukuba. Vertical profiles measured at Kumagaya were used in the calculation of the total column amounts of CO2 and CH4 at Tsukuba, assuming uniformity of atmospheric concentrations of these compounds in the free troposphere above the planetary boundary layer over Tsukuba and Kumagaya. The typical flight path performed on 14 February 2010 is shown in Fig. 4. It illustrates the spiral descent flights over Tsukuba and Kumagaya. In August 2009, we also carried out aircraft measurements over Moshiri and Taiki, Hokkaido. Both Moshiri and Taiki were observed on GOSAT’s path 5. Tokachi-Obihiro Airport was used as a base camp for the Hokkaido measurements. The aircraft measurements were carried out on 26 August 2009 over the Moshiri observatory in the Geospace Research Center of the Solar-Terrestrial Environment Laboratory of Nagoya University, which is located in northwestern Hokkaido. The Moshiri observatory, a GOSAT validation observational site, operates a g-b FTS and meteorological instruments. A descent spiral flight over Taiki was carried out on 30 August 2009 in accordance with a GOSAT measurement. www.atmos-meas-tech.net/5/2003/2012/
T. Tanaka et al.: FTS
2007
Table 1. XCO2 obtained from the aircraft and the g-b FTS on each observation day over Tsukuba (14, 20, and 23 February) and Moshiri (26 August 2009). The g-b FTS XCO2 is the average value during the flight. The differences between aircraft XCO2 and g-b FTS XCO2 are indicated in the fourth (ppm) and fifth (%) columns. The average difference and its one standard deviation at the Tsukuba site are indicated in the fifth row. Note that there is no average and one standard deviation of the difference at the Moshiri site.
date
aircraft∗ (ppm)
14 Feb 2010 20 Feb 2010 23 Feb 2010
390.70 391.37 391.63
26 Aug 2009
381.574
difference g-b FTS (ppm) 389.91 389.87 389.97 Avg. (1σ ) 376.851
obs. site g-b FTS–aircraft (ppm)
(g-b FTS–aircraft)/aircraft × 100 (%)
−0.80 −1.50 −1.66 −1.32 (0.46) −4.72
−0.20 −0.38 −0.42 −0.33 (0.11) −1.24
Tsukuba Moshiri
∗ The effect of an averaging kernel of the g-b FTS is taken into consideration.
Table 2. XCO2 obtained from the aircraft and GOSAT (V01.20) on each observation day over Tsukuba (14, 20, and 23 February). The differences between aircraft XCO2 and GOSAT SWIR XCO2 are indicated in the fourth (ppm) and fifth (%) columns. The average difference and its one standard deviation at the Tsukuba site are indicated in the fifth row. Note that there is no average and one standard deviation of the difference at the Moshiri site. difference date 14 Feb 2010 20 Feb 2010 23 Feb 2010
aircraft (ppm) 391.67 391.66 392.33
GOSAT (ppm) 372.42 386.41 379.41 Avg. (1σ )
obs. site g-b FTS–aircraft (ppm)
(g-b FTS–aircraft)/aircraft × 100 (%)
−19.25 −5.25 −12.91 −12.47 (7.01)
−4.92 −1.34 −3.29 −3.18 (1.78)
Despite the fact that there is no ground observation station at Taiki, located 200 km southeast of Moshiri, the flatness and homogeneity of its surface improved the GOSAT retrieval algorithm in the initial analysis phase. On 30 August 2009, GOSAT was not successful in retrieving XCO2 or XCH4 owing to clouds in its field of view. We conducted three flights over Tsukuba on 14, 20, and 23 February 2010, and one flight over Moshiri on 30 August 2009. We obtained four profiles to calculate XCO2 and XCH4 . 4
Calculation of XCO2 and XCH4 from the aircraft measurement
To compare the values retrieved from the g-b FTS with those calculated from the aircraft profiles, CO2 and CH4 measured by the aircraft were combined using a priori profiles in GFIT, as described by Wunch et al. (2010). The GFIT algorithm, developed at the Jet Propulsion Laboratory (JPL), is a spectral fitting code for retrieving the column-averaged abundances of atmospheric trace gases from infrared solar absorption spectra (Wunch et al., 2011). The CO2 a priori profile in GFIT for altitudes up to 10 km was taken from a climatology based on the GLOBALVIEW dataset (GLOBALVIEW-CO2, 2006), and it varies based on the time of year and the latitude of the site. The stratospheric www.atmos-meas-tech.net/5/2003/2012/
Tsukuba
CO2 profiles were generated from an age of air relationship derived by Andrews et al. (2001). The GFIT CH4 a priori profiles were generated from balloon-borne MkIV FTS data (Toon, 1991). The CH4 and HF volume mixing ratios are inversely correlated in the stratosphere (Luo et al., 1995; Washenfelder et al., 2003); therefore, this correlation can be applied to adjust the CH4 profile in the stratosphere. However, since the g-b FTS instruments at Tsukuba and Moshiri do not measure the wavelength window containing the HF absorption, the correction using the CH4 –HF relationship could not be performed in this study. Instead, we made use of the temperature profile measured by a radio sonde during the aircraft overpasses to determine the difference between the measured tropopause altitude and that calculated in GFIT from the NCEP reanalysis temperature profile, and we adjusted the CH4 stratospheric profile accordingly. Figures 5 and 6 show combined CO2 and CH4 profiles observed on 20 February 2010 over Tsukuba and Kumagaya. The red and blue dots are the aircraft data and the meteorological tower data at MRI, respectively. The gray lines show the combined ground, aircraft, and GFIT a priori profiles. The errors resulted from the estimated stratospheric profile along with the surface and aircraft measurements, and they were evaluated when the aircraft measurement was integrated using the GFIT a priori stratosphere. The estimated total error is the square root of the sum of squares of these
Atmos. Meas. Tech., 5, 2003–2012, 2012
2008
T. Tanaka et al.: FTS
Table 3. The same as Table 1, but for XCH4 .
date
difference
aircraft∗ (ppm)
14 Feb 2010 20 Feb 2010 23 Feb 2010
1.8023 1.8066 1.8045
26 Aug 2009
1.7943
FTS (ppm) 1.7961 1.7908 1.7887 Avg. diff. (1σ ) 1.7565
obs. site g-b FTS–aircraft (ppm)
(g-b FTS–aircraft)/aircraft × 100 (%)
−0.0062 −0.0158 −0.0158 −0.0126 (0.0055) −0.0378
−0.34 −0.88 −0.88 −0.69 (0.29) −2.11
Tsukuba Moshiri
∗ The effect of an averaging kernel of the g-b FTS is taken into consideration.
0
combined profile aircraft MRI
combined profile aircraft MRI
0
920
600
960
980
800
800
400
850
600 800
1000
1000 380 385 390 395 400 405 CO2 (ppm)
200
Pressure (hPa)
400
Pressure (hPa)
940
Pressure (hPa)
Pressure (hPa)
200
392
396
400
404
1000 1.0 1.2 1.4 1.6 1.8 2.0 CH4 (ppm)
CO2 (ppm)
Fig. 5. Combined CO profile observed on 20 February 2010 over Tsukuba and Kumagaya. Red and blue dots are the aircraft (in situ) data and the meteorological tower data of the Meteorological Re25 search Institute (MRI), respectively. The gray lines show the combined ground, aircraft, and GFIT a priori profiles.
2 on 20 February 2010, over Tsukuba and Kumagaya, Fig. 5. Combined CO2 profile observed respectively. Red and blue dots are the aircraft (in situ) data and the meteorological tower data of the Meteorological Research Institute (MRI), respectively. The gray lines show the combined ground, aircraft, and GFIT a priori profiles.
j
where XaCO2
is the column-averaged dry mole fraction for the a priori profile ta , hj is the pressure weighting function, and tin situ is the in situ profile from the aircraft measurement. The column-averaging kernels for the g-b FTSs at Tsukuba and Moshiri are shown in Fig. 7. Column-averaging kernels vary as a function of pressure and solar zenith angle. The XCH4 is derived in the same way using Eq. (1). The column-averaging kernel a for the g-b FTS is used in Tables 1 and 3. Another column-averaging kernel a for GOSAT is used in Tables 2 and 4. Atmos. Meas. Tech., 5, 2003–2012, 2012
950 1000 1.84 1.88 1.92 CH4 (ppm)
Fig. 6. The same as Fig. 5, but for CH . The aircraft data shown are from the flask-sampling air.
4 shown are from the flask sampling Fig. 6. The same as Fig. 5, but for CH4 . The aircraft data air.
26
5 components. We estimated a total error of 0.5 ppm for CO2 and 9 ppb for CH4 in the same manner as in the TCCON calibration. For comparisons of XCO2 and XCH4 from aircraft profiles with those retrieved from the g-b FTS, averaging kernels of the g-b FTS measurements must be taken into account. The XCO2 for the aircraft in situ profile weighted by the columnaveraging kernel a (Rodgers and Connor, 2003) is calculated as follows: X a situ hj aj (tin situ − ta )j Xin (1) CO2 = XCO2 +
900
5.1
Results and discussion Comparison of the g-b FTSs and GOSAT with the aircraft measurement
The XCO2 and XCH4 values retrieved from the g-b FTS measurements at Tsukuba (February 2010) and Moshiri (August 2009) were compared with those calculated from the aircraft measurements. The g-b FTS data were corrected for an airmass-dependent artifact for XCO2 and were calibrated with the TCCON common scaling factors empirically determined using aircraft profiles over many TCCON sites to place the TCCON data on the WMO standard reference scales (Wunch et al., 2010) for XCO2 and XCH4 . The GOSAT data (V01.20) were successfully retrieved over Tsukuba on 14, 20, and 23 February 2010, when the aircraft measurements were carried out. There are two types of GOSAT data: those for Research Announcement investigators (RA) and for general public users (GU). GU data are selected from RA data based on several criteria. The degrees of freedom for signals must be larger than unity, the mean squares of the residual spectra must be less than 3 or the chi-square for the retrieval state must be less than 5, and aerosol optical thickness (AOT) at 1600 nm must be less than 0.5 (Yoshida et al., 2011). The www.atmos-meas-tech.net/5/2003/2012/
T. Tanaka et al.: FTS
2009
Table 4. The same as Table 2, but for XCH4 . difference
aircraft∗ (ppm)
date 14 Feb 2010 20 Feb 2010 23 Feb 2010
GOSAT (ppm)
1.8122 1.8110 1.8150
obs. site
1.7504 1.7796 1.7671 Avg. diff. (1σ )
g-b FTS–aircraft (ppm)
(g-b FTS–aircraft)/aircraft × 100 (%)
−0.0618 −0.0313 −0.0479 −0.0470 (0.0152)
−3.41 −1.73 −2.64 −2.59 (0.84)
Tsukuba
∗ The effect of an averaging kernel of the GOSAT is taken into consideration.
2009/8/26 2010/2/14 2010/2/20 2010/2/23
2/14/2010
0
400
CH4
XCO2 (ppm)
CO2
Pressure (hPa)
200
400
Aircraft FTS FTS (average during aircraft meas.) GOSAT (V01.20)
395 390 385 380 375 370
9:00 10:00 2010/02/14
600
11:00
12:00
13:00
14:00
15:00
16:00
11:00
12:00
13:00
14:00
15:00
16:00
2/20/2010 400
1000 0.0
0.4
0.8
1.2
0.0
0.4
0.8
1.2
column averaging kernel
XCO2 (ppm)
800
Fig. Fig. 7. 7.Column-averaging forandg-b Column averaging kernels for g-bkernels FTS at Tsukuba MoshiriFTS at Tsukuba and Moshiri.
395 390 385 380 375
9:00 10:00 2010/02/20
2/23/2010
5.2
XCO2
Figure 8 shows the time series of the g-b FTS XCO2 over Tsukuba along with the aircraft and GOSAT XCO2 . Retrieved g-b FTS data were filtered using the fractional variation in solar intensity (FVSI) during a measurement measured by a pyranometer. The average values of the g-b FTS during the flight over Tsukuba are indicated at the intermediate times www.atmos-meas-tech.net/5/2003/2012/
400
XCO2 (ppm)
GOSAT data on 14 February 2010 are released only for RA. The time series of the g-b FTS XCO2 and XCH4 at Tsukuba are shown in Figs. 8 and 9 with the aircraft and the GOSAT data. Figure 10 shows the time series of the g-b FTS XCO2 and XCH4 at Moshiri. The differences of XCO2 and XCH4 values from the g-b FTS and GOSAT to those calculated from the aircraft measurements are summarized in Tables 1 to 4. The XCO2 and XCH4 values from the aircraft measurements were calculated taking the averaging kernels of the g-b FTS and GOSAT into account. Detailed results on XCO2 and XCH4 are described in the next subsections.
395 390 385 380 375
9:00 10:00 2010/02/23
11:00
12:00
13:00
14:00
15:00
16:00
JST Fig. 8. The time series of the g-b FTS XCO2 are shown together with aircraft and GOSAT SWIR (V01.20) data on and each Fig. 8. the The time series of the the g-b FTS XCO are shown together with the aircraft the obGOSAT SWIR (V01.20) data on each observation day.14 TheFebruary GOSAT data on 14 February 2010 servation day. The GOSAT data on 2010 are released is released only for RA. The average values of the g-b FTS during the flight over Tsukuba are indicated at the intermediate flight times.values GOSAT Xof are biased low by during 8.85 ppm reported only for RA. The average g-b FTS the flight CO the by Morino et al. (2011). over Tsukuba are indicated at the intermediate flight times. GOSAT XCO2 are biased low by 8.85 ppm, reported by Morino et al. (2011). 2
2
Atmos. Meas. Tech., 5, 2003–2012, 2012
2010
T. Tanaka et al.: FTS
2/14/2010
Aircraft FTS FTS(average during aircraft meas.) GOSAT (V01.20)
8/26/2009 390
1.82
XCO2 (ppm)
XCH4 (ppm)
1.84
1.80 1.78 1.76 1.74 1.72 9:00 2010/02/14
12:00
380 375
10:00 2009/08/26 1.84
15:00
2/20/2010 1.84
12:00
14:00
16:00
14:00
16:00
1.82
XCH4 (ppm)
XCH4 (ppm)
385
370
1.70
1.82 1.80 1.78 1.76 1.74
1.80 1.78 1.76 1.74 1.72 1.70
1.72 1.70 9:00 2010/02/20
12:00
15:00
2/23/2010
1.68 10:00 2009/08/26
12:00
JST
Fig. 10. The time series of the g-b FTS XCO2 and XCH4 at Moshiri are shown together with the aircraft data on 26 August 2009.
1.84
XCH4 (ppm)
Aircraft FTS FTS (average during aircraft meas.)
Fig. 10. The time series of the g-b FTS XCO2 and XCH4 at Moshiri are shown together with the aircraft on 26 August, 2009.
1.82 1.80 1.78 1.76 1.74 1.72 1.70 9:00 2010/02/23
12:00
15:00
JST Fig. 9. The same as Fig. 8, but for XCH4 . GOSAT XCH4 are biased low by 20.4 ppb, reported by Morino et al. (2011).
of the flights as shown in Fig. 8. On 20 and 23 February, weather conditions were optimal for direct solar measurement. In contrast, on 14 February, they were not optimal because the sky was partially cloudy. Table 1 summarizes the values of XCO2 from the aircraft and the g-b FTS and the differences of XCO2 between the aircraft and the g-b FTS for Tsukuba and Moshiri. The g-b FTS XCO2 values at Tsukuba are slightly biased low compared to the aircraft XCO2 values, as listed in Table 1. The average difference between the g-b FTS XCO2 and the aircraft XCO2 with one standard deviation for the Tsukuba site is 1.32 ± 0.46 ppm, which corresponds to 0.33 ± 0.11 %. This small bias between the Tsukuba (g-b) FTS and the aircraft XCO2 remains even after the standard TCCON calibration described in detail in Wunch et al. (2010) and might be due to the effect of ghosts, artificial spectra that Atmos. Meas. Tech., 5, 2003–2012, 2012
are mirror images of the original spectra, caused by He-Ne laser mis-sampling (Messerschmidt et al., 2010) or of improperly fitting the instrument line shape. Though the GOSAT SWIR XCO2 values are relatively low compared with those of the aircraft, as listed in Table 2, this is consistent with the result using GU data reported by Morino et al. (2011) that the GOSAT SWIR XCO2 is biased low by 8.85 ± 4.75 ppm. The differences at Tsukuba in February 2010 are within the value reported by Morino et al. (2011) except for the value on 14 February, which is released only for RA. On 14 February, thin cirrus clouds were measured at around 11km using lidar, indicating that the XCO2 and XCH4 data retrieved by GOSAT SWIR were contaminated by the clouds (Uchino et al., 2012). These cirrus clouds give rise to a difference between the actual optical path and the assumed optical path, which affected the GOSAT SWIR retrieval. At Moshiri, the g-b FTS had a significant low bias and large variance during flight compared with the result obtained over Tsukuba, as shown in Fig. 10. It is likely that there were clouds in the field of view of the g-b FTS during measurement at Moshiri, but it was difficult to screen retrieved XCO2 values by the FVSI because the temporal resolution of the pyranometer recording is 1min and the scan time for the g-b FTS is less than 1min. The faster scan speed (20 kHz) of the g-b FTS at Moshiri compared to the TCCON norm decreased the signal-to-noise ratio of the www.atmos-meas-tech.net/5/2003/2012/
T. Tanaka et al.: FTS measured spectra. Currently, the pyranometer measures every 2 s, matching the pyranometer measurement frequency at Tsukuba, and screening by FVSI is possible, so we anticipate a reduction in the uncertainties of XCO2 and XCH4 in the future. 5.3
XCH4
The time series of the g-b FTS XCH4 over Tsukuba are shown in Fig. 9 along with the aircraft and GOSAT values. Table 3 shows the values of XCH4 measured by the aircraft and g-b FTS, and the differences of the g-b FTS data to the aircraft data for Tsukuba and Moshiri. The average difference of the g-b FTS XCH4 data to the aircraft XCH4 data is 12.6 ± 5.5 ppb, which corresponds to 0.69 ± 0.29 %, for Tsukuba. For XCH4 , the uncertainty was larger than that of TCCON calibration. This is partly because the compensation by the CH4 –HF correlation was not carried out as mentioned in Sect. 4. In the TCCON calibration, the average and maximum adjustments by the CH4 –HF correlation are 0.4 km and 1.8 km in altitude, respectively (Wunch et al., 2010). As a result of the adjustment of CH4 concentration, the average adjustment of 0.4 km produces a difference within 3 ppb (0.2 %) in the amount of column in our case. Differences from −16 ppb to 13 ppb (from −0.9 % to 0.7 %) appeared in the maximum adjustment of 1.8 km and can partly explain the discrepancy with the TCCON calibration. In this observation, the tropopause height can be determined from meteorological parameters measured by radio sondes. Comparing the differences of the true tropopause heights with those assumed in the GFIT algorithm for 14, 20, 23 February, and 26 August are −100 m, 200 m, −500 m, and 200 m, which corresponds to −0.8, 1.9, −4.4, and 1.8 ppb, respectively. Comparing the aircraft XCH4 with GOSAT XCH4 over Tsukuba, as listed in Table 4, the GOSAT data had slightly larger differences compared with the results reported by Morino et al. (2011). The relatively large low bias due to the influence of the cirrus clouds was also seen in XCO2 on 14 February 2010. At Moshiri, the difference between the aircraft and the g-b FTS XCH4 was large compared with the result obtained at Tsukuba because of the same reasons explained for XCO2 .
6
Conclusions
Aircraft measurements were conducted over Tsukuba and Moshiri for the calibration of the g-b FTSs and the validation of GOSAT. In the February 2010 flights over Tsukuba, we succeeded in performing simultaneous observations of the (g-b) FTS, the aircraft in situ and flask-sampling instruments, and GOSAT. Retrieved XCO2 and XCH4 values from the g-b FTS measurements show good agreement with the aircraft measurements over Tsukuba. Contrarily, the negative biases in XCO2 and XCH4 measured by the g-b FTS were relatively large www.atmos-meas-tech.net/5/2003/2012/
2011 over Moshiri compared with those over Tsukuba. This was probably due to the lack of screening by the FVSI and the higher scan speed of the g-b FTS. The GOSAT data underestimate both XCO2 and XCH4 compared to the aircraft measurements. The average differences of GOSAT SWIR XCO2 and XCH4 compared to the aircraft XCO2 and XCH4 were 9.08 ± 5.41 ppm (2.31 ± 1.37 %) for XCO2 and 39 ± 11 ppb (2.18 ± 0.64 %) for XCH4 excluding the cloudy GOSAT data of 14 February 2010. These average differences are consistent with the preliminary results of GOSAT validation efforts (Morino et al., 2011). The comparisons of the g-b FTS and GOSAT with the aircraft measurement show that the effects of contributing factors such as aerosols and thin cirrus clouds on the retrieval from GOSAT are not negligible. Further validation experiments using instruments with a combination of g-b FTS, aircraft, observation tower, lidar, and sky radiometer are necessary to improve the retrieval algorithm for GOSAT and decrease uncertainties of the GOSAT SWIR XCO2 and XCH4 data.
Acknowledgements. We are deeply grateful to the NIES GOSAT project members for their useful comments. This work was financially supported by the Ministry of the Environment, which made completing this study possible. Edited by: D. Feist
References Andrews, A. E., Boering, K. A., Daube, B. C., Wofsy, S. C., Jost, M. L. H., Podolske, J. R., Webster, C. R., Herman, R. L., Scott, D. C., Flesch, G. J., Moyer, E. J., Elkins, J. W., Dutton, G. S., Hurst, D. F., Moore, F. L., Ray, E. A., Romashkin, P. A., and Strahan, S. E.: Mean ages of stratospheric air derived from in situ observations of CO2 , CH4 , and N2 O, J. Geophys. Res., 106, 32295–32314, 2001. GLOBALVIEW-CO2: Cooperative Atmospheric Data Integration Project – Carbon Dioxide. CD-ROM, NOAA ESRL, Boulder, Colorado, also available on Internet via anonymous FTP to ftp.cmdl.noaa.gov, last access: August 2011, Path: ccg/co2/GLOBALVIEW, 2006. Gurney, K. R., Law, R. M., Denning, A. S., Rayner, P. J., Baker, D., Bousquet, P., Bruhwiler, L., Chen, Y.-H., Ciais, P., Fan, S., Fung, I. Y., Gloor, M., Heimann, M., Higuchi, K., John, J., Maki, T., Maksyutov, S., Masarie, K., Peylin, P., Prather, M., Pak, B. C., Randerson, J., Sarmiento, J., Taguchi, S., Takahashi, T., and Yuen, C.-W.: Towards robust regional estimates of CO2 sources and sinks using atmospheric transport models, Nature, 415, 626– 630, doi:10.1038/415626a, 2001. Inoue, H. Y. and Matsueda, H.: Measurements of atmospheric CO2 from a meteorological tower in Tsukuba, Japan, Tellus B, 53, 205–219, 2001. Kuze, A., Suto, H., Nakajima, M., and Hamazaki, T.: Thermal and near infrared sensor for carbon observation Fourier-transform spectrometer on the Greenhouse Gases Observing Satellite for
Atmos. Meas. Tech., 5, 2003–2012, 2012
2012 greenhouse gases monitoring, Appl. Optics, 48, 6716–6733, 2009. Luo, M., Cicerone, R. J., and Russell III, J. M..: Analysis of Halogen Occultation Experiment HF versus CH4 correlation plots: Chemistry and transport implications, J. Geophys. Res., 100, 13927– 13937, 1995. Machida, T., Matsueda, H., Sawa, Y., Nakagawa, Y., Hirotani, K., Kondo, N., Goto, K., Nakazawa, T., Ishikawa, K., and Ogawa, T.: Worldwide Measurements of Atmospheric CO2 and Other Trace Gas Species Using Commercial Airlines, J. Atmos. Ocean. Tech., 25, 1744–1754, doi:10.1175/2008JTECHA1082.1, 2008. Mao, J. and Kawa, S. R.: Sensitivity studies for spacebased measurement of atmospheric total column carbon dioxide by reflected sunlight, App. Optics, 5, 914–927, doi:10.1029/2001JD000617, 2004. Messerschmidt, J., Macatangay, R., Notholt, J., Petri, C., Warneke, T., and Weinzierl, C.: Side by side measurements of CO2 by ground-based Fourier transform spectrometry (FTS), Tellus B, 62, 749–758, doi:10.1111/j.1600-0889.2010.00491.x, 2010. Messerschmidt, J., Geibel, M. C., Blumenstock, T., Chen, H., Deutscher, N. M., Engel, A., Feist, D. G., Gerbig, C., Gisi, M., Hase, F., Katrynski, K., Kolle, O., Lavric, J. V., Notholt, J., Palm, M., Ramonet, M., Rettinger, M., Schmidt, M., Sussmann, R., Toon, G. C., Truong, F., Warneke, T., Wennberg, P. O., Wunch, D., and Xueref-Remy, I.: Calibration of TCCON column-averaged CO2 : the first aircraft campaign over European TCCON sites, Atmos. Chem. Phys., 11, 10765–10777, doi:10.5194/acp-11-10765-2011, 2011. Morino, I., Uchino, O., Inoue, M., Yoshida, Y., Yokota, T., Wennberg, P. O., Toon, G. C., Wunch, D., Roehl, C. M., Notholt, J., Warneke, T., Messerschmidt, J., Griffith, D. W. T., Deutscher, N. M., Sherlock, V., Connor, B., Robinson, J., Sussmann, R., and Rettinger, M.: Preliminary validation of column-averaged volume mixing ratios of carbon dioxide and methane retrieved from GOSAT short-wavelength infrared spectra, Atmos. Meas. Tech., 4, 1061–1076, doi:10.5194/amt-4-1061-2011, 2011. O’Brien, D. M. and Rayner, P. J.: Global observations of the carbon budget 2. CO2 column from differential absorption of reflected sunlight in the 1.61 µm band of CO2 , J. Geophys. Res., 5, 4354, doi:10.1029/2001JD000617, 2002. Ohyama, H., Morino, I., Nagahama, T., Machida, T., Suto, H., Oguma, H., Sawa, Y., Matsueda, H., Sugimoto, N., Nakane, H., and Nakagawa, K.: Column-averaged volume mixing ratio of CO2 measured with ground-based Fourier transform spectrometer at Tsukuba, J. Geophys. Res., 114, D18303, doi:10.1029/2008JD011465, 2009. Peterson, J., Tans, P., and Kitzis, D.: CO2 Round-robin Reference Gas Intercomparison, in: Report of the Ninth WMO Meeting of Experts on Carbon Dioxide Concentration and Related Tracer Measurement Techniques, edited by: Francey, R., World Meteorological Organization, Geneva, Swizerland, 1999. Rayner, P. J. and O’Brien, D. M.: The utility of remotely sensed CO2 concentration data in surface source inversions, Geophys. Res. Lett., 28, 175–178, 2001.
Atmos. Meas. Tech., 5, 2003–2012, 2012
T. Tanaka et al.: FTS Rodgers, C. D. and Connor, B. J.: Intercomparison of remote sounding instruments, J. Geophys. Res., 108, 4116, doi:10.1029/2002JD002299, 2003. Toon, G.: The JPL MkIV interferometer, Opt. Photon. News, 2, 19– 21, 1991. Uchino, O., Kikuchi, N., Sakai, T., Morino, I., Yoshida, Y., Nagai, T., Shimizu, A., Shibata, T., Yamazaki, A., Uchiyama, A., Kikuchi, N., Oshchepkov, S., Bril, A., and Yokota, T.: Influence of aerosols and thin cirrus clouds on the GOSAT-observed CO2 : a case study over Tsukuba, Atmos. Chem. Phys., 12, 3393–3404, doi:10.5194/acp-12-3393-2012, 2012. Washenfelder, R. A., Wennberg, P. O., and Toon, G. C.: Tropospheric methane retrieved from ground-based near-IR solar absorption spectra, Geophys. Res. Lett., 30, 2226, doi:10.1029/2003GL017969, 2003. Winderlich, J., Chen, H., Gerbig, C., Seifert, T., Kolle, O., Lavric, J. V., Kaiser, C., H¨ofer, A., and Heimann, M.: Continuous lowmaintenance CO2 /CH4 /H2 O measurements at the Zotino Tall Tower Observatory (ZOTTO) in Central Siberia, Atmos. Meas. Tech., 3, 1113–1128, doi:10.5194/amt-3-1113-2010, 2010. WMO2011: WMO Greenhouse Gas Bulletin, NO. 7, available at http://www.wmo.int/pages/prog/arep/gaw/ghg/GHGbulletin. html (last access: March 2012), 2011. Wunch, D., Toon, G. C., Wennberg, P. O., Wofsy, S. C., Stephens, B. B., Fischer, M. L., Uchino, O., Abshire, J. B., Bernath, P., Biraud, S. C., Blavier, J.-F. L., Boone, C., Bowman, K. P., Browell, E. V., Campos, T., Connor, B. J., Daube, B. C., Deutscher, N. M., Diao, M., Elkins, J. W., Gerbig, C., Gottlieb, E., Griffith, D. W. T., Hurst, D. F., Jim´enez, R., Keppel-Aleks, G., Kort, E. A., Macatangay, R., Machida, T., Matsueda, H., Moore, F., Morino, I., Park, S., Robinson, J., Roehl, C. M., Sawa, Y., Sherlock, V., Sweeney, C., Tanaka, T., and Zondlo, M. A.: Calibration of the Total Carbon Column Observing Network using aircraft profile data, Atmos. Meas. Tech., 3, 1351–1362, doi:10.5194/amt3-1351-2010, 2010. Wunch, D., Toon, G. C., Blavier, J.-F. L., Washenfelder, R. A., Notholt, J., Connor, B. J., Griffith, D. W. T., Sherlock, V., and Wennberg, P. O.: The Total Carbon Column Observing Network (TCCON), Philos. T. Roy. Soc. A, 369, 2087–2112, doi:10.1098/rsta.2010.0240, 2011. Yokota, T., Yoshida, Y., Eguchi, N., Ota, Y., Tanaka, T., Watanabe, H., and Maksyutov, S.: Global Concentrations of CO2 and CH4 Retrieved from GOSAT: First Preliminary Results, SOLA, 5, 160–163, doi:10.2151/sola.2009-041, 2009. Yoshida, Y., Ota, Y., Eguchi, N., Kikuchi, N., Nobuta, K., Tran, H., Morino, I., and Yokota, T.: Retrieval algorithm for CO2 and CH4 column abundances from short-wavelength infrared spectral observations by the Greenhouse gases observing satellite, Atmos. Meas. Tech., 4, 717–734, doi:10.5194/amt-4-717-2011, 2011. Zhou, L. X., Kitzis, D., and Tans, P. P.: Report of the fourth WMO Round-Robin reference gas intercomparison, 2002–2007, in: Report of the 14th WMO Meeting of Experts on Carbon Dioxide Concentration and Related Tracer Measurement Techniques, edited by: Laurila, T., Helsinki, Finland, 40–43, 2009.
www.atmos-meas-tech.net/5/2003/2012/