An approximate maximum likelihood method for phylogenetic tree analysis based on low-temperature Markov Chain Monte Carlo Ryota Suzuki1
Tomoya Taniguchi2
Hidetoshi Shimodaira1
[email protected]
[email protected]
[email protected]
1 2
Department of Mathematical and Computing Sciences, Tokyo Institute of Technology, Ookayama 2-12-1, Meguro-ku, Tokyo 152-8552, Japan Department of Information Science, Tokyo Institute of Technology, Ookayama 2-12-1, Meguro-ku, Tokyo 152-8552, Japan
Keywords: phylogenetic tree, maximum likelihood method, Markov Chain Monte Carlo, multiscale bootstrap resampling
1
Introduction
Maximum likelihood (ML) method has been widely used because it allows phylogenetic analysis based on probabilistic models of molecular evolution. However, despite its effectiveness and simplicity, ML method does not work properly in analyses of many species — it even fails with only 20-30 species. To overcome this problem, we propose an approximate version of ML method based on Markov Chain Monte Carlo (MCMC). This method has already been used in Shimodaira and Hasegawa (2004) [5]. An example of phylogenetic tree for 32 mammalian species computed by the proposed method will also be shown.
2
Problems
ML method requires computation of likelihood for all the candidate topologies. For s species, the (2s−5)! number of candidates is 2s−3 . Since computation of likelihood is time-consuming process, it is (s−3)! virtually impossible to compute for all the candidates when s is large. To avoid this problem, MCMC is often used as an alternative. It generates a set of topologies with frequencies being proportional to posterior probabilities. Theoretically, while we do not have to compute the likelihood values for all topologies, it provides posterior probability of each topology. But MCMC also fails in practice due to the misspecification of probability models and generates too small number of topologies.
3
Method
Our approach to this problem is as follows. First, we run a MCMC process with “low temperature”. Let T denote a topology and P (T ) its posterior probability. For r > 0, MCMC with temperature r r generates topologies to be proportional to the amount Pr (T ) ≈ PKP (T ) r , where K is the number k=1
P (Tk )
of all the possible topologies. For r 6= 1, the generated topologies are not proportional to posterior probabilities. Instead, we can obtain as large number of candidate topologies as r gets smaller. We run a MCMC process with r < 1 (low temperature), not to compute posterior probabilities but to obtain a list of candidate topologies. The topologies in the list are expected to include the “true” topology.
Then, we compute the likelihood values for all topologies in the list obtained by MCMC procedure. The topology with the highest likelihood value among the list is taken as the approximate maximum likelihood topology. Finally, we perform multiscale bootstrap analysis [3] to assess the uncertainty of the results in terms of hypothesis testings. There are two reasons to lower the temperature of MCMC: (1) From the viewpoint of ML method, posterior probability is only approximately proportional to likelihood. (2) Wide range of candidate topologies is needed for (multiscale) bootstrap analysis. However, regarding the latter it is still not clear how wide range is enough to approximate the p-values of edges computed by (multiscale) bootstrap resampling.
4
Example
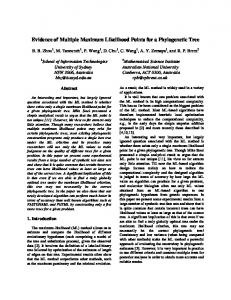
As an example, we estimated an approximate ML tree for 32 mammalian species from a part of the mitochondrial protein sequences of Nikaido et al. (2003) [2]. The procedure is as follows: 74 85 100
1. Obtain a list of topologies by MCMCMC using a software MrBayes [1], an implementation of MCMC for phylogenetic analysis.
71 92 100
3. Carry out hypothesis testings by multiscale bootstrap analysis, by a software CONSEL [6]. The estimated approximate ML tree is shown in figure 1 (Shimodaira and Hasegawa 2004 [5]). Three numbers near branches are the approximately unbiased p-value, bootstrap probability, and posterior probability respectively from the top to the bottom, in percentage. The software implementing this method will be available at our website [8]. This work is supported in part by Grant-in-Aid for Young Scientists (A) KAKENHI-14702061 from MEXT of Japan.
References
64 61 100 62 32 39
69 72 100 77 92 100
guinea pig mouse red squirrel rabbit harbor seal
61 100 78 100 100 100
dog cat horse
100 100 100
white rhinoceros hippopotamus
99 100 100 100 100 95 100 99 100
blue whale cow pig Ryukyu flying fox greater moonrat
74 79 100
52 48 36
capuchin
68 60 95
72 81 100
98 100 100
baboon
slow loris
69 59 75 100 56 93
2. Compute the log-likelihood values of topologies by a software PAML [7].
human
100 100 100
100 100 100
Japanese mole elephant shrew
82 89 59 100 52 78 48 92 100
golden mole aardvark tenrec dugong
77 86 93 100 100 100
elephant hyrax armadillo
100 100 100 0.1
wallaroo
100 100 100
opossum 100 100 100
echidna platypus
Figure 1: The estimated topology of 32 species.
[1] Huelsenbeck, J. P. and Ronquist, F., MRBAYES: Bayesian inference of phylogenetic trees, Bioinformatics, 17:754–755, 2001. [2] Nikaido, M. et al., Mitochondrial phylogeny of hedgehogs and monophyly of Eulipotyphla, Molecular Phylogenetics and Evolution, 28(2):276–284, 2003. [3] Shimodaira, H., An approximately unbiased test of phylogenetic tree selection, Systematic Biology, 51:492-508, 2002. [4] Shimodaira, H. (in press), Approximately unbiased tests of regions using multistep-multiscale bootstrap resampling, Annals of Statistics, 2004. [5] Shimodaira, H. and Hasegawa, M. (in press), Assessing the uncertainty in phylogenetic inference, Statistical Methods in Molecular Evolution (ed. R. Nielsen), Springer-Verlag, 2004. [6] Shimodaira, H. and Hasegawa, M., CONSEL: for assessing the confidence of phylogenetic tree selection, Bioinformatics, 17:1246–1247, 2001. [7] Yang, Z., PAML: a program package for phylogenetic analysis by maximum likelihood, Comput. Appl. Biosci., 13:555–556, 1997. [8] http://www.is.titech.ac.jp/~shimo/prog/