Journal of Geographic Information System, 2015, 7, 95-109 Published Online April 2015 in SciRes. http://www.scirp.org/journal/jgis http://dx.doi.org/10.4236/jgis.2015.72009
An Assessment of Temporal and Spatial Distribution of Thunder Storms in Iran Gholam Abbas Fallah Ghalhari*, Fahimeh Shakeri Faculty of Geography and Environmental Sciences, Hakim Sabzevari University, Sabzevar, Iran * Email:
[email protected] Received 15 January 2015; accepted 29 March 2015; published 3 April 2015 Copyright © 2015 by authors and Scientific Research Publishing Inc. This work is licensed under the Creative Commons Attribution International License (CC BY). http://creativecommons.org/licenses/by/4.0/
Abstract The main purpose of this study is to investigate temporal and spatial distribution of thunderstorm frequency in Iran. In order to do study, observed statistical data of the present weather codes of thunderstorm (17, 29, 91 - 99) in 50 synoptic stations around the country were used in a 35 years statistic period (1979-2013). The results of the study showed that the phenomenon occurs mostly in southwest, west and northwest regions of Iran. Thunderstorm occurrence reduces when moving toward east. Maku station in northwest of Iran shows the maximum thunderstorm frequency during the statistical period (mean annual of 31). Jask station in southern Iran (mean annual of 2) has shown minimum thunderstorm occurrence during the statistical period. In the eastern regions of Iran, Torbat Heydarieh station revealed higher frequency than the other stations which was because of high mountains like Qaenat. In terms of temporal distribution, spring showed the highest frequency of the phenomenon. In monthly scale, the maximum frequency of hail downfall happens in April and May. In hourly scale, the maximum occurrence of thunderstorm observed at 12 - 18 p.m. for UTC time.
Keywords Thunderstorm, Temporal and Spatial Distribution, Present Weather Codes, Iran
1. Introduction Thunderstorm is one of the complex and severe climate risks which results in many casualties in addition to destruction of a great number of crops and utilities in many different parts around the world. Only in 1953-1957, financial damages from thunderstorm were estimated more than 3.6 billion dollars. Thunderstorms take the second rank of natural disasters in terms of damage level to the US economy after Tornados [1]. The dangerous *
Corresponding author.
How to cite this paper: Ghalhari, G.A.F. and Shakeri, F. (2015) An Assessment of Temporal and Spatial Distribution of Thunder Storms in Iran. Journal of Geographic Information System, 7, 95-109. http://dx.doi.org/10.4236/jgis.2015.72009
G. A. F. Ghalhari, F. Shakeri
elements of thunderstorms are as follow: Updraft and strong turbulence, micro bursts and Gustian fronts, cyclones and tornados, lightening and thunders, hail and heavy rainfall. Two conditions are needed in order to form strong conventions of humidity like those occur in thunderstorm: conditional instabilities and ascending mechanism. Two requirements are needed in order to form strong conventions of humidity like those occur in thunderstorm: conditional instabilities and ascending mechanism. Conditional instabilities mean a particular state which is provided by the environment to form thunderstorm. Once the initial requirements are prepared, thunderstorms can continue their developments. Ascending mechanisms are as follow: Boundaries between the air mass, fronts, dry lines, sea breeze fronts, Gustian fronts from other thunderstorms and other ascending mechanisms such as atmospheric boundary waves, mountains and surface heating of the regions in a local scale [1]. Many studies have been already conducted in the field of thunderstorms in the world. This phenomenon has been investigated and studied with different approaches. Wietmann (2003) has performed one of the most significant studies in this field in which mountaineer climatic phenomena are discussed by using a synoptic approach, particularly lightning thunders, hails, heavy rainfalls and other mountaineer phenomena [2]. Esterling (1989) classified the different regions of America, according to the origin and the rainfall level generated by each thunder system and obtained five distinct regions for lightning storms [3]. Esterling (2003) has considered thunderstorm as an important challenge in the 20th century and has counted its environmental economical effects and the corresponding phenomena (hail, flood, storms) on the economy of agriculture section of the US as a disaster [4]. Goutlip (2009) has measured and tested a series of instabilities indices such as Shwualter, ascending, total totals, Eqilibrum surface pressure, SWEAT, K, CAPE and CIN in thunderstorm environments for the northeast of US. In this study, thunderstorm data from Jan to Aug in period 1998-2007 along with high atmosphere data obtained from radio sound technique, were used to forecast thunderstorm in eight regions in northeastern America. The results showed that the best predictor is often ascending index and the second is CAPE index [5]. Haff (1964) has studied the role of thunderstorm, maximum rainfall, temperature, dew point and air fronts and their influences in hail fall distribution in a 50 years period. He believed that hail fall distribution in a small region could be influenced by different climatic elements [6]. Pascal (2005) studied convectional storms on Mediterranean Sea. They related the frequency of thunderstorm in California in late spring and summer to the local mountains and the influence of Sea. In addition, mountains play an important role in formation of local convergence and canalizing the sea breezes. Combination of sea and valley breezes has also increased humidity in the lower layers of the atmosphere and the frequency of thunderstorms [7]. Adam et al. (1999) believed that the development of thunderstorm in South Africa has originated from the strong gradient of temperature, dew point temperature and pressure. They concluded that radar data can be used to predict real-time of development and movement of Thunderstorm [8]. Camophou et al., 2000 investigated phenomena such as hail and thunder storms in northern Italy. They concluded that extreme events such as hail and thunder storms have essential link with the Atlantic disturbances specially disturbances of cold front [9]. Dayan & coworkers (2001) analyzed the autumn strong storms of east Mediterranean and stated that deepening trough in the middle levels of the atmosphere and its extension to the southern latitudes enhanced subtropical jet and Red Sea trough [10]. Dastjerdi & Rahimi (2005) have studied the time and statistical features of thunderstorms in Tabriz as a sample of northwestern Iran by using frequency data of thunderstorms in this region. This study showed that in the monthly and seasonal time scale, May and spring have the maximum frequencies of thunderstorm, respectively [11]. Hejazizadeh (2000) studied the variations of two important components of the atmosphere general circulation, i.e. Azour subtropical high pressure and positive vorticity of 500 hPa, in order to evaluate lightening storms in west regions of Iran during June (hot period of a year), Jan and Feb (cold periods of a year) in a 30 year statistical period. She compared the obtained data with the results from rainfalls of 18 stations in northwest and west of Iran in different latitudes. She analyzed the atmospheric stability and instability and number of storms together with lightening during 1971-1985 by studying of the above component variations in hot and cold periods of the year and concluded that in the beginning of the hot to cold transition period, increased rainfall directly re-
96
G. A. F. Ghalhari, F. Shakeri
lated to the subtropical high pressure retreat [12]. In order to study the frequency of thunderstorms in Iran, Haqiqat Kashani (1991) has noted the maximum number of the storms occurs in the afternoon and around 8 p.m. to 3 a.m. local time and believes that most thunderstorms of Iran are resulted from convective instability of air masses and possibly night storms and less affected by large scale atmospheric systems and cold fronts [13]. Tajbakhsh et al., 2008 investigated the forecast of thunderstorm using decision making tree. The results of the study showed that the large scale indices of thunderstorm occurrence are similar to the atmospheric instabilities and prediction of thunderstorm requires the modeling of regional scale [14]. Iranian Meteorological Institute (2006) studied the difference of various regions in terms of kind of rainfall and also the influence of hail fall on plant growth in Iran. Results showed that by moving from west and northwest to the north, east and northeast regions, the maximum rainfall transfers from May to March and April and also a maximum appears in winter [15]. Omidvar et al., 2001 used daily hail fall data of 14 synoptic stations of Fars province in a period between 2006-2009. They selected three samples of severe hail falls in the region during the statistical period .Using NCEP/NCAR Re-Analysis data, they prepared map of geopotential height, moisture advection, Omega and vorticity. Their results showed that in each selected period, hail fall in Fars province was related to formation and enhancement of cut of low in 500 hpa level in March [16]. Since at present it is not possible to forecast certain atmospheric conditions for a few next months or years and the planning for activities, depending upon climatic conditions, are carried out in a long term scale, recognition of positions disposed to thunderstorm in each region are very important for long term planning and reduction of damages from the phenomenon.
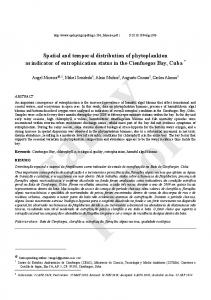
2. Materials and Methods In order to do the study, thunderstorm data used in an hourly (00, 03, 06, 09, 12, 15, 18 and 21), monthly and annual time scale for 50 synoptic stations of Iran during a 35 years statistical period (1979-2013). Among 100 codes relating to the current weather (WW), codes 17, 29, and 91 - 99 which included any thunderstorm occurrence in observation times scale were chosen. Then the statistical parameters of the considered phenomena were extracted in different time scales in each station using SPSS software. At last, in order to show spatial and temporal distributions of thunderstorm phenomenon in Iran, IDW method was used in Arc GIS software. Figure 1 shows Iran topographical map together with the selected stations.
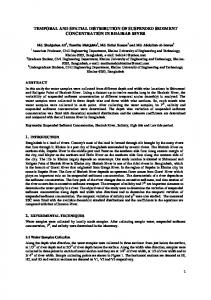
3. Results and Discussion 3.1. Annual Distribution of Thunderstorms in Iran Table 1 shows the statistical parameters including average, sum, standard deviation, minimum and maximum of days with thunderstorms in the selected stations during the 35 year statistical period (1979-2013). Regarding the table it is shown that in terms of average, the most frequency of thunderstorms in an annual scale was 31.5 in Maku station and the least was seen in Jask station with 2.2. In general, it can be noted that the mean domain of annual thunderstorm in all stations varied from 2.2 to 31.5 in each year. Maximum annual standard deviation was obtained 18.16 in Maku and the minimum one was 2.13 for Yazd station. Maximum annual thunderstorm was observed 67 in Orumiyeh station. As it can be seen, Maku station experienced 1103 number of thunderstorm and took the first rank in the country. Regarding the frequency of thunderstorm in each station under study, zoning of the phenomenon occurrence was shown in Figure 2, in the 35 years statistical period on the map. Regarding the figure, it can be noted that regions with the maximum frequency of thunderstorm are centralized in west and northwest regions of Iran. Maku station had the maximum frequency of the phenomenon. Other stations with high frequency included Tabriz, Khooy, Orumiyeh, and Khorramabad .The other regions almost adapted to the dry and desert regions of Iran, showed a relatively low frequency of thunderstorm. As it can be seen in Figure 1, orientation of northwest-southeast of Zagros Mountains was the main factor of the higher frequency of thunderstorms in west and northwest of Iran.
3.2. Seasonal Distribution of Thunderstorm 3.2.1. Spring Spatial distribution of thunderstorms in spring is shown in Table 2 and Figure 3. With considering to Table 3, the maximum frequency of thunderstorm belongs to Maku station in northwest of Iran with 675 numbers and the
97
G. A. F. Ghalhari, F. Shakeri
Figure 1. Iran topographical map together with the selected stations.
Figure 2. Spatial distribution of annual frequency of thunderstorms in Iran during the statistical period (1979-2013).
98
Table 1. Statistical parameters of thunderstorm in the statistical period (1979-2013). Station
Mean
Stdev Skewness
Nowshahr
12.28
11.17
Shahrekord
10.77
Khorram Abad
G. A. F. Ghalhari, F. Shakeri
Min
Max
Sum
Station
Mean
Stdev Skewness
Min
Max
Sum
1.20
1
43
430
Anzali
16.31
7.80
0.04
1.00
35.00
571
6.32
0.70
1
30
377
Arak
7.85
5.25
0.52
0.00
21.00
275
22.4
9.80
−0.143
6.00
38.00
787
Ardebil
11.08
7.14
0.00
0.00
23.00
388
Tehran
10.97
5.05
−0.020
2.00
20.00
384
Bandar Abbas
10.54
6.72
.95
2
31
369
Khooy
19.25
11.40
1.10
4.00
55.00
674
Birjand
7
3.62
0.55
1
17
238
Kermanshah 18.26
9.07
1.11
8.00
42.00
621
Bojnoord
12.76
6.95
0.21
2
29
434
Mashhad
8.26
4.80
0.68
1.00
21.00
281
Bushehr
22.73
10.61
1.17
9
58
773
Kish
11.00
6.75
1.17
1.00
30.00
385
Chahbahar
4.17
4.78
2.44
0.00
24
146
Zanjan
19.77
7.89
0.70
6.00
42.00
692
Esfahan
3.08
2.42
0.91
0.00
9
105
Tabriz
23.11
11.69
1.29
6.00
63.00
809
Fasa
6.02
4.88
0.84
0.00
18
205
Ramsar
16.00
9.31
1.05
4.00
45.00
560
Ghazvin
20.20
7.94
0.77
7
41
687
Orumiyeh
25.20
13.43
1.18
4.00
67.00
882
Qom
3.73
3.42
2.16
0.00
17
127
Saqez
11.37
5.63
0.26
0.00
25.00
398
Hamedan Airport
8.35
6.97
1.75
0.00
32
284
Sanandaj
11.60
6.12
0.26
1.00
24.00
406
Hamedan Nozheh
13.37
5.58
0.15
3
24
468
Shiraz
10.82
7.01
0.82
0.00
29.00
379
Kashan
2.41
2.25
0.60
0.00
7
82
Zabol
3.08
3.36
1.70
0.00
15.00
108
Kerman
4.11
2.39
1.43
1
12
140
Zahedan
6.40
5.68
1.63
0.00
26.00
224
Babolsar
7.54
5.10
0.58
1
19
264
Rasht
15.54
9.11
0.13
1.00
35.00
544
Gorgan
12.67
9.31
0.40
0.00
33
431
Torbat Heydarieh
8.85
5.27
0.96
2.00
23.00
310
Dushan Tapeh
10.91
5.99
0.30
0.00
22
371
Semnan
7.02
3.88
0.23
0.00
15.00
246
Jask
2.23
2.75
1.10
0.00
9
76
Shahrud
13.22
6.39
0.88
2.00
33.00
463
Iranshahr
9.32
5.63
1.03
0.00
26
317
Yazd
2.51
2.13
1.03
0.00
9.00
88
Quchan
10.35
4.45
0.94
3
26
352
Abadan
9.05
4.85
0.91
1.00
23.00
317
Sabzevar
19.17
10.11
0.31
0.00
43
652
Abadeh
5.02
4.14
0.58
0.00
14.00
176
Dezful
8.50
4.64
0.50
1
20
289
Ahwaz
13.74
7.60
0.44
1.00
33.00
481
Maku
31.51
18.16
−0.52
0.00
59
1103
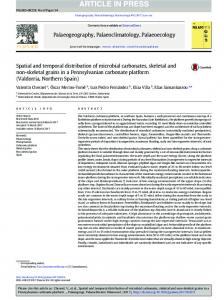
minimum was seen in Jask station in southeast of Iran with two numbers. Regarding to Figure 3(a), the maximum frequency of thunderstorms happen in northwest of the country because western hillside of Zagros Mountains helps the air ascending and also the moisture content in this season is available for convection. 3.2.2. Summer Respecting to Table 2 it is seen that the maximum thunderstorm frequency belongs to Maku station in northwest of the country with 356 numbers and the minimum was seen in Jask and Bushehr stations (in southeast and southwest of the country, respectively) with one numbers. The spatial distribution of thunderstorm in spring is
99
G. A. F. Ghalhari, F. Shakeri
Table 2. Seasonal distribution of thunderstorm during the statistical period (1979-2013). Station
Winter
Spring
Summer
Autumn
Station
Winter
Spring
Summer
Autumn
Nowshahr
16
150
145
109
Anzali
11
290
176
86
Shahrekord
62
167
34
114
Arak
44
182
63
37
Khorram Abad
166
321
26
271
Ardebil
10
250
104
25
Tehran
40
209
71
64
Bandar Abbas
172
39
27
131
Khooy
12
440
179
44
Birjand
90
98
10
40
Kermanshah
97
302
25
210
Bojnoord
28
292
81
33
Mashhad
32
217
15
17
Bushehr
302
99
1
371
Kish
190
57
12
126
Chahbahar
52
28
45
53
Zanjan
19
427
170
76
Esfahan
15
63
14
11
Tabriz
15
534
201
75
Fasa
73
55
41
39
Ramsar
14
246
196
104
Ghazvin
53
420
121
93
Orumiyeh
17
565
173
118
Qom
7
90
13
17
Saqez
31
237
45
87
Hamedan Airport
11
174
30
69
Sanandaj
35
252
30
89
Hamedan Nozheh
31
296
65
76
Shiraz
122
109
21
87
Kashan
6
56
10
10
Zabol
51
39
3
16
Kerman
12
100
31
17
Zahedan
43
121
20
40
Babolsar
7
52
118
88
Rasht
18
273
198
80
Gorgan
14
132
190
81
Torbat Heydarieh
58
169
10
23
Dushan Tapeh
42
199
56
67
Semnan
15
124
62
17
Jask
28
2
1
17
Shahrud
34
265
103
57
Iranshahr
74
112
75
43
Yazd
12
67
5
4
Quchan
25
174
32
22
Abadan
91
88
3
135
Dezful
228
154
7
252
Abadeh
22
118
14
22
Sabzevar
49
186
26
29
Ahwaz
128
126
9
219
Maku
10
675
356
49
shown in Figure 3(b). According to the figure, in the summer regions with the maximum thunderstorms are centralized in northwest (Maku station). As it can be seen, the thunderstorm frequency in this season dramatically decreases. Predominance of Azour subtropical high pressure in the summer and most regions of the country prevent strong convention and thunderstorm formation. 3.2.3. Autumn Regarding to Table 2 maximum frequency of thunderstorm in the autumn relates to Bushehr (371 numbers) and Khorramabad stations (271 numbers) and the minimum is seen in Yazd station (4 numbers). Figure 3(c) shows spatial distribution of thunderstorms in autumn. As it can be observed, regions with maximum thunderstorms are centered in west and southwest of Iran. In this season, retreat of Azour subtropical high pressure toward lower latitudes and mountains and also proximity to Mediterranean Sea and Persian Gulf has provided conditions to form convention and thunderstorm in northwest and southwest regions of the country. 3.2.4. Winter Regarding to Table 2 it is seen that in the winter the maximum frequency of thunderstorms belongs to Bushehr
100
G. A. F. Ghalhari, F. Shakeri
Figure 3. Spatial distribution of thunderstorms in different seasons.
(302 numbers) and Dezful stations (228 numbers) and the minimum was seen in Kashan station with 6 numbers. The spatial distribution of thunderstorm in the winter is demonstrated in Figure 3(d). According to the figure it is seen that in the winter regions with maximum thunderstorms are centered in southwest parts. The thunderstorm region in this season is extended to the eastern parts of Iran. Lack of presence of Azor subtropical high pressure, proximity to the sea, sea to land flows, high temperature and surface heating provide the best conditions for thunderstorm formation in these regions.
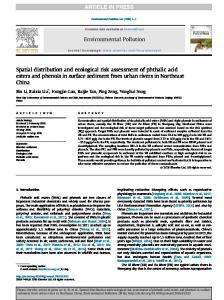
3.3. Monthly Distribution of Thunderstorm Study of frequency of thunderstorm in each month (Table 3 and Figure 4) shows that thunderstorms occur more in April, May and June than in the other months during the studied statistical period (1979-2013). To clarify the issue, the spatial distribution of thunderstorms is discussed in the following: Regarding to Table 3, the maximum frequency in January was seen in Bushehr station with 117 numbers and the minimum was observed 0 numbers for Khoy, Bojnoord and Ardebil. In this month, regions with the maximum occurrence of thunderstorms are centralized in south to southwest parts of the country (Figure 4(a)). Dezful station had the highest frequency of thunderstorm after Bushehr. Other regions have relative low frequencies. In Feb (Figure 4(b)), the maximum frequency of thunderstorm was observed in Bushehr station with 68 numbers and the minimum was seen in Qom, Kashan and Ardebil stations with 0 numbers. The thunderstorm frequency was seen more in Feb than in Jan and involved the eastern regions of Iran. In this month, maximum thunderstorm frequency was seen in southeast to southwest regions of the country and in eastern part of Iran Birjand station had the maximum frequency because of the high mountains like Qaenat and Birjand mountains. In this month, Dezful, Bushehr, Bandarabbas, Kish and Iranshahr revealed high frequency of thunderstorm. In March (Figure 4(c)) the maximum frequency of thunderstorm occurrence was related to Bushehr station with 117 numbers and the minimum number was for Kerman and Babolsar with frequency 1. Regarding to Figure 4(c), the maximum regions of thunderstorms are found in west to south regions of the country. In this month the
101
G. A. F. Ghalhari, F. Shakeri
102
G. A. F. Ghalhari, F. Shakeri
Figure 4. Spatial distribution of thunderstorm in different months. Table 3. Monthly distribution of thunderstorms in different stations during the statistical period (1979-2013). Station
Jan
Feb
March
Apr
May
June
July
Aug
Sep
Oct
Nov
Dec
Nowshahr
6
8
2
18
66
66
62
41
42
61
35
13
Shahrekord
17
20
25
72
74
21
9
11
14
22
64
28
Khorram Abad
34
33
99
184
121
16
10
8
8
109
104
58
Tehran
2
8
30
66
98
45
32
19
20
44
13
7
Khooy
0
4
8
73
199
168
77
51
51
36
6
2
Kermanshah
13
24
60
156
136
10
8
5
12
102
76
32
Mashhad
1
4
27
69
104
44
5
5
5
8
4
5
Kish
62
52
76
45
9
3
8
4
0
5
52
69
Zanjan
1
7
12
114
197
116
90
54
26
54
20
2
Tabriz
4
4
7
104
240
190
101
41
59
65
8
2
Ramsar
3
7
4
37
109
100
87
62
47
69
26
9
Orumiyeh
3
2
12
94
301
170
72
48
53
81
31
6
Saqez
4
12
15
77
118
42
15
19
11
38
40
9
Sanandaj
2
5
28
122
102
28
17
6
7
48
30
11
103
G. A. F. Ghalhari, F. Shakeri Continued Shiraz
21
24
77
63
40
6
8
11
2
20
20
47
Zabol
5
14
32
20
15
4
1
1
1
5
8
3
Zahedan
5
10
28
59
56
6
8
6
6
25
10
5
Rasht
1
4
13
59
115
99
79
59
60
54
19
7
Torbat Heydarieh
8
15
35
71
70
28
6
3
1
7
8
8
Semnan
1
1
13
26
71
27
29
21
12
11
2
4
Shahrud
1
7
26
62
129
74
23
40
40
37
10
10
Yazd
1
1
10
29
31
7
5
0
0
2
1
1
Abadan
22
32
37
49
35
4
0
1
2
30
65
40
Abadeh
1
1
20
35
61
22
8
4
2
14
5
3
Ahwaz
32
35
61
76
41
9
2
2
5
44
98
77
Anzali
3
2
6
57
123
110
65
49
62
58
15
13
Arak
2
6
36
68
87
27
28
25
10
26
10
1
Ardebil
0
0
10
28
130
92
39
35
30
22
3
0
Bandar Abbas
33
62
77
19
13
7
6
16
5
36
38
57
Birjand
16
26
48
42
47
9
2
2
6
7
9
24
Bojnoord
0
7
21
77
140
75
33
22
26
15
16
2
Bushehr
117
68
117
74
23
2
0
1
0
26
171
174
Chahbahar
32
11
9
8
8
12
20
24
1
8
11
34
Esfahan
1
3
11
26
24
13
5
5
4
3
8
0
Fasa
9
19
45
27
22
6
13
23
5
3
13
23
Ghazvin
5
11
37
135
190
95
54
36
31
63
24
6
Qom
1
0
6
36
40
14
4
1
8
14
3
0
Hamedan Airport
1
2
8
55
92
27
15
10
5
43
23
3
Hamedan Nozheh
1
1
29
100
150
46
27
28
10
58
17
1
Kashan
1
0
5
16
31
9
3
5
2
8
2
0
Kerman
6
5
1
23
42
35
15
11
5
11
6
0
Babolsar
2
3
1
2
22
28
40
37
41
44
33
11
Gorgan
2
4
8
13
64
55
62
68
60
56
19
6
Dushan Tapeh
5
6
31
72
78
49
23
17
16
48
17
2
Jask
13
4
11
2
0
0
0
0
0
1
4
12
Iranshahr
4
40
30
33
42
37
39
30
6
23
5
15
Quchan
1
6
19
57
70
47
17
5
10
11
4
7
Dezful
81
55
92
105
42
7
1
3
3
66
103
83
Sabzevar
2
14
33
64
93
29
10
9
7
13
8
8
Maku
-
-
4
77
268
330
153
113
90
46
2
1
104
G. A. F. Ghalhari, F. Shakeri
development of thunderstorm increased and extended to the northeast regions. Dezful, Bushehr and Khorramabad stations had the highest frequencies of this phenomenon. Another group with high frequency includes Kish, Shiraz and Bandarabbs stations. In April (Figure 4(d)) the highest frequency related to Khorramabad with 184 numbers and the least was seen in Jask and Babolsar with 2 numbers. As it is shown, the frequency of thunderstorm occurrences is centralized in west regions of the country. Khorramabad and Kermanshah stations had the highest frequency of thunderstorm and Ghazvin, Zanjan and Sanandaj are in the next rank. In May (Figure 4(e)) the highest frequency of thunderstorm was related to Orumiyeh station in northwest of Iran with 301 numbers and the minimum number was seen in Jask station in southeast of Iran with frequency of zero. According to Figure 4(e), in this month south, central and almost east regions experience the minimum numbers of thunderstorm and the northwest regions experience the least numbers. Maku, Tabriz and Orumiyeh had the highest frequency of this phenomenon and Ghazvin, Zanjan and Khooy take the second rank in this month. In June (Figure 4(f)), maximum frequency of thunderstorm relates to Maku station in northwest of Iran with about 330 numbers and the minimum relates to Jask in southeast of Iran with 0 number. In July (Figure 4(g)) the maximum frequency of thunderstorm related to Maku with 153 numbers and the minimum was for Abadan, Bushehr and Jask with frequency of 0 numbers. In this month Iranshahr and Bojnoord, in southeast and northeast, respectively, showed the maximum frequency. In northwest regions of the country, Maku had the maximum frequency of thunderstorm. Tabriz also showed a high frequency. In August (Figure 4(h)) the maximum frequency of thunderstorm related to Maku with 113 numbers and the minimum was seen in Yazd and Jask with 0 numbers. In August, regions with maximum thunderstorm are centralized in northwest parts and the frequency of the storm is extended to the central regions. In this month, Maku station had the highest frequency of thunderstorm. In September (Figure 4(i)) regions with the highest frequency of thunderstorm are centralized in north and northwest regions. The maximum frequency of thunderstorm was related to Maku station with 90 numbers and the minimum was seen in Kish, Yazd and Jask with frequency of 0 numbers. The other group with relative high frequency included Tabriz, Khooy, Anzali, Rasht and Gorgan. In October (Figure 4(j)) regions with the maximum thunderstorm are seen in west parts. In this month, the maximum frequency related to Khorramabad station with 109 numbers and the minimum was seen in Jask station with 0 numbers. In this month, Ramsar and Orumiyeh had the highest frequency. In November (Figure 4(k)) Bushehr station had the maximum frequency of thunderstorm (171 numbers) and the minimum was observed in Yazd station (1 number). In November, Bushehr station showed the maximum frequency of thunderstorm. The other group with relatively high frequency was Khorramabad Dezful and Ahvaz. In December (Figure 4(l)) the maximum frequency was seen in Bushehr station (174 numbers) and the minimum was seen in Isfahan, Ardebil, Qom, Kashan and Kerman stations (0 numbers). As it can be seen, in this month regions with maximum frequency of thunderstorm are centralized in south to southwest parts of the country. In this month, Bushehr station showed the maximum frequency of thunderstorm occurrence.
3.4. Hourly Distribution of Thunderstorms Table 4 and Figure 5 show thunderstorm occurrence in the main synoptic hours during the 35 years statistical period (1979-2013). As it can be seen in this table, thunderstorm frequency is higher for 12, 15, and 18 at UTC time than at the other times. To clarify the issue, spatial distribution of thunderstorms in different times is discussed briefly. Regarding to Table 4, for 00 at UTC, maximum frequency of thunderstorm relates to Bushehr station (122 numbers) and the minimum frequency is for Abadeh station (2 numbers). Regarding to Figure 5(a) for 00 at UTC, Dezful and Bushehr stations in southwest have the maximum frequency of thunderstorm. For 03 at UTC, the maximum frequency was seen in Bushehr in southwest of Iran (149 numbers) and minimum was seen in Kashan in the centeral regions (0 number). As it can be seen in Figure 5(b) Bushehr station in southwest of the country has the maximum frequency of thunderstorm. For 06 UTC, like 00 and 03 at UTC, maximum frequency of thunderstorm was related to Bushehr station in west foothills of the Zagros mountains and Persian Gulf coasts (90 number) and the minimum was seen in Qom, Zahedan and Kashan stations (1 number) which are located in the margins of central desert of Iran. Regarding to Figure 5(c), for 06 at UTC time, regions with maximum thunderstorm are seen in southwest and west parts. As it can be observed, at this time Bushehr has the maximum thunderstorm frequency. For 09 at UTC, maximum frequency of thunderstorm belongs to Maku station (132 numbers) and the minimum is seen in
105
G. A. F. Ghalhari, F. Shakeri
Figure 5. Spatial distribution of thunderstorm against the synoptic hours.
106
G. A. F. Ghalhari, F. Shakeri
Table 4. Temporal distribution of thunderstorm during the studied statistical period (1979-2013). Station
00
03
06
09
12
15
18
21
Station
00
03
06
09
12
15
18
21
Nowshahr
48
36
14
20
53
74
96
80
Anzali
82
45
23
14
46
108
142
111
Shahrekord
25
28
35
43
74
80
60
32
Arak
16
11
10
26
78
64
46
21
Khorram Abad
82
62
49
75
114
121
155
129
Ardebil
24
16
5
26
80
92
95
51
Tehran
38
16
11
21
53
82
104
59
BandarAbbas
62
43
27
32
39
58
47
61
Khooy
23
24
5
30
171
187
179
56
Birjand
13
10
7
45
52
35
46
29
Kermanshah
71
46
39
41
126
114
108
90
Bojnoord
36
17
9
37
85
76
108
66
Mashhad
21
6
5
19
73
75
58
24
Bushehr
122
149
90
75
60
62
101
114
Kish
48
93
32
39
45
45
54
59
Chahbahar
24
15
8
10
10
18
26
31
Zanjan
31
15
9
47
221
193
124
52
Esfahan
6
2
6
10
23
31
19
6
Tabriz
57
23
9
52
132
188
230
109
Fasa
18
10
15
11
44
44
41
25
Ramsar
75
29
11
17
47
104
155
122
Ghazvin
46
25
14
32
194
187
134
55
Orumiyeh
65
36
19
73
192
196
199
92
Qom
10
8
1
6
30
34
30
15
Saqez
19
38
27
33
88
91
62
40
Hamedan Airport
19
12
11
23
52
73
65
29
Sanandaj
38
26
12
42
98
91
61
41
Hamedan Nozheh
35
19
9
43
117
125
89
31
Shiraz
41
30
25
41
57
54
50
41
Kashan
3
0
1
3
28
21
22
4
Zabol
10
4
4
6
14
23
33
15
Kerman
6
4
2
23
41
40
15
9
Zahedan
5
5
1
59
60
58
26
10
Babolsar
41
37
19
15
17
28
65
42
Rasht
63
46
29
19
60
99
144
105
Gorgan
50
36
13
18
40
78
117
76
Torbat Heydarieh
17
10
7
26
59
44
59
31
Dushan Tapeh
42
21
10
19
58
68
85
61
Semnan
13
10
10
14
52
37
46
36
Jask
8
6
2
6
3
7
9
6
Shahrud
20
23
5
33
131
112
91
48
Iranshahr
10
7
5
12
54
118
79
25
Yazd
3
3
5
8
25
27
16
1
Quchan
12
8
7
33
87
77
42
31
Abadan
35
33
22
27
32
61
76
31
Sabzevar
26
11
8
12
57
50
74
52
Abadeh
2
6
5
24
66
47
21
5
Dezful
96
73
45
51
74
103
102
106
Ahwaz
75
74
46
37
42
66
72
70
Maku
40
14
14
132
410
263
158
68
Kashan station (3 numbers). As it can be seen in Figure 5(d), for 09 at UTC, the regions with the maximum thunderstorm occurrence has been transferred from southwest to northwest of the country. At this time, Maku had the maximum thunderstorm frequency. However, the frequency has been extended to the east and northeast parts of the country. For 12 at UTC, the maximum thunderstorm frequency belongs to Maku station (410 NUMBERS) and the minimum was seen in Jask station (3 NUMBERS). As it can be observed in Figure 4(e), regions with maximum thunderstorm frequency are seen in northwest and almost in west parts of the country. For 15 at UTC, the maximum thunderstorm frequency was seen in Maku station (263 numbers) and the minimum was seen in Jask station (7 numbers). According to Figure 5(f), for 15 at UTC, regions with maximum thunderstorm frequencies are seen in north, northeast, northwest, west and southeast parts of the country. For 18 at UTC, the maximum thunderstorm frequency relates to Tabriz station (230 numbers) and the minimum is seen in Jask station (9 numbers). As it can be observed in Figure 5(g) for 18 at UTC, regions with maximum thunderstorm frequency are seen in north, northeast, northwest, west and southeast of the country.
107
G. A. F. Ghalhari, F. Shakeri
For 21 at UTC, the maximum thunderstorm frequency was related to Khorramabadstation (129 numbers) and the minimum was seen in Yazd station (1 numbers). According to Figure 5(h), for 21 at UTC, regions with maximum frequency of thunderstorm are centralized in north, northeast, northwest, west, southeast, and somewhat center of Iran. Ghazvin, Ramsar, Rasht, Anzali, Tabriz, Khorramabadand Dezful stations had the maximum thunderstorm occurrence. As it was noted, thunderstorm frequencies depended upon availability of ascending mechanisms and conditional instabilities. Once the above conditions are present, the formation of thunderstorms increases. The above results show that in the winter the required conditions to form convention instability and thunderstorms are more possible in southwest parts as western winds and Mediterranean cyclones are dominant phenomenon in northwestern country. However, in the spring and summer, the conditions are more provided in northwest for retreat of the western winds and Mediterranean cyclones toward northern latitudes because of the residual humidity from the winter and the southern hillside heating of Zagros mountains in the spring provides conditions for local instabilities to occur therefore the maximum frequency of thunderstorm occurrence is observed in this region. In addition, the condition to form thunderstorms in southwest parts is more achievable in the autumn because of the surface heating and subtropical high pressure retreat toward the lower latitudes and presence of sufficient humidity. Furthermore, in an hourly scale, the required conditions for thunderstorm formation at night are more available in Persian Gulf and Oman Sea Coasts; however, the southern domains of Zagros Mountains are more Susceptible for thunderstorm development during the day.
4. Conclusion Results show that the spatial distribution of thunderstorm in Iran is a function of time and topographical conditions of the considered region. According to the obtained results it can be noted that thunderstorm focus is more observed in southern domains of Zagros Mountains and then the frequency decreases by moving toward eastern parts. In the northern east of Iran, Torbat Heydarieh station revealed the maximum frequency among other adjacent stations which was related to the presence of high mountains like Qaenat Mountains in the region. In addition, in terms of temporal distribution, the maximum frequency of thunderstorm phenomenon occurs more in April and May in the spring. In this season, the most effective factor of ascending in the country is hillside convention. Maku station in northwestern Iran showed the maximum frequency of thunderstorm during the statistical period under study (mean annual 31 number) and Jask station experienced the least frequency of thunderstorm (mean annual 2 number). Also, the maximum frequency of thunderstorm phenomenon has happened during 12 to 18 o’clock in UTC time. This time interval complies with the afternoon hours and the maximum surface heating, and water evaporation to the atmosphere increases the buoyancy of air parcels ascending to the atmosphere and provides the conditions to form strong conventions and consequently the thunderstorms.
References [1]
Changnon, S.A. (2003) Thunderstorm Rainfall in the Conterminous United States. Bulletin of the American Meteorological Society, 82, 1925-1940. http://dx.doi.org/10.1175/1520-0477(2001)0822.3.CO;2
[2]
Whiteman, C.D. (2003) Mountain Meteorology. Oxford University Press, London.
[3]
Easterling, D.R. (1989) Regionalization of Thunderstorm Rainfall in the Contiguous U.S. International Journal of Climatology, 9, 567-579. http://dx.doi.org/10.1002/joc.3370090603
[4]
Easterling, R. (2003) Trends in U.S. Climate during the Twentieth Century. American Meteorological Society, 12, 312.
[5]
Gottlieb, R.J. (2009) Analysis of Stability Indices for Severe Thunderstorms in the Northeastern United States. M.Sc. Thesis, Cornell University, Ithaca, 146.
[6]
Huff, F.A. (1964) Correlation between Summer Hail Patterns in Illinois and Associated Climatological Events. Journal of Applied Meteorology and Climatology, 3, 240-246.
[7]
Callo, A. and Pascual, R. (2005) Diagnosis and Modelling of a Summer Convective Storm over Mediterranean Pyrenees. Advances in Geosciences, 2, 273-277. http://dx.doi.org/10.5194/adgeo-2-273-2005
[8]
Adam, B.F., de Coning, E. and Bantiz, L. (1999) A Servere Weather Event on 29 December 1997: Synoptic and Mesoscale Perspectives. Water SA, 26, 137-146.
[9]
Camuffo, D., Cocheo, C. and Enzi, S. (2000) Seasonality of Instability Phenomena (Hail Storms and Thunderstorms) in Padova, Northern Italy. From Archive and Instrumental Sources from AD 1300 to 1989. The Holocene, 10, 642-645.
108
G. A. F. Ghalhari, F. Shakeri
[10] Dayan, U., Margarit, Z.B. and Sharon, M.E. (2001) A Severe Autumn Storm over the Middle-East: Synoptic and Mesoscale Convection Analysis. Theoretical and Applied Climatology, 69, 103-122. http://dx.doi.org/10.1007/s007040170038 [11] Khoshhal, J. and Rahimighavidel, Y. (2007) Identify the Characteristics of the Environmental Disaster Area North West of Iran (Case Study: Risk of Thunder Storms in Tabriz). Quarterly Journal of the Humanities, 2007, 101-115. [12] Hejazi-Zadeh, Z. (2000) Synoptic Factors Associated with Thunder Storms in the West Country. Journal of the Faculty of Literature and Humanities, 28, 1-17. [13] Haghighat-Kashani, K. (1991) Frequency of Thunderstorms in Iran. MS Thesis, Department of Geography, University of Tehran. [14] Tajbakhsh, S., Ghafariyan, P. and Mirzaei, E. (2008) A Method for Predicting the Occurrence of Thunder Storms with Two Case Studies. Journal of the Earth and Space Physics, 4, 147-166. [15] Meteorological Institute of Iran (2006) Investigate the Occurrence of Avalanches, Thunderstorm, and Hail in Different Parts of Iran. Third Report, Vol. 1, Determine of Potential of Climate Disasters in the Country. [16] Omidvar, K., Safarpoor, F. and Zangeneh-Inanloo, E. (2011) Synoptic Analysis Tuesday Severe Hail Events in Isfahan. Journal of Geography and Development, 30, 157-178.
109