1034 • The Journal of Neuroscience, January 28, 2009 • 29(4):1034 –1045
Behavioral/Systems/Cognitive
An Auditory Region in the Primate Insular Cortex Responding Preferentially to Vocal Communication Sounds Ryan Remedios,1 Nikos K. Logothetis,1,2 and Christoph Kayser1 1
Max Planck Institute for Biological Cybernetics, 72076 Tu¨bingen, Germany, and 2Division of Imaging Science and Biomedical Engineering, University of Manchester, Manchester M13 9PT, United Kingdom
Human imaging studies implicate the insular cortex in processing complex sounds and vocal communication signals such as speech. In addition, lesions of the insula often manifest as deficits in sound or speech recognition (auditory agnosia) and speech production. While models of acoustic perception assign an important role to the insula, little is known about the underlying neuronal substrate. Studying a vocal primate, we identified a predominantly auditory region in the caudal insula and therein discovered a neural representation of conspecific communication sounds. When probed with natural sounds, insula neurons exhibited higher response selectivity than neurons in auditory cortex, and in contrast to these, responded preferentially to conspecific vocalizations. Importantly, insula neurons not only preferred conspecific vocalizations over a wide range of environmental sounds and other animal vocalizations, but also over acoustically manipulated versions of these, demonstrating that this preference for vocalizations arises both from spectral and temporal features of the sounds. In addition, individual insula neurons responded highly selectively to only a few vocalizations and allowed the decoding of sound identity from single-trial responses. These findings characterize the caudal insula as a selectively responding auditory region, possibly part of a processing stream involved in the representation of communication sounds. Importantly, our results provide a neural counterpart for the human imaging and lesion findings and uncover a basis for a supposed role of the insula in processing vocal communication sounds such as speech. Key words: vocalizations; auditory pathways; natural sounds; electrophysiology; macaque monkey; insula
Introduction Many social animals possess specialized systems for generating and recognizing vocal communication sounds that can range in diversity from simple calls to human speech. To interpret these sounds dedicated brain regions evolved to segregate communication sounds from the environment, analyze their acoustic properties and encode their meaning. In the primate these encompass auditory cortices and higher-level regions in the temporal and frontal lobes (Tian et al., 2001; Wang and Kadia, 2001; Romanski and Goldman-Rakic, 2002; Hickok and Poeppel, 2007). In addition, human imaging and lesion studies highlight the importance of another region in the processing of communication sounds: the insular cortex. Imaging studies implicate the insula in processing simple sounds and rhythms (Griffiths et al., 1997; Herdener et al., 2008) and vocal communication signals (Zatorre et al., 1994; Rumsey et al., 1997; Meyer et al., 2002; Kotz et al., 2003; Wong et al., 2004; Sander and Scheich, 2005) (and see Augustine, 1985; Bamiou et al., 2003). In addition, insula lesions often manifest as deficits in
Received Aug. 27, 2008; revised Dec. 19, 2008; accepted Dec. 21, 2008. This work was supported by the Max Planck Society and the German Research Foundation (KA 2661/1). We are grateful to C. Petkov for providing the acoustically manipulated sounds and to S. Panzeri for helpful discussions on the information theoretic analysis. Correspondence should be addressed to Christoph Kayser, Max Planck Institute for Biological Cybernetics, Spemannstrasse 38, 72076 Tu¨bingen, Germany. E-mail:
[email protected]. DOI:10.1523/JNEUROSCI.4089-08.2009 Copyright © 2009 Society for Neuroscience 0270-6474/09/291034-12$15.00/0
sound or speech recognition (auditory agnosia) and speech production (Spreen et al., 1965; Cancelliere and Kertesz, 1990; Engelien et al., 1995; Habib et al., 1995). Despite this evidence for a central role of the insula in processing and representing vocal communication sounds, little is known about the underlying neuronal substrate. Given their comparatively coarse resolution, functional imaging and lesion studies cannot rule out the possibility that auditory cortices adjacent to the insula contribute to the observed activations or functional deficits. In addition, the indirect evidence about neuronal activity provided by these studies does not reveal the neuronal properties and mechanisms by which the selectivity to communication sounds arises. Consequently, neurophysiological studies in primates are required to localize and characterize the neuronal representation of communication sounds in the insula. However, given the difficult access to the insula, only few studies examined acoustically responsive neurons in this region. Sudakov et al. (1971) reported neurons in the squirrel monkey’s insula responding to simple acoustic stimuli such as clicks, and Bieser (1998) and Bieser and Mu¨ller-Preuss (1996) used amplitude modulated tones to test insula neurons. While these results provide a glimpse on the processing of insula neurons, no neurophysiological study tested the encoding of natural sounds or communication sounds. Hence, despite the growing evidence from human studies for a role of the insula in acoustic processing very little is known about the underlying neuronal basis. Here, we bridge the gap between human imaging studies and
Remedios et al. • Auditory Representations in the Insula
the underlying neuronal processes by providing a detailed characterization of an acoustically responsive region in the macaque insula. To distinguish the insula from neighboring auditory regions and to allow a better interpretation of the results, we systematically compared the response properties of insula neurons to neurons recorded in auditory cortex. A range of different paradigms was used to (1) characterize basic auditory response properties, (2) assess the preference toward conspecific vocalizations, (3) and quantify the selectivity of insula neurons and their ability to discriminate individual vocalizations.
Materials and Methods Electrophysiological recording procedures. Two adult rhesus monkeys (Macaca mulatta) participated in these experiments. All procedures were approved by the local authorities (Regierungspra¨sidium) and were in full compliance with the guidelines of the European Community (EUVD 86/609/EEC) for the care and use of laboratory animals. Before the experiments, form-fitting head posts and recording chambers were implanted during an aseptic and sterile surgical procedure (Logothetis et al., 1999). The chambers were positioned based on preoperative magnetic resonance (MR) images and stereotaxic coordinates. In animal I05, we chose an oblique approach to the insula, penetrating approximately at a 45° angle in dorso–ventral (DV) direction and 20° angle in anterior– posterior (AP) direction (recordings were centered on AP ⫹ 14 mm, DV ⫹ 18 mm) (for corresponding MR images, see Fig. 1 A; supplemental Fig. 1, available at www.jneurosci.org as supplemental material). In animal M03, we chose a vertical approach to the insula (AP ⫹ 18 mm, DV ⫹ 18 mm). Recordings from auditory cortex were obtained from three animals, one of them M03, partly acquired as part of previous experiments (Kayser et al., 2007, 2008). A custom-made multielectrode system was used to lower up to six microelectrodes (FHC, 0.8 – 8 M⍀ impedance) through a grid mounted on the recording chamber to the insula (or auditory cortex). The coordinates of each electrode were noted along the different axes to later display the recording locations in a model of the insula (Fig. 1). Signals were amplified using a custom modified Alpha Omega amplifier system (Alpha Omega), filtered between 4 Hz and 9 kHz (4-point Butterworth filter) and digitized at 20.83 kHz. Recordings were performed in an anechoic booth (Illtec) and in complete darkness. The animals were passively listening to the sounds, sometimes with their eyes open, sometimes closed. Importantly, however, for each unit all stimulus paradigms were obtained during the animal’s same state. As a result, the different states of the animal (eyes open or closed) do not contribute to response variability or stimulus differences in the responses. Furthermore, we assured that based on the analysis of low frequency intracortical field potentials the animals were not asleep when they had their eyes closed. Comparing units recorded with eyes open or closed did not reveal systematic differences in response strength or selectivity, in agreement with previous studies comparing the responses in auditory cortex during wakefulness and sleep (Issa and Wang, 2007). Assignment of recording locations to particular areas. For recordings in auditory cortex, sites were assigned to the auditory core (primary auditory cortex) and auditory belt regions based on frequency maps constructed for each animal and the responsiveness for tone versus bandpassed noise stimuli. Most of our recording sites were located in caudal portions of primary auditory cortex [mainly the primary auditory field (A1) and the rostral auditory field (R)] and in caudal belt [caudo-lateral fields (CM) and caudo-medial field (CL)]. Core and belt were distinguished using a supra-threshold procedure (Schroeder et al., 2001; Fu et al., 2004), which probes frequency selectivity using tones and bandpassed noise stimuli of different frequency and intensities well above the neurons threshold. Previous work demonstrated the equivalence of this method to the classical, and threshold-based, determination of center frequencies (Merzenich and Brugge, 1973; Kosaki et al., 1997). See also Kayser et al. (2008) for further details. For recordings in the insula we proceeded as follows. We first obtained the approximate depths of different structures encountered along a penetration using high-resolution anatomical MR images of each animal
J. Neurosci., January 28, 2009 • 29(4):1034 –1045 • 1035
(compare Fig. 1). Then, we characterized the different areas typically encountered along a penetration during several recording sessions. In the case of I05, penetrations first passed through secondary somatosensory cortex, where neurons often responded to the animal moving or licking juice. From there, the electrode passed through the circular sulcus into the insula where the acoustically responsive neurons were encountered; from there the electrode continued into white matter, the claustrum and white matter again. In the case of M03, penetrations first passed through motor or somatosensory cortex, then after a considerable distance of white matter, through the insula; or when aimed too far medial, followed the white matter of the extreme capsule and missed the insula altogether or penetrated the claustrum. This pattern of transitions, the corresponding depth of the recording site and the response patterns consistently observed at a given depth were used to assign units to somatosensory areas, the insula or the claustrum. This procedure also allowed us to avoid recording from auditory fields in the medial belt by aiming our penetrations to the more dorsal (for I05) or medial (for M03) part of the insula. Finally, high-resolution anatomical MR images obtained after data collection in animal I05 showed miniature lesions resulting from frequent microelectrode penetrations, which confirmed that the neurons indeed have been recorded in the insular region. Acoustical stimuli. Sounds were stored as WAV files, amplified using a Yamaha amplifier (AX-496) and delivered from two free field speakers (JBL Professional), which were positioned at ear level 70 cm from the head and 50° to the left and right. Sound presentation was calibrated using a condenser microphone (Bru¨el & Kjær 4188 and a 2238 Mediator sound level meter, Bru¨el & Kjær) to ensure a linear (⫾4 dB) transfer function (between 88 Hz and 20 kHz). Sounds were presented at an average intensity of 65 dB SPL. We used several types of stimuli. To characterize auditory tuning and response properties, we used two paradigms, one consisting of band-passed noise and one of pure tones of different frequencies (Rauschecker et al., 1995; Recanzone et al., 2000; Rauschecker and Tian, 2004). Both types of stimuli were presented as pseudo-random sequences of 8 repeats, with individual stimulus duration of 50 ms and pauses of 80 ms. In this way these stimuli are reminiscent of amplitude modulated tones or noise, which are known to drive auditory neurons (Bieser and Mu¨ller-Preuss, 1996; Liang et al., 2002). Pure tones (15 frequencies) ranged from 125 Hz to 16 kHz in half-octave steps and the band-passed noise (7 bands, one octave width) covered the same frequency range. All stimuli were cosine ramped (on/off, 8 ms). Two different sets of natural sounds were used. The first set was used to compare the responses to conspecific vocalizations to those elicited by other natural sounds (natural sounds paradigm). This set consisted of 15 sounds each in 3 categories: (1) macaque vocalizations (Mvoc), (2) vocalizations and noises of other animals (Avoc), and (3) environmental sounds (Esnd) (45 different sounds in total). The macaque vocalizations consisted of five call types (coos, grunts, barks, pant-threats and screams), the sounds of other animals ranged from birds to lions, horses and tigers and the environmental sounds included noises such as produced by wind, water, doors or jungle background sound. While the macaque vocalizations were recorded in our own colony, animal and environmental sounds were obtained from several databases. All sounds were sampled at 22.1 kHz and were clipped to a maximum duration of 1 s; however, several sounds were shorter than that. These sounds were chosen to cover a broad diversity and maintain the average frequency spectra of the different categories as similar. These sounds were presented as a pseudo-random sequence with silent gaps of 1 s in between, and each sound was repeated twice. A second set of sounds was used to assess the selectivity of neurons to conspecific vocalizations in relation to closely matched acoustical controls (acoustic controls paradigm). This set consisted of 12 macaque vocalizations, each clipped to 300 ms duration and three different acoustical manipulations of each vocalization. The three manipulations were created for each of the 12 vocalizations as follows: The first manipulation preserved the temporal envelope of the vocalization but had a flat frequency spectrum [preserved envelope (PE)]; the second manipulation preserved the frequency spectrum but had a flat temporal envelope [preserved spectrum (PS)]; and the third manipulation preserved both the spectrum and envelope (PSE). Technically, these controlled sounds were
1036 • J. Neurosci., January 28, 2009 • 29(4):1034 –1045
obtained by shaping white noise with the specific property (envelope, spectrum or both) of the respective original sound (see Fig. 5A). Importantly, preserving both the envelope and the spectrum yields a sound which has the same average spectrum and the same envelope as the original sound, but does not feature the interaction (in time–frequency domain) of the original sound. Such interactions characterize how the frequency pattern changes over time (visible for the coo in Fig. 5A), and the PSE manipulation does not capture this dynamic frequency composition of the call. As a result, for tonal calls such as the coo, the preserved spectrum and envelope manipulation still differs from the original vocalization and this difference is visible in the time–frequency spectrum and can be clearly perceived by human listeners. Other vocalizations that sound more noisy and have no clear tonal component, such as the threat in Figure 5A, do not feature prominent time–frequency interactions and for such vocalizations the preserved spectrum and envelope manipulation captures most of the structure of the original vocalization. The 12 original vocalizations and their three respective manipulations were presented in a pseudo-random rapid sequence, with a silent gap of 100 –175 ms between sounds and with each sound being repeated at least 25 times. All results using information theoretic or stimulus decoding techniques were obtained from this paradigm. Data analysis. The data were analyzed in Matlab (Mathworks). The spike-sorted activity (SUA/MUA) of single neurons (SUA) and multiunit clusters (MUA) was extracted using commercial spike-sorting software (Plexon Offline Sorter, Plexon) after high-pass filtering the raw signal at 500 Hz. Spike times were saved at a resolution of 1 ms, and peri-stimulus time-histograms were obtained using bins of 5 ms and Gaussian smoothing (10 ms full-width at half-height). For many recording sites, spike sorting could extract single-unit activity [SNR ⬎7, spike valley (peak) divided by signal SD]. For other sites, however, the spike-sorting did not yield well separated clusters and the activity was deemed as multiunit; for most figures and analysis we grouped singleunit and multiunit sites together (SUA/MUA), but results for single units are reported where appropriate. Significant responses of individual units to sensory stimulation were determined by comparing the response amplitude of the average response to the response variability during the baseline period. Arithmetically this was done by normalizing the average response to SDs with respect to baseline, and a response was regarded as significant if this z-score breached 3 SDs during a continuous period of at least 50 ms. A unit was considered responsive when it breached this threshold for at least one stimulus of a given paradigm. In tone or band-passed noise paradigms, response amplitudes were computed from the trial averaged response by computing the mean response in the time window 50 –250 ms after stimulus onset. The bandwidth of the frequency tuning curve was obtained by fitting (fminsearch in MATLAB) a Gaussian function to the tuning curve obtained from the trial-averaged responses. The SD of the Gaussian fit was taken as the band-width index. The response latency was computed as the first time bin at which the averaged response exceeded two SD of its baseline for at least 10 consecutive milliseconds (note that this criterion is somewhat less strict than the above used to define responsive sites). In the natural sounds paradigm, response amplitudes were defined by first computing the mean response for each category (Mvoc, Avoc, Esnd) across trials and different sounds. Then, the peak of this average response was identified and the response amplitude was computed as the mean within a 100 ms window centered on this peak. As a control, different window lengths between 60 and 300 ms were used as well. To account for the difference in firing rate between individual units, we defined a relative firing rate as follows: for each unit the mean response across all three conditions was subtracted from the response to each individual condition. In the acoustic control paradigm, the response was defined for each of the 48 (12*4) stimuli as the mean in a 100 ms or 300 ms window centered on the peak response. For the decoding and information theoretic analysis, the response was defined in each individual trial. The response selectivity of individual neurons or the entire population of units was quantified using an index that is also known as sparseness (Vinje and Gallant, 2002). The selectivity of individual neurons (life-time selectivity) was computed from the mean responses to all sounds using the following formula:
Remedios et al. • Auditory Representations in the Insula
selectivity ⫽ 1 ⫺
冉冘 冊 冘
2
rs/n
s
rs2 /n
,
s
where the index s runs through all sounds, n equals the total number sounds (here 45) and rs specifies the response of this neuron to sound s. The index ranges from 0 to 1 with larger values indicating higher response selectivity. The response selectivity shown in Figure 3 is the distribution of this index across all neurons. The population selectivity of the entire set of neurons was defined in an analogous manner: For each individual sound, the above formula (replacing the sum over the sounds by a sum over all neurons) was used to compute the population selectivity for this sound. The population selectivity shown in Figure 3 is the distribution of this index across all sounds. We used a decoding analysis to quantify how well individual stimuli can be discriminated based on the neuronal response observed in a single trial. Practically, such a decoding analysis takes the response time course of one trial, and compares this time course to the average response obtained from all stimuli. The resulting performance measure indicates how well a linear decoder could tell individual stimuli apart given the observed response. This analysis was applied to the acoustic controls paradigm in which 12 vocalizations (and their acoustic controls, 300 ms duration) were each repeated at least 25 times. As a result, the response of a single trial can be compared with the average response of this sound and all other sounds. Importantly, the large number of repeats allows a statistical assessment of robustness of the response. In detail, we followed a leave-one-out cross-validation procedure (Averbeck and Romanski, 2006; Schnupp et al., 2006; Russ et al., 2008): The average response for the respective sound presented on a given trial was computed based on all trials except the “test” trial, and the average responses for all other sounds were computed based on all trials for these sounds. Then, the Euclidean distance was computed between the response on the test trial and all these average responses. The test trial was “decoded” as the sound for which the average response had the minimum distance from the test response. The average percentage of correctly decoded sounds was computed for each unit. This analysis was repeated using different temporal resolutions of the PSTH, with bins ranging from 10 to 300 ms. It should be noted that for a 300 ms stimulus, the use of bin widths on the order of 10 ms can produce slightly biased results since the number of bins approximately equals the amount of data available. However, the fact that the decoding performance obtained using longer windows dropped very little (e.g., the performance using 10 and 30 ms bins differed by ⬍10%) indicates that our conclusions are robust to statistical biases. The information theoretic analysis quantified the mutual information between the responses and the set of stimuli. The information value quantifies the reduction of uncertainty about the stimulus that can be gained from observation of a single trial of the neural response in units of bits (Shannon, 1948). Information is zero only when the stimulus and the response are statistically independent quantities, indicating that no knowledge about the stimulus can be gained by observing the response. Unlike other simpler correlation measures, information has the unique advantage of capturing all nonlinear dependencies of any statistical order that may be present in the data. We applied this analysis to the responses in the acoustic controls paradigm where each stimulus repeated at least 25 times. The mutual information was computed based on the response strength in a 100 ms window centered on the peak response, and as a control, also using the average response over the entire stimulus presentation (300 ms window). To account for statistical errors in the estimation of the probabilities needed to estimate the information quantities we used bias correction (Panzeri and Treves, 1996) and data shuffling procedures (Panzeri et al., 2007). For example, we shuffled the assignment between stimulus and response and re-computed the information values 100 times. The average of this bootstrapped information values was then subtracted from the actual values. In addition, we computed for each neuron the stimulus specific information about each of the 12 vocalizations (Butts, 2003). This stimulus-information value quantifies how much information is associated with each of the different stimuli.
Remedios et al. • Auditory Representations in the Insula
lu
sts ls
AC SC
ls
C
B posterior
SC
Insula
Core
auditory region in the posterior insula AP 0 +10
+20
coordinates: D-V: 16 - 21mm A-P: 12 - 21mm
dorsal
approx. DV coordinates [mm]
INS
A
J. Neurosci., January 28, 2009 • 29(4):1034 –1045 • 1037
22 20 18 16 14 ventral
MB anterior
Auditory region
10
12
14
16
18
20
posterior
22 anterior
approx. AP coordinates [mm] Penetrations with auditory neurons
Penetrations without
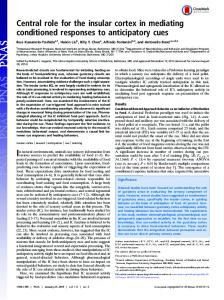
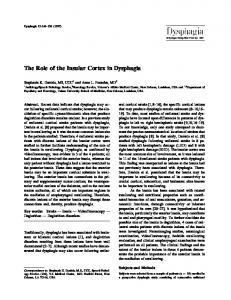
Figure 1. The auditory responsive region within the caudal insula. A, The insula (outlined in red) is demarcated on an anatomical MR (horizontal slice) image of one of the animals (I05). The approach to the insula is illustrated in yellow. Stereotaxic coordinates, cortical landmarks and adjacent areas are indicated. AC, Auditory cortex; SC, somatosensory cortex; INS, insula; lu, lunate sulcus; sts, superior temporal sulcus, ls, lateral sulcus; cs, central sulcus. B, A three-dimensional rendering created from coronal MR images reveals the mid to posterior extent of the auditory responsive insula region (orange) situated within the dorso-caudal insula (red). Adjacent to the insular cortex are the SC, the auditory core (core) and medial belt (MB) regions. The approach to the insula is illustrated in yellow. C, Electrode penetrations (recording sites) from both animals arranged in stereotaxic coordinates. Sites with responses to acoustical stimuli are marked in red and cluster in the dorso-caudal region of the insula.
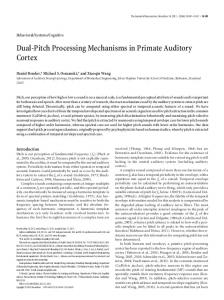
Results An auditory region in the insula Being concealed beneath the fronto-parietal and temporal opercula, the insular cortex is difficult to access and investigate (Fig. 1 A). To record from this structure we relied on a combination of preoperative and postoperative anatomical MR images to estimate the recording depth for the insula, and landmarks such as activity transitions between gray and white matter were used to assign individual sites to the either the insula or one of the neighboring structures (for further details, see Materials and Methods). We recorded along 125 penetrations in two animals. In each animal we used a grid to systematically sample adjacent sites across the desired area. With reference to stereotaxic coordinates and MR images, the majority of recording sites could be identified as within the caudal extent of the insula, and recording sites anterior yielded only few acoustically driven units. As a result we found that acoustic responses were mostly confined to an “auditory” region within the mid to caudal extent of the insula (Fig. 1 B, C; for a coronal MR image, see supplemental Fig. 1, available at www.jneurosci.org as supplemental material). Before studying the insula’s responses to natural sounds we characterized the response properties of insula neurons compared with neurons recorded from auditory cortex. The basic properties of auditory neurons are usually characterized with simple stimuli such as pure tones or band-passed noise. The responses to such stimuli allow an assessment of response latencies and selectivity to sound frequency, and have been used to distinguish primary from higher auditory fields within the auditory cortex (Recanzone et al., 1999; Rauschecker and Tian, 2004; Lakatos et al., 2005). We hence compared responses to pure tones of neurons recorded in the insula with neurons recorded from primary (fields A1, R) and secondary auditory cortex (regions of the caudal auditory fields CM and CL). A total of 390 insula units was tested with this paradigm, of which 268 (69%, 141 MUA units and 127 SUA) showed significant responses to pure tones. Their median responses (across neurons and sound frequencies) are shown in Figure 2 A together with the responses recorded in auditory cortex (166 units, thereof 87 SUA). Comparing both populations revealed an important difference between these regions: while auditory cortical neurons responded to each of the eight repeats of the tones, most insula neurons did not reflect the stimulus’ temporal structure in their
response time course (compare examples in Fig. 2C) but responded with one long-lasting elevation of firing. For a quantitative analysis of the temporal response profile, we computed the correlation of each neuron’s average response with the stimulus envelope (the envelope of the 8 repeats of the tone) (Fig. 2 B). While insula neurons showed only a weak (Pearson) correlation (median r ⫽ 0.1), units in the auditory core (median r ⫽ 0.35) and belt regions (median r ⫽ 0.24) showed significantly stronger correlations (Wilcoxon rank-sum tests, core p ⬍ 10 ⫺5, belt p ⬍ 10 ⫺3). The difference between the two auditory cortex regions was just above significance ( p ⫽ 0.058). This suggests that the temporal coding strategies used by these two areas are quite different, a finding that is in good agreement with previous results (Bieser and Mu¨ller-Preuss, 1996; Bieser, 1998). Next, we quantified the frequency selectivity of insula neurons by the bandwidth of their sound frequency tuning curves. As suggested by the example neurons in Figure 2C, insula neurons were less frequency selective than neurons in auditory cortex. Indeed, the median tuning bandwidth for the insula (5.7) was significantly higher than for the auditory core (2.1, Wilcoxon rank-sum test p ⬍ 0.01) or belt (median 4.3, p ⬍ 0.05) and the same result was confirmed when analyzing single units only (all comparisons of insula and auditory cortex p ⬍ 0.05). Hence, insula units are less sharply tuned to sound frequency than neurons found in auditory cortex. The typical response latency in a cortical area can be indicative of its position in its respective processing hierarchy. Given that the insula receives prominent projections from auditory cortex and association areas (Mesulam and Mufson, 1982; Mora´n et al., 1987), one could expect longer latencies. Indeed, the median latency in the insula (65 ms) was significantly longer than in auditory core (40 ms; Kolmogorov–Smirnov test, p ⬍ 10 ⫺4) or belt (45 ms; p ⬍ 10 ⫺3) (Fig. 2 D). Notably, a small proportion of insula neurons responded with rather short latencies (⬍25 ms), possibly reflecting direct thalamic input. In fact, anatomical studies do reveal direct projections from the medial geniculate to the insula (Guldin and Markowitsch, 1984; Mufson and Mesulam, 1984) and those responses with short latencies seem to demonstrate their functional impact on the insula. Finally, we confirmed this characterization of insula neurons using band-passed noise stimuli instead of pure tones and the results fully supported the above findings (data not shown). All in
Remedios et al. • Auditory Representations in the Insula
1038 • J. Neurosci., January 28, 2009 • 29(4):1034 –1045
Population median Insula
30
C Examples - Insula
Auditory cortex
20 10 0 −200
0
200 400 Time [ms]
600
800 1000
20 Spk/sec
Spk/sec - baseline
A
Stimulus
% neurons
cumulative distribution
1
0
0
0.2 0.4 0.6 0.8
Correlation with envelope
0
Insula Auditory core Auditory belt
0
25 50 75 100 125150
Frequency
High
Examples - Auditory cortex
D
B 30
Low
Latency [ms]
Figure 2. Responses to pure tones. A, Population (median) responses to pure tones of different frequencies. The tones were presented as sequences of eight repeats and insula neurons (black) are compared with those recorded in auditory cortex (light gray). B, Histogram of the Pearson correlation coefficient between the neurons’ response and the stimulus envelope. Color coding indicates different regions; insula (black), primary auditory cortex (core regions, light gray) and secondary auditory cortex (belt regions, gray). Insula neurons were less correlated to the stimulus envelope than neurons in the auditory cortex. C, Examples of unit responses recorded in the insula and auditory cortex. The left panels display the mean response time course across all frequencies; the right panels display the frequency tuning curves (mean and SD). D, Cumulative distribution of the response latencies. Most insula neurons respond with longer onset response latencies than auditory cortex neurons, although a small fraction responds with short latencies (⬍25 ms).
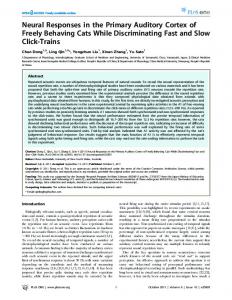
all, these results unequivocally demonstrate that the insula contains a region with neurons responding to simple acoustic stimuli such as tones and band-passed noise. Yet, compared with neurons found in auditory cortex, insula neurons represent the acoustical properties of a sound less faithfully, both in frequency and time domain. Responses to natural sounds To probe the insula’s role in encoding natural sounds and in representing species-specific communication signals, we characterized neuronal responses using stimuli from three categories: conspecific Mvocs, Avoc and Esnd. This diverse set of sounds allowed us to assess the responsiveness to natural sounds in general and allowed us to compare the responses to conspecific vocalizations to the responses to other natural sounds of similar acoustic complexity. Comparable categories of stimuli have been used in previous studies where brain areas specifically responsive to conspecific communication sounds have been described (Belin et al., 2000; Petkov et al., 2008). Figure 3A displays the normalized responses of 155 responsive insula units recorded with natural sounds (74 classified as SUA) together with the responses of 297 neurons from auditory cortex (127 SUA). Overall, insula neurons responded well to the different natural sounds. However, when compared with auditory cortex, they showed a clear distinction: while most auditory cortical neurons responded with maximum firing at stimulus onset, the peak responses of insula neurons could occur at any time during
the stimulus. This heterogeneity of insula responses is also visible in the four example neurons (Fig. 3B; supplemental Fig. 2 A, available at www.jneurosci.org as supplemental material) and confirms to the above finding that the time course of insula responses does not represent the temporal envelope of the stimulus. To account for this response heterogeneity, we analyzed the response strength using windows centered on each neuron’s peak response. To understand how the insular cortex encodes natural sounds we calculated population and life-time selectivity indices. The population selectivity reflects how few of the units participate in the encoding of any particular sound. This index was significantly higher in the insula (median 0.6) than in auditory cortex (0.55, Wilcoxon rank-sum test p ⬍ 10 ⫺4), showing that the population of insula units responds more selectively. Likewise, the life-time selectivity quantifies how selective individual units respond within the set of tested stimuli; again this index was significantly higher in the insula (0.47) than in auditory cortex (0.40, p ⬍ 10 ⫺4). These findings demonstrate that insula neurons are more selective and provide a sparser representation of natural sounds compared with units in early auditory cortices, suggesting that the insula might function as a more specialized and higher-level area. To reveal any sound category preference of insula neurons, we compared the strength of the response to the different groups of sounds. To account for the variable firing rate between individual neurons we used a normalized response amplitude, which was
Remedios et al. • Auditory Representations in the Insula
B Auditory cortex
Mvoc Avoc Esnd
Neurons
40
0
0
50 40
180 150 120 90 60 30 0
30 20
0
500 Time [ms]
0
1000
Population selectivity
500 1000 Time [ms]
Life-time selectivity 0.7
0.7
max
Neurons
50 40 30 20 10
20
10 0
C
0.5 0.6 0.3
min
Esnd
Example insula neurons 80 60
Spk/sec - baseline
Insula
Neurons
Mvoc
A
Avoc
J. Neurosci., January 28, 2009 • 29(4):1034 –1045 • 1039
0
500 1000 Time [ms]
0
500 1000 Time [ms]
0.5
Insula Auditory cortex
0.1
**
**
Figure 3. Responses to natural sounds. A, Average responses to natural sounds. The panels display the normalized responses of individual units (individual lines) in the insula and auditory cortex to the three different sound categories: Mvoc (red), Avoc (green) and Esnd (blue). While auditory cortical units show stereotyped responses to each sound category (initial transient followed by sustained phase), insula responses are more diverse and peak at different times during stimulus presentation. Within each area, the neurons are sorted according to the latency of their peak response in the Mvoc condition. B, Example units from the insula. Typical insula units respond more strongly to conspecific vocalizations than to the other categories (for further examples, see supplemental Fig. 2, available at www.jneurosci.org as supplemental material). C, Response selectivity across the population (Population selectivity) of neurons and of individual neurons (Life-time selectivity). Insula neurons represent sounds more selectively than auditory cortex neurons. Stars indicate significant differences (Wilcoxon test, ** at least p ⬍ 10 ⫺4).
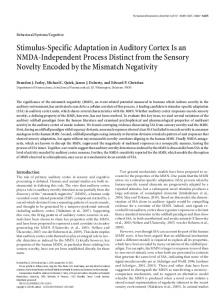
obtained by subtracting the mean response of each neuron from the responses to individual sound categories. Figure 4 A displays the response amplitude for insula and auditory cortex neurons and reveals a clear difference between the response preferences of these areas. An ANOVA with sound categories and cortical region as factors showed neither an overall effect of sound category (F(2,1350) ⫽ 0.37, p ⫽ 0.69) nor an effect of region (due to the normalization of response strength), but a highly significant interaction between factors (F(2,1350) ⫽ 14.4, p ⬍ 10 ⫺6). Post hoc analysis demonstrated that this interaction results from opposite response preferences of insula and auditory cortex: While in auditory cortex the response strength for Mvocs was significantly weaker than the response to Avocs or Esnds (paired t test, p ⬍ 0.01 and p ⬍ 0.001), insula neurons responded stronger to Mvocs than to either Avocs or Esnds ( p ⬍ 0.05 both). This result clearly shows that individual neurons in the insula cortex respond preferentially to conspecific vocalizations compared with a wide variety of other natural sounds. Importantly, for the same set of stimuli no such preference was found for neurons in auditory cortex, evidencing that the dominance of conspecific vocalizations in the insula cannot be explained by basic acoustic properties of the sounds or a general response bias of auditory regions. To support this result by a different analysis, we determined the preferred sound category for each individual unit. In contrast to the average response strength, this analysis is insensitive to the magnitude differences in firing rates and counts the number of units that respond strongest to a particular sound category (Fig. 4 B). In the insular cortex, 64 of the 155 units preferred Mvoc (41%), but only 43 preferred Avoc (28%) and 48 preferred Esnd (31%). In auditory cortex, in contrast, the reverse was observed:
only 25% of the units preferred macaque vocalizations, while 37% preferred other animals’ sounds with 38% for environmental sounds. This resulted in a significant difference between insula and auditory cortex (two-sample 2 test, X ⫽ 16.8, p ⬍ 10 ⫺4) and supports the notion that insula neurons respond preferentially to conspecific vocalizations. We verified that this preference was not the result of the particular choice of window used to compute the response amplitude. Figure 4C displays the preferred sound category derived with windows of different length and in each case the insula units preferring conspecific vocalizations outnumber those preferring other sounds. Responses to acoustically well controlled sounds The above finding that insula neurons preferentially respond to conspecific vocalizations was derived from a comparison of vocalizations with many other natural sounds including the sounds and vocalizations of other animals. While both the environmental and animal sounds were chosen to have roughly similar acoustical properties as the vocalizations, there still remain acoustical features that could systematically differ between sound categories but are impossible to control just by choosing the right set of sounds. As a result, the preference of insula neurons might not be specific to conspecific vocalizations but encompass a much larger class of sounds yet untested. In a second experiment we aimed to overcome this criticism by probing insula neurons with a set of acoustically well controlled sounds. Vocalizations are characterized by specific combinations of spectral and temporal properties that can each contribute to the neuronal selectivity to such sounds (Hauser and Marler, 1993a; Singh and Theunissen, 2003). Figure 5A exemplifies these prop-
Remedios et al. • Auditory Representations in the Insula
1040 • J. Neurosci., January 28, 2009 • 29(4):1034 –1045
Rel. response [Spk]
A
Response amplitude 4 Insula
0 −2 **
*
**
−4
*
Preferred category
B
Insula
40 % neurons
Auditory cortex
2
***
30
30
20
20
10
10
0
C
Mvoc Avoc
% neurons
50
Esnd
Insula
Auditory cortex
40
0
Mvoc
40
30
30
20
20
10
Esnd
Auditory cortex
50
40
Avoc
10 60 80 100 120 140 160 300
Time window around peak [ms]
60
80 100 120 140 160 300
Time window around peak [ms]
Figure 4. Sound category preferences. A, Response amplitude for the different sound categories in insula and auditory cortex. The response strength was computed from a 100 ms window around the peak response and is expressed relative to the mean response for each unit (which was normalized to zero). Bars indicate mean and SEM across units. Asterisks indicate significant differences (paired t tests, *p ⬍ 0.05, **p ⬍ 0.01). B, Preferred sound category of individual units. More than 40% of the units in the insula prefer conspecific vocalizations over the other sounds. In auditory cortex, most units prefer other animal vocalizations or environmental sounds, resulting in a significant difference between areas (two-sample 2 test, ***p ⬍ 10 ⫺4). C, Preferred sound category obtained from the responses computed in different windows centered on the peak response. The overall preference to vocalizations in the insula remains the same regardless of the time window used to define the response. In each panel the left column shows data from the insula, the right column data from auditory cortex.
erties for two typical vocalizations used in the present experiments, a coo and a pant-threat. The coo is a tonal call and characterized by a harmonic frequency pattern whose fundamental frequency changes over time in a particular manner. The acoustics of this call is hence characterized not only by a specific frequency spectrum and temporal envelope, but also by an interaction of spectral and temporal features. The pant-threat, in contrast, is a noisy call that can be characterized by its frequency spectrum and temporal envelope, but which shows little change in its frequency pattern with time. To determine the importance of such spectral, temporal and combined spectro-temporal features to the insula response selectivity we constructed manipulated versions of the vocalizations. These manipulations preserved some feature of the original sound but differed by other features. In detail, for each original vocalization (Mvoc) we obtained one sound preserving the spectrum of the original vocalization but not its temporal envelope (PS), one sound preserving the temporal envelope but not the spectrum (PE), and one sound preserving both features but not their interaction (PSE) (compare Fig. 5A). The latter manipulation results in a sound that shares both spectrum and envelope with the original vocalization but not their interaction. As a result, for tonal calls such as the coo, the resulting PSE sound still differs from the original vocal-
ization as it does not reproduce the upward sweep of the harmonic frequencies in time. For noisy calls such as the threat, in contrast, the PSE manipulation captures most of the acoustical structure of the call. Given these properties of the manipulations, one can predict several possible outcomes when comparing the insula responses to the original vocalizations and the manipulations. If, for example, insula neurons were not responding specifically to conspecific vocalizations but to all sounds sharing a similar frequency composition, one should expect comparable responses to the original sound and the PS manipulation (and similar for the temporal envelope). However, if insula neurons were selective to the full acoustical properties of conspecific vocalizations, one would expect the responses to the original vocalization to differ not only from both the PE and PS sounds but also from the PSE sounds. Especially for tonal calls, for which the PSE manipulation does not capture spectro-temporal interactions, one would expect a difference in response amplitude between the original Mvoc and the PSE. For noisy calls, in contrast, no such response difference might exist, since the PSE manipulation captures most of the acoustics of the vocalization. Using this stimulus set we recorded a novel set of neurons in the insular cortex (n ⫽ 97) and Figure 5B displays the response strength to the different manipulations separated by tonal and noisy calls. For both groups of calls the response to the original vocalization was significantly stronger than the response to the preserved spectrum or envelope sounds (paired t test, Mvoc vs PE: p ⬍ 0.01 for noisy and p ⬍ 10 ⫺3 for tonal calls; Mvoc vs PS: p ⬍ 10 ⫺3 and p ⬍ 0.01). This clearly demonstrates that either of these features by itself is not sufficient to explain the preference of insula neurons to conspecific vocalizations. In addition, for tonal calls the response to the original vocalization was significantly stronger than the response to the preserved spectrum and envelope sound ( p ⬍ 0.01), while no such difference was found for the noisy calls ( p ⫽ 0.7). The example data in Figure 5C further supports this population result. This lets us conclude that insula neurons are indeed selective to the higher order acoustical properties of conspecific vocalizations and prefer these vocalizations not only over many other natural sounds but also over sounds that share some but not all of the acoustical features. Selectivity to individual vocalizations Macaque monkeys produce a complex variety of calls as means of communication with their kin, and behavioral studies provide good evidence that these calls carry referential meaning, and provide clues about the caller’s size, age and social rank (Cheney and Seyfarth, 1990; Hauser, 1998; Gifford et al., 2003). In fact, the vocalizations of rhesus monkeys can be grouped into different call types, each carrying different behavioral meaning (Hauser and Marler, 1993a,b). At some stage during auditory processing one therefore should expect a degree of specialization so as to differentiate between calls and extract these variables. That insula neurons prefer conspecific vocalizations raises the question whether they are also able to differentiate between individual vocalizations or functional categories of these. Previous studies on call selective neurons have defined a neuron’s response selectivity index by counting the number of stimuli eliciting at least half the neuron’s maximal response (Tian et al., 2001; Romanski et al., 2005; Kikuchi et al., 2007). Applying the same criterion, we found a selectivity index of 5.2 ⫾ 0.46 (mean, SEM), indicating that on average ⬃5 of 15 (33%) vocalizations elicited more than half the maximal response. This shows that insula neurons are more selective than neurons in superior
Remedios et al. • Auditory Representations in the Insula
A
Original vocalization
a
0
Preserved envelope (PE)
Coo
Preserved spectrum (PS)
c
2000
Frequency [Hz]
J. Neurosci., January 28, 2009 • 29(4):1034 –1045 • 1041
Original vocalization
b
Preserved envelope (PE)
a Pant-threat
Preserved spectrum (PS)
Preserved spec&env (PSE)
c
d
b
Preserved spec&env (PSE)
d
4000 6000 8000 10000 0
0.1 0.2 Time [s]
B
0.3
Noisy calls
Tonal calls
0.6
[Spk/sec - baseline]
0.4 (ns)
0.2
**
0 -0.2 -0.4
Example data
15 10
*
* Relative response
C
5 0 60 40 20
* Voc
** PE
PS
PSE
Voc
0 PE
PS
PSE
Voc
PE
PS
PSE
Figure 5. Insula responses to acoustical control stimuli. A, Top, The time–frequency representations of two vocalizations (coo and threat). The other panels display the time–frequency representations of the acoustical control stimuli obtained from the spectra and envelopes of these sounds (see Materials and Methods, Acoustical stimuli, for a description). Note that the PSE has the same average spectrum and envelope as the original vocalization but does not preserve their interaction. This is especially visible for the coo. B, Relative response amplitude of insula units to the original vocalizations and the acoustic controlled sounds, shown separately for tonal and noisy calls. Asterisks indicate significant differences (paired t tests, *p ⬍ 0.01,**p ⬍ 0.001). C, Two examples of the response amplitude of insula units to the acoustic control sounds, reflecting the population result of B.
temporal regions, where neurons were found to respond to ⬃50 – 60% of the tested calls (Russ et al., 2008), and are more selective than many neurons in auditory cortices (range of ⬃30 –50%) (Tian et al., 2001; Recanzone, 2008). However, insular neurons responded less selectively than neurons in the auditory region of the ventro-lateral prefrontal cortex (⬃20%) (Romanski et al., 2005). Example data presented in supplemental Figure 2 B, available at www.jneurosci.org as supplemental material, further confirms this notion that insula neurons respond selectively to only few vocalizations. To corroborate and extend this observation we used more sophisticated stimulus decoding and information theoretic analyses. A linear discriminant analysis was used to quantify what fraction of vocalizations could be correctly decoded from the responses of individual neurons (Russ et al., 2008). If insula neurons were to play a role in the representation of conspecific vocalizations, their responses should be selective and reproducible enough to allow the identification of individual vocalizations based on the observation of a single trial response. On average, insula neurons allowed the decoding of ⬃30% of the calls (⬃3.6 calls), confirming that insula neurons respond rather selectively to only a few vocalizations (Fig. 6 A). The decoding performance was best when short time bins were used to sample the response, revealing that the temporal structure of the neurons responses (not just the response magnitude) provides information to dis-
tinguish individual sounds. In this respect, insula neurons resemble those found in auditory cortex (Schnupp et al., 2006; Engineer et al., 2008). Information theoretic analysis further confirmed these results. For each neuron we computed the stimulus specific information (Butts, 2003) provided by the neuron’s response about each of the 12 stimuli. The result was displayed after sorting the stimuli for each neuron by ascending information value and shows that each neuron is highly informative for only a few vocalizations, while the information sharply drops for the others (Fig. 6 B). On average each neuron provides more than half its maximal information rate for only two calls, and similarly at least a quarter of the maximal information to only four calls. The ability to discriminate between individual vocalizations and the finding that individual neurons are informative for less than a handful of vocalizations demonstrates that insula neurons do indeed respond highly selectively toward individual vocalizations. The information theoretic analysis can also be used to assess the response selectivity to conspecific vocalizations compared with other sounds in manner distinct from the analysis of response strength presented above (Fig. 6C). Computing the mutual information (Shannon, 1948) between stimulus set and response revealed that insula neurons conveyed significantly more information about the original vocalization than about any of the acoustical manipulations (paired t test, Mvoc vs PS: p ⬍ 10 ⫺7,
Remedios et al. • Auditory Representations in the Insula
1042 • J. Neurosci., January 28, 2009 • 29(4):1034 –1045
Decoding performance
10 10
20 40 60 80 150 300 bin [ms]
15 10 5
Mutual-information 0.8
0.6
20
0
C
*** Information [bits]
% neurons
20
30
Stimulus specific information
B Information [bits]
% correct
A 25
0.4
0.2
**
*
0.6
0.4
0.2
0 0
0 0
10
20 30 40 50 % decoded correctly
60
Voc
PE
PS
PES
Sorted stimuli
Figure 6. Selectivity of insula neurons to individual vocalizations. A, Results of a decoding analysis showing the percentage of calls correctly decoded from single trial responses. Decoding was most accurate when the response was sampled using short time bins (⬍20 ms). Dotted line indicates chance level. B, Stimulus specific information. For each neuron, we computed the information in its response for each of 12 vocalizations. The bar graph displays the mean (and SEM) information after sorting the vocalizations for each neuron according to their information value. Insula neurons are highly informative to only a few vocalizations. Information values have been corrected for statistical bias using a bootstrapping procedure, and small (negative) fluctuations around zero represent negligible information content. C, Mutual (Shannon) information between stimulus set and response for the original vocalizations and the acoustic controls. Bars indicate the mean and SEM across insula neurons. Asterisks indicate significant differences (paired t tests, *p ⬍ 0.05,**p ⬍ 10 ⫺3, ***p ⬍ 10 ⫺7).
Mvoc vs PE: p ⬍ 10 ⫺4, Mvoc vs PSE: p ⬍ 0.05). Noteworthy, this result was independent of whether the responses were defined using a 100 ms window centered on the peak response, or whether the average response during the entire (300 ms) stimulus presentation was used. Hence insula neurons respond more selectively within the set of original vocalizations than within the sets of different manipulations, showing that these neurons are better suited to discriminate among individual vocalizations than among other sounds with similar acoustical properties. Finally, we asked whether insula neurons show selectivity to call categories. Inspecting the responses of individual example neurons (supplemental Fig. 2 B, available at www.jneurosci.org as supplemental material), however, suggests that this is not the case: Many neurons responded strongly to one but not to other calls from one particular category, but at the same time also responded to one or two calls from a different category. At a quantitative level, the effective vocalizations for each neuron (those breaching 50% of the maximal response across all natural sounds) were distributed across several call categories: on average calls from 2.8 ⫾ 1.3 (mean, SEM) categories were effective in driving the neurons. Given that the overall number of effective vocalizations was low this suggests that each neuron responds to only few vocalizations, but that these belong to different categories. To substantiate this further, we computed the coefficient of variation of the response (CV ⫽ SD divided by the mean) for vocalizations within each category and across categories. Across neurons, the average CV within categories (0.73 ⫾ 0.03) was significantly higher than the variability across categories (0.52 ⫾ 0.02, t test p ⬍ 10 ⫺5), ruling out that insula responses were more similar to calls of the same type than to calls from different categories. All in all this shows that insula neurons respond highly selectively to only few vocalization, but do not represent functional categories of vocalizations that share the same referential meaning.
Discussion An auditory region in the insula Our results reveal that neurons in the caudal insular cortex respond to a wide variety of acoustic stimuli and respond preferentially to conspecific vocalizations. These findings not only extend previous recordings in the insula which relied on simplistic stim-
uli (Pribram et al., 1954; Sudakov et al., 1971; Bieser and Mu¨llerPreuss, 1996; Bieser, 1998) but are also in good agreement with results from human imaging and lesion studies, which implicate the insula in the processing of complex sounds and speech (Augustine, 1985; Bamiou et al., 2003). Given the structural similarity of the insula and auditory pathways across humans and monkeys, our findings have direct implications on the mechanisms operating in the human brain (Hackett et al., 2001; Chiry et al., 2003; Sweet et al., 2005; Ghazanfar, 2008). As a result, our description of neurons sensitive to conspecific vocalizations in the primate insula offers a window into the neural basis of the insula’s role in speech-related processing. We found that insula neurons prefer conspecific vocalizations over a wide range of other natural sounds, including the vocalizations of other animals. This response preference manifests twofold: First, insula neurons responded stronger to conspecific vocalizations than to other natural or acoustically matched sounds. Second, insula neurons showed higher selectivity in the context of vocalizations than in the context of other sounds. In addition, the use of acoustically matched control sounds demonstrated that the insula preference for vocalizations arises from the selectivity to both temporal and spectral features of these sounds. These results provide good evidence that the insula might play a role in the processing and representation of vocal communication sounds. Insula neurons responded highly selectively within the set of vocalizations and their responses allowed the decoding of individual sounds from single-trial responses. This suggests that one role of these neurons could be to detect and identify individual vocalizations, as a basis to use this information for behavioral reactions. Although we cannot provide a direct link between the recorded neurons and the perception or a behavioral reaction of the animal, human studies strongly suggest such a link (Augustine, 1996; Bamiou et al., 2003; Hickok and Poeppel, 2007). In fact, human studies not only show that the insula is activated by different forms of speech (Zatorre et al., 1994; Rumsey et al., 1997; Meyer et al., 2002; Kotz et al., 2003; Brown et al., 2004; Wong et al., 2004; Sander and Scheich, 2005), but evidence from patients also makes the case for a causal role of the insula in phonological processing. Subjects with dyslexia, for example, of-
Remedios et al. • Auditory Representations in the Insula
ten exhibit lower insula activation in different phonological tasks (Paulesu et al., 1996; Cornette et al., 1998), and many individuals with strokes or ischemic infarcts near the insula show deficits in acoustic or language perception (Cancelliere and Kertesz, 1990; Habib et al., 1995). Importantly, in several cases, different degrees of auditory agnosia, the inability to recognize sounds, have been well documented (Hyman and Tranel, 1989; Engelien et al., 1995; Griffiths et al., 1997). Noteworthy, neurons selective to conspecific vocalizations have also been reported at other stages of auditory processing, such as in the ventro-lateral prefrontal cortex (Romanski et al., 2005; Cohen et al., 2007), the superior temporal gyrus (Russ et al., 2008) and in the auditory cortex (Tian et al., 2001; Kikuchi et al., 2007; Recanzone, 2008). This suggests that selectivity to vocalizations is present at multiple stages of acoustic analysis, possibly reflecting the behavioral importance of these sounds. However, in contrast to neurons described in the prefrontal cortex (Gifford et al., 2005), insula neurons did not seem to represent entire functional categories of vocalizations. This observation leads us to conclude that the insula region is functionally (not necessarily anatomically) situated in between higher auditory cortical fields and the association areas in the frontal lobe. Functional interactions with other areas The finding of an acoustically responsive region in the insular cortex is consistent with the anatomical connectivity of this area. The caudal insula receives projections from auditory cortical areas, including primary auditory cortex (Hurst, 1959; Mesulam and Mufson, 1982; Mora´n et al., 1987) as well as direct projections from the auditory thalamus (Guldin and Markowitsch, 1984; Mufson and Mesulam, 1984; Rodgers et al., 2008). While these auditory afferents leave little doubt about insula function related to acoustical stimuli, they give little insight into the specific nature of this function, or how the insula preference for vocalizations arises. It might be that the insula is driven mostly by highly processed information from higher auditory fields, while thalamic afferents serve mainly as modulatory input (Guillery and Sherman, 2002). It might also be that thalamic afferents serve as driving input to the insula as well. Support for the second scenario comes from two observations: First, a subset of units in our recordings responded with latencies shorter than the typical latencies observed in auditory cortex. And second, a recent study in the rat found strong responses in the insula even when an auditory field in these species was lesioned (Rodgers et al., 2008). Although lesioning a single auditory field cannot rule out driving input from auditory cortex in general, it might well be likely that the insula receives dominant and functionally driving (rather than modulating) projections from multiple cortical and subcortical stages of the auditory processing stream. In addition to its auditory connections, the insula also shares projections with other subcortical structures such as the amygdala. The insula receives afferents from nuclei within the basolateral complex of the amygdala and the insula projects to other amygdaloid areas such as the medial and central nuclei (Mufson et al., 1981; Amaral and Price, 1984; Nishijo et al., 1988). Given that the basolateral amygdala is involved in fear conditioning or the emotional labeling of an event (Olsson and Phelps, 2007; Davis et al., 2008), it might well be that the insula’s connectivity with the amygdala serves to associate vocal communication sounds with emotions. Since our results did not reveal a selectivity of insula neurons to categories of vocalizations, it seems unlikely that insula neurons themselves represent the emotional value of a call. However, insula driven activity in the amygdala
J. Neurosci., January 28, 2009 • 29(4):1034 –1045 • 1043
might reflect this emotional component. In addition, the medial nucleus of the amygdaloid complex has been implied in mediating social interactions (Lehman et al., 1980; Stark et al., 1998). Since social interactions in a troop of monkeys are often accompanied by vocal communication (Cheney and Seyfarth, 1990; Hauser, 1998; Gifford et al., 2003), the interconnectivity of insula and amygdaloid regions might serve as a strong link between vocal and emotional behavior. The posterior insula is also connected with the putamen, especially with the dorsal and sensorimotor related part of this structure (Schneider et al., 1993; Chikama et al., 1997). Since the basal ganglia are involved in motor planning and fine tuning, one could envisage a role of auditory feedback about self-vocalization entering a motor loop involved in the production of vocalizations. While such a sensory to motor link remains purely speculative, a direct test of whether insula neurons are involved in the process of active vocalizing could be well possible (Eliades and Wang, 2008). Recent results push speculations about a number of distinct auditory processing pathways, with one of them possibly being dedicated to processing vocal communication sounds (Romanski et al., 1999; Rauschecker and Tian, 2000; Wang, 2000; Hickok and Poeppel, 2007). Since previous studies reported response preferences to conspecific vocalizations in the lateral belt (Tian et al., 2001), temporal-polar region (Petkov et al., 2008), the superior temporal sulcus (Russ et al., 2008), and in ventro-lateral prefrontal cortex (Romanski and Goldman-Rakic, 2002; Romanski et al., 2005; Russ et al., 2008), such a vocalization-related pathway might commence in primary auditory cortex and reach prefrontal cortex via the (anterior) superior temporal gyrus (Wang, 2000). Yet, the insula’s place in the context of such a pathway is still unclear. Since the insula projects to several stages of this proposed vocalization pathway (Markowitsch et al., 1985; Hackett et al., 1998; Smiley et al., 2007) it might well add its highly processed information about vocalizations into this processing stream. For example, the information about individual vocalizations provided by insula could be used in regions near the temporal pole to determine the identity of the animal vocalizing (Petkov et al., 2008) or in regions of the ventrolateral prefrontal cortex to determine the referential meaning of the call (Gifford et al., 2005). Future studies might better elucidate the exact position of the insula within the different auditory processing streams and can build on the present findings to reveal the neuronal basis of speech related disorders induced by lesions of the insula lobe.
References Amaral DG, Price JL (1984) Amygdalo-cortical projections in the monkey (Macaca fascicularis). J Comp Neurol 230:465– 496. Augustine JR (1985) The insular lobe in primates including humans. Neurol Res 7:2–10. Augustine JR (1996) Circuitry and functional aspects of the insular lobe in primates including humans. Brain Res Brain Res Rev 22:229 –244. Averbeck BB, Romanski LM (2006) Probabilistic encoding of vocalizations in macaque ventral lateral prefrontal cortex. J Neurosci 26:11023–11033. Bamiou DE, Musiek FE, Luxon LM (2003) The insula (Island of Reil) and its role in auditory processing. Literature review. Brain Res Brain Res Rev 42:143–154. Belin P, Zatorre RJ, Lafaille P, Ahad P, Pike B (2000) Voice-selective areas in human auditory cortex. Nature 403:309 –312. Bieser A (1998) Processing of twitter-call fundamental frequencies in insula and auditory cortex of squirrel monkeys. Exp Brain Res 122:139 –148. Bieser A, Mu¨ller-Preuss P (1996) Auditory responsive cortex in the squirrel monkey: neural responses to amplitude-modulated sounds. Exp Brain Res 108:273–284. Brown S, Martinez MJ, Hodges DA, Fox PT, Parsons LM (2004) The song system of the human brain. Brain Res Cogn Brain Res 20:363–375.
1044 • J. Neurosci., January 28, 2009 • 29(4):1034 –1045 Butts DA (2003) How much information is associated with a particular stimulus? Network 14:177–187. Cancelliere AE, Kertesz A (1990) Lesion localization in acquired deficits of emotional expression and comprehension. Brain Cogn 13:133–147. Cheney DL, Seyfarth RM (1990) How monkeys see the world. Chicago: University of Chicago. Chikama M, McFarland NR, Amaral DG, Haber SN (1997) Insular cortical projections to functional regions of the striatum correlate with cortical cytoarchitectonic organization in the primate. J Neurosci 17:9686 –9705. Chiry O, Tardif E, Magistretti PJ, Clarke S (2003) Patterns of calciumbinding proteins support parallel and hierarchical organization of human auditory areas. Eur J Neurosci 17:397– 410. Cohen YE, Theunissen F, Russ BE, Gill P (2007) Acoustic features of rhesus vocalizations and their representation in the ventrolateral prefrontal cortex. J Neurophysiol 97:1470 –1484. Cornette L, Dupont P, Spileers W, Sunaert S, Michiels J, Van Hecke P, Mortelmans L, Orban GA (1998) Human cerebral activity evoked by motion reversal and motion onset. A PET study. Brain 121:143–157. Davis M, Antoniadis EA, Amaral DG, Winslow JT (2008) Acoustic startle reflex in rhesus monkeys: a review. Rev Neurosci 19:171–185. Eliades SJ, Wang X (2008) Neural substrates of vocalization feedback monitoring in primate auditory cortex. Nature 453:1102–1106. Engelien A, Silbersweig D, Stern E, Huber W, Do¨ring W, Frith C, Frackowiak RS (1995) The functional anatomy of recovery from auditory agnosia. A PET study of sound categorization in a neurological patient and normal controls. Brain 118:1395–1409. Engineer CT, Perez CA, Chen YH, Carraway RS, Reed AC, Shetake JA, Jakkamsetti V, Chang KQ, Kilgard MP (2008) Cortical activity patterns predict speech discrimination ability. Nat Neurosci 11:603– 608. Fu KM, Shah AS, O’Connell MN, McGinnis T, Eckholdt H, Lakatos P, Smiley J, Schroeder CE (2004) Timing and laminar profile of eye-position effects on auditory responses in primate auditory cortex. J Neurophysiol 92:3522–3531. Ghazanfar AA (2008) Language evolution: neural differences that make a difference. Nat Neurosci 11:382–384. Gifford GW 3rd, Hauser MD, Cohen YE (2003) Discrimination of functionally referential calls by laboratory-housed rhesus macaques: implications for neuroethological studies. Brain Behav Evol 61:213–224. Gifford GW 3rd, MacLean KA, Hauser MD, Cohen YE (2005) The neurophysiology of functionally meaningful categories: macaque ventrolateral prefrontal cortex plays a critical role in spontaneous categorization of species-specific vocalizations. J Cogn Neurosci 17:1471–1482. Griffiths TD, Rees A, Witton C, Cross PM, Shakir RA, Green GG (1997) Spatial and temporal auditory processing deficits following right hemisphere infarction. A psychophysical study. Brain 120:785–794. Guillery RW, Sherman SM (2002) Thalamic relay functions and their role in corticocortical communication: generalizations from the visual system. Neuron 33:163–175. Guldin WO, Markowitsch HJ (1984) Cortical and thalamic afferent connections of the insular and adjacent cortex of the cat. J Comp Neurol 229:393– 418. Habib M, Daquin G, Milandre L, Royere ML, Rey M, Lanteri A, Salamon G, Khalil R (1995) Mutism and auditory agnosia due to bilateral insular damage–role of the insula in human communication. Neuropsychologia 33:327–339. Hackett TA, Stepniewska I, Kaas JH (1998) Subdivisions of auditory cortex and ipsilateral cortical connections of the parabelt auditory cortex in macaque monkeys. J Comp Neurol 394:475– 495. Hackett TA, Preuss TM, Kaas JH (2001) Architectonic identification of the core region in auditory cortex of macaques, chimpanzees, and humans. J Comp Neurol 441:197–222. Hauser Md (1998) Functional referents and acoustic similarity: field playback experiments with rhesus monkeys. Anim Behav 55:1647–1658. Hauser M, Marler P (1993a) Food-associated calls in rhesus macaques (Macaca mulatta): I. Socioecological factors. Behav Ecol 4:194 –205. Hauser M, Marler P (1993b) Food-associated calls in rhesus macaques (Macaca mulatta): II. Costs and benefits of call production and suppression. Behav Ecol 4:206 –212. Herdener M, Lehmann C, Esposito F, Salle di F, Federspiel A, Bach DR, Seifritz E (2008) Brain responses to auditory and visual stimulus offset: shared representations of temporal edges. Hum Brain Mapp, in press.
Remedios et al. • Auditory Representations in the Insula Hickok G, Poeppel D (2007) The cortical organization of speech processing. Nat Rev Neurosci 8:393– 402. Hurst EM (1959) Some cortical association systems related to auditory functions. J Comp Neurol 112:103–119. Hyman BT, Tranel D (1989) Hemianesthesia and aphasia. An anatomical and behavioral study. Arch Neurol 46:816 – 819. Issa EB, Wang X (2007) Neural responses in lateral belt of primate auditory cortex during sleep. Soc Neurosci Abstr 33.505.20. Kayser C, Petkov CI, Logothetis NK (2007) Tuning to sound frequency in auditory field potentials. J Neurophysiol 98:1806 –1809. Kayser C, Petkov CI, Logothetis NK (2008) Visual modulation of neurons in auditory cortex. Cereb Cortex 18:1560 –1574. Kikuchi Y, Horwitz B, Mishkin M (2007) Auditory response properties in the rostral and caudal stations of the auditory stimulus processing stream of the macaque superior temporal cortex. Soc Neurosci Abstr: 33.278.16/EE15. Kosaki H, Hashikawa T, He J, Jones EG (1997) Tonotopic organization of auditory cortical fields delineated by parvalbumin immunoreactivity in macaque monkeys. J Comp Neurol 386:304 –316. Kotz SA, Meyer M, Alter K, Besson M, von Cramon DY, Friederici AD (2003) On the lateralization of emotional prosody: an event-related functional MR investigation. Brain Lang 86:366 –376. Lakatos P, Pincze Z, Fu KM, Javitt DC, Karmos G, Schroeder CE (2005) Timing of pure tone and noise-evoked responses in macaque auditory cortex. Neuroreport 16:933–937. Lehman MN, Winans SS, Powers JB (1980) Medial nucleus of the amygdala mediates chemosensory control of male hamster sexual behavior. Science 210:557–560. Liang L, Lu T, Wang X (2002) Neural representations of sinusoidal amplitude and frequency modulations in the primary auditory cortex of awake primates. J Neurophysiol 87:2237–2261. Logothetis NK, Guggenberger H, Peled S, Pauls J (1999) Functional imaging of the monkey brain. Nat Neurosci 2:555–562. Markowitsch HJ, Emmans D, Irle E, Streicher M, Preilowski B (1985) Cortical and subcortical afferent connections of the primate’s temporal pole: a study of rhesus monkeys, squirrel monkeys, and marmosets. J Comp Neurol 242:425– 458. Merzenich MM, Brugge JF (1973) Representation of the cochlear partition of the superior temporal plane of the macaque monkey. Brain Res 50:275–296. Mesulam MM, Mufson EJ (1982) Insula of the old world monkey. III: Efferent cortical output and comments on function. J Comp Neurol 212:38 –52. Meyer M, Alter K, Friederici AD, Lohmann G, von Cramon DY (2002) FMRI reveals brain regions mediating slow prosodic modulations in spoken sentences. Hum Brain Mapp 17:73– 88. Mora´n MA, Mufson EJ, Mesulam MM (1987) Neural inputs into the temporopolar cortex of the rhesus monkey. J Comp Neurol 256:88 –103. Mufson EJ, Mesulam MM (1984) Thalamic connections of the insula in the rhesus monkey and comments on the paralimbic connectivity of the medial pulvinar nucleus. J Comp Neurol 227:109 –120. Mufson EJ, Mesulam MM, Pandya DN (1981) Insular interconnections with the amygdala in the rhesus monkey. Neuroscience 6:1231–1248. Nishijo H, Ono T, Nishino H (1988) Topographic distribution of modalityspecific amygdalar neurons in alert monkey. J Neurosci 8:3556 –3569. Olsson A, Phelps EA (2007) Social learning of fear. Nat Neurosci 10:1095–1102. Panzeri S, Treves A (1996) Analytical estimates of limited sampling biases in different information measures. Network: Comput Neural Syst 7:87–107. Panzeri S, Senatore R, Montemurro MA, Petersen RS (2007) Correcting for the sampling bias problem in spike train information measures. J Neurophysiol 98:1064 –1072. Paulesu E, Frith U, Snowling M, Gallagher A, Morton J, Frackowiak RS, Frith CD (1996) Is developmental dyslexia a disconnection syndrome? Evidence from PET scanning. Brain 119:143–157. Petkov CI, Kayser C, Steudel T, Whittingstall K, Augath M, Logothetis NK (2008) A voice region in the monkey brain. Nat Neurosci 11:367–374. Pribram KH, Rosner BS, Rosenblith WA (1954) Electrical responses to acoustic clicks in monkey: extent of neocortex activated. J Neurophysiol 17:336 –344. Rauschecker JP, Tian B (2000) Mechanisms and streams for processing of
Remedios et al. • Auditory Representations in the Insula what and where in auditory cortex. Proc Natl Acad Sci U S A 97:11800 –11806. Rauschecker JP, Tian B (2004) Processing of band-passed noise in the lateral auditory belt cortex of the rhesus monkey. J Neurophysiol 91:2578 –2589. Rauschecker JP, Tian B, Hauser M (1995) Processing of complex sounds in the macaque nonprimary auditory cortex. Science 268:111–114. Recanzone GH (2008) Representation of con-specific vocalizations in the core and belt areas of the auditory cortex in the alert macaque monkey. J Neurosci 28:13184 –13193. Recanzone GH, Guard DC, Phan ML (2000) Frequency and intensity response properties of single neurons in the auditory cortex of the behaving macaque monkey. J Neurophysiol 83:2315–2331. Recanzone GH, Schreiner CE, Sutter ML, Beitel RE, Merzenich MM (1999) Functional organization of spectral receptive fields in the primary auditory cortex of the owl monkey. J Comp Neurol 415:460 – 481. Rodgers KM, Benison AM, Klein A, Barth DS (2008) Auditory, somatosensory, and multisensory insular cortex in the rat. Cereb Cortex 18:2941–2951. Romanski LM, Goldman-Rakic PS (2002) An auditory domain in primate prefrontal cortex. Nat Neurosci 5:15–16. Romanski LM, Tian B, Fritz J, Mishkin M, Goldman-Rakic PS, Rauschecker JP (1999) Dual streams of auditory afferents target multiple domains in the primate prefrontal cortex. Nat Neurosci 2:1131–1136. Romanski LM, Averbeck BB, Diltz M (2005) Neural representation of vocalizations in the primate ventrolateral prefrontal cortex. J Neurophysiol 93:734 –747. Rumsey JM, Horwitz B, Donohue BC, Nace K, Maisog JM, Andreason P (1997) Phonological and orthographic components of word recognition. A PET-rCBF study. Brain 120:739 –759. Russ BE, Ackelson AL, Baker AE, Cohen YE (2008) Coding of auditorystimulus identity in the auditory non-spatial processing stream. J Neurophysiol 99:87–95. Sander K, Scheich H (2005) Left auditory cortex and amygdala, but right insula dominance for human laughing and crying. J Cogn Neurosci 17:1519 –1531. Schneider RJ, Friedman DP, Mishkin M (1993) A modality-specific somatosensory area within the insula of the rhesus monkey. Brain Res 621:116 –120. Schnupp JW, Hall TM, Kokelaar RF, Ahmed B (2006) Plasticity of temporal
J. Neurosci., January 28, 2009 • 29(4):1034 –1045 • 1045 pattern codes for vocalization stimuli in primary auditory cortex. J Neurosci 26:4785– 4795. Schroeder CE, Lindsley RW, Specht C, Marcovici A, Smiley JF, Javitt DC (2001) Somatosensory input to auditory association cortex in the macaque monkey. J Neurophysiol 85:1322–1327. Shannon CE (1948) A mathematical theory of communication. The Bell Syst Tech J 27:379 – 423. Singh NC, Theunissen FE (2003) Modulation spectra of natural sounds and ethological theories of auditory processing. J Acoust Soc Am 114:3394 –3411. Smiley JF, Hackett TA, Ulbert I, Karmas G, Lakatos P, Javitt DC, Schroeder CE (2007) Multisensory convergence in auditory cortex, I. Cortical connections of the caudal superior temporal plane in macaque monkeys. J Comp Neurol 502:894 –923. Spreen O, Benton AL, Fincham RW (1965) Auditory Agnosia without Aphasia. Arch Neurol 13:84 –92. Stark CP, Alpern HP, Fuhrer J, Trowbridge MG, Wimbish H, Smock T (1998) The medial amygdaloid nucleus modifies social behavior in male rats. Physiol Behav 63:253–259. Sudakov K, MacLean PD, Reeves A, Marino R (1971) Unit study of exteroceptive inputs to claustrocortex in awake, sitting, squirrel monkey. Brain Res 28:19 –34. Sweet RA, Dorph-Petersen KA, Lewis DA (2005) Mapping auditory core, lateral belt, and parabelt cortices in the human superior temporal gyrus. J Comp Neurol 491:270 –289. Tian B, Reser D, Durham A, Kustov A, Rauschecker JP (2001) Functional specialization in rhesus monkey auditory cortex. Science 292:290 –293. Vinje WE, Gallant JL (2002) Natural stimulation of the nonclassical receptive field increases information transmission efficiency in V1. J Neurosci 22:2904 –2915. Wang X (2000) On cortical coding of vocal communication sounds in primates. Proc Natl Acad Sci U S A 97:11843–11849. Wang X, Kadia SC (2001) Differential representation of species-specific primate vocalizations in the auditory cortices of marmoset and cat. J Neurophysiol 86:2616 –2620. Wong PC, Parsons LM, Martinez M, Diehl RL (2004) The role of the insular cortex in pitch pattern perception: the effect of linguistic contexts. J Neurosci 24:9153–9160. Zatorre RJ, Evans AC, Meyer E (1994) Neural mechanisms underlying melodic perception and memory for pitch. J Neurosci 14:1908 –1919.