AN AUTONOMOUS MONITORING DEVICE FOR PV INSTALLATIONS AND PV CALCULATION VALIDATION J.J. Bloem, W. Zaaiman European Commission, DG Joint Research Centre, Renewable Energies, Ispra, Italy E-mail
[email protected] ,
[email protected]
ABSTRACT Collection of climate and performance data for electrical performance assessment of photovoltaic installations is often difficult and expensive. The device herewith presented is composed of a small PV module with an incorporated four-channel data logger. The electrical power supply is guaranteed by the PV cells and will work under bad weather conditions for about a month. The data collected with these modules will be used for validation of a harmonised building integrated energy PV calculation method. A network of monitoring sites will provide data from European wide climates. Keywords : monitoring, modelling, building integration
1
INTRODUCTION
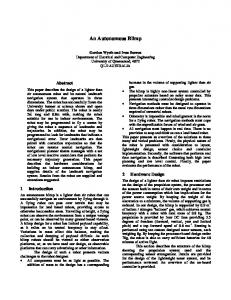
Designers of building integrated applications of PV need to rely on assumptions when energy performance calculations have to be made. In the standard IEC 61215 [1] three reference points are given: the standard test condition (STC) for laboratory measurements at 25°C and 1000 W/m2, 200 W/m2 at 20°C and the nominal operating cell temperature outdoor conditions (NOCT) for free rack mounted and optimised conditions. Data for building integrated applications have to be extrapolated from these standard values or are derived from experimental fitted data (like it is presented in the Dutch standard NEN5128).
Temperature Difference [°C]
Building Integrated PV applications
NOCT
Irradiance [W/m2] 0
100
200
300
400
500
600
700
800
STC 900
1000
Figure 1. Building integrated PV applications in reference to STC and NOTC standard conditions The calculation method as presented in the ESRA [2] calculates the yearly potential electricity generation E [kWh] of a PV system for a given inclination and orientation using a formula: E = 365 Pk rp Hh,I where Pk (kW) is the peak power installed, rp is the fitted system performance ratio (typical value for roof mounted system with modules from mono- or polycrystalline silicon is 0.75) and Hh,i is the monthly or yearly average of daily global irradiation on the horizontal or inclined surface. This method does not take into account an ambient temperature or convection loss adjustment. A much more accurate energy calculation for monthly or shorter periods will have to include temperature and convection loss data. A specific experimental set-up has been designed to collect data from different climatic
conditions to provide the necessary input for a more correct calculation method. Two PV modules will be used: one in free rack mounted condition, the other in worst boundary conditions. 2
APPROACH
A specific monitoring device has been designed based on the most applied PV technology, being poly-crystalline Silicon in a glass-tedlar composition. T contains 9 PV cells in three rows of three cells. In the ESTI laboratory the prototype devices are calibrated. A special design has been made for a four-channel mini data logger that should fit in a standard connector housing for PV devices. Data will be collected in a pre-conditioned way that will result in 5 minutely interval averaged and stored data. In order to obtain reliable data for the validation process of the calculation method, partners have been contacted from research laboratories situated in different climates in Europe. Slightly bigger than the well-known ESTI Sensor, the device will provide more and reliable data for various applications. Measured data are: • The short circuit current of the central PV cell by means of a shunt, that provides a signal proportional to the incoming solar radiation • The open circuit voltage of eight PV cells situated around the central PV cell and connected in serie • The temperature difference between PV substrate and ambient air • The ambient air temperature The device is powered by the eight PV cells by means of trickle charging of a battery. The electronics for the data logger is based on the latest miniature technology. It requires little intervention from the user and no maintenance. The device can be installed in almost every position including building integrated applications. The device can be connected to common data acquisition systems also. Data will be collected at 1-minute interval to provide the highest accuracy for detailed analysis of the electrical and thermal processes. The autonomous working device stores the averaged data with an interval
of 5 minutes. Whenever the Voc of the 8 PVcells falls 6 4 -5