36
Int. J. Information and Decision Sciences, Vol. 5, No. 1, 2013
An empirical study of the recursive input generation algorithm for memory-based collaborative filtering recommender systems Serhiy Morozov Mathematics, Computer Science, and Software Engineering, University of Detroit Mercy, Detroit, MI 48221-3038, USA E-mail:
[email protected]
Hossein Saiedian* Electrical Engineering and Computer Science, The University of Kansas, Lawrence, KS 66045, USA Fax: 913-897-8682 E-mail:
[email protected] *Corresponding author Abstract: Recommender system research has gained popularity recently because many businesses are willing to pay for a way to predict future user opinions. Such knowledge could simplify decision-making, improve customer satisfaction, and increase sales. We focus on the recommendation accuracy of memory-based collaborative filtering recommender systems and propose a novel input generation algorithm that helps identify a small group of relevant ratings. Any combination algorithm can be used to generate a recommendation from such ratings. We attempt to improve the quality of these ratings through recursive sorting. Finally, we demonstrate the effectiveness of our approach on the Netflix dataset, a popular, large, and extremely sparse collection of movie ratings. Keywords: recommender systems; recommendation behaviour prediction; input generation algorithm.
accuracy;
future
Reference to this paper should be made as follows: Morozov, S. and Saiedian, H. (2013) ‘An empirical study of the recursive input generation algorithm for memory-based collaborative filtering recommender systems’, Int. J. Information and Decision Sciences, Vol. 5, No. 1, pp.36–49. Biographical notes: Serhiy Morozov is currently an Assistant Professor at the Department of Mathematics, Computer Science, and Software Engineering at the University of Detroit Mercy. He teaches undergraduate and graduate courses in software engineering and serves on the software engineering accreditation committee. He is currently involved in the recommender systems research, but his other interest include data mining, knowledge discovery, machine learning, and web security/privacy. Prior to his academic career, he worked as a Web Developer for over five years. He received his BA from the Westminster College in 2005, MS from the University of Kansas in 2007, and PhD from the University of Kansas in 2011.
Copyright © 2013 Inderscience Enterprises Ltd.
An empirical study of the recursive input generation algorithm
37
Hossein Saiedian is currently a professor of Software Engineering in the Department of Electrical Engineering and Computer Science at the University of Kansas. His primary area of research is software engineering and in particular software architecture and models for quality software development, both technical and managerial ones. He has also been investigating security issues and in particular secure software engineering. He has over 150 publications in a variety of topics in software engineering, computer science, and information security. His research in past have been supported by NSF as well as regional organisations. He is a senior member of IEEE.
1
Introduction
The increasing popularity and growth of the World Wide Web provide the two things that make recommender systems necessary: a large catalogue of content and a community of users willing to share their opinions. Recommender systems are particularly useful for e-commerce applications, where customers benefit from personal shopping assistance and stores increase sales. Therefore, now is the time to research recommender systems. The information they require is widely available and there is a great need for their services. Collaborative filtering recommenders suggest items that similar users enjoyed because people who agreed in the past are likely to agree in the future. This approach can recommend new and interesting items that content-based systems fail to recognise due to their over-specialisation tendency. In fact, item content is completely irrelevant, because collaborative filtering recommendations are based exclusively on user opinions. We focus on this approach because it applies to a wide variety of domains. One type of collaborative filtering system, called the memory-based approach, works directly with the dataset, inspecting it before each recommendation. We choose to research memory-based recommenders because they offer superior accuracy to probabilistic and associative rule models (Breese et al., 1998; Sarwar et al., 2001; Canny, 2002). These models are too general to make personalised recommendations, whereas memory-based methods are simple, accurate, and use new data immediately. However, because calculations are done on-demand, memory-based approaches are notoriously slow when applied to large datasets (Herlocker et al., 1999; Deshpande and Karypis, 2004). Therefore, we focus our efforts on improving recommendation accuracy, not performance.
2
Source of the experimental data
We evaluate the fitness of our recommender prototype on a recent and widely published dataset provided by Netflix. In fact, task 1 of the leading data mining and knowledge discovery competition in the world, is based on this dataset (Bennett et al., 2007). One of the most obvious reasons for such popularity is the dataset size. It contains over 100,000,000 actual movie ratings on a discreet scale from one to five. It represents opinions of over 480,000 users and almost 18,000 movies (Bennett et al., 2007). This
38
S. Morozov and H. Saiedian
dataset is more than 30 times larger than any other available dataset. However, it represents only 1.1% of all possible ratings (Bennett et al., 2007), so approaches that rely on a higher data density may not apply. Accurate memory-based recommendation are particularly difficult on sparse datasets, so we choose to use this challenging dataset to evaluate our system. The structure of our dataset is fairly standard. Figure 1 shows how the information about every movie is available in a single file. The ratings are grouped by movie and stored in separate files. The dataset contains a list of 2,800,000 withheld ratings (qualifying/test set). Netflix evaluates the estimates of these opinions. The dataset also contains 1,400,000 known ratings (probe/quiz set) intended for local evaluation. We use the quiz set for our empirical study. Figure 1
Netflix dataset structure
movie_titles.txt movie_id movie_year movie_title
3
mv_*.txt movie_id user_id rating date
probe.txt movie_id user_id date
Research hypothesis
Recent studies show that it is increasingly difficult to make substantial progress in prediction accuracy. For instance, a 1% improvement on the Netflix prize challenge took nearly two years (Bennett and Stan, 2007). We believe it is because most effort has been directed toward optimising algorithms instead of improving their input data. One of the most common ways to do so is to supplement the dataset (Herlocker et al., 2004). However, users are usually hesitant to provide additional ratings, third party data might not be available, and implicit rating analysis is unreliable (Middleton, 2003; Bell and Koren, 2007a). Accordingly, we do not add more data, but remove data we know is irrelevant. The main contribution of our work is an algorithm that identifies a set of ratings most relevant to a particular recommendation. Even though it is difficult to make accurate assumptions from little evidence, we believe that better input selection can lead to more accurate recommendations, regardless of the combination algorithm.
3.1 Conceptual model of a recommender system The goal of a recommender system is to learn user preferences from the past and apply this knowledge to predict the future. Figure 2 demonstrates the input and output of a typical collaborative filtering recommender system. It trains on a set of known ratings and produces predictions for a set of unknown ones. At this level, the exact calculations inside a recommender system are irrelevant, as long as it produces suggestions in the desired format. Our system represents movies with item ids and ignores the rest of the movie attributes.
An empirical study of the recursive input generation algorithm Figure 2
39
Typical recommender system input/output
dataset
predictions
item_id user_id rating
item_id user_id
predictions item_id user_id rating
Recommender System
More formally, the recommender system may be described as a set of m users U = {u1, u2,…,um} and a set of n items I = {i1, i2,…,in}. Each user u has an associated set of items Iu ⊆ I, which he/she has rated. Each rating r is assumed to be on a discrete numerical scale, even though continuous rating scales are also common (Nathanson et al., 2007). The user and item for which the prediction is to be made are called active user and active item (Sarwar et al., 2001; Candillier et al., 2007). A recommender system guesses the opinion of user u on item i, Pu,i. Usually, production systems predict opinions that have not been previously recorded, Pu,i | i ∉ Iu. Development systems guess a set of known ratings, so that the error of each prediction may be computed, Pu,i – ru,i.
3.2 Evaluation metrics and accuracy goals A popular way to evaluate the quality of a recommender system is to quantitatively measure its accuracy. One such measure is the root mean squared error (RMSE). It is the square root of the average of squared deviations (Sarwar et al., 2001; Candillier et al., 2007):
RMSE =
∑
( Pu ,i − ru ,i )
u∈U ,i∈I
|P|
2
.
The RMSE metric uses the same units as data, i.e., it represents the size of a typical error. However, it does not have an absolute value that is considered satisfactory. Instead, recommender systems are ranked according to their typical error size within a dataset. The RMSE metric is most appropriate for our research. The creators of the Netflix dataset deem large errors to be particularly undesirable, i.e., the cost of an error is greater than its size. Because the RMSE measure squares each deviation, larger errors influence it more than smaller ones. Furthermore, because it is impossible to compare accuracy on different rating scales, recommendations on the same dataset usually use the same metric.
40
S. Morozov and H. Saiedian
Finally, our dataset has a published list of 130,000 RMSE scores on the quiz dataset (Bennett and Stan, 2007), so we use RMSE to evaluate our prototype. To set our accuracy goals and establish a point of reference for our experiments, we examine some of the well-known results from the Netflix leader board website, http://www.netflixprize.com. It lists the typical prediction errors of many trivial recommendation approaches that suggest the same rating for every item. For instance, recommending a four star rating for each movie is the most accurate option because each recommendation is close to the overall average rating of 3.6 stars. Likewise, recommending 3.6 stars for each movie produces a smaller error of 1.1287. This value may be reduced further by recommending the user or movie average. This results in a typical error of 1.0651 for average user and 1.0533 for average movie approach. In general, any recommender that is consistently off by one or more units is considered inferior. These figures establish the lowest accuracy threshold below which the recommendations are no longer useful. However, the highest accuracy threshold is still largely unknown. Thousands of contestants spent years trying to reduce a typical error of their recommender on the Netflix dataset. On July 26th, 2009 a team named ‘BellKor’s Pragmatic Chaos’ reached a previously impossible RMSE value of 0.8567. The authors of the winning algorithm published three papers detailing their approach (Koren, 2009; Töscher et al., 2009; Piotte and Chabbert, 2009). Their work has motivated our research by showing that a significant improvement in recommendation accuracy is possible on large and sparse datasets. We believe that recommendation accuracy can be improved even further. In fact, we try to get closer to the lowest possible error, dictated by unpredictable human nature.
3.3 Relevance of input generation algorithms Collaborative filtering systems produce recommendations from a subset of all users, called neighbours, which are similar to the active user. Some versions of this approach view a dataset as a collection of user vectors with a specific number of dimensions, corresponding to items they rated (Sarwar et al., 2000a; Herlocker et al., 1999; Wang et al., 2006). However, item vectors are also possible (Linden et al., 2003; Deshpande and Karypis, 2004; Miller, 2003). In fact, item-based approach produces better results (Sarwar et al., 2001, 2000b; Linden et al., 2003; Huang et al., 2004; Shardanand and Maes, 1995) because item vectors usually contain more ratings and therefore better capture the opinions of a neighbourhood. We model recommender input as a matrix where items are rows and users are columns. Each cell contains a rating that is associated with a single user and an item. A transposed matrix would represent users as rows and items as columns, thus allowing the same input to be used by different algorithms. Figure 3 shows our prototype data flow. The input generation component locates all relevant ratings and chooses the best ones for the input matrix. The matrix is fed into a combination algorithm that, as the name implies, combines ratings to produce a recommendation. A number of successful combination algorithms exist. We implement a few popular ones, however the main focus of our research is on the input generation component.
An empirical study of the recursive input generation algorithm Figure 3
41
Proposed system data flow Original Dataset
Relevant Dataset
Input Matrix
3344 424 35 345 3454 4443 44 5 44 5554 534 5 5545555 33 442433 54 2343 45243454 4344 44 353445333 333 343552 4555 5555 55 54 45455 355 4555 55 5555 554555 554 555 3454 55 5 35 555 3544 44 345 45 44543 423 44 4544445 3445 442 53 44343 3543 44 54 45 543 45 444434 44455 444534 5 545 5553 445345 455 5554 455 55 4454445455 3553555 45 4 45 5555 555554 4444555 3354344 445 334 3 43344334545 45555 55 54454445 454 55 55 4455435435344543431 334234445 33 343 33 434542444234533343 4455 55 45 44 354 5453 3344455
534444243353452 445 54 4 55 555 335 4 43 54 43 3434 43 3 33 4555 555 44545 555 5 5 555 5 34 54 455 5
55554544445 5 54 4555 5 55 4 44 44 45 544 435 4 4 55 4
Rating Combination
Input Matrix Generation recommendation
To generate an input matrix, we first identify all relevant ratings on items rated by the active user and by users who have rated the active item. For example, if making an input matrix for Alice on Titanic, we consider all movies Alice rated and all users who rated Titanic. This data access task is time-consuming because a large portion of the dataset may be relevant. However, the relevant dataset may contain opinions that are not as valuable as others. Therefore, the input matrix generation algorithm chooses only the most valuable ratings and places them into the input matrix. In general, a recommender system considers ratings from similar vectors to be more valuable. To quantify the similarity between any two vectors, it must first identify common dimensions, i.e., vote overlap. Then we can measure the similarity between the two sets of ratings. One popular measure that works well in sparse datasets is cosine similarity. It compares two users by taking a cosine of the angle between their rating vectors (Sarwar et al., 2000a; Zhang et al., 2002; Miller et al., 2004). Cosine similarity is accurate because it considers the difference between ratings to be more important than their quantity (Candillier et al., 2007; Sarwar et al., 2001). The formula below shows a cosine similarity as the sum of products of commonly rated items divided by the product of vector lengths:
∑
sim(a, u ) =
ra ,i ru ,i
i∈I a ∩ Iu
∑
i∈I a ∩ I u
ra2,i
∑
ru2,i
.
i∈I a ∩ I u
The cosine similarity measure has been widely used in information retrieval research. However, it does not consider users’ rating scales. For instance, a three star rating could mean ‘average’ to one person and ‘good’ to another. The cosine similarity uses actual ratings, so unless two users have the same rating scales, their similarity is lost. Alternatively, linear regression approximations can recognise similarity in such situations (Herlocker et al., 1999; Bell and Koren, 2007b). For example, Pearson’s correlation measures linear dependence between two user vectors:
42
S. Morozov and H. Saiedian
∑
sim(a, u ) =
( ra,i − ra )( ru ,i − ru )
i∈I a ∩ Iu
∑
∑
( ra,i − ra )2
i∈I a ∩ I u
( ru ,i − ru )2
.
i∈I a ∩ I u
This measure is similar to cosine similarity, except individual ratings are normalised by the vector average. This adjustment improves accuracy of even the most basic recommenders. In fact, it is most effective in sparse datasets, where linear regression is more easily established (Sarwar et al., 2001; Bennett et al., 2007). We examine the effects of both similarity measures in our empirical study.
Data Access
Matrix generation steps
Data Processing
Figure 4
Load Relevant Users
Load Relevant Items
Identify all users who rated the active item
Identify all items rated by the active user
Load Relevant Ratings Identify all ratings by any relevant user on any relevant item
Compute User Similarity
Compute Item Similarity
Apply the similarity metric to the active user vector and every neighboring vector
Apply the similarity metric to the active item vector and every neighboring vector
Truncate Users
Truncate Items
Delete all but 30 of the most similar users
Delete all but 30 of the most similar items
Populate Matrix Load all ratings by top 30 users on top 30 items
An empirical study of the recursive input generation algorithm
4
43
Standard input generation process
Because our dataset contains millions of records, combining all relevant ratings is not feasible. Instead, we make recommendations from a subset of the most relevant ratings. Figure 4 shows how we identify the users and items that comprise an input matrix. This process consists of a series of simple operations, many of which could be executed in parallel to increase performance. However, there are two synchronisation points in this workflow when only one operation is running. Therefore, we break it down in two steps at the synchronisation boundary. This division is not necessary in a production system, but it helps us separate a strictly data access task from a strictly data processing task. The standard process constructs an input matrix by first creating a larger one and then reducing its size. We start with a single cell matrix for the active user and item. Figure 5 shows the initial state of an input matrix. In this case, we are going to predict a rating by user U1 on item I1. This step is necessary because we want to make sure that the active user and item vectors are in the matrix regardless of whether we know the active rating. If the active rating is unknown, the two vectors would be an exception to the following step. Figure 5
Input matrix generation – initial state
Items
Users U1 I1
The second step populates the matrix with all relevant user and item vectors as well as any ratings they have. At this point, columns are all users who rated the active item and rows are every item that the active user rated. Figure 6 shows the populated matrix. In this case, the active user has rated five items, and five users, including the active user, rated the active item. Note that the first row and the first column of the input matrix always have values, with the exception of the rating we are trying to predict. This step concludes the data access task of the input generation algorithm. Figure 6
Input matrix generation – load users and items Users U1 U2 U3 U4 U5
Items
I1 I2
3
I3
1
I4
4
I5
4
1
2
2
4
3
4
3
2
2
4
2
3 3
3
5
The data processing task sorts columns and rows, while preserving rating association. More similar vectors are positioned closer to the active vector. Figure 7 shows the matrix after the third step of our process. The sorting order does not make a difference and performing it in parallel or in series will produce the same result. Finally, we remove the
44
S. Morozov and H. Saiedian
least similar rows and columns. Figure 8 shows the final truncated matrix, where we keep the top three vectors. Since all neighbours are organised in order of decreasing similarity from the active vector, truncating the matrix deletes only the least relevant data. As a result, the finished matrix contains more relevant ratings. Figure 7
Input matrix generation – sort vectors, (a) sorting by items/rows (b) sorting by users/columns Users U1 U2 U3 U4 U5 1
I3
1
I4
4
I5
4
I2
3
2
2
3
I1
3
2
2
I3
1
2
4
2
I4
4
4
3
4
Items
Items
I1
Users U1 U4 U2 U3 U5 2
3
5
I5
4
5
3
4
I2
3
4
(a) Figure 8
1
2
3
3
2
3
2 3
4
3
(b)
Input matrix generation – truncate matrix
Items
Users U1 U4 U2 I1
2
I3
1
2
I4
4
4
U3 U5
1
3
2
3
3
2 2
I5
4
5
I2
3
4
3 4
3
Our standard input generation approach consists of a single pass through the data access and data processing tasks. It is similar to other methods of selecting input with one notable exception, bidirectional truncation. Other approaches compute vector similarity and truncate the matrix across only one dimension, i.e., either users or items (Mobasher et al., 2000; Good et al., 1999; Bell et al., 2007). We truncate both dimensions because it produces a more balanced input that may be used by any combination algorithm.
5
Recursive input generation process
Our recursive approach adds an additional pass through the data processing task, which ensures that each neighbour is among the best available vectors according to the best dimensions. It resorts the matrix according to the top items and users established during
An empirical study of the recursive input generation algorithm
45
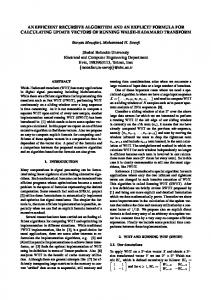
the first pass. Instead of truncating all but the most similar vectors, we re-evaluate the vector similarities, but only across the most relevant dimensions. The selected vectors do not necessarily agree in every shared dimension, but they are the most similar vectors in the entire dataset according to the dimensions in the input matrix. To guarantee that the input is generated properly, we establish the correct order of matrix states in Figure 9. It relates the three main states of a matrix as we refine the ratings within it. The initial matrix contains all relevant ratings, which are only sorted if the matrix is large enough. If the matrix is small, sorting accomplishes nothing because no data is removed. If the matrix is large, sorting establishes vector relevance, so the least valuable data may be discarded. If one of the matrix dimensions is small enough, resorting the matrix does not affect the result because rearranging vector dimensions does not change vector similarities. In either case, the matrix is truncated to a uniform size as the last step of the input generation process. Figure 9
Matrix state changes during the input generation process init_matrix
no sort #users 30
sort_matrix
resort #users > 30 AND #items > 30
done sorting users' != users OR items' != items
truncate_matrix
truncated #users