Received November 18, 2016, accepted December 29, 2016, date of publication January 5, 2017, date of current version March 6, 2017. Digital Object Identifier 10.1109/ACCESS.2017.2648884
An Empirical Study on the Temporal Structural Characteristics of VANETs on a Taxi GPS Dataset LIQIANG QIAO1 , YAN SHI1 , AND SHANZHI CHEN2 , (Senior Member, IEEE)
1 State 2 State
Key Laboratory of Networking and Switching Technology, Beijing University of Posts and Telecommunications, Beijing 100876, China Key Laboratory of Wireless Mobile Communications, China Academy of Telecommunications Technology, Beijing 100083, China
Corresponding author: Y. Shi (
[email protected]) This work was supported in part by the National Natural Science Foundation Projects under Grant 61300183 and Grant 61271185 and in part by the National Science Fund for Distinguished Young Scholars in China under Grant 61425012.
ABSTRACT In recent years, vehicular ad hoc networks (VANETs) have received significant interests from both academia and industry because of the ubiquitous communication capabilities they provide. VANETs are expected to support a wide range of applications that may influence our daily life, ranging from road safety applications to entertainment ones. A key to the development of protocols and algorithms for intervehicle communication and services lies in the knowledge of the structural properties of the VANET communication graph. Nonetheless, previous researches represented the VANET communication graph as a set of snapshots and tracked the evolution of some metrics on snapshots at certain time intervals. They neglected to take into account the temporal property of VANETs, which in many real scenarios plays a pivotal role. In this paper, we mainly explore the temporal structural characteristics of VANETs. A time-extended model is first presented to capture the temporal property of VANETs. Based on the model, some key metrics are defined to describe the structural characteristics of VANETs in various aspects. We then employ a real and large-scale urban taxi GPS dataset to provide a comprehensive study of the temporal structural characteristics involved with time-ordered paths, reachability, and connectivity of VANETs. These results are helpful in designing better protocols and algorithms to achieve reliable and low-latency communications. INDEX TERMS Temporal structure, time-ordered path, reachability, VANETs.
I. INTRODUCTION
In the past decade, Vehicular Ad Hoc Networks (VANETs) which are noteworthy variants of Mobile Ad Hoc Networks, have been proposed to improve road safety and to provide travellers enjoyable experience. VANET is a hybrid wireless network that supports both infrastructure-based and ad hoc communications. Specifically, vehicles on the road can communicate with each other through a multi-hop ad hoc connection. They can also access the Internet and other broadband services through the roadside infrastructure, i.e. base station (BSs) or access points (APs) along the road. VANETs can also support a large plethora of applications including safety traffic application (e.g., collision avoidance, road obstacle warning, safety message disseminations, etc.), traffic information and infotainment services (e.g., games, multimedia streaming, etc.) [1]–[4]. The high socio-economic value of vehicular applications pushed standardization bodies, car manufacturers, universities and research centers to develop technical specifications to be adopted by vehicle industry, such as WiFi, 802.11p and LTE-V [5].
722
Despite of their applicability, VANETs face a number of technical challenges that must be overcome to make these networks widely considered. The highly dynamic network topology is one of these challenges and arises from the high mobility and speed of vehicles. This also led to short contact durations. Lacking of an end-to-end path between the source and destination nodes results in a small effective network diameter. VANETs are also characterized by intermittent connectivity and significant loss rates. Such characteristics are a consequence of limited transmission range, radio obstacles and interference. However, how to select appropriate protocols and algorithms for intervehicle communication and services will be strongly influenced by the characteristics of VANETs. Consequently, exploring the structural characteristics of VANET communication graph has become an open issue and vital work in the era of rapid development of ITS. Recently, several works have analyzed the structural characteristics of VANETs in various aspects [6]–[10]. Some of them [6], [7] are mobility model-based technique for analyzing network connectivity for VANETs. To describe
2169-3536 2017 IEEE. Translations and content mining are permitted for academic research only. Personal use is also permitted, but republication/redistribution requires IEEE permission. See http://www.ieee.org/publications_standards/publications/rights/index.html for more information.
VOLUME 5, 2017
L. Qiao et al.: An Empirical Study on the Temporal Structural Characteristics of VANETs on a Taxi GPS Dataset
the mobility characteristics, a numerous of measures are proposed in [8]–[10], such as clustering coefficient, contact duration and inter-contact time. With the concept of network technology, researchers can also analyze the structural characteristics of VANETs from network perspective. The empirical studies [11]–[14] have investigated the instantaneous network topology evolution of a large-scale urban vehicular network by using realistic mobility traces generated using real-world road topology. Due to the lack of real-world vehicular mobility data sets, however, these studies are conducted based on synthetic vehicular data sets, which are far from a real-world situation and cannot reflect the real vehicular behaviors in urban scenarios, leading to potentially inaccurate analysis. Despite the significant efforts made in studying the instantaneous topology characteristics of vehicular networks, there is no equivalent investigation on the temporal structural characteristics of the VANETs. Moreover, previous research has often neglected to take into account their temporal properties, which in turn results in overestimating the characteristics of VANETs. In this paper, we employ the real-world mobility traces from about 3000 taxis recorded from 12:00 am to 11:59 pm on Jan. 05, 2009 in Beijing, China, for temporal structural characteristics analysis. We present a time-extended model that capture the temporal property of VANETs and some key metrics to analyze the structure of VANETs. Compared with the studies based on synthetic traces or analytical tools, this brings great advantages because the large-scale real-world vehicular motions recorded in these traces can reflect the real situations in large-scale urban environment to a greater degree. By exploring the temporal complex metrics of VANETs, we can better understand the temporal structural characteristics of VANETs. This, in turn, will enable us to design better protocols and algorithms to achieve reliable and low-latency communications. The rest of the paper is organized as follows: Section II reviews related work regarding the structural characteristics of VANETs. The real vehicle mobility traces are introduced in Section III. In section IV, the temporal network model of VANETs and some key metrics are given. The temporal structural characteristics of VANETs will be discussed in detail in Section V. The last section is for a brief summary. II. RELATED WORK
Our work draws inspiration from the rich body of prior work on frameworks for studying the temporal evolution of several graphs. These graphs arise in a wide range of domains (i.e. online social networks, citations, e-mail networks). Understanding the structure and properties of such networks is not an easy and simple task as they are formed of a large number of nodes. Moreover, these networks are dynamically evolving in time which makes their analysis even harder. VANETs are deployed over a lager set of highly dynamic nodes. Mobility is the distinguishing feature of VANETs, affecting the temporal and spatial evolution of network topology in a unique way. VOLUME 5, 2017
Due to the rapid change of networkąŕs topology and the road situations in VANETs, many studies focused on analyzing network connectivity patterns in VANETs [15]–[19]. With exponentially distributed intervehicle distances, Yousefi et al. [15] and Chandrasekharamenon and AnchareV [16] used a queuing theoretic approach for the connectivity analysis. Ng et al. [17] developed an analytical model to fully characterize the access probability and connectivity probability performance in a vehicular relay network. Hammouda et al. [18] analyzed the mobility models impact on the topological characteristics of VANETs by using different connectivity metrics such as lobby index, betweenness centrality, and local clustering coefficient. Hou et al. [19] provided a mathematical model to describe how the network mobility impacts on the connectivity in large-scale urban scenarios. Although these theoretical analysis are useful to understand the structural characteristics of VANETs, the main limitation of these works is that their models rely on strong assumptions, which are not consistent with real case. Other works have analyzed vehicle mobility characteristics using realistic vehicular traces [20]–[23]. Bazzani et al. [20] analyzed a large GPS data base for singe vehicle mobility in the Florence urban area, obtaining statistical distributions of the path lengths of individual trajectories, of the activity downtime and the distribution of monthly activity degree. Liang et al. [21] suggested the taxis’ traveling displacements in urban areas tend to follow an exponential distribution instead of a power-law. Similarly, the elapsed time can also be well approximated by an exponential distribution. Feng and Xu [22] analyzed the evolution of the VANETs connectivity based on the realistic data collected by the GPS devices installed on taxis in Shanghai. Chen et al. [23] explored the features of connected components for vehicular network based on two real taxi GPS traces. The analysis results revealed that the whole topology of VANETs consists of a large number of small-sized connected components. They found that the biggest connected component of VANETs is relatively stable even though each individual vehicle keeps moving. However, these artificial vehicular traces are still generated by mathematical models and cannot accurately represent real-world vehicular mobility traces. In recent years, complex network and network science related concepts are widely adopted in many research domains. Complex network theory is an effective method to study the structure and evolution of large-scale networks. Some works have investigated different properties of the VANETs from a complex network point of view [8], [13], [24], [25]. Reference [8] presented an in-depth analysis of the topological properties of a vehicular network, unveiling the physical reasons behind the peculiar connectivity dynamics generated by a number of mobility model. Marco et al. [13] employed high-resolution real-world traffic counts to generate synthetic trace and carried out a comprehensive topological analysis on the mobility traces. They highlighted the significant variability of the vehicular connectivity over time and space, and its invariant correlation with the 723
L. Qiao et al.: An Empirical Study on the Temporal Structural Characteristics of VANETs on a Taxi GPS Dataset
vehicular density. The objective of [24] focused on providing a thorough study of the topological characteristics and statistical features of a VANET communication graph. Specifically, answers are provided for some critical questions such as the following: How do VANET graph evolve over time and space? What is the spatial distribution of these nodes? Which are the critical link duration statistics in a VANET when the vehicles move in urban areas? How robust is a VANET? The obtained results could have a wide range of implications for the development of high-performance, reliable, scalable, secure, and privacy-preserving vehicular technologies. Glacet et al. [25] provided a first comprehensive analysis of the temporal connectivity of vehicular networks. They showed that store-carry-and-forward improves significantly the instantaneous connectivity attained through simple connected forwarding. However, most of the studies mentioned above represent the VANET communication graph as a series of instant graph. They can only obtain the instantaneous network topology and some standard network theory measures. To the best of our knowledge, no study has yet considered the temporal property of VANETs. Thus, in the following sections, we will employ a time-extended model to represent the VANET and some key metrics to analyze the temporal structural characteristics of VANETs. III. VEHICULAR MOBILITY DATASET
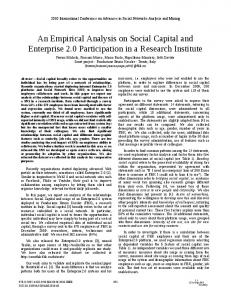
We study the temporal network characteristics using realistic vehicular traces from the city of Beijing, which gathered from 12:00 am to 11:59 pm on Jan. 05, 2009 in the local time [26]. The number of subject taxis is 2927. The number of the GPS points in the trace is 4,227,795. The GPS points span from 32.1223 to 42.7413 in latitude, and from 111.6586 to 126.1551 in longitude. After this, we have generated an artificial contact trace by defining a communication range of 300m for the vehicles, which roughly corresponds to DSRC-based communication in same scenarios [27]. We sample the time points every 1 min and calculate the duration of all links. Fig. 1 shows the spatial distribution of taxis at midnight at 24:00 and daily activity spaces of a randomly selected taxi in Beijing. IV. NETWORK MODEL AND KEY METRICS DEFINITION
This section contains the network model of VANET and the definitions of the key metrics used in the study. The topology structure of static network can be characterized by an abundance of measures [28]. In essence, such measures are based on connections between neighboring nodes(such as the degree or clustering coefficient), or between larger sets of nodes(such as path lengths, network diameter and various centrality measures). When the additional degree of freedom of time is included in the network picture, many of these measures need rethinking or revising. A. NETWORK MODEL
In some earlier papers [13], [24], VANETs have been represented as a set of graphs G =< G0 , G1 , . . . , Gt , . . . >, where 724
FIGURE 1. (a) Spatial distribution of taxis at midnight at 24:00. (b) Illustration of daily activity spaces of a randomly selected taxis in Beijing.
Gt = (Vt , Et ) is the graph of pairwise interactions between the nodes at time t ∈ [0, T ]. Here, Vt and Et represent the nodes and edges at time t, respectively. Such graphs can be considered as a series of snapshots of the vehicular network topology over time. Using this model, we can only obtain the instantaneous network topology and some standard network theory measures (i.e. shortest path, degree, clustering coefficient, closeness centrality). Naturally, it is always possible to track the evolution of these metrics on snapshots of at certain time intervals. However, this often fails to capture the correlations between successive snapshots. Meanwhile, instantaneous network ignore time order which in turn results in static shortest paths overestimating available links and understanding their true corresponding lengths. Therefore, it is only meaningful when the information propagation is instantaneous. Indeed, in such a highly dynamic environment, an end-to-end path cannot be assumed to always exist. Messages are stored and carried by mobile vehicle and forward when opportunities present. Store-carry-and-forward adds a temporal dimension to the instantaneous network VOLUME 5, 2017
L. Qiao et al.: An Empirical Study on the Temporal Structural Characteristics of VANETs on a Taxi GPS Dataset
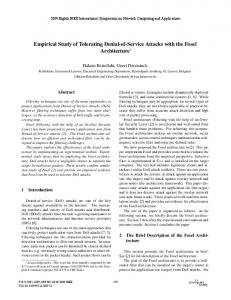
FIGURE 2. Example of VANET as a temporal graph.
topology that is employed by connected forwarding. Therefore, such a representation cannot be applied. We present a time-extended model that captures the temporal property of VANETs. We represent the network as a temporal graph G = (V , E), where V represents all the vehicles, E represents the links between two vehicles, of which the Euclidean distance is smaller than the wireless communication range R. An undirected edge e ∈ E is a quadruple (u, v, t, λ), where u, v ∈ V , t is the contact time between u and v, λ is the link duration time to go from u to v (also from v to u) starting at time t, and t + λ is the link ending time. We denote the starting time of e by t(e) and the duration time of e by λ(e). As a pair of nodes may communicate at multiple time instances, the number of temporal edges between u and v can be large. Fig. 2 shows a temporal graph, where V = {A, B, C, D, E, F, G} is the set of vehicles and each e ∈ E represents a contact between two vehicles. The pair (A, B) has two contacts (0, 1) and (3, 1) at 0 and 3 respectively with link duration 1 minutes, whereas (E, G) has a single contact (4, 1). Based on this network model, some key metrics, like timeordered path, influence set and source set, are defined to describe the structural characteristics of VANETs in various aspects in the following sections.
A crucial concept in temporal graph is that of time-ordered path which is the temporal extension of the notion of path in static graph, and forms the basis of most introduced temporal concepts. Time-ordered paths define which vertices can be reached from which other vertices within some observation window. The reachability of temporal graph is to describe the connectedness of the graph and whether the topology of the graph allows a source node to form a time-ordered path to another node in the network. 1) TIME-ORDERED PATH
VOLUME 5, 2017
2) SHORTEST TIME-ORDERED PATH
P ∈ P(x, y, [tα , tβ ]) is the shortest time-ordered path if 0 0 dist(P) = min{dist(P ) : P ∈ P(x, y, [tα , tβ ])}. 3) INFLUENCE SET
The set of vertices that can be reached by time-ordered paths from vertex i is called the set of influence of i. This is important for disease spreading in VANETs, as it is the set of vertices that can eventually be infected if i is the source of infection. The size of the influence set of a vertex gives an upper bound of the size of any epidemic starting in this vertex. 4) SOURCE SET
Reversely, we can also define the source set of i as the set of vertices that can reach i through time-ordered paths within the observation window. This set consists of all vertices that can have been the source of an infection infecting i. The size of the source set of a vertex is proportional to the probability of getting infected if an epidemic starts somewhere in the network. 5) AVERAGE REACHABILITY RATIO
B. TIME-ORDERED PATH AND REACHABILITY
A time-ordered path P in a temporal graph sequence of vertices P =< v1 , v2 , . . . , vk , vk+1 (vi , vi+1 , ti , λi ) ∈ E is the i − th temporal edge 1 ≤ i ≤ k, and (ti + λi ≤ ti+1 ) for 1 ≤ i ≤
literature [29], the terms “journey”and “time-respecting path”have also been used for time-ordered path. We denote by start(P), and end(P), the starting time t1 and the ending time tk + λk of a time-ordered path P. Time-ordered paths can be thought of as store-carry-and-forward routes over time from a source to a destination. We also define the temporal distance of P as dist(P) = end(P) − start(P) corresponding to the delay of route. Information or resources can be transmitted through store-carry-and-forward paradigm from node i to node j in VANETs only if they are joined by a time-ordered path. An example of a time-ordered path from A to G is P = h(A, D, 2, 1), (D, E, 3, 1), (E, G, 4, 1)i in Fig. 2. We have start(P) = 2, end(P) = 4 + 1 = 5, dist(P) = 5 − 2 = 3. Given a temporal graph G, a source vertex x and a target vertex y in G, and a time interval [tα , tω ], let P(x, y, [tα , tβ ]) = {P : P is a time-order path from x to y such that start(P) ≥ tα , end(P) ≤ tβ }, we define the shortest time-ordered path:
G is a > where on P for k. In the
We can also calculate the average rachability ratio of network within the observation window, defined as: RT (tα , tβ ) =
1 X |Inf (i)| N |V |
(1)
i∈V
where |Inf (i)| is the number of influence set of vertex i within the observation window [tα , tβ ], |V | is the number of vertices. C. TEMPORAL NETWORK EFFICIENCY AND CLOSENESS CENTRALITY
There are several measures to characterize the compactness of a static network, such as average shortest path lengths, the diameter and the efficiency of the network. Similarly, we use the temporal network efficiency to describe the compactness of a temporal network. In order to identify a number of 725
L. Qiao et al.: An Empirical Study on the Temporal Structural Characteristics of VANETs on a Taxi GPS Dataset
importance nodes to assign to them special roles, we also introduce the concept of temporal closeness centrality.
2) STRONGLY CONNECTED COMPONENT OF TEMPORAL GRAPH
1) TEMPORAL NETWORK EFFICIENCY
The strongly connected component of temporal graph is a set of nodes if each node of the set is strongly connected to all the other nodes in the set.
We can define the temporal network efficiency E(tα , tβ ) of a given temporal graph G X 1 1 (2) E(tα , tβ ) = N (N − 1) di,j (tα , tβ ) i,j
where di,j (tα , tβ ) is the distance of the shortest time-ordered path from i to j. N is the number of vertices. This value is not affected by disconnected pairs of nodes, because their contribution to the efficiency is computed as zero. Temporal network efficiency is normalized between 0 and 1 and it does not depend on the size of network. 2) TEMPORAL CLOSENESS CENTRALITY
In a static graph, the closeness centrality of a node is used to measure its importance in the graph. It is obtained as the average static shortest path length to all other nodes in the graph. In a temporal graph, the static shortest path distance must be replaced by the shortest time-ordered path distance since the order of the time sequence on a time-ordered path defines the order of communication. The temporal closeness centrality can be expressed as: X 1 1 (3) Ci (tα , tβ ) = (N − 1) di,j (tα , tβ )
3) AFFINE GRAPH
In order to find the strongly connected component of temporal graph G, Nicosia et al. [30] also propose the concept of affine graph corresponding to the temporal graph which is an undirected static graph with the same nodes as G, and such that two nodes i and j are linked in affine graph if i and j are strongly connected in G. The affine graph of a temporal graph can be obtained by computing the temporal shortest paths between any two pairs of nodes, and then adding a link between two nodes i and j of the affine graph only if the temporal distance from i to j and the temporal distance from j to i are both finite. V. EXPERIMENTS AND RESULTS ANALYSIS
In this section, we apply the time-expanded model and key metrics defined above to study the characteristics of VANETs on Beijing Taxi dataset. To find the different network characteristics in off-peak hour and on-peak hour, we select two observation intervals. One is from 00:00 am to 01:00 am and the other is from 7:30 am to 8:30 am.
j6=i∈V
where di,j (tα , tβ ) is the distance of the shortest time-ordered path from i to j, N is the number of vertices. D. CONNECTIVITY AND COMPONENT
Connectivity—whether or not a pair of vertices is connected by a path—is a fundamental concept for networks. For static networks, vertices are either connected or not, and connected components are defined as sets of vertices between which some path can always be found. In a temporal network, node i and j are temporally connected in [tα , tβ ] if there exists a time-ordered path going from i to j. This relation is not symmetric: the existence of time-ordered path from i to j does not imply there is a path from j to i. Nicosia et al. [30] give a detail description of the connectivity and component of the temporal network. They divide the property of connectivity into two parts: two vertices i and j of a temporal network are defined to be strongly connected if there is a time-ordered path connecting i to j and vice versa, while they are weakly connected if there are undirected time-order paths from i to j and j to i, i.e. the directions of the contacts are not taken into account. On the basis of these definitions, they may then define strongly or weakly connected components of the node and temporal graph: 1) TEMPORAL STRONGLY CONNECTED COMPONENT
The temporal strongly connected component of node i is the set of nodes from which node i can be reached, and which can be reached from i in the temporal graph. 726
A. THE STATISTICS OF TIME-ORDERED PATH AND REACHABILITY ANALYSIS
The shortest time-ordered paths distance can be seen as the delay of routes, which obviously influence how quickly anything can propagate between nodes through store-carryforward paradigm, and their average and distribution determines the overall ‘‘compactness’’ of a network. Therefore, we first look at the shortest time-ordered paths distance statistics for our dataset, which is illustrated in Table 1. As expected, the total paths are more during the rush hour. Specifically, the number of shortest time-ordered paths is three times as large as that one in off-peak hour. This is mainly due to the fact that when traffic volume increases, there are a high number of potential relay vehicles. Thus, more pairs of vehicles can communicate with each other. Table 1 shows that the mean value of shortest time-ordered paths distance between all pairs of vehicles in two time periods is 1620s (27 minutes) and 1461s (24 minutes), respectively. That it to say the average delay of route through store-carry-forward paradigm is very high. Therefore, V2V communication based on story-carryforward is not suitable for road safety application which have delay and reliability as the major requirement. Information such as promotion advertisement and infotainment news have no strict delay can be transmitted through the story-carryforward paradigm. We also shows the distribution of shortest time-ordered paths distance between all pairs of vehicles in off-peak hour and on-peak hour. As depicted in Fig. 3, it is easy to see the VOLUME 5, 2017
L. Qiao et al.: An Empirical Study on the Temporal Structural Characteristics of VANETs on a Taxi GPS Dataset
TABLE 1. Shortest time-ordered path distance statistics.
FIGURE 3. Distribution of the shortest time-ordered paths distance between all pairs of vehicles in off-peak hour (a) and on-peak hour (b).
distribution of shortest time-ordered paths distance between all pairs of vehicles is well approximated by normal distribution. The mean value of two time periods are µ1 = 1615.2 ± 1.6, µ2 = 1459.3 ± 0.9, and the standard deviation are σ1 = 793.9 ± 1.1, σ2 = 828.5 ± 0.6, respectively. Now, we examine the reachability of our dataset. For each node, we obtain the size of source set and influence set every five minutes. Due to lack of space, we only present one representative case. In Fig. 4, we report the size of source set (a) and influence set (b) during the beginning of the off-peak hour, namely from 00:00 to 00:20 (blue stars), and during the beginning of the on-peak hour (red circles), namely from 7:30 to 7:50. As shown in Fig. 4, we observe a wide distribution of the sizes of source set and influence set. In particular (panel a) VOLUME 5, 2017
FIGURE 4. Size of the source set (a) and influence set (b) for each node in off-peak hour (blue stars) and on-peak hour (red circles).
we notice the majority of nodes having an source set of size smaller than 100, a small group of nodes with source set sizes between 100 and 280, only a few nodes whose source set contains larger than 280 nodes in off-peak hour. Conversely, the size of source set has increased dramatically in on-peak hour. There are many nodes having source set with less than 300 nodes, a small number of nodes with source set sizes between 300 and 500, the rest of nodes whose source set contains more than 500 nodes. The similar phenomenon is also observed in influence set. The observed variance in the size of node source set is due to the fact that most drivers tend to stay in taxi for a sleep and seldom have needs to travel at night. Thus, they have less opportunities to meet 727
L. Qiao et al.: An Empirical Study on the Temporal Structural Characteristics of VANETs on a Taxi GPS Dataset
FIGURE 6. Average reachability ratio of vehicles in off-peak hour and on-peak hour.
FIGURE 5. Cdf of the size of the source set (a) and influence set (b) in off-peak hour and on-peak hour.
and interact each other. Only a few taxis take the passengers to the station and airport, and they may encounter in these public areas. In contrast, in rush hour, people may take taxis to go to their workplaces from their homes. There are more travel demands and high probabilities that two vehicles are connected by time-ordered paths. Fig. 5 shows the cdf of the size of source set and influence set in these two time periods. We can observe that the proportion of parked taxis decreases from 43% to 28% in on-peak hour. That means there are still about one third of the vehicles are isolated which are not reached from other vehicles. We also observe that the size of influence set is similarly large for many taxis in rush hour compared with off-peak, which tells us that taxis are able to send and deliver message easily in on-peak hour. Therefore, we should inject the message into VANETs in on-peak hour so that more vehicles can receive it. In order to measure the capability of information spreading of vehicle through story-carry-forward paradigm, we report the average reachability ratio of network in two time periods in Fig. 6. After one hour, the average reachability ratio is 728
only 12% in off-peak hour. That indicates if we inject an promotion advertisement into the VANET in midnight, only 12% of all vehicles can eventually receive the information after 60 minutes. Conversely, if we select a vehicle as a seed to delivery the information in on-peak hour, 38% of all vehicles will be noticed. Therefore, average reachability ratio is an important metric for disease spreading in VANETs. It reveals the power of disease spreading through story-carry-forward mechanism. To sum up, we made the following observations: • The distribution of shortest time-ordered paths distance is well approximated by normal distribution. The distance of most shortest time-ordered paths are around the mean value, several are very high and low. • The delay of routes through store-carry-store paradigm is very high. V2V communication based on story-carryforward is not suitable for road safety application. • Vehicles are able to deliver and receive messages easily in rush hour. • A large proportion of vehicles noticed by story-carryforward mechanism will take long time. B. ANALYSIS OF TEMPORAL EFFICIENCY AND CLOSENESS CENTRALITY
Next, we explore how the temporal network efficiency changes over time for our dataset. As shown in Fig. 7, we find that there is a linear relationship between temporal network efficiency and the interval of observe window both in off-peak hour and on-peak hour. Obviously, the larger T ends up with a higher temporal network efficiency value. The reason is that there would be more time-ordered paths to make more connection among vehicles over time, and the temporal network efficiency will be higher as a consequence. In some case, we need to identify a number of ‘‘qualified’’ nodes to assign to them special roles. In network theory, numerous centrality measures have been applied to identify the important nodes. An interesting question is whether the temporal closeness centrality can be a metric to identify the influence nodes in VANETs. Fig. 8 plots the temporal VOLUME 5, 2017
L. Qiao et al.: An Empirical Study on the Temporal Structural Characteristics of VANETs on a Taxi GPS Dataset
TABLE 2. Structure properties of the affine graph: the number of links (Edges), the density of affine graph (Density), the number of maximal cliques (Num), and size of the largest maximal clique (Size).
FIGURE 7. Temporal network efficiency for our dataset in off-peak hour and on-peak hour.
closeness centrality rankings of vehicles calculated using Eq. (3). A vehicle with a high value of temporal closeness centrality indicates that other vehicles can be quickly reached from it. As shown in Fig. 8, We note that there are three same taxis ID (17007, 28171 and 32958) amongst the top nine between 7:30∼8:00 and 7:30∼8:30. We also calculate the Kendall’s tau correlation coefficient of all nodes’ temporal closeness centrality between 7:30∼8:00 and 7:30∼8:30. It confirms that they are strongly correlated (the Kendall’s tau correlation coefficient is 0.7820). Thus, vehicles which have high temporal closeness centrality values can be selected as influence nodes to forward information. Meanwhile, these characteristics can help us to improve the accuracy of temporal closeness centrality prediction and design more efficient routing algorithms. In summary, we made the following observations: •
•
The temporal network efficiency of VANETs has strongly positive correlation to the interval of observe window. Temporal closeness centrality is appropriate for identifying the ‘‘qualified’’ vehicles in VANETs.
C. ANALYSIS OF CONNECTIVITY AND COMPONENT
Finally, we use affine graph to analyze the strongly connected components of VANETs. It is practically unfeasible to find all VOLUME 5, 2017
FIGURE 8. Ranked distribution of top 40 centrality nodes at 7:30∼8:00 (a) and 7:30∼8:30 (b). Top 9 vehicle IDs listed under each plot.
the strongly connected components of large temporal graphs. The structure properties of affine graph corresponding to our dataset are reported in Table 2. We observe that there are large fluctuations in the measured value. The number of links E ranging from 2164 in 0:00∼0:05 to 46258 in 0:00∼0:30, while the number of maximal cliques N is in the range [2372, 280338]. That indicates more pairs of vehicles can communicate each other. These vehicles belong to the same clique may 729
L. Qiao et al.: An Empirical Study on the Temporal Structural Characteristics of VANETs on a Taxi GPS Dataset
be come from the same taxi firm and they know each other. A larger strongly connected component size indicates that more vehicles are successfully connected together with storecarry-forward communication, and the connectivity is therefore better. However, we find that the size of largest strongly connected component (e.g. the size of maximum clique LS) is in the range [17, 86], with a mean value around 42 and a standard deviation equal to 28. Even during 7:30∼7:55, the size of largest strongly connected component is at most 101. This suggests that VANET is partitioned into thousands of small cliques. Only a few large strongly connected components may appears at specific locations during the traffic peak hour. To sum up, we made the following observations: • The affine graph corresponding to our dataset is a sparse graph. • VANET is partitioned into thousands of small cliques. Only a few vehicles can form the strongly connected component through store-carry-forward paradigm. VI. CONCLUSION
This paper provides a through study of the temporal structural characteristics based on a real taxi GPS dataset in Beijing. Specially, we first present a time-extended model that capture the temporal property of VANETs. Based on the model, we define the time-ordered path and shortest time-ordered path which form the basis of most temporal measures. Then, source set and influence set are given to describe the reachability of VANETs. In order to identify ‘‘qualified’’ nodes, temporal closeness centrality are extended from the closeness centrality in static network. Finally, we use affine graph to analyze the strongly connected component of VANETs. Experiments are operated on a real and large-scale taxi GPS dataset. The results could guide us to design better protocols and algorithms to achieve reliable and low-latency communications. ACKNOWLEDGMENT
The authors would like to thank the editors and the reviewers for their constructive comments. REFERENCES [1] S. Al-Sultan, M. M. Al-Doori, A. H. Al-Bayatti, and H. Zedan, ‘‘A comprehensive survey on vehicular ad hoc network,’’ J. Netw. Comput. Appl., vol. 37, pp. 380–392, Jan. 2014. [2] M. Conti et al., ‘‘From MANET to people-centric networking: Milestones and open research challenges,’’ Comput. Commun., vol. 71, pp. 1–21, Nov. 2015. [3] K. Zheng, Q. Zheng, P. Chatzimisios, W. Xiang, and Y. Zhou, ‘‘Heterogeneous vehicular networking: A survey on architecture, challenges, and solutions,’’ IEEE Commun. Surveys Tut., vol. 17, no. 4, pp. 2377–2396, 4th Quart., 2015. [4] O. Kaiwartya et al., ‘‘Internet of vehicles: Motivation, layered architecture, network model, challenges, and future aspects,’’ IEEE Access, vol. 4, pp. 5356–5373, Sep. 2016. [5] S. Chen, J. Hu, Y. Shi, and L. Zhao, ‘‘LTE-V: A TD-LTE based V2X solution for future vehicular network,’’ IEEE Internet Things J., vol. 3, no. 6, pp. 997–1005, Dec. 2016. [6] W. Viriyasitavat, F. Bai, and O. K. Tonguz, ‘‘Dynamics of network connectivity in urban vehicular networks,’’ IEEE J. Sel. Areas Commun., vol. 29, no. 3, pp. 515–533, Mar. 2011. 730
[7] Z. Yan, H. Jiang, Z. Shen, Y. Chang, and L. Huang, ‘‘k-connectivity analysis of one-dimensional linear VANETs,’’ IEEE Trans. Veh. Technol., vol. 61, no. 1, pp. 426–433, Jan. 2012. [8] M. Fiore and J. Härri, ‘‘The networking shape of vehicular mobility,’’ in Proc. 9th ACM Int. Symp. Mobile Ad Hoc Netw. Comput., Hong Kong, May 2008, pp. 261–272. [9] Y. Li, D. Jin, Z. Wang, L. Zeng, and S. Chen, ‘‘Exponential and power law distribution of contact duration in urban vehicular ad hoc networks,’’ IEEE Signal Process. Lett., vol. 20, no. 1, pp. 110–113, Jan. 2013. [10] H. Zhu, M. Li, L. Fu, G. Xue, Y. Zhu, and L. M. Ni, ‘‘Impact of traffic influxes: Revealing exponential intercontact time in urban VANETs,’’ IEEE Trans. Parallel Distrib. Syst., vol. 22, no. 8, pp. 1258–1266, Aug. 2011. [11] D. Naboulsi and M. Fiore, ‘‘On the instantaneous topology of a large-scale urban vehicular network: The cologne case,’’ in Proc. 14th ACM Int. Symp. Mobile Ad Hoc Netw. Comput., Bangalore, India, Jul. 2013, pp. 167–176. [12] M. Gramaglia, O. Trullols-Cruces, D. Naboulsi, M. Fiore, and M. Calderon, ‘‘Vehicular networks on two Madrid highways,’’ in Proc. 11th Annu. IEEE Int. Conf. Sens., Commun. Netw. (SECON), Jun. 2014, pp. 423–431. [13] M. Gramaglia, O. Trullols-Cruces, D. Naboulsi, M. Fiore, and M. Calderon, ‘‘Mobility and connectivity in highway vehicular networks: A case study in Madrid,’’ Comput. Commun., vol. 78, pp. 28–44, Mar. 2016. [14] D. Naboulsi and M. Fiore, ‘‘Characterizing the instantaneous connectivity of large-scale urban vehicular networks,’’ IEEE Trans. Mobile Comput., to be published, doi: 10.1109/TMC.2016.2591527. [15] S. Yousefi, E. Altman, R. El-Azouzi, and M. Fathy, ‘‘Analytical model for connectivity in vehicular ad hoc networks,’’ IEEE Trans. Veh. Technol., vol. 57, no. 6, pp. 3341–3356, Nov. 2008. [16] N. P. Chandrasekharamenon and B. AnchareV, ‘‘Connectivity analysis of one-dimensional vehicular ad hoc networks in fading channels,’’ EURASIP J. Wireless Commun. Netw., vol. 2012, no. 1, pp. 1–16, 2012. [17] S. C. Ng, W. Zhang, Y. Zhang, Y. Yang, and G. Mao, ‘‘Analysis of access and connectivity probabilities in vehicular relay networks,’’ IEEE J. Sel. Areas Commun., vol. 29, no. 1, pp. 140–150, Jan. 2011. [18] S. Hammouda, H. Tounsi, and M. Frikha, ‘‘Towards a study of mobility models impact on VANET connectivity metrics,’’ in Proc. 3rd Int. Conf. Netw. Future (NOF), Nov. 2012, pp. 1–5. [19] X. Hou, Y. Li, D. Jin, D. O. Wu, and S. Chen, ‘‘Modeling the impact of mobility on the connectivity of vehicular networks in large-scale urban environments,’’ IEEE Trans. Veh. Technol., vol. 65, no. 4, pp. 2753–2758, Apr. 2016. [20] A. Bazzani, B. Giorgini, S. Rambaldi, R. Gallotti, and L. Giovannini, ‘‘Statistical laws in urban mobility from microscopic GPS data in the area of Florence,’’ J. Statist. Mech., Theory Experiment, vol. 2010, no. 5, pp. 1– 17, 2010. [21] X. Liang, X. Zheng, W. Lv, T. Zhu, and K. Xu, ‘‘The scaling of human mobility by taxis is exponential,’’ Phys. A, Statist. Mech. Appl., vol. 391, no. 5, pp. 2135–2144, Mar. 2012. [22] H. Feng and Y. Xu, ‘‘An empirical study on evolution of the connectivity for VANETs based on taxi GPS traces,’’ Int. J. Distrib. Sensor Netw., vol. 2016, pp. 1–11, 2016. [23] Y. Chen, M. Xu, Y. Gu, P. Li, L. Shi, and X. Xiao, ‘‘Empirical study on spatial and temporal features for vehicular wireless communications,’’ EURASIP J. Wireless Commun. Netw., vol. 2014, no. 180, pp. 1–12, Dec. 2014. [24] G. Pallis, D. Katsaros, M. D. Dikaiakos, N. Loulloudes, and L. Tassiulas, ‘‘On the structure and evolution of vehicular networks,’’ in Proc. IEEE Int. Symp. Modeling, Anal. Simulation Comput. Telecommun. Syst., London, U.K., Sep. 2009, pp. 1–10. [25] C. Glacet, M. Fiore, and M. Gramaglia, ‘‘Temporal connectivity of vehicular networks: The power of store-carry-and-forward,’’ in Proc. IEEE Veh. Netw. Conf. (VNC), Kyoto, Japan, Dec. 2015, pp. 52–59. [26] M. Sathiamoorthy, A. G. Dimakis, B. Krishnamachari, and F. Bai, ‘‘Distributed storage codes reduce latency in vehicular networks,’’ IEEE Trans. Mobile Comput., vol. 13, no. 9, pp. 2016–2027, Sep. 2014. [27] D. Jiang, Q. Chen, and L. Delgrossi, ‘‘Optimal data rate selection for vehicle safety communications,’’ in Proc. 5th ACM Int. workshop Veh. Inter-Netw., San Francisco, CA, USA, Sep. 2008, pp. 30–38. [28] L. da F. Costa, F. A. Rodrigues, G. Travieso, and P. R. V. Boas, ‘‘Characterization of complex networks: A survey of measurements,’’ Adv. Phys., vol. 56, no. 1, pp. 167–242, 2007. VOLUME 5, 2017
L. Qiao et al.: An Empirical Study on the Temporal Structural Characteristics of VANETs on a Taxi GPS Dataset
[29] H. Wu, J. Cheng, S. Huang, Y. Ke, Y. Lu, and Y. Xu, ‘‘Path problems in temporal graphs,’’ Proc. VLDB Endowment, vol. 7, no. 9, pp. 721–732, May 2014. [30] V. Nicosia, J. Tang, M. Musolesi, G. Russo, C. Mascolo, and V. Latora, ‘‘Components in time-varying graphs,’’ Chaos, Interdiscipl. J. Nonlinear Sci., vol. 22, no. 2, pp. 1–12, Feb. 2012.
LIQIANG QIAO received the B.Sc. and M.Sc. degrees in computer science and technology from Northeastern University, Shenyang, China, in 2010 and 2012, respectively. He is currently pursuing the Ph.D. degree with the State Key Laboratory of Networking and Switching Technology, Beijing University of Posts and Telecommunications, Beijing, China. His research interests include the analysis of characteristics of mobile networks, vehicular networking, and performance modeling.
VOLUME 5, 2017
YAN SHI received the Ph.D. degree from Beijing University of Posts and Telecommunications, Beijing, China, in 2007. She is currently a Research Staff with the State Key Laboratory of Networking and Switching Technology. Her research interests include network architecture evolution, protocol design, and performance optimization of future networks and mobile computing, especially mobile management technology.
SHANZHI CHEN (SM’04) received the Ph.D. degree from the Beijing University of Posts and Telecommunications, Beijing, China, in 1997. He joined the Datang Telecom Technology Industry Group in 1994, and has served as CTO since 2008. He is the Director of State Key Laboratory of Wireless Mobile Communications, and the Board Member of Semiconductor Manufacturing International Corporation. He devoted his researches and developments to TD-LTE-advanced 4G since 2004. His research interests include network architectures, 5G mobile communications, vehicular communication networks, and Internet of Things. He was a member of the steering expert group on information technology of the 863 Hi-Tech R D Program of China from 1999 to 2011. He received the 2001 and 2012 National Awards for Science and Technology Progress, the 2015 National Award for Technological Invention, and the 2014 Distinguished Young Scholar Award from the National Natural Science Foundation, China.
731