1,2E TSUDA-FUTAMI, MD, 1D HANS, PhD, 1C F NJEH, PhD, 1T FUERST, PhD, ... the reproducibility of this new device, compare the results with the UBA575+ ...
The British Journal of Radiology, 72 (1999), 691^700
E
1999 The British Institute of Radiology
Short communication
An evaluation of a new gel-coupled ultrasound device for the quantitative assessment of bone 1,2
E TSUDA-FUTAMI, MD, 1D HANS, PhD, 1C F NJEH, PhD, 1T FUERST, PhD, 1B FAN, MD, 1 J LI, MD, 1Y Q HE, MD and 1H K GENANT, MD 1
Osteoporosis and Arthritis Research Group, Department of Radiology, University of California, USA, and 2Osaka City University, Japan Abstract. Quantitative ultrasound (QUS) is now being accepted as a tool in the assessment of bone status. Most QUS devices measure broadband ultrasound attenuation (BUA) and speed of sound (SOS). A newly introduced device, the Acoustic Osteo-Screener (AOS-100), measures both SOS and an attenuation related parameter called the transmission index (TI) and provides a derived parameter called osteo sono-assessment index (OSI). The purpose of this study was to examine the reproducibility of this new device, compare the results with the UBA575+ and evaluate the e¡ect of using two platforms to compensate for di¡erent foot sizes on the measured values. 83 subjects aged 21^89 years, who gave informed consent, were recruited. Subjects were assigned to three di¡erent groups determined by age and health status. The short-term measurement precision (expressed as root mean square coe¤cient of variation) of SOS (0.13^0.16%) and TI (1.18^1.96%) was similar to and better than that obtained for the UBA 575+. Signi¢cant negative correlations were found between the di¡erences in SOS measured with the two platforms (adaptors to adjust the position of the foot relative to the foot plate) and foot length (p,0.0001). This implies that small feet are more in£uenced by the di¡erences of measured location. All QUS parameters measured with the small platform were found to be signi¢cantly smaller than those with the large platform (p,0.0001). The mean percentage di¡erences were 0.6% in SOS, 2.8% in TI and 4.3% in OSI with the large foot platform giving larger value results. Proper use of the platforms resulted in more reproducible SOS and TI. This study demonstrated that the newly developed AOS-100 parameters TI and OSI were highly reproducible. This study also demonstrated that the use of an inappropriate platform can cause discrepancies in QUS readings and poor reproducibility.
In the past decade, remarkable progress has been made in the development of methods for the non-invasive assessment of skeletal status. Dual X-ray absorptiometry (DXA) has developed into one of the most widely used methodologies [1, 2]. There is growing interest in the use of quantitative ultrasound (QUS) measurements for the noninvasive assessment of osteoporotic fracture risk in the management of osteoporosis as a complementary or alternative modality to the photon absorptiometry technique [3, 4]. QUS is particularly attractive because it is a relatively simple technique and the device is inexpensive and portable [4]. QUS also avoids the use of ionizing radiation which may increase its Received 28 September 1998 and in revised form 14 January 1999, accepted 24 February 1999. Address correspondence to Christopher F Njeh, PhD, Osteoporosis and Arthritis Research Group, Department of Radiology, 350 Parnassus Avenue, Suite 908, University of California, San Francisco, CA 94117-1349, USA. The British Journal of Radiology, July 1999
acceptance by patients. QUS is presently limited to the peripheral sites. However, the ability of ultrasound to discriminate patients with osteoporotic fractures from age-matched controls as well as to predict the risk of future fracture has been documented [3, 5^8]. Moreover, QUS has interesting characteristics whereby it may give information not only about bone mineral density (BMD) but also about bone architecture and elasticity [9^11]. These theoretical bene¢ts, con¢rmed by clinical results showing good diagnostic utility, have encouraged further basic investigation and commercial development [3, 12]. QUS devices measure either speed of sound (SOS) and/or broadband ultrasound attenuation (BUA), but there are several limitations in its current implementation [13^15]. One of these problems is in the method of calculating BUA which, de¢ned as the slope of ultrasound attenuation versus frequency, has been recognized as a clinically useful parameter closely related to BMD [16, 17]. However, relative to DXA, BUA su¡ers from poorer precision. This is due to many factors 691
Subjects 83 subjects aged 21^89 years, who gave informed consent, were recruited for the evaluation of a new gel-coupled, calcaneal ultrasound system. Subjects were assigned to three di¡erent groups as determined by age and health status (Table 1). The subjects consisted of 29 healthy volunteers (Group 1: 14 male, mean age 35 years, range 27^44 years; 15 female, mean age 33 years, range 21^49 years), 30 post-menopausal controls (Group 2: mean age 77 692
ns ns ns ns ns ns p,0.01 p,0.01 p,0.01 p,0.05 p,0.05 p,0.0001 ns ns ns ns p,0.05 p,0.001 p,0.001 p,0.001 p,0.01 p,0.01 24 74.4¡8.7 160.9¡4.3 63.4¡12.9 24.3¡1.2 7.1¡0.4 909¡172 1525¡23 0.96¡0.09 2.23¡0.26 1499¡8 59.0¡15.5
ns p,0.001 p,0.01 p,0.0001 p,0.001 p,0.0001 ns ns ns ns ns
Group 2 vs Group 3 Group 1(female) vs Group 2 Group 1 male vs female
30 77.3¡5.7 158.2¡6.8 61.8¡13.0 24.2¡1.2 7.2¡0.4 834¡191 1548¡27 1.02¡0.07 2.46¡0.24 1504¡8 72.7¡16.6 15 33.3¡8.2 161.5¡6.5 60.3¡10.5 23.8¡0.9 6.6¡0.4 731¡106 1575¡27 1.16¡0.13 2.87¡0.43 1514¡8 93.1¡12.4
Female Male
14 35.2¡5.5 175.6¡7.1 73.4¡11.7 26.2¡1.3 7.5¡4.5 1066¡151 1565¡25 1.21¡0.11 2.98¡0.36 1516¡4 87.9¡6.8
Signi¢cance of comparison Group 3 Group 2
No. of subjects Age (years) Height (cm) Weight (kg) Foot length (cm) Instep height (cm) Foot volume (ml) AOS-100: SOS (m s ^1) TI OSI (106) UBA575+: SOS (m s ^1) BUA (dB MHz ^1)
Material and methods
Group 1
including patient positioning, acoustic coupling with the heel and temperature [18]. Precision can be further in£uenced by the processing of the received ultrasound signal. Calculation of BUA requires transformation of the ultrasound signal into the frequency domain, typically through the use of the fast Fourier transform. Noise in the ultrasound signal can be ampli¢ed by this mathematical process giving rise to imprecise measures of BUA [19]. Another limitation of some QUS devices lies in the de¢nition of the region where BUA and SOS are measured. Most QUS devices use a ¢xed measurement location relative to the back of the heel and sole of the foot. Such devices do not take into account variability in heel length which may in£uence the region examined and the ¢nal QUS result. Evans et al [18] reported that the combination of the variations in rotation about the long axis of the foot and foot movement in the dorsal^plantar or heel^toe direction could change BUA by as much as 9%. According to a report by Jorgensen et al [14], signi¢cant di¡erences were found in the results obtained from a ¢xed region of interest (ROI) and an anatomical ROI, the location of which was dependent on heel size and shape [14]. Thus, the QUS readings in the calcaneus are sensitive to measurement location. The magnitude of the e¡ect needs to be understood and the potential value of adjusting the measurement location for the individual evaluated. In this study, we examined the stability and reproducibility of a newly developed QUS device which introduces a new parameter determined by the full width half maximum of the ¢rst peak of the received waveform as an alternative to BUA. In addition, we investigated the impact of measurement location using two positioning platforms provided by the manufacturer and designed for large or small feet. The in£uence of anthropometric variables on reproducibility and absolute values was also investigated. We also compared QUS results obtained with this new device to measurements made with the UBA575+ (Hologic, Inc., Waltham, MA; previously Walker Sonix).
Table 1. Demographics of study population: mean value and SD of age, anthropometric parameters, and QUS parameters for the three studied groups: young volunteers (Group 1), non-fractured elderly controls (Group 2) and hip fractured elderly women (Group 3)
E Tsuda-Futami, D Hans, C F Njeh et al
The British Journal of Radiology, July 1999
Short communication: Evaluation of a QUS device
years, range 55^89 years) who were matched by age with 24 osteoporotic women (Group 3: mean age 74 years, range 53^85 years). The subjects in Group 3 were de¢ned by previous low trauma hip fracture within the past 3 years. The subjects in Groups 1 and 2 had no previous history of fractures or bone disease. Individuals with chronic disease a¡ecting bone density (such as hyperthyroidism or chronic renal failure) or who used medication, such as oestrogen or oestrogenic compounds, calcitonin, bisphosphonates, that can a¡ect BMD were excluded from this study.
Acoustic Osteo-Screener 100 Ultrasound measurements in the calcaneus were made using a new ultrasound system called the Acoustic Osteo-Screener (AOS-100) (Aloka Co. Ltd,Tokyo, Japan) (Figure 1a).The AOS-100 measures the ultrasound properties of the calcaneus by the transmission technique using a pair of unfocused broadband ultrasound transducers (25 mm diameter, 0.5 MHz centre frequency, range 0.2^1.0 MHz) which are positioned on each side of the calcaneus. The AOS-100 uses gel as the coupling medium between the heel and transducers. Each transducer is contained within an oil ¢lled (castor oil) chamber with an outer rubber membrane soft enough to adapt to the shape of the heel. During measurement, ultrasound gel is applied to the rubber membrane and the foot positioned on a platform between the two transducers. The transducers are then manually advanced until they are in contact with the sides of the heel. The measurement is initiated and lasts only about 5 s. Three ultrasonic parameters are obtained using
(a)
the AOS-100 system. These are the speed of sound (SOS), the transmission index (TI) (Figure 1b) and the osteo sono-assessment index (OSI). TI and OSI are two newly developed ultrasound parameters. SOS SOS is the ultrasound velocity through the heel. The time of ultrasound propagation through the heel (transit time) (theel) is measured from the start of the transmitted wave to the start of the leading edge of the received pulse. The heel width is physically measured with a caliper attached to the transducers and the velocity calculated by dividing the heel width by the transit time (Figure 2): theel ~tpat {
Lcal =Vo SOS~
Lpat {Lcal =theel where Vo is the speed of sound in the oil ¢lled chamber of the transducers and the other symbols are illustrated in Figure 2. TI TI is a value that is proposed to be related to the frequency-dependent attenuation, or BUA. It is determined by analysing the ultrasound signal in the time domain and is de¢ned as the full-widthhalf-maximum (FWHM) of the ¢rst positive peak of the received waveform [20] (Figure 1b). OSI OSI is a calculated ultrasound parameter combining SOS and TI as follows: OSI5TI6SOS2.
(b)
Figure 1. (a) The Acoustic Osteo-Screener (AOS-100) (Aloka, Japan). (b) De¢nition of new parameter: transmission index (TI). The British Journal of Radiology, July 1999
693
E Tsuda-Futami, D Hans, C F Njeh et al
(a)
Figure 3. A schematic representation for measurement protocol for foot size, instep height and foot volume.
Subject measurement
(b)
Figure 2. An illustration of patient measurement and calibration using AOS-100. (a) Calibration position of transducers, and (b) patient measurement position of transducer.
OSI is, in theory, an estimate of the elastic modulus (E) which, at ¢rst approximation, is equal to the product of physical density and the square of SOS [21]. This is an approximation because cancellous bone is a two-phase (bone, marrow), heterogeneous, anisotropic material rather than the homogeneous solid assumed by the theory from which this relationship is derived [22, 23]. The AOS-100 system attempts to reduce the individual di¡erences in the measurement location by introducing two foot positioning platforms designed to adjust the transducer position for large and small feet. A large foot platform is used for feet 25 cm or longer, and a small foot platform is provided for feet 22^25 cm. The manufacturer advises against measuring individuals whose foot length is less than 22 cm. With the small foot platform the vertical distance from the sole to the measurement centre is 31 mm and the horizontal distance from the back of the heel is 28.5 mm. These distances are 36 mm and 30 mm, respectively, when the large adapter is used.
UBA575+ The UBA575+ (Walker Sonix) was the ¢rst commercial ultrasound system for the evaluation of bone status. This system is a water-coupled calcaneal device using two unfocused broadband transducers (18 mm diameter) with 0.5 MHz centre frequency. The UBA575+ measures BUA (dB MHz ^1) and time of £ight velocity or SOS (m s ^1) [24]. 694
All subjects underwent multiple measurements of the heel with both devices on the same day. The order of the measurements of subjects between the two QUS devices was random. For the Aloka device, foot length was used to determine the appropriate platform to use during measurement. Repeat measurements were made after repositioning the foot to assess short-term precision. Longterm precision was assessed in a subgroup of 10 young healthy volunteers over a period of 2 months by single measurement twice a week. To investigate the in£uence of the measurement location, all subjects were measured twice with the large and small foot platforms.
Anthropometric measurements The anthropometric measurements are depicted in Figure 3. Foot length was de¢ned as the distance from the dorsal edge of the heel to the end of the great toe. The instep height, measured at the midfoot, was de¢ned as the distance from the ground to the top of the foot. The foot volume was determined by £uid displacement and included the entire foot and lower leg up to a height one half the foot length from the bottom of the heel. Height and weight were self-reported.
Precision assessment Short-term precision was expressed by the coef¢cient of variation (CV), de¢ned as the root mean squared standard deviation (RMS SD) divided by the mean of all measurements [25]. Standardized coe¤cient of variation (SCV) was also reported as the root mean squared standard deviation divided by the clinical range of the parameter [24], where range was de¢ned as the di¡erence between the 2.5th percentile to the 97.5th percentile. Precision was calculated for each subject group and for the large and small foot platforms. The calculation of long-term precision used a di¡erent mathematical approach. Long-term The British Journal of Radiology, July 1999
Short communication: Evaluation of a QUS device
precision was determined as the root mean squared error of linear regression of QUS versus time divided by the mean of the QUS parameter [2]. Statistical analysis was performed using StatView (Abacus Concepts Inc.). The results were expressed as mean¡1 standard deviation (SD). Since it is reasonable to assume that all variables had a normal distribution, the following analyses were used: Student's t-test, correlation coe¤cients, paired t-test and simple linear regressions. Student's t-test was applied for the comparison of age, anthropometric measures and ultrasound parameters among groups. Correlation coe¤cients were calculated to understand the relationship between AOS ultrasound parameters and anthropometric variables including foot size, instep height and foot volume. Paired t-test was used to investigate the di¡erence between results measured with and without the appropriate platform. In addition, the dependence of the di¡erence between the large and small foot platform on foot size was investigated by linear regression of the di¡erence in results (L^S) and the di¡erent measures of foot size. The relationship between results obtained with the AOS-100 and UBA575+ were evaluated by simple linear regression analysis.
OSI were observed between Group 2 and Group 3 (SOS: 1525¡23 (Group 2), 1548¡27 (Group 3), p,0.01; TI: 1.02¡0.7 (Group 2), 0.96¡0.09 (Group 3), p,0.01; OSI: 2.23¡0.26 (Group 2), 2.46¡0.26 (Group 3), p,0.05). QUS results from the UBA 575+ were signi¢cantly larger in the young control women (Group 1) compared with the post-menopausal women (Groups 2 and 3) (p,0.01). Moreover, both BUA and SOS measured with the UBA575+ were signi¢cantly di¡erent between Groups 2 and 3 (p,0.01).
Correlation between QUS and anthropometric parameters Subject height was signi¢cantly correlated with foot length and foot volume (Table 2) (r50.55 and 0.35, respectively, p,0.01). Of the QUS measurements with the AOS-100, only SOS signi¢cantly correlated with foot size, showing an inverse relationship with instep height and foot volume (r50.32 and ^0.29 respectively, p,0.01), but not foot length. TI and OSI did not show a signi¢cant relationship with any measure of foot size. SOS and BUA measured with the UBA575+ were negatively correlated with foot volume only (r5 ^0.30 and ^0.28, respectively, p,0.01).
Results Demographics of the study population
Precision
The results of anthropometric and QUS measurements are shown in Table 1. Group 1 was divided into subgroups of men and women. The men were heavier and taller than the women and had larger feet. There were no signi¢cant di¡erences in QUS parameters between males and females in Group 1. Comparing women, no significant di¡erences in physical parameters were found between Groups 2 and 3, while Group 1 was younger than either group and taller than Group 2. All QUS parameters were signi¢cantly larger in women in Group 1 than in Groups 2 or 3 (p,0.0001). Signi¢cant di¡erences in SOS, TI and
The short-term precision values of the AOS-100 and UBA575+ are shown in Tables 3a and b. No signi¢cant di¡erences in precision were found between the various subject groups studied, except precision of BUA with the UBA575+ was poorer in the elderly groups compared with the younger controls (2.5% versus 5.6%, respectively). Precision of the TI and OSI parameters appeared superior to BUA measured with the UBA575+ (CV51.7% and 2.2% versus 4.3%, respectively, p,0.01) while SOS precision was comparable with either device. Similar ¢ndings were seen for BUA in the comparisons of the RMS SCV results (Table 3b). After
Table 2. Pearson correlation coe¤cients of QUS parameters versus anthropometric parameters
Height Weight SOS(AOS-100) TI OSI SOS(L^S) TI(L^S) OSI(L^S) SOS(UBA575+) BUA
Foot length
Instep height
Foot volume
0.546a 0.252 ^0.114 0.107 0.059 ^0.277a ^0.123 ^0.162 ^0.167 ^0.137
0.239 0.377a ^0.324a ^0.085 ^0.147 ^0.248a ^0.191 ^0.233 ^0.244 ^0.123
0.351a 0.492a ^0.290a ^0.028 ^0.090 ^0.299a ^0.095 ^0.114 ^0.303a ^0.282a
a
Signi¢cant at p,0.01. SOS(L^S) is the di¡erence between SOS measured using a large platform and a small one, on the same subject.
The British Journal of Radiology, July 1999
695
696
SOS BUA
UBA575+
0.13 2.50
ö ö
0.15 2.12 2.12
0.13a 1.96 2.09 0.14 5.60
0.19 1.18a 1.89
Appropriate
Inappropriate
Appropriate
ö ö
0.23 1.49 2.36
Inappropriate
0.17 7.03
0.16 1.25 2.21
Appropriate
Group 3
SOS BUA
UBA575+
1.95 2.90 3.01 ö ö
5.13a 3.76b
Inappropriate
1.74 2.70b 2.66b
a
Appropriate
All
RMS SCV, root mean squared standardized coe¤cient of variation. a p,0.01 between SOS(AOS-100) and SOS(UBA575+). b p,0.05 between TI, OSI versus BUA.
SOS TI OSI
AOS-100
(b) RMS SCV (%)
RMS CV, root mean squared coe¤cient of variation. Appropriate and inappropriate refer to using the platform suitable or not suitable to the subject's foot length, respectively.
SOS TI OSI
AOS-100
Group 2
Group 1
Table 3. The short-term precision calculated according to the group studied and platform used (a) RMS CV (%)
ö ö
0.16 1.65 2.54
Inappropriate
0.15 4.27
0.15 1.66 2.16
Appropriate
All
ö ö
0.18 1.84 2.23
Inappropriate
E Tsuda-Futami, D Hans, C F Njeh et al
The British Journal of Radiology, July 1999
Short communication: Evaluation of a QUS device
(a)
(b)
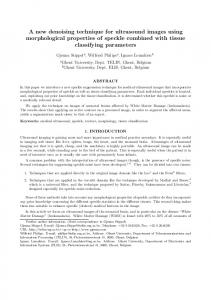
Figure 4. The relationship between SOS (L^S) and anthropometric parameters. (a) Foot length, (b) instep length and (c) foot volume. SOS (L^S) is the di¡erence between SOS measured using a large platform and a small one on the same subject.
(c)
standardization, the CV of SOS AOS-100 became superior to SOS of UBA575+. Long-term precision was poorer than short-term in all cases. In the long-term precision study, TI (3.41%) continued to outperform BUA (8.52%), but SOS measured with the UBA575+ (0.19%) was superior to the AOS-100 (0.41%). The CVs of the measurement using the inappropriate foot platform were slightly higher than when the appropriate platform was used, but these di¡erences were not signi¢cant (Table 3a).
Impact of the measurement locationösmall versus large platform Signi¢cant negative correlations were found between the di¡erences in SOS (SOS (L^S)) and all the anthropometric parameters (foot length p,0.0001, instep height p,0.05, foot volume p,0.05)) (Table 2). The scattered plot of SOS (L^ S) versus foot length was shown in Figure 4. Small SOS (L^S) were observed in large feet. The di¡erences in TI and in OSI did not show any signi¢cant The British Journal of Radiology, July 1999
correlation with anthropometric parameters. Therefore, these correlation results showed that the larger di¡erences in parameters were observed in subjects with the smaller anthropometric parameters, and small feet are more in£uenced by the difference of measurement location. The QUS results measured with the small platform were compared with those with the large one by paired t-test to understand whether the differences in the measurement points might a¡ect QUS readings. All QUS parameters measured with the small platform were found to be signi¢cantly smaller than those with the large platform (p,0.0001). The mean percentage di¡erences were 0.6% in SOS, 2.8% in TI and 4.3% in OSI, with the large foot platform giving larger results for all three variables. After separating subjects based on foot size, we found smaller di¡erences that tended not to be signi¢cant in the subjects with large feet while small footed subjects showed larger di¡erences between the two measurements locations. Maximum di¡erences for individuals were 1.5% for SOS, 11% for TI and 15% for OSI. 697
E Tsuda-Futami, D Hans, C F Njeh et al
(a)
(b)
Figure 5. Linear regression analysis for AOS-100 versus UBA575+. (a) SOS (AOS-100) versus SOS (UBA575+), (b) TI (AOS-100) versus BUA (UBA575+).
Impact of the platform on QUS parametersö appropriate versus inappropriate platform As the di¡erences in QUS results were larger in small foot size groups, and foot length and foot volume could discern the di¡erences, the correction with the platform based on foot length might be adequate. The di¡erences in results obtained using appropriate and inappropriate platforms were quanti¢ed using a paired t-test. The SOS and OSI measured with the appropriate platform were signi¢cantly di¡erent from those with the inappropriate platform (SOS, p,0.0001; OSI, p,0.01). A signi¢cant di¡erence was not observed in TI (p50.11). The dynamic ranges were greater in results with inappropriate platform than those with appropriate ones.
Correlation with UBA575+ Scatter plots of attenuation and velocity measured with the AOS-100 and UBA575+ are shown in Figure 5. A close relationship for SOS was observed (r50.89, SEE50.178). TI and BUA showed a similarly strong relationship despite the signi¢cant di¡erences in the de¢nitions of those parameters (r50.88, SEE50.0004).
Discussion We have investigated the performance of a new device for the ultrasonic evaluation of osteoporosis. This device introduces new concepts designed to improve the value of QUS measurements of the heel. The ¢rst is a choice of two foot platforms designed to position the transducers more accurately on the heel for small (22^25 cm) and large (.25 cm long) feet. The second is a new 698
parameter, the transmission index, which is related to BUA and which might have improved precision because of the method of calculation. We found short- and long-term precision of TI and OSI to be superior to that of BUA (UBA575+) while precision of SOS was similar with each device. The short-term precision error of BUA using UBA575+ in our study was slightly higher (CV54.3%) compared with other reports (2.8^4.0%) [26^28]. Because of the di¡erences in the scale and sensitivity of the various measurements, comparisons of reproducibility are best made with standardized coe¤cient of variation (SCV) results. We chose to standardize by the biological range of the parameter as measured in our study population [24, 26]. We found that SCV was also signi¢cantly better with the AOS-100 compared with the UBA575+. SCV of BUA measured in the current study was similar but inferior to that reported by others, 3.8% versus 3.1% [26]. OSI, the composite parameter which is proposed as an estimate of the elastic modulus, was found to have very good precision and compared well with the composite parameter of the Achilles (Lunar Corp., Madison, WI) called ``sti¡ness'' [26] (CV: 2.2% in OSI using AOS-100 versus 1.8% in sti¡ness using Achilles; SCV: 1.8% versus 2.0%, respectively). As measurement of CV and SCV is dependent on the population, this comparison can only estimate the relative performance of OSI and sti¡ness. The good precision of TI and OSI might be attributed to the algorithm of TI calculation but this cannot be con¢rmed. There are many determinants of precision in ultrasound and the bene¢t of TI calculation can only be determined by comparison of BUA and TI results obtained from the same measurements (i.e. the same received waveform). The British Journal of Radiology, July 1999
Short communication: Evaluation of a QUS device
The AOS-100 does not calculate BUA by the traditional method and the waveform is not available for retrospective evaluation. While the details of the computational methods of the various QUS device manufacturers are not known, at least one manufacturer (Metra) has chosen a version of the Burg algorithm for spectral estimation. This approach is supposed to have properties which are superior to the fast Fourier transform when analysing ¢nite signals with noise.The extent to which these alternative algorithms improve estimation of the ultrasound attenuation needs further investigation. To understand the in£uence of the ROI location on QUS readings and the impact of the two foot positioning platforms, readings with each platform were compared with the paired t-test. We found signi¢cant di¡erences in the results obtained with the small and large foot platforms even though the ROI overlapped by 74%. This is in contrast to the results of Brooke-Wavell et al [29] who found no di¡erence in BUA or SOS between a ¢xed and anatomical ROI. However, they did observe a large variance in the ¢xed ROI which they attributed to variation in the size and shape of the calcaneus causing the ¢xed ROI to be at di¡erent locations in di¡erent individuals [29]. Laugier et al also demonstrated that a small displacement (1^ 2 mm) in the ROI position could cause di¡erences in the measured BUA [30]. After separating subjects based on foot size, we found smaller di¡erences that tended not to be signi¢cant in the subjects with large feet while smallfooted subjects showed larger di¡erences between the two measurement locations. Thus, QUS readings in small feet seemed to be more a¡ected by the change in ROI location.This maybe explained by the transducers being positioned near the edge of the calcaneus where acoustic artefacts could in£uence the measurement. In subjects with large feet, there is more latitude in the positioning of the transducers before edge artefacts become a factor. Although generally not reaching statistical signi¢cance, shortterm precision calculated with the appropriate platform tended to be superior to the precision using inappropriate platforms for all parameters. The adjustment of measurement location seems to be particularly important in small feet. Other manufacturers have addressed the issue of ROI localization by developing QUS devices capable of imaging the heel and then positioning the ROI by either manual or automatic means [14, 31]. While this approach ensures proper ROI placement and has been reported to yield improved precision [14, 30, 31], these devices are more expensive, have longer imaging times and are less portable because the scanning mechanism makes the equipment larger and heavier. Another device with scanning transducers surveys the heel looking for anatomical landmarks then records a The British Journal of Radiology, July 1999
measurement within a region at a standardized location relative to these landmarks [32]. While no image is produced, this approach helps ensure that an anatomically consistent region is examined. Changing the foot positioning platform of the AOS-100 provides a simple way to adjust the ROI location for variation in foot size. A strong correlation was found between SOS measured with the AOS-100 and the UBA575+ (r50.89). However, there were signi¢cant di¡erences in the mean SOS, and the range of SOS values was larger with the AOS-100. These di¡erences result from the di¡erent de¢nition of SOS used by the two devices. As with SOS, a strong positive correlation was observed between TI and BUA measured with the UBA575+. This relationship between TI and BUA is expected. The heel acts as a low pass ¢lter of the ultrasound signal, preferentially attenuating the higher frequencies. When BUA is high, the higher frequencies are more strongly attenuated. In the time domain, this attenuation of the higher frequencies causes the peak of the waveform to broaden and the FWHM to increase. The strong correlation between TI and BUA is similar to the correlation between BUA measured by the UBA575+ and the CUBAClinical (McCue Ultrasound Systems, Ltd, UK) (r50.84) and between BUA measured by the UBA575+ and sti¡ness by Achilles [15]. The UBA575+ has been proven to predict hip fracture risk [8]. The high correlation between the QUS results of the AOS-100 and the UBA575+ suggest the AOS-100 will be e¡ective in assessing osteoporotic fracture risk. The ability of the AOS100 to discriminate subjects with osteoporotic fracture is being investigated.
Conclusion The newly developed AOS-100 parameters, TI and OSI, were found to be more reproducible than BUA (UBA575+). These parameters were highly correlated to the SOS and BUA as measured by the UBA575+. The importance of ROI location to precision and magnitude of the QUS parameters was demonstrated. Accurate localization of ROI could improve diagnostic capability and the ability to monitor change.
Acknowledgments One of the authors (ETF) is grateful for the ¢nancial support of Aloka company. We would also like to acknowledge the assistance of Vesta March and Mary Schoeman of the Imaging Centre at OARG in acquiring the data.We are grateful for the detailed comments of the referees and to David Breazeale (UCSF) for proofreading the manuscript. 699
E Tsuda-Futami, D Hans, C F Njeh et al
References 1. Genant HK, Engelke K, Fuerst T, Gluer CC, Grampp S, Harris ST, et al. Noninvasive assessment of bone mineral and structure: state of the art. J Bone Miner Res 1996;11:707^30. 2. Blake GM, Fogelman I. Technical principles of dual energy X-ray absorptiometry. Semin Nucl Med 1997; 27:210^28. 3. Gregg EW, Kriska AM, Salamone LM, Roberts MM, Anderson SJ, Ferrell RE, et al. The epidemiology of quantitative ultrasound: a review of the relationships with bone mass, osteoporosis and fracture risk. Osteoporos Int 1997;7:89^99. 4. Njeh CF, Boivin CM, Langton CM. The role of ultrasound in the assessment of osteoporosis: a review. Osteoporos Int 1997;7:7^22. 5. Cheng S, Tylavsky F, Carbone L. Utility of ultrasound to assess risk of fracture. J Am Geriatr Soc 1997;45:1382^94. 6. Hans D, Njeh CF, Genant HK, Meunier PJ. Quantitative ultrasound in bone status assessment. Rev Rhum Engl Ed 1998; 65:489^98. 7. Hans D, Dargent-Molina P, Schott AM, Sebert JL, Cormier C, Kotzki PO, et al. Ultrasonographic heel measurements to predict hip fracture in elderly women: the EPIDOS prospective study. Lancet 1996;348:511^4. 8. Bauer DC, Gluer CC, Cauley JA, Vogt TM, Ensrud KE, Genant HK, et al. Broadband ultrasound attenuation predicts fractures strongly and independently of densitometry in older women. A prospective study. Study of Osteoporotic Fractures Research Group. Arch Intern Med 1997;157:629^34. 9. Tavakoli MB, Evans JA. The e¡ect of bone structure on ultrasonic attenuation and velocity. Ultrasonics 1992;30:389^95. 10. Hans D, Arlot ME, Schott AM, Roux JP, Kotzki PO, Meunier PJ. Do ultrasound measurements on the os calcis re£ect more the bone microarchitecture than the bone mass?: a two-dimensional histomorphometric study. Bone 1995;16:295^300. 11. Gluer CC, Wu CY, Jergas M, Goldstein SA, Genant HK. Three quantitative ultrasound parameters re£ect bone structure. Calcif Tissue Int 1994;55: 46^52. 12. Thompson PW, Taylor J, Oliver R, Fisher A. Quantitative ultrasound (QUS) of the heel predicts wrist and osteoporosis related fractures in women age 45^75 years. J Clin Densitometry 1998;1:219^26. 13. Pocock NA, Noakes KA, Howard GM, Nguyen TV, Kelly PJ, Sambrook PN, et al. Screening for osteoporosis: what is the role of heel ultrasound? Med J Aust 1996;164:367^70. 14. Jorgensen HL, Hassager C. Improved reproducibility of broadband ultrasound attenuation of the os calcis by using speci¢c region of interest. Bone 1997;21:109^12. 15. Gluer CC, Consensus G. Quantitative ultrasound techniques for the assessment of osteoporosis: expert agreement on current status. J Bone Miner Res 1997; 12:1280^8. 16. Langton CM, Palmer SB, Porter RW. The measurement of broadband ultrasonic attenuation in cancellous bone. Eng Med 1984;13:89^91.
700
17. McCloskey EV, Murray SA, Charlesworth D, Miller C, Fordham J, Cli¡ord K, et al. Assessment of broadband ultrasound attenuation in the os calcis in vitro. Clin Sci (Colch) 1990;78:221^5. 18. Evans WD, Jones EA, Owen GM. Factors a¡ecting the in vivo precision of broad-band ultrasonic attenuation. Phys Med Biol 1995;40:137^51. 19. Strelitzki R, Evans JA. An investigation of the measurement of broadband ultrasonic attenuation in trabecular bone. Ultrasonics 1996;34:785^91. 20. Tokumaru H. Correlation of ultrasound measurement in the calcaneus and bone mineral densitometry of the spine in pediatric subjects [in Japanese]. Nippon Shounika Gakkai Zasshi 1997;101:1142^8. 21. Pain HJ. The physics of vibrations and waves. Chichester: Wiley, 1985. 22. Ashman RB, Corin JD, Turner CH. Elastic properties of cancellous bone: measurement by an ultrasonic technique. J Biomech 1987;20:979^86. 23. Nicholson PHF, Njeh CF. Ultrasonic studies of cancellous bone in vitro. In: Njeh CF, Hans D, Fuerst T, Gluer CC, Genant HK, editors. Quantitative ultrasound: Assessment of osteoporosis and bone status. London: Martin Dunitz, 1999:193^217. 24. Miller CG, Herd RJ, Ramalingam T, Fogelman I, Blake GM. Ultrasonic velocity measurements through the calcaneus: which velocity should be measured? Osteoporos Int 1993;3:31^5. 25. Gluer CC, Blake G, Lu Y, Blunt BA, Jergas M, Genant HK. Accurate assessment of precision errors: how to measure the reproducibility of bone densitometry techniques. Osteoporos Int 1995; 5:262^70. 26. Greenspan SL, Bouxsein ML, Melton ME, Kolodny AH, Clair JH, Delucca PT, et al. Precision and discriminatory ability of calcaneal bone assessment technologies. J Bone Miner Res 1997;12:1303^13. 27. Waud CE, Lew R, Baran DT. The relationship between ultrasound and densitometric measurements of bone mass at the calcaneus in women. Calcif Tissue Int 1992;51:415^8. 28. Salamone LM, Krall EA, Harris S, Dawson-Hughes B. Comparison of broadband ultrasound attenuation to single X-ray absorptiometry measurements at the calcaneus in postmenopausal women. Calcif Tissue Int 1994;54:87^90. 29. Brooke-Wavell K, Jones PR, Pye DW. Ultrasound and dual X-ray absorptiometry measurement of the calcaneus: in£uence of region of interest location. Calcif Tissue Int 1995;57:20^4. 30. Laugier P, Fournier B, Berger G. Ultrasound parametric imaging of the calcaneus: in vivo results with a new device. Calcif Tissue Int 1996;58:326^31. 31. Fournier B, Chappard C, Roux C, Berger G, Laugier P. Quantitative ultrasound imaging at the calcaneus using an automatic region of interest. Osteoporos Int 1997;7:363^9. 32. Cheng S, Ollikainen S, Goll J, Taa¡e D, Njeh C, Fuerst T, et al. The e¡ect of location on ultrasound of the calcaneus of normal early post-menopausal women. In: Ring EFJ, Elvins DM, Bhalla AK, editors. Current research in osteoporosis and bone mineral measurement V. London: British Institute of Radiology, 1998:60^1.
The British Journal of Radiology, July 1999