FORUM
An Inexpensive Immunomarking Technique for Studying Movement Patterns of Naturally Occurring Insect Populations VINCENT P. JONES,1 JAMES R. HAGLER,2 JAY F. BRUNNER, CALLIE C. BAKER, AND TAWNEE D. WILBURN Tree Fruit Research and Extension Center, Washington State University, 1100 N. Western Ave., Wenatchee, WA 98801
Environ. Entomol. 35(4): 827Ð836 (2006)
ABSTRACT An immunomarking system useful for determining insect movement patterns was developed that allows the marking of naturally occurring populations of insects within large areas with inexpensive and readily available proteins that can be applied using standard spray equipment. Enzyme-linked immunosorbent assay (ELISA) protocols were developed to detect chicken egg albumin (as egg whites), bovine casein (as cowsÕ milk), and soy protein (as soy milk) at levels ⱕ30 ppb. Field applications showed that all of the proteins were stable and detectable at high levels on apple leaves at least 19 d after application. When adult pear psylla (Cacopsylla pyricola Foerster, Homoptera: Psyllidae) walked across apple leaves with Þeld-aged residues of the marker proteins plus either Sylgard 309, EDTA, or both, they acquired the mark over the 19-d test period an average of 78.9, 19.4, and 2.1% of the time for egg whites, milk, and soy milk, respectively. Two Þeld applications of the three markers were applied to an apple orchard during the Þrst generation ßight of codling moth (Cydia pomonella L., Lepidoptera: Tortricidae). We found that 46.5% of moths captured within a 2.8-ha area (including 1.6-ha surrounding the treated areas) tested positive for at least one of the three proteins. The marker systems developed cost between $0.12 and $0.26liter versus older immunomarkers (using puriÞed vertebrate IgG) that cost roughly $500/liter. KEY WORDS immunomarking, insect dispersal, mark-capture
Studies of insect dispersal in different ecosystems have relied on a variety of methods to determine movement patterns. Typically, marked insects are released from a limited number of sites, and traps of some sort are used to map their movement patterns. Marks that have been used include ßuorescent powders (Schroeder and Mitchell 1981, Jones and Parrella 1986), rare (trace) elements (Akey et al. 1991), radioisotopes (Service 1993), internal or external dyes (Van Leeuwen 1940, Steiner et al. 1965, Hendricks and Graham 1970), and insect mutilation (e.g., punctures of an elytra) (Murdoch 1963). The marks are applied to laboratory-reared or Þeld-collected insects depending on the particular study. While each of the marking and collecting methods has advantages and disadvantages (Southwood and Henderson 2000, Hagler and Jackson 2001), all of these studies typically use the dispersal of a relatively small portion of the population from a few release points to extrapolate the population level movement patterns. A large increase in our understanding of movement patterns would become possible if a large number of wild insects could be marked directly in the Þeld and, further, if several different 1
Corresponding author, e-mail:
[email protected]. USDAÐARS Western Cotton Research Laboratory, 4135 E. Broadway Rd., Phoenix, AZ 85040. 2
marks were available that could be used to track interarea movement. In agriculture, large-scale marking is particularly important for studies of biological control and mating disruption, both of which often require large areas (⬎1Ð2 ha) for optimal research results. The development of the enzyme-linked immunosorbent assay (ELISA) mark detection technique (Hagler et al. 1992, Hagler 1997, Hagler and Jackson 1998) solved many of the problems associated with other marking methods. This technique uses commercially available protein-speciÞc antibodies used in an ELISA to detect a speciÞc vertebrate protein mark (rabbit or chicken IgG), which has been applied externally as a spray or internally by incorporating it into the insectsÕ diet (Hagler 1997). This technique is simple, rapid, and sensitive. In addition, the equipment needs are relatively modest, and it uses nontoxic chemicals. To date, the major limitation of this technique has been the cost of the puriÞed protein marks ($30 Ð50/g). For example, a dose of IgG marker used by Hagler (1997) costs about $500/liter, making it impractical for use in large-scale markÐ capture type studies. The cost has thus restricted the use of this technique to markÐreleaseÐrecapture type studies (e.g., marking a relatively small number of insects in
0046-225X/06/0827Ð0836$04.00/0 䉷 2006 Entomological Society of America
828
ENVIRONMENTAL ENTOMOLOGY
the conÞnes of the laboratory before release) (Hagler et al. 2002, Hagler and Naranjo 2004). In this paper, we present a low-cost alternative to the use of vertebrate IgG proteins for markÐ capture studies of insects. The ELISA systems we developed use low cost and easily obtainable crude food proteins: soy (as soy milk), bovine casein (as cowsÕ milk), and chicken egg albumin (as chicken egg whites). We also conducted studies on the effects of different water sources used to dilute the marks on ELISA sensitivity and the longevity of the marker proteins in the environment. In addition, we present data on the ability of a representative insect (pear psylla, Cacopsylla pyricola Foerster Homoptera: Psyllidae) walking across a dried protein-marked leaf surface to acquire the mark and present a simple Þeld-level movement study with codling moth, Cydia pomonella L. (Lepidoptera: Tortricidae) to show proof of concept. Materials and Methods Assay Development. We developed three proteinspeciÞc ELISAs using commercially available antibodies for soy protein (R 45254; R-Biopharm, South Marshall, MI), chicken egg albumin (C6534; SigmaAldrich, St. Louis, MO), and bovine casein, a protein found in cowsÕ milk (PAB20025S; Biodesign International, Saco, ME). The secondary antibodies used for the soy and chicken egg albumin assays were donkey anti-rabbit IgG (H ⫹ L) with a peroxidase conjugate (31458; Pierce Biotechnology, Rockford, IL) and for the casein assay was a donkey anti-sheep IgG (whole molecule) peroxidase conjugate (A3415; Sigma-Aldrich). The proteins (antigens) applied to the Þeld were Silk Organic Soy Milk Plain (White Wave, Boulder, CO), MGW Brand frozen pasteurized egg whites (M. G. Waldbaum, WakeÞeld, NE), and either whole or nonfat milk. In laboratory studies, we often used All Whites (Papetti Foods, Elizabeth, NJ) instead of the MGW egg whites because it was available in small size packages (0.45 versus 13.6 kg), and both protein sources performed similarly in the ELISAs. Immunoassays were all performed as indirect ELISAs (Crowther 2001). All incubations, unless otherwise speciÞed, were performed at 37⬚C on dry block microplate heaters. Individual insects were placed in tubes containing 1 ml tris-buffered saline (TBS, pH 8.0; T-664; Sigma-Aldrich), to which 0.3 g/liter sodium (tetra) ethylenediamine tetra acetate (EDTA; S657; Sigma-Aldrich) was added. For codling moths, we placed a wooden coffee stirrer (00310; Alltrista Consumer Products, Muncie, IN) in the tube to keep them submerged in the buffer for 3 min. The moths were discarded to minimize the amount of extraneous protein removed from their bodies that might bind competitively to the plate and reduce our ability to detect the desired proteins. When pear psylla were used, we washed them using 1 ml buffer for 3 min as well. All buffer solutions were prepared in water that was Þltered, deionized (⬎18 M⍀ cm), and distilled using a Barnstead Fi-streem III glass still (Barstea International, Dubuque, IA) or obtained from an Elga Purelab
Vol. 35, no. 4
UHQ ultra pure water system (Elga LabWater; U.S. Filter, Lowell, MA). For ease of description, these sources will be referred to as “type I” lab water henceforth. An 80-l aliquot of each insect sample was transferred via pipette into individual wells of a 96-well microplate (Nunc Polysorp; Nalge Nunc, Naperville, IL). After the samples incubated for 2 h, the contents of each well were discarded. For the soy assay, the wells were washed three times with 300 l phosphate buffered saline (PBS; P3813; Sigma-Aldrich) containing 2.3 g/liter sodium dodecyl sulfate (SDS; L-4509; Sigma-Aldrich) (PBS-SDS), followed by two washes with 300 l PBS. For the egg and milk assays, wells were washed Þve times with 300 l PBS ⫹ 0.09% Triton-X100 (37426; MP Biomedicals) (PBST). Wells then received 300 l of blocker solution. For the soy assay, we used StartingBlock (37538; Pierce Biotechnology) for the blocker and antibody diluents. For the egg assay, the blocker and the secondary antibody diluent was StartingBlock, and the primary antibody was diluted in StartingBlock ⫹ 1300 ppm Silwet L-77 (Helena Chemical, Memphis, TN). The blocker for the casein assay was 10% ethanolamine (151078; MP Biomedicals) in PBS, the primary antibody was diluted in 20% bovine serum (B-9433; Sigma-Aldrich) in PBS ⫹ 1300 ppm Silwet, and the secondary antibody was diluted in StartingBlock. After blocking for 1 h, the wells were washed once with 300 l PBST, and 80 l of primary antibodies, diluted appropriately, were added (all antibody dilutions were determined using a checkerboard titration assay; Crowther 2001). For the casein ELISA, primary incubation was 1 h; for the chicken egg albumin and soy ELISAs, the incubation time was 30 min. The antibodies were discarded, and the wells were washed Þve times with 300 l PBST before 80 l/well of secondary antibodies was added. Secondary antibody incubation lasted for 2 h. After incubation, the secondary antibody was discarded, and the wells were washed three times with 300 l PBS-SDS followed by two 300 l PBS washes. Afterward, 80 l of TMB (ImmunoPure Ultra TMB substrate kit 34028; Pierce Biotechnology) was added to each well, and the plate was placed on a rotary shaker and incubated in the dark at room temperature for 5Ð20 min, depending on the assay. After incubation, 80 l of 2 N H2SO4 was added to each well to stop the reaction, and the optical density (OD) of each well was read with a dual wavelength plate reader (Emax plate reader; Molecular Devices, Sunnyvale, CA) at 450 nm using 490 nm as the reference standard. All readings were corrected (blanked) using wells with TBS ⫹ EDTA extraction buffer and no antigen present. The OD values range from 0 to 4, with higher numbers indicating the darkest color and highest concentration of antigen detected. Sensitivity of the Assays. The limit of detection for each assay was calculated using a serial dilution of antigen starting at 1 ppm and ending at 1.9 ppb. The detection limit was deÞned as the concentration of antigen where all samples (n ⫽ 8) of a given dilution were higher than the mean plus 4 SD of the TBS ⫹
August 2006
JONES ET AL.: LARGE-SCALE IMMUNOMARKING
EDTA control. We tested soy milk (Silk organic soy milk plain), soy ßour (Organic Soy Flour; Arrowhead Mills, Boulder, CO), liquid egg whites (All whites), powdered egg whites (Just Whites; Deb El Food, Elizabeth, NJ), Lucerne whole milk (Safeway, Tempe, AZ), and Nestle´ Carnation instant nonfat dry milk (Nestle´ USA, Solon, OH). Effect of Water Used to Dilute the Antigen. A key difference from the assays used by Hagler et al. (1992) and Hagler (1997) for immunomarking and our assays is that in the former, a highly speciÞc antigen (chicken or rabbit IgG), was diluted in buffer to serve as a mark. That solution was applied either to diet, where it was consumed and acted as an internal mark, or directly to the insect, where it acted as an external mark. In contrast, because we are marking the insects naturally occurring within a large area (by either direct contact or by allowing them to pick up the mark from the substrate), we used a crude and relatively cheap antigen, diluted it in water of highly variable quality, and applied it using an airblast sprayer. Thus, for our studies, it was critical to ascertain the effect of water quality on the ELISA reactions used to detect the marker proteins. To determine the effect of the water quality on assay sensitivity we obtained water samples from several test areas in midsummer 2004. The water sources tested included the following: type I lab water, tap water from our laboratory faucets, tap water from the USDA-ARS facility in Wapato, WA, and irrigation water from four locations: (1) the Tree Fruit Research and Extension Center (TFREC) in Wenatchee, WA, (2 and 3) commercial orchards in Quincy and Mattawa, WA, and (4) an experimental orchard run by USDA-ARS in Moxee, WA. Water sources were checked by diluting the markers to 1 ppm in water from the different sources and comparing the resulting ELISA readings. Eight replicates per water type were analyzed. In the same experiment, we also tested additives to determine if we could improve ELISA sensitivity affected by water quality. Because the TBS buffer is made using type I lab water to which multiple salts are added (e.g., KCL, NaCl, Tris), we added 1 g/liter of salts (either NaCl or CaCl2) or a water softener (0.3 g/liter EDTA, A-RAYWST-AA0-1x1.25GL; Pace International, Seattle, WA). Although not used in our buffer solutions, CaCl2 is a common minor nutrient spray additive commonly used in apple orchards that has minimal phytoxicity. It was included because ionic strength of the solution may have been a factor in water quality that could positively or negatively affect assay sensitivity (Crowther 2001). Each marker solution was tested with each of the three additives using eight replicates per water type. Tendency for Antigens to be Washed Off. We tested the tendency of the different marker antigens to be washed off leaves in the laboratory. Apple leaves were dipped for 3 s in 50,000 ppm (5% solution) milk or soy milk solutions or a 20,000 ppm (2%) chicken egg white solution mixed in laboratory tap water and left in a fume hood to dry at 27⬚C. The concentration of each
829
marker antigen used was lower than typically used in the Þeld (e.g., 10 Ð20% solutions) to simulate an aged residue. We decreased the dose applied because pilot studies showed no differences were found between washes when the full rate solutions were used; all the results were the maximum OD reading (4.0). After drying, a 7-mm leaf disc was taken from each leaf using a cork borer. Using forceps, the leaf disc was dipped into a 1.5-ml microcentrifuge tube containing 1 ml of TBS for 5 s, removed, and gently dried on a paper towel; then it was dipped in a second tube for 20 s, removed, and dried as above. Finally, the leaf disc was placed into a third tube where it was agitated with a vortex mixer for 60 s and discarded. This was repeated for six leaf discs per antigen solution. The ELISA protocols described above were used to determine the protein levels in each of the different washing regimes. Residual Activity in the Field. We tested the ability of insects to pick up the mark by walking on dried protein residues. To test this, we applied the various marking antigens separately to three to Þve young ÔGolden DeliciousÕ apple trees (⬇1.5 m tall) located at the Wenatchee Valley College experimental orchard in East Wenatchee, WA. The proteins were applied on 25 May 2005 at ⬇1.9 liters/tree with a backpack mist blower (Solo, Newport News, VA). We tested four different treatments per protein to determine if additives could help increase the longevity and uptake of the mark by insects walking over a leaf surface. The treatments were as follows: (1) the protein alone (20% solution diluted in tap water for soy and milk and 10% for egg), (2) the protein ⫹ EDTA (0.3 g/liter), (3) the protein ⫹ 1,500 ppm Sylgard 309 (Wilbur-Ellis, Fresno, CA), and (4) the protein ⫹ EDTA ⫹ Sylgard 309. We also tested the effect of applying soy ßour and powdered milk (no additives for either) using a handapplied duster (Dustin-Mizer; Professional Pest Products of Pensacola, Pensacola, FL). Leaves from all treatments were collected at 2, 6, 8, 12, 15, and 19 d after treatment, brought to the laboratory, and assayed by ELISA and bioassayed for availability of the mark to a test insect. In the laboratory, a 7-mm-diameter leaf disc was removed with a cork borer from eight randomly chosen leaves from the treated trees. Four of the discs were placed for 3 min in a microcentrifuge tube containing 1 ml TBS ⫹EDTA buffer. The other discs were used to examine the tendency of the residue to be washed off using the same methods described above (5-s wash, 20-s wash, and a 60-s agitated wash). After the discs were removed, the leaves were placed in two 0.5-liter plastic containers (catalog number 041165; Solo Cup, Highland Park, IL). We added two to four leaves to each container from their respective treated trees, enough to completely cover the inside of the container. Pear psylla adults were collected from pear trees at the WSU-TFREC using a beating sheet and aspirator. Eighteen psylla were added to each container (containers representing each of the protein treatments), and one set was placed on control leaves (not treated with the protein). After 24 h, the psylla were removed from the leaves and assayed by ELISA for the presence of the
830
ENVIRONMENTAL ENTOMOLOGY
Vol. 35, no. 4
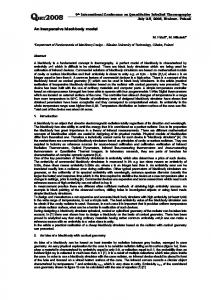
Fig. 1. Plot design used in the apple orchard where interplot movement of codling moth was shown. Numbers indicate trap position in each plot. Areas X1, X2, Y1, and Y2 were not treated with markers.
respective proteins. Pear psylla were used as the test insect because they rarely feed on apple leaves, and because they were readily available. Because we only tested buffer that washed the exterior of the psylla (i.e., no grinding was involved), we could be sure that any psylla that acquired the mark did so by contact with the treated surface. Marking in Large-Scale Applications. A large-scale Þeld study was conducted within a 3.6-ha block of a 72-ha commercial orchard in Quincy, WA, to determine our ability to mark naturally occurring codling moth adults. The block was divided so that we had seven 0.4-ha (37 by 121 m) plots, each separated by two tree rows (16.5 m; Fig. 1). The central area was treated with egg whites (10% ⫹ 0.3 g/liter EDTA), the adjacent plot to the east was treated with milk (20% ⫹ 0.3 g/liter EDTA), and the adjacent plot to the west was treated with soy milk (20% ⫹ 0.3 g/liter EDTA); the other plots were untreated. All treatments were applied using a Pak-blast airblast sprayer (Rears Mfg., Eugene, OR) at a rate of 1,380 liters/ha. The Þrst application was applied on 20 May at 148 codling moth degree-days when roughly 25% of the moths had emerged (Beers et al. 1993). The three markers were reapplied on 2 June at 350 DD when roughly 70% of the moths had emerged. The entire block was under normal mating disruption for codling moth control and acetamiprid (Assail 70 WP at 112.8 g [AI]/ha; Cerexagri, King of Prussia, PA) ⫹ 1% horticultural oil sprays for codling moth control were applied on 28 May (461 DD) and 12 June (665 DD) (Smith et al. 2005). Codling moth (Cydia pomonella L.) (Lepidoptera: Tortricidae) pheromone traps (Suterra, Bend, OR) were baited with CM-DA combo lures [a combination of codlemone and ethyl (2E, 4Z)-2,4-decadienoate; Trece, Adair, OK] in all areas. Before use, the excess sticky material on the trap liners was removed using a putty knife to minimize sticky material on the body of the moth. Traps were placed evenly throughout the
area and spaced as shown in Fig. 1. Nine traps were placed in each plot, and the trap liners were collected at 8 and 14 d after each marker treatment. The date and trap location where each moth was captured were recorded, and moths were processed and assayed for all three markers as described above. This allowed us to determine the percentage of moths collected in each area that were marked with each of the markers as well as which moths scored positive for multiple marks. Analysis. In all the studies, samples were considered marked if the ELISA OD readings were 4 SD above the mean of unmarked control insects or leaves (⫽positive threshold). This is conservative compared with methods that use 3 SD (Crowther 2001) but provides more protection against false positives. We felt the increased false-positive protection was useful because we were more concerned with falsely declaring an unmarked insect to be marked than the converse. In the Þrst case, we greatly overestimated movement, and in the second, we might underestimate movement. Regardless, for most of the assays, the positively marked insects are considerably above the positive threshold, and the difference is really affecting only lightly marked individuals. The experiments on the effect of different water sources on ELISA sensitivity and the residual marking of leaves required multiple plates to process all the treatments and replicates. Because there is some variability among ELISA plates, and because the samples were often run on different days, we needed to correct for this variation before comparing the ELISA OD between the different treatments. This was performed by calculating the average positive standard for all plates (of a particular marker antigen) in the experiment and devising a simple multiplicative correction factor for each plate that would bring the positive standard on that plate to the average of all plates. For example, if the positive control on a plate is 90% of the average, the correction factor is 100/90 or 1.11. This
August 2006
JONES ET AL.: LARGE-SCALE IMMUNOMARKING
correction factor was applied to all the sample values on that plate before analysis. For the study on the effects of water quality on assay sensitivity, we used a multiway analysis of variance (ANOVA) with assay, water source, additive, and interactions tested (SAS Institute 2002). The least signiÞcant difference (LSD) at P ⫽ 0.05 was used for mean separation. Analysis for the residual acquisition of the mark using pear psylla was performed using heterogeneity 2 with categories of treatment and marking (e.g., for the four egg marker treatments [egg alone, egg ⫹ EDTA, egg ⫹ Sylgard, egg ⫹ Sylgard ⫹ EDTA] ⫻ 2 marking categories [marked or unmarked]) for each date. Heterogeneity 2 was used because it tests whether the mark acquisition across treatments might represent samples from a single population (Little and Hills 1978). If homogeneity was detected, the average mark acquisition, taken by pooling the results from all treatments, would be the best estimate of marking. However, if heterogeneity was detected, individual treatments were tested for departure from the average ratio using multiple 2 by 2 2 tests with 1 df. When 1 df comparisons were made, the Bonferroni adjustment for the number of comparisons were made to ensure results were signiÞcant (Klockars and Sax 1986); all P values reported from 1 df comparisons are so adjusted. The results were summarized in graphical form using a bar chart with a horizontal line showing the average across treatments for a particular date and signiÞcant differences are indicated by asterisks (*P ⱕ 0.05, **P ⱕ 0.01). For the large-scale marking studies, we determined the percentage of male moths that were marked over the entire experiment with the different markers. Because we knew the number of moths was likely to vary between the different plots, we used 2 by 2 2 contingency tables to test moth movement patterns for each marker separately. The analyses were run by adding the total number of marked moths collected in the two adjacent plots to the east or west of the marker-treated area and compared with the total number of unmarked moths in those same plots. The numbers used in the analysis were corrected for the plot that the moths originally started in by assuming individuals with multiple marks that were collected in a plot originated in the plot furthest from the recovery plot. For example, if a moth marked with both soy and egg was collected in the milk plot, it was recorded as originating in the soy area because that site is most distant from the milk plot (Fig. 1). If a moth had only one mark, it was assumed to have originated in the area treated with that marker. In one instance, a moth caught in the central plot marked with egg also contained soy and milk marks. The origin of this individual could not be ascertained so it was eliminated from the analysis. Results Assay Sensitivity. The limit of detection for the soy assay was 1 ppb for both soy ßour and soy milk, with
831
Fig. 2. Effect of water sources used to dilute the antigen and additives on the sensitivity of ELISA assays: (A) egg assay, (B) casein assay, (C) soy assay. Bars within a water source with different letters indicate differences at P ⬍ 0.05 using the LSD test after ANOVA.
positive threshold values of 0.008 and 0.055 for soy ßour and soy milk, respectively. The egg albumin assay detected liquid egg whites down to 7.8 ppb and powdered egg whites to 1.9 ppb, with positive threshold values of 0.013 and 0.012, respectively. The casein assay was able to detect powdered nonfat milk down to 7.8 ppb and whole milk to 31.2 ppb, with positive threshold values of 0.014 and 0.026, respectively. Effect of Different Water Sources on Assay Sensitivity. All of the assays were affected to some degree by the different water sources (Fig. 2AÐC). ANOVA showed that there was a signiÞcant effect of water source, additive, and the interaction for all three assays. This meant that each water type had to be tested separately for the effects of the different additives. The egg assay was best with EDTA (six of seven waters) and the no additive treatment was a poor second (Fig. 2A). For the casein (milk) assay, the addition of EDTA always resulted in the greatest sensitivity, with NaCl being a poor second (Fig. 2B). For the soy assay, either the no additive treatment (four of
832
ENVIRONMENTAL ENTOMOLOGY
Vol. 35, no. 4
Table 1. Average ELISA OD values for leaf discs treated with different antigens and washed sequentially for 5, 20, or 60 s with agitation
Antigen
Average ELISA ODa
Wash time (s)
Treated leaves
Untreated leaves
5 20 60
3.828 (0.113) 2.884 (0.466) 0.862 (0.738)
⫺0.001 (0.000) ⫺0.001 (0.000) ⫺0.001 (0.000)
5 20 60
1.183 (0.0315) 0.858 (0.161) 0.505 (0.115)
0.008 (0.002) 0.002 (0.000) 0.003 (0.000)
5 20 60
1.409 (0.491) 1.036 (0.281) 3.146 (0.310)
0.001 (0.000) 0.002 (0.002) 0.003 (0.001)
Egg whites
Soy milk
1 ppm antigen in TBS 3.994 (0.000)
1.982 (0.072)
Milk
1.365 (0.049)
a Average ELISA OD followed by 1 SEM in parentheses. All values are corrected using TBS ⫹ EDTA negative controls.
seven waters) or EDTA (best in three of seven, second best in the other four waters) was superior (Fig. 2C). Tendency for Antigens to be Washed Off. The egg and soy markers both showed similar patterns with the successive washes: the initial 5-s wash had the highest antigen concentration, the 20-s wash was intermediate, and the 60-s wash was lowest (Table 1). This suggests that both the egg and soy markers are water soluble and that they may redistribute on the leaf if rainfall is light, but wash off if rainfall is heavy or continuous. The milk marker had a different wash-off pattern, with the Þrst wash having a large amount of marker present, the second wash having 73.5% of the 5-s wash, and the last wash (60 s) recovered 2.2-fold more antigen than the initial 5-s wash. This pattern suggests some of the mark is readily soluble, but at least a portion is more persistent so that the milk marker likely has a greater rain-fastness than either the egg or the soy markers. Residual Activity in the Field. For the liquid sprays, all but one leaf disc tested throughout the experiment (all dates) were positive for the presence of the markers. The single exception was a leaf disc treated with soy. In that case, the 5-s wash and 20-s wash were below the positive threshold; however, when extracted for 60 s with agitation, it read 2.1-fold higher than the positive threshold and scored as positive. Because all leaf samples were positive, no analysis was performed. Examination of the average OD for each marker on each date over all the different treatment combinations showed different patterns after 1.5 mm of rainfall occurred 12 d after treatment (Fig. 3). The leaves marked with soy had the highest OD through day 8, dropped on day 12, and decreased to roughly 1.5 at 15 and 19 d. Initially, the egg and milk markers responded similarly to each other; the average OD began high, dropped to a lower level, and then increased. At day 12, the OD of the egg marked leaves declined slightly, but increased over the remainder of the experiment.
Fig. 3. OD of leaves averaged over all additives for each antigen throughout the experimental period at Wenatchee Valley College in June 2005. A total of 1.5 mm rain fell 12 d after application. Error bars are ⫾SEM.
The OD of milk treated leaves declined slightly after day 12, but were still above an OD of 2.4, even by 19 d after treatment. The high activity at 19 d after treatment for all the markers strongly suggests that they are stable under normal environmental conditions. The leaves from the powdered milk and soy ßour treatments were marked at a much lower level, as determined by the OD readings, than the liquid milk and soy milk treatments. However, in the soy ßour treatment, only one leaf disc on day 19 scored negative, so its performance was similar to the soy milk applications. However, the powdered milk treatment resulted in 100% marking only on days 2 and 6, dropped to 75% on days 8 and 12, and further declined to 50% marking on days 15 and 19. Because our assay sensitivity studies showed that powdered milk had a higher sensitivity and soy ßour the same sensitivity as the liquid forms when applied at the same dose, the differences probably reßect the effect of weathering (in particular, rain and wind) and the less uniform initial application obtained with the powdered forms. Overall, the percentage of psylla acquiring the mark by walking across the egg residues was higher than psylla walking across either the whole milk or the soy milk residues (Fig. 4AÐC). Except for two psylla on day 2, psylla walking on any of the egg residue treatments were 100% marked up to 8 d after treatment (Fig. 4A). On day 12, ⬇1.5 mm of rain fell, and the percentage of psylla marked declined slightly on that day for all treatments, but by day 15, the average percentage marked had decreased roughly in half. For the egg ⫹ Sylgard 309 treatment, there was a rebound in the percentage marked 19 d after application, but the egg alone treatment continued to decline, whereas the egg ⫹ EDTA and egg ⫹ EDTA ⫹ Sylgard 309 remained roughly the same. Over all dates, the percentage of psylla marked was egg ⫹ EDTA ⬎ egg ⫹ Sylgard 309 ⬎ egg ⬎ egg ⫹ EDTA ⫹ Sylgard 309, although the differences between the latter three were minor (Fig. 4A). The percentage of psylla scoring positive for milk was roughly 3- to 4-fold lower overall compared with the egg marker (Fig. 4B). The percentage of psylla
August 2006
JONES ET AL.: LARGE-SCALE IMMUNOMARKING
Fig. 4. Percentage of pear psylla marked with a particular marker when conÞned on Þeld-aged leaves at different times after application: (A) egg-treated leaves, (B) milk-treated leaves, (C) soy milkÐtreated leaves. Solid lines indicate the average across all treatments within a date. *SigniÞcant differences at ␣ ⫽ 0.05 and **signiÞcant difference at ␣ ⫽ 0.01, both using Bonferroni adjustment.
marked when placed on 2-d-old residues was very low for all treatments, but the percentage increased markedly by days 6 and 8 before generally dropping after
833
that point in time. This is somewhat surprising considering that the average leaf OD was high initially, dropped during the 6- and 8-d samples and later increased (Fig. 3). Over all dates, there were no significant differences in the percentage of psylla acquiring the mark between the different milk treatments (Fig. 4B). In stark contrast to the other two markers, psylla placed on the leaves with soy residues were typically unmarked (Fig. 4C), with ⬍5% marked overall in any treatment. Because of the low number of psylla acquiring the mark in all treatments, the 2 analyses (even on the pooled data) all had ⬎20% of the cells with a frequency ⬍5 and no analyses were performed. The maximum percentage marked was 16.3% (with soy ßour on day 19), but there was no systematic change in either the percentage marked or the average OD of psylla over time. This is interesting because the leaf samples (Fig. 3) showed that the leaves were all marked at extremely high levels. Despite this, psylla walking on the soy residues showed a very limited ability to pick up enough soy protein to be classiÞed as being marked. The percentage of psylla marked was extremely low with no differences between any of the treatments. Marking in Large-Scale Applications. Overall, 187 moths were trapped during the experimental period. Of these, 87 (46.5%) were marked with at least one of the markers (Table 2). Of the 87 marked individuals, 28 (32.2%) were marked with two markers, and two (2.3%) were marked with all three markers (Table 2). As expected, there was variation in the number of moths caught throughout the different plots. The total number of moths (marked or unmarked) caught was lowest in the eastern end where only 12 and 9 moths were caught in Y1 and Y2, respectively. Moth catch in the X1, soy, egg, and milk areas were all roughly between 30 and 40 moths. At the far west of the plot, 22 moths were caught in X2. The correction for origin of the different marked moths showed that there was a noticeable difference in the efÞciency of the different markers (Table 3). For example, the percentage of moths caught in the area treated with egg whites that originated in that area (i.e., that were positive for the egg marker alone)
Table 2. Summary of moth catch by plot and detection of the different protein markers in the large-scale marking exp in Quincy, WA, May–June 2005 Marker detected Egg Soy Milk Egg ⫹ soy Egg ⫹ milk Soy ⫹ milk Total 2 markers All 3 None Total moths captured
Plot X2
X1
Soy
Egg
Milk
Y1
Y2
1 8 5 0 0 3 3 0 11 22
1 2 2 0 0 2 2 0 34 37
6 7 4 1 0 1 2 0 24 39
33 3 6 2 5 1 8 0 3 37
8 7 16 3 5 4 12 2 12 31
1 0 2 0 1 0 1 0 10 12
1 2 0 0 0 0 0 0 6 9
Plot X2 is the farthest west plot in the experiment.
Total 51 29 35 6 11 11 28 2 100 187
Percent marked moths 58.6 33.3 40.2 6.9 12.6 12.6 32.2 2.3
834 Table 3. marks
ENVIRONMENTAL ENTOMOLOGY
Vol. 35, no. 4
Marked moths captured in the different plots in Quincy, WA, corrected for area of origin by use of individuals with multiple
Area of moth origin Egg Soy Milk Total moths marked Total moths collected
Plot X2
X1
Soy
Egg
Milk
Y1
Y2
Total marked
1 5 5 11 22
1 0 2 3 37
6 5 4 15 39
26 3 5 34 37
5 7 7 19 31
1 0 1 2 12
1 2 0 3 9
41 22 24 87 187
was 70.3% (26/37), but the percentage caught in the soy and milk marked areas marked only with their respective antigen was 12.8 (5/39) and 22.6% (7/31), respectively. This discrepancy is likely caused by the differences in the ability of an insect to acquire the different markers simply by walking on a dried residue. In our residual study above, it was clear that egg ⬎ milk ⬎ soy for the psylla model, and these percentages suggest the same for codling moth. The 2 analyses showed that there were no significant differences in the eastÐwest distribution of moths between those that were marked or unmarked (egg: 2 ⫽ 0.635, P ⫽ 0.43; milk 2 ⫽ 0.89, P ⫽ 0.34; soy: 2 ⫽ 1.18, P ⫽ 0.28; all 1 df). Discussion The soy, egg whites, and casein markers can dramatically expand the use of the immunomarking method because these marker proteins are readily available in large quantities and are much cheaper than the previously used chicken and rabbit IgG markers. In addition to marking insects in a small conÞned area (i.e., markÐreleaseÐrecapture type studies), these markers can be applied directly in the Þeld for markÐ capture types of studies on the naturally occurring populations within an area. When used in the latter fashion, many factors must be considered in design and when analyzing the results. For example, if applied as a liquid, the water quality and spray additives directly affect the sensitivity of the subsequent ELISA reaction as well as the ability of the marker solution to wet the hydrophobic leaf surface or stick to the insect. Stability of the mark over time was not tested on insects in our study, but analysis of leaf samples showed that the three markers are detectable at high levels for at least 19 d after application (Fig. 3). Moreover, IgG markers (Hagler 1997), nonfat dry milk, and chicken egg white (J.R.H. and V.P.J., unpublished data) markers applied to insects in cotton Þelds are retained on a wide variety of arthropods for weeks after application at temperatures much higher than found in our studies. The mark may be reduced by insect grooming or wind (if used as a dust), or by molting (Hagler and Miller 2002), rainfall, or overhead irrigation. However, for many ecological studies, the 2- to 3-wk longevity of the mark is more than sufÞcient. Our data did reveal differences between the three markers with regard to the ability of the psylla to acquire the mark by walking across a dried residue. In particular, a low percentage of the insects that walked
Percent total marked from area 63.4 22.7 29.2
across soy residues acquired the mark, suggesting the available residue is idiosyncratic to each protein and its formulation (e.g., whether it ßakes off or dries to particles). These differences in residual marking confound analyses of Þeld data, but they can be minimized by choice of marker dose (V.P.J., unpublished data) or by correcting for multiply marked individuals. Our dose studies show that lowering the dose applied dramatically lowers the numbers of the test insects acquiring the mark when they walk across the dried residue. This seeming problem actually provides an opportunity: by lowering the dose, we may mark only individuals that are contacted by the spray, not those walking across the dried residue. This approach still allows marking a large portion of the population (if spray coverage is good) because of the extreme sensitivity of the assays (for example, a 1% solution is ⬎1,000,000 times higher than our detection limit), and it also allows the mark to be applied as a timed pulse of marking. If we wish to mark the insects that enter an area after the spray has been applied, the egg marker (and to a lesser extent, the casein marker) can be used at higher doses. However, using the residual marking method increases the cost 10- to 20-fold because of the larger amounts of marker required. Although the cost per liter of any of the mixed markers is quite low ($0.14, $0.26, or $0.12 for the rates of 20% milk, 20% soy, and 10% egg at current prices), when applying 1,380 liters/ha or more, the differences are signiÞcant when larger plots are used or if the plots require multiple applications over the experimental period. When multiple marks are required, the dose used for residual marking needs to be carefully studied because of the inherent differences between the markers (even with no additives). Further work on additives that increase wetting of the insect cuticle or provide a more bioavailable residue are critical for larger-scale marking to lower the cost by reducing the amount of marker applied. The additives may also increase usefulness of a particular marker by improved penetration into tight spaces frequented by small insects (e.g., thrips). It is also important to recognize that the process by which an insect acquires a mark is more complicated than the insect just walking on a dried residue or being directly contacted by the spray. For example, dew is common during the spring, early summer, and fall in Washington. The formation of dew on top of a highly concentrated water-soluble residue of any of the three markers may dramatically increase marking of any
August 2006
JONES ET AL.: LARGE-SCALE IMMUNOMARKING
insect that is active at that time. Rainfall may have an even greater effect, depending on its duration, intensity, and the age of the residue. Although not likely important in our studies, ingestion of the marker (so it becomes an internal mark) may also be a self-marking method that may be useful in some situations. For example, parasitoids fed IgG-fortiÞed honey (Hagler and Jackson 1998) and a parasitoid of leafroller larvae, Colpoclypeus florus (Hymenoptera: Eulophidae) acquired the marks examined in this paper in the same fashion (V.P.J., unpublished data). However, to detect an internal mark requires grinding the insect, which is more labor intensive, involves a greater possibility of contamination, and is more expensive. In addition, large amounts of nontarget insect proteins are released during the grinding process, which reduces the sensitivity of the indirect ELISA (V.P.J., unpublished data; Hagler 1998). However, this shortcoming can be overcome by diluting the sample with buffer before it is added to the well (V.P.J., unpublished data) or in some cases by converting the indirect ELISA to a sandwich ELISA (Hagler 1998). Although this marking technique has the complications discussed above, it does allow the naturally occurring insects in a particular location to be marked. The beneÞts of doing so, coupled with the relatively low cost of applying the markers, safety of the materials used, and high sensitivity of the assays, make this technique extraordinarily valuable and superior to most existing marking methods. As with any marking technique, it is ideally suited for a limited number of situations, but the number of situations seems to be much broader than many other marking techniques. For example, all three of the markers weÕve discussed can be obtained in dry forms (e.g., as soy ßour, powdered milk and powdered egg whites) as well as liquid forms, which opens the possibility of innovative methods of marking individuals in both the laboratory and Þeld. In one of our studies, we used soy ßour dusted on Þne netting that parasitoids must crawl through to escape and preliminary tests showed 100% marking (V.P.J., unpublished data). The adaptability of the immunomarking technique using these markers has also allowed us to begin studies on natural enemy movement patterns between ground cover and the orchard canopy and movement of pests and their natural enemies between cultivated areas and the surrounding areas. As mentioned previously, a key advantage of this system is its relative simplicity. We have developed a web site that lists the materials and equipment needed, complete ELISA protocols, and the cost of the different assays and markers (http://entomology.tfrec.wsu. edu/VPJ_Lab/). The web site also has frequently asked questions section that provides tips and hints from our experience and will include references that will be updated to reßect advances in the procedures. Acknowledgments We thank R. Tally for treating the large-scale plots. The reviews of S. Machtley, T. Unruh, and D. Horton contributed
835
much to the manuscript. Combo/DA lures were provided by J. Haworth of Trece. This research was funded in part by grants to V.P.J. from the Washington Tree Fruit Research Commission and USDA-CSREES RAMP program. We thank N. Stephens and K. Mullinix for access to plots used to evaluate codling moth movement and residual activity, respectively.
References Cited Akey, D. H., J. L. Hayes, and S. J. Fleischer. 1991. Use of elemental markers in the study of arthropod movement and tropic interactions. Southwest. Entomol. 14(Suppl): 1Ð 87. Beers, E. H., J. F. Brunner, M. J. Willett, and G. M. Warner. 1993. Orchard pest management: a resource book for the PaciÞc Northwest. Good Fruit Grower, Yakima, WA. Crowther, J. R. 2001. The ELISA guidebook. Humana Press, Totowa, NJ. Hagler, J. R. 1997. Field retention of a novel mark-releaserecapture method. Environ. Entomol. 26: 1079 Ð1086. Hagler, J. R. 1998. Variation in the efÞcacy of several predator gut content immunoassays. Biol. Control 12: 25Ð32. Hagler, J. R., and C. G. Jackson. 1998. An immunomarking technique for labeling minute parasitoids. Environ. Entomol. 27: 1010 Ð16. Hagler, J. R., and C. G. Jackson. 2001. Methods for marking insects: current techniques and future prospects. Annu. Rev. Entomol. 46: 511Ð 43. Hagler, J. R., and E. Miller. 2002. An alternative to conventional insect marking procedures: detection of a protein mark on pink bollworm by ELISA. Entomol. Exp. App. 103: 1Ð9. Hagler, J. R., and S. E. Naranjo. 2004. A multiple ELISA system for simultaneously monitoring intercrop movement and feeding activity of mass-released insect predators. Int. J. Pest Manag. 50: 199 Ð207. Hagler, J. R., A. C. Cohen, D. Dradley-Dunlop, and F. J. Enriquez. 1992. New approach to mark insects for feeding and dispersal studies. Environ. Entomol. 21: 20 Ð25. Hagler, J. R., C. G. Jackson, T. J. Henneberry, and J. R. Gould. 2002. Parasitoid mark-release-recapture techniques: II. Development and application of a protein marking technique for Eretmocerus sp., parasitoids of Bemisia argentifolii. BioControl Sci. Technol. 12: 661Ð 675. Hendricks, D. E., and H. M. Graham. 1970. Oil-soluble dye in larval diet for tagging moths, eggs, and spermatophores of tobacco budworms. J. Econ. Entomol. 63: 1019 Ð20. Jones, V. P., and M. P. Parrella. 1986. The movement and dispersal of Liriomyza trifolii in a chrysanthemum greenhouse. Ann. Appl. Biol. 109: 33Ð39. Klockars, A. J., and G. Sax. 1986. Multiple comparisons. Sage Publications, Newbury Park, CA. Little, T. M., and F. J. Hills. 1978. Agricultural experimentation: design and analysis. Wiley, New York. Murdoch, W. W. 1963. A method for marking Carabidae (Col.). Entomol. Monthly 99: 22Ð 4. SAS. 2002. JMP statistics and graphics guide. Version 5. SAS Institute, Cary, NC. Schroeder, W. J., and W. C. Mitchell. 1981. Marking tephritidae fruit ßy adults in Hawaii for release-recovery studies. Proc. Hawaiian Entomol. Soc. 23: 437Ð 40. Service, M. W. 1993. Mosquito ecology: Þeld sampling methods. Elsevier, New York. Smith, T. J., J. D. Dunley, E. H. Beers, J. F. Brunner, G. G. Grove, C. Xiao, D. Elfving, F. Peryea, R. Parker, M. Bush, C. Daniel, T. Maxwell, and S. Foss. 2005. Crop protec-
836
ENVIRONMENTAL ENTOMOLOGY
tion guide for tree fruits in Washington. Washington State University, Pullman, WA. Southwood, T R.E., and P. A. Henderson. 2000. Ecological methods, 3rd ed. Blackwell, Malden, MA. Steiner, L. F., W. C. Mitchell, E. J. Harris, T. T. Kozuma, and M. S. Fujimoto. 1965. Oriental fruit ßy eradication by male annihilation. J. Econ. Entomol. 58: 961Ð964.
Vol. 35, no. 4
Van Leeuwen, E. R. 1940. The activity of adult codling moths as indicated by captures of marked moths. J. Econ. Entomol. 33: 162Ð168. Received for publication 22 January 2006; accepted 24 May 2006.