change their appearance to indicate what the student has done. .... lacks the ability to inspire, but it can present all the basic material in an ... those students with a strong background in economics to explore topics in greater .... things can be removed), such as the plotting of a new equilibrium point or the .... Industry Supply.
An interactive approach to learning economics: the WinEcon package Jean B. Soper and Alexander B. MacDonald Department of Economics, Leicester University, UK
Abstract Under the TLTP initiative, the Economics Consortium is developing an interactive computerbased learning package called WinEcon. The package is directed at first-year economics undergraduates, particularly those taking economics as a supplementary course. Using recent technological developments, the aim is both to facilitate a further increase in student numbers without a proportionate increase in teaching staff, and to provide a better method of student learning. Some key elements of WinEcon are set out in this paper and demonstrated by screens produced at Leicester University. Methods of presenting textual information that give the user control over accessing it are described. For learning difficult concepts, a visual active learning approach is discussed. It involves user interaction and step-by-step analysis. The importance of flexibility and choice is emphasized, and the capacity of the computer to assist in deepening and consolidating learning is shown.
Introduction WinEcon is a software package offering a new and interactive approach to learning economics for students taking a first-year university course. It is being developed by the Economics Consortium as part of the Teaching and Learning Technology Programme (TLTP) set up in the UK by the Higher Education Funding Councils. The authoring package chosen by the Consortium is Asymetrix Toolbook which runs under Windows, and the Consortium software contains many graphical user-interface features that will be familiar to any Windows user. Students using WinEcon work at their own pace, and can adopt either an inquisitive or an acquisitive approach. They progress through colourful and varied computer screens, choosing what they would like to look at next, and whether they wish to receive further information. Different types of feedback are provided to students about their progress. Some screens change their appearance to indicate what the student has done. Others indicate whether an answer or a curve movement is correct, and provide either a hint or the correct answer. Menus of different styles in different contexts allow students to select the particular aspect of a topic they wish to study, and pop-ups activated by buttons present key concepts in an arresting way. Economic analysis is explained with animated graphics, and diagrams are built up in stages 14
ALT-J
VOLUME 2 NUMBER 1
adding one curve at a time. One of the advantages in developing the package as part of a consortium is cross-fertilization of ideas and cross-checking of the work produced. Materials for WinEcon are being produced separately at different sites, with central coordination and leadership from the University of Bristol. A common look-and-feel has been achieved by providing all developers with a core template which customizes Toolbook to standards agreed by the Consortium, and which also provides additional facilities. Under this, for example, all screens use a grey textured background and have the same set of buttons in the bottom window bar. These allow the student to access utilities such as the glossary, and to navigate through the package, moving either to an adjacent screen or to a higher-level menu. The topics described here were authored at Leicester University, and the screens illustrate particular principles of common interest to many different university disciplines which we were concerned to address. (The screens are taken from topics in both the Welfare Economics and Regulation of Markets and Market Failure modules, two of the three modules being developed at Leicester.)
Objectives The objective of the funding bodies is to harness technological potential so as to enable an increase in student numbers to take place without an accompanying proportionate increase in the number of teachers. Members of the Economics Consortium envisage that the computerbased learning package they are authoring will replace some lectures, but that its greater impact will be in substituting for labour-intensive tutorials and classes, and in checking and assessing students' progress. Equally importantly, however, the Consortium regards the software design process as an opportunity to develop better methods of learning. Understanding and retention of material is greater when students are actively involved in the learning process. Students using WinEcon cannot be passive observers, because progression through each screen and on to the next requires some meaningful user-interaction such as clicking with the mouse or typing appropriate responses. To prevent responses from becoming automatic, the designers of WinEcon have required a considerable variety of types of user-
01993. TLTP Economics Consortium
Types of tax in the U.K. 7a* revenue can be raised by the government :*f the aaivhipg nr w*i=cti UK rates sppiy zan be identified ThD Tniea t-nns of tax :n ins : J K are escribed belfnv To ;)£ noie fifomalion shou! each r » ciick the siiscort g-een circle
T
Direct Taxes These are taxes which are levied directly on Individuals and firms and are payable on earnings from labour, rent, dividends and Interest ® Personal Income Tax d^ National Insurance ® Corporation Tax © Capital Gains Tax
Wealth taxes These are taxes levied on wealth itself rather than the Income which is derived from wealth. Paid either on general assets or specific assets acquired. O
Figure 1: Presenting textual information Method 1
Indirect Taxes These are taxes levied on sellers when goods and services are purchased and are thus paid indirectly by individuals and firms when they buy from the sellers ®
Value Added Tax
O
Excise Duties
©
Customs Duties
Inheritance Tai Council Tax
15
An interactive approach to learning economics
Jean Soper and Alexander MacDonald 01993. TLTP Economics Consortium
Requirements of a good tax system:
As discussed in the topic "Equity & Resource Allocation" people earning the same level of income and with the same personal circumstances should pay the same level of income tax.
Taxes should be fairly apportioned so as to redistribute income from the rich to the poor. To achieve this the system must address the issue of ability to pay. It would seem equitable if those who can afford it pay more than those who cant
Card Eight
m SSISBI
si
Figure 2: Presenting textual information Method 2
interaction, some of which are especially appropriate to particular aspects of the learning process such as recall and integration of material. In universities, the main body of course material has traditionally been presented in lectures, where gifted teachers may have stimulated and inspired their students. A computer perhaps lacks the ability to inspire, but it can present all the basic material in an interesting way. The authors of WinEcon aim to set out the main points clearly and to present information in a way that is easy to absorb. An acquisitive student will progress steadily through the material on a screen, and move on to the next screen of the topic. The software will introduce the main ideas, help students through difficult aspects and suggest avenues for further study both within and outside the package. Moreover, the advantage of the computer is that it provides a visual approach where the inquisitive student can construct and deconstruct diagrams or graphs, and immediately observe the effect of doing so. The comparative advantage of the computer over the lecture, textbook or tutorial is this dynamic element which proves so elusive to other media. The principles involved are an extension of those formulated in developing the use of spreadsheets in the learning process. It was seen then that by working through a calculation one step at a time the student gained insight into it (Soper and Lee 1990). Flexibility extends the life and widens the usefulness of a software package. The designers of WinEcon are building flexibility into it in various ways. Screens are being designed to accommodate the updating of information as this becomes necessary, and to give students many alternative access points. Lecturers will be able to customize the package to suit their particular lecture course. These features will widen WinEcon's appeal, and ensure it can offer something to people with different backgrounds in economics. This is further enhanced by the inclusion of More and Advanced buttons. The More button will give the student access to another layer of information on a specific topic. By contrast the Advanced button will allow those students with a strong background in economics to explore topics in greater depth, typically one which is beyond the requirements of the" mainstream first-year course (for example, the diagrammatic analysis may be made more precise using calculus). 16
ALT-J
VOLUME 2 NUMBER 1
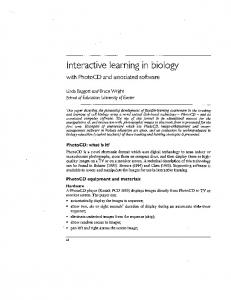
Presenting textual information The design of screens such as those shown in Figures 1 and 2 is driven by two complementary factors: user-interaction and the physical size of the screen. A concern of the WinEcon authors is that in those cases where topics are particularly textual, the package should not take the form of an electronic book. Thus, where there is a large volume of text to be presented which cannot be separated between screens, it should be set out in a way which allows the user to access it in logical chunks. This requires the text to be broken down into meaningful sections, the sum of which, when combined with the control the user has over access, is hopefully worth more to the student than just the whole text. Naturally, the physical size of the screen imposes some constraint on how these elements of text can be presented by the software author. In Figure 1 the sheer volume of material requires a pop-up mechanism so that the bulk of the information, which is stored 'behind the scenes'" can be accessed one part at a time. In Figure 2, the volume of material permits it all to be physically on the same screen, but in such a way that the user has to get involved with the package in order to read it. On both screens, the user has a visual reminder of exactly what information has been accessed. Figure 1 is a screen-shot from the topic on the structure of taxation. This page gives students information about the types of taxes in the UK. The screen explains what direct taxes, wealth taxes and indirect taxes are, giving the major examples of taxes in each category. The student can click the green circle button adjacent to a tax name to find out more about that tax, and a black centre will appear in the circle, indicating that the student has displayed the further information about that tax. The student can move to a new screen at any time. If later the student returns to this screen, then provided that he or she has not quit the package in the meantime, the record of what has previously been studied will still be available. Careful planning of the screen design and programming will make the WinEcon package flexible. This is particularly important with screens such as that shown in Figure 1 where the information will require frequent updating. Information which is likely to change often, such as tax rates and allowances, will be held in a database for easy updating (subject to the obvious constraint of volume of data). The whole screen is designed so that any major
01 993. TLTP Economics Consortiun
Types of Equity:
•
Horizontal Equity
Vertical Equity
Horizontal etraity is concerned with &e identical treatment of identical people This roles out discrimination on the basis of race or sex between people whose economic characteristics an" identical.
Vertical equity refers to &e different treatment of different people with the aim of reducing the consequences of these differences. This includes the "Robin Hood" principle of taking from the rich and erring to the poor, i
Figure 3: Clear presentation of contrasting definitions 17
Jean Soper and Alexander MacDonald
An interactive approach to learning economics
changes, such as the addition or removal of tax examples, can be implemented using only one access point. For users in countries other than the UK it will be possible to substitute an alternative screen relevant to their country for that shown in Figure 1. An alternative method of presenting textual information in organized and easy-to-assimilate chunks is shown in Figure 2. Here, a card-index type approach is used, with the information about each requirement of a tax system being available on one or two cards. The user clicks a card to view it, and its title bar then changes from cream to green, thus creating a record of what has been studied. Even in screens which are concerned with presenting text, students are involved in the learning process, and have a choice about the material presented to them. The package is therefore useful to students with different amounts of prior knowledge, and the choices it offers give easy access to selected material for revision purposes. The screen shown in Figure 3 presents two definitions. Typically, definitions in WinEcon are accessed at the click of a standard Definition button on the first page of each topic. In this case, the topic is based on two definitions of equity which are presented together so that they jointly form the focus of the screen, rather than being supplementary information to be accessed via the click of a button. The screen in Figure 3 illustrates the design objective that the software should draw attention to important points, present them clearly, and compare and contrast alternatives. Another feature of WinEcon, implemented via the core template, is the 'Roladex' mechanism for presenting voluminous text. Roladex is the metaphor adopted by the Economics Consortium to describe its linear-access card mechanism (unlike the HyperCard system, Roladex does not facilitate random access of cards). Roladex can be seen in Figures 4a and 4b, at the upper left-hand side of both screens. With this mechanism, the user clicks the appropriate button to access sections of text as a linear progression of cards. In Figure 4b, the student is reading the sixth card out of the total of the six cards available. As with the other card mechanisihs, large sections of text are presented in smaller, more readable divisions. A particularly attractive feature of the Roladex mechanism is that movement from one card to the next can trigger another event on the same screen. In this way, a
Click tratton t below and observe what happeas lathe allocations This morement is a Pareto teen nude better off, no one has bean
Allocation of Goods, A , •
jT] | Figure 4a: Learning the theory by example 18
ALT-J
VOLUME 2 NUMBER 1
student can progress through several cards of text which relate to the same diagram while that diagram remains on the screen. At the same time, additions can be made to the diagram (or things can be removed), such as the plotting of a new equilibrium point or the introduction of a new curve or graphic. The methods chosen by the Economics Consortium for presenting textual information recognize that a computer screen is not necessarily a suitable medium for conveying the written word. Care is being taken to improve readability by separating the text into logical divisions, and by using sans-serif fonts for clarity. When continuous text is printed, a serif font is generally recommended as assisting the flow of reading. On screen, however, the extra complexity of the serif font makes the letters somewhat disjointed, and so the text becomes difficult to read. The fonts being used by the Economics Consortium are standardized in the core template. They comprise Arial fonts in three different sizes and faces for different circumstances, for example titles, headings, graphs and continuous text.
Interactive learning of concepts A concept which is difficult to grasp can first be demonstrated as an interactive example on a computer. With the screen shown in Figures 4a and 4b, students investigate the Pareto criterion for comparing different allocations of two goods between two people. Before entering this screen, the student is given the opportunity to customize the example by changing the names of the people in it. These names then replace the default names in the text and on the graph. On the screen shown in Figure 4a, the user is asked to click button I to see an example of a Pareto improvement. This is demonstrated by both the marker at point A turning red and moving from point A to point B, while simultaneously the pie chart at the bottom of the screen slowly changes to reflect the new allocation of goods between the two people. Progressing through the text, the student is instructed to click the remaining buttons to discover more about Pareto improvements. When button V is clicked, as instructed iri the screen shown in Figure 4b, the point moves from A to E, which is on the same line as B, and the pie chart changes accordingly. It might superficially seem that another Pareto improve01993. TLTP Economics Consortium
{Example-' • \ ---' ' fina% eta* buttonV below, i ",* Ths change of ^locations t a n nrt be , emtipsfa* using ItePsretoCrtfenon , t h o u g h there has been sn mcKMae '• efficiency, Laura bss been made taBer I oflwhtistZigjyisnwtieworse off , *
Allocation of Good?, E
Figure 4b: Learning the theory by example 19
Jean Soper and Alexander MacDonald
An interactive approach to learning economics
nient has occurred. This, however, is not so. As the text explains, one person, Ziggy, has been made worse off, and therefore the two points A and E cannot be compared using the Pareto
criterion.
.
Another illustrative example is shown in Figures 5a and 5b. These screens incorporate a further design principle of the package, namely increasing the depth of learning by checking the student's understanding of concepts as they are applied in a new context. The two screens shown form part of a set in which the student views four possible alternative allocations of a cake between two identical people, and is asked to respond to questions about each allocation by clicking the Yes or No button. The separate ideas of equity and efficiency should already be familiar to the student, but these screens require them to be brought together. In Figure 5a, the user has clicked the button Allocation One, which causes a whole cake to divide and then be allocated as shown. In this case, the student has answered the first question by clicking either Yes or No (the corresponding pair of buttons are now greyed out), and WinEcon is now ready to receive the answer to the second question. Figure 5b shows Allocation Two when the student has revealed the new allocation and answered the question concerning equity. Regardless of what the student chooses, the correct answer appears in the Allocation Status box and subsequent correct answers are added to describe the allocation. To help the student answer the questions, the box at the top right of the screen records numerically the allocations of cake for each example. When the student has completed all the allocations, feedback is provided about how many answers were correct, and an opportunity to repeat the questions is given.
Monitoring and feedback Interactive software such as WinEcon is designed to involve students in their own learning in a variety of ways. One of these is their responding to the feedback which the computer offers them about their progress. With the screens shown in Figures 5a and 5b, the student receives immediate feedback about the correct answer to each question. Each is used in constructing a final answer, and the screen designers felt it important that students should have the correct information, although O1993, TLTP Economics Consortium
'.Horizontal Equity-Examples;;" • .: . c W ^ f b e allocation ofiniscakebetweeoiwo ' i d e n t i c a l s a n n f o . . "•'
.':'
.-'•"."
ALLOCATION: ONE TWO THREE FOUR
PERSON 1 1/3
PFRSON 2 1/3
Allocation One
This allocation is Equitable This allocation is Efficient
lYESJ I "NO
Allocation Status
EQUITABLE because both have the same amount of cake
Figure 5a: Simple presentation of hard-tograsp concepts 20
ALT-J
•
VOLUME 2 NUMBER 1
they may not study it as it is received. For acquisitive students proceeding through the steps on the screen, it is helpful that they are told at the end how many of their answers were correct. This will alert them to the state of their understanding of the topic. We have considered the possible provision of rewards for full marks on questions sets. Machines with sound cards might play a tune of the student's choice (assuming headphones are also provided) or some fun item might appear on the screen, possibly a game. For less successful students, we have discussed whether some humorous portrayal of their deficiencies might make them feel prepared to try again. Further consideration will be given to feedback as we produce the test module, which is still under development at the time of writing. Another aspect of computer-based learning is computer monitoring. The computer can record what individual students do, so that an account of the screens they have accessed, the information they have revealed and the answers they have given to questions can be available to them. It could also be made available to the students' tutors, but whether it should be is a matter for debate which should perhaps be decided separately at each institution that installs the software. Computer monitoring is something the Consortium plans to consider in more detail once the main software development phase is nearing completion.
Step-by-step analysis of complex material Much economic analysis is presented by means of graphs, and students have to understand what each curve on a graph represents. One of the advantages of a computer is that it can show in a matter of seconds how a particular graph is built up, whereas a textbook would require several pages of text to describe it. Figure 6 shows the start of a diagram for a perfectly competitive industry. The screen invites the user to click the five buttons in sequence, which builds up the graph one curve at a time. After the first button has been clicked, the screen displays the Industry Demand curve as shown in Figure 6, with an explanation about the curve appearing in the box to the side of the buttons. The student can watch the graph being built up until the long-run equilibrium position of a perfectly competitive industry is found. For those already familiar with the basic curves, a Show Curves button is provided.
01993, TLTP Economics Consortium Horizontal JEcfuity one cakB between 1wo •
ALLOCATION: ONE TWO THREE FOUR
Allocation Two bartons
PFRSON1 1/3 1/2
PERSON 2 1/3 1/3
.,/fedn*fc?rickinotip spprop'iote
This allocation b Equitable and more efficient than allocation one I t « a Pareto Optimal allocation Allocation Status INEQUITABLE as one person has more fake than the other
Figure 5b: Simple presentation of hard-tograsp concepts
Unallocated
ES naniia I H 21
Jean Soper and Alexander MacDonald
An interactive approach to learning economics
©1993, TLTP Economics Consortium
Perfectly Competitive Industry Westat) Wisfcapelfccttyb •fm a jjMdei of Ste tri„ Joag m OftdSbnam-, - - 1 >',"* dick flw'Sw feWsos tetowin • j
Industry Ui'mand
j
Industry Supply Industry Murqirm
Perfectly Competitive Industry
Industry Averngr Cast equilibrium
Industry demand is a standard demand curve.
Figure 6: Adding curves to build a graph
The computer-based learning approach is more visual than the textbook one, and it is also flexible to the needs and wishes of the student. Guiding the student one step at a time through complex material is the approach that a lecturer or tutor would use when teaching the subject live. An economics teacher would also indicate points, distances and area on graphs that have particular interpretations. The computer can do this also. We have already noted that different colours can be used, but the screen shown in Figure 7 has a further method. As the student clicks each button in turn to reveal the definition of a concept, the area or distance which represents that concept on the graph flashes to attract the student's attention and ensure that it is correctly identified. In the screen shown in Figure 7, the student has clicked the Consumer Surplus button, and then on clicking the Producer Surplus button, the text shown appears one step at a time while simultaneously the corresponding lines and axis labels flash. The conclusions of economic analysis are often deduced by comparing two contrasting diagrams. When a perfectly competitive industry is monopolized, there are many points of comparison to be drawn. Figure 8 shows a screen where the student observes the differences between the two industries. Having clicked buttons (obscured in the screen-shot) to reveal the competitive equilibrium and set the condition required to determine production under a monopoly (the MR curve, which diverges from AR, is needed), the student then progresses through the buttons to reveal changes in price, quantity and surpluses as a result of monopolization. As each button is clicked, a pop-up completes the button caption so as to explain what is happening in the diagram as each component is revealed.
Screen design Aspects of screen design relating to readability, flexibility and choice are discussed in the earlier section of this paper on presenting textual information. Some more general issues of screen design will now be addressed. 22
ALT-J
VOLUME 2 NUMBER 1
The Economics Consortium recognized at an early stage of production that a degree of consistency between screens would be desirable, for both aesthetic and practical reasons. The former are concerned with giving unity to the package as a whole, and the latter with ensuring that students feel in control of WinEcon. In particular, students need to know firstly where to begin on a new screen, and secondly when they have completed it and should move on to the next. There are also good reasons, however, for believing that a variety of screen styles is required. Different developers author in different ways, each of which may have its own advantages, so allowing developers freedom to try out their ideas is likely to enrich the package as a whole. Consistency between sites is not necessarily jeopardized by this, because ideas originating at one site are often adapted at another, with the Janet network facilitating frequent exchange of programming code. As educators, we are also concerned to produce a package which will maintain students' attention and prevent them from predicting exactly what will follow next, which is a further argument for variety between screens. The Economics Consortium's approach to this multi-faceted question is a fairly minimal amount of standardization comprising such items as icons, fonts, a screen background, some buttons and commonly required graphics. The scope for variety that is still available to developers is illustrated by the considerable Variety of styles exhibited even in the limited number of screens depicted in this paper. A major design consideration is to partition the screen in such a way that the eye is not overworked. In WinEcon, screens are often divided into a number of unequal sections which serve different purposes. Frequently, a large part of the screen is devoted to presenting the textual analysis, with a similarly sized area containing the diagram. A small portion of the screen is typically given up to user instruction. Throughout WinEcon, such areas are identified by Professor Fields, an example of which can be seen in the top left-hand corner of the screen in Figure 8. By this means, the student'will quickly become familiar with where to look for screen instructions, and additionally the student can choose the identity of the Professor during the initial customization of WinEcon. Another different use for which a small section of the screen may be required is to store information or present it in a different format for reference purposes. Alternatively, a set of buttons with which the student controls the
01993. TLTP Economics Consortium dick the buttons below in tain.
Consumer, Producer & Social Surplus in Competition.
Consumer Surplus Consumer Surplus Is the area DBiwBen file demand Cijnre and unit price, PC, and is shown by the red triangle.
First find price per unit, Pc Then find cost per unit, Cc and the number of units produced, Qc Producer Surplus 1st (Pc-CcjxQc (Price Per Unit - Cost Per Unit) multiplied by the number nf units.
Figure 7: Attracting the user's attention by flashing objects on screen
ButasPc- Cc .then Pc-Cc-fl and so producer surplus is zero. Explanation
23
Jean Soper and Alexander MacDonald
An interactive approach to learning economics
01993. TLTP Economics Consortium Changss Resulting From Monopolisation L'mnplfilp Ihi* Klnlrmfsnni hi Inw by iHietanq Ihc .£* i iiiTP^innilini) hullnm
VaAer Mnnouoly. UunnMyis |
j
I
Consumer Surplus is J
Prict* is
j
I
Producer Surplus is
I
Unit C O M is
1
I
SoniBl Suriilus is
J
j Loss ol Social Kurjilus m I
Figure 8: Step-by-step approach to presenting analysis
action of the screen may be grouped together in one part of the screen as in Figures 4a and 4b. On a simple screen such as that shown in Figure 3, where instructions and buttons are not required, the user is assumed to read the material in the conventional way from left to right and from top to bottom. The fundamental concern here is with balance. The division of the screen may be most important on screens which contain purely textual information. As with the printed word, the less clutter on a page the more willing is the reader to engage that page. Thus, although a screen may contain vast amounts of information, it should be presented so that superficially it appears simple and uninvolved, thus capturing the'user's interest at first sight. Colours can also be used to attract the user's attention, but care must be taken to ensure that the student is not entering the world of psychedelia. If a strong colour is to be used to highlight a particular aspect of analysis, this should be done subtly so that the eye is naturally drawn to that object or area of the screen. If the whole screen is a wash of vibrant colour, although such a screen will undoubtedly capture the user's initial interest, the power of colour in retaining that interest throughout the analysis is lost as the user's eyes become tired when continually faced with strong screen colours. The Economics Consortium has chosen a neutral grey colour for screen backgrounds, allowing developers a wide choice of colours that stand out against it. The use of a subtly textured grey background contrasts well with metallic buttons and dithered backdrops for graphs and diagrams. In this way, the student does not have to deal with the author's overworked imagination but can concentrate on the analysis .being presented.
Flexibility and choice Very large textbooks are off-putting to students and expensive to produce. Authors of books therefore have to choose between alternative presentations of material, and teachers usually find that even the textbook they like best does various things in ways they would not choose. The volume of material being stored in WinEcon is not immediately apparent to the student, 24
Au-J
VOLUME 2 NUMBER 1
and where it seems likely to be useful, the package will include alternative presentations. One of the changes resulting from monopolization which the screen shown in Figure 8 derives, is a measure of the deadweight loss of monopoly. Figure 9 explains that the deadweight loss can also be measured in a different way, and asks the student to investigate why the measures are the same. A student who does not wish to compare the two measures can easily proceed to the next screen by clicking the appropriate screen-movement button. And lecturers who wish their students to study only selected screens will be able to customize the package for their course and exclude specified sections. All the screens in WinEcon will have a unique name so that after customization each screen can still be identified and thus cross-screen references maintained. Students sometimes have difficulty in picking out relevant material from a textbook. With lecturer customization, a computer-based learning package can be tailored to a particular course. In addition, the menu mechanism allows the student to navigate through the package to a particular page. Each module has a standard style top-level menu listing the topics available in that module. On clicking a topic button, the user enters that topic and is confronted with a second-level menu specific to the topic, one of which is shown in Figure 10. This menu allows the student to go straight to a named page within the topic by clicking the page name. From any screen within a topic, the student can click a button in the bottom window bar to return to the second-level menu. From this page, the student can click the module map button to return to the top-level menu of topics. This system allows students to have total control over where they start within a module. Figure 10 shows the menu of choices for the Welfare Effects of Monopoly topic. Students are encouraged to click the Roladex button to reveal them one at a time, as a lecturer would do with a real overhead projector. A Reveal All button is also provided, however, and this gives fast access to particular sub-topics when required, for example for revision purposes. The menu system, together with the glossary to be included in the finished version of the software is expected to provide students with easily accessible self-help facilities where they
01993. TLTP Economics Consortium
Deadweight Loss of Monopoly - An Alternative Measure Ai wy have ssen, tne cp