AN OPTICAL VIEW OF THE 4 MPC X-RAY FILAMENT OF ABELL 85. Boué, G.1 ... We present here an optical study of this filament ... counts/0.5mag/deg. 2 u*.
SF2A 2008 C. Charbonnel, F. Combes and R. Samadi (eds)
AN OPTICAL VIEW OF THE 4 MPC X-RAY FILAMENT OF ABELL 85 Bou´e, G. 1 , Durret, F. 2 , Adami, C. 3 , Mamon, G.2 , Ilbert, O. 4 and Cayatte, V. 5 Abstract. The merging cluster Abell 85 (z=0.055) has a filament discovered in X-rays at least 4 Mpc in length, interpreted as due to groups falling on to the main cluster. We present here an optical study of this filament, based on deep broad band optical imaging and on Hα imaging, with the aims of: 1) analyzing the faint end slopes of galaxy luminosity functions in various wavelength bands and in various regions, which are expected to be influenced by physical processes (mergers, tides, infall); 2) searching for star formation in the filament galaxies, as expected if this region is undergoing merging processes.
1
Introduction
Large scale structure formation scenarios predict that matter is concentrated in filaments, with clusters at their intersection. However, due to their faintness, such filaments are difficult to detect directly. We discovered in X-rays a filament at least 4 Mpc in length in the merging cluster Abell 85 (z=0.055) and interpreted it as due to groups falling on to the main cluster (Durret et al. 1998, 2003, 2005). We test here the idea that merging processes trigger star formation in galaxies by obtaining narrow band Hα imaging of this cluster. We also present the results obtained with deep broad band imaging. A full description of this work can be found in Bou´e et al. (2008). 2
Galaxies with Hα emission
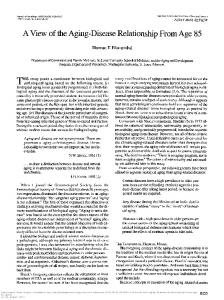
Based on broad and narrow band imaging obtained at the ESO 2.2m telescope with the WFI camera, 101 galaxies are detected in the Hα filter, out of which 23 have redshifts in the cluster, 2 have spectroscopic redshifts outside the cluster and 56 have photometric redshifts indicating they are probably outside the cluster. Most galaxies detected in Hα and belonging to the cluster are concentrated in the filament, suggesting that star formation is indeed triggered in the filament (Fig. 1). A Serna & Gerbal (1996) analysis of the overall spectroscopic sample for the whole Megacam region suggests that the filament is indeed a gravitationally bound region. 3
Galaxy luminosity functions
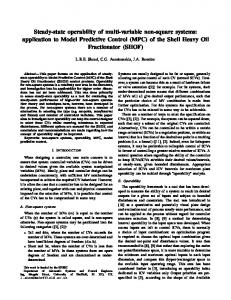
Galaxy luminosity functions (GLFs) were computed in the u*, g’, r’ and i’ bands from deep Megaprime/Megacam images processed at the TERAPIX data center. The background contribution was subtracted statistically using the four CFHTLS Deep fields, and the cosmic variance was found to be the main source of error. The global GLFs are displayed in Fig. 2 in the four bands. The best fit slopes are −1.5 ± 0.15. The local GLFs computed in 16 subregions have shapes differing from one zone to another: they are more richly populated in the south part of the cluster and in the south east (where the X-ray filament is) than in the southwest.
1 2 3 4 5
IMCCE, UMR 8028, Observatoire de Paris, 77 Av. Denfert-Rochereau, 75014 Paris IAP, CNRS UMR 7095 et Universit´ e Pierre et Marie Curie, 98bis Bd Arago, 75014 Paris LAM, Pˆ ole de l’Etoile, site de Chˆ ateau-Gombert, 38 rue F. Joliot-Curie, , 13388 Marseille Cedex 13 Institute for Astronomy, 2680 Woodlawn Dr., University of Hawaii, Honolulu, Hawaii 96822, USA Observatoire de Paris, LUTH, UMR 8102 et Universit´ e Denis Diderot , 5 place Janssen, 92195 Meudon c Soci´
et´ e Francaise d’Astronomie et d’Astrophysique (SF2A) 2008
366
SF2A 2008
Fig. 1. Positions of the galaxies detected in Hα, with blue circles for galaxies with spectroscopic redshifts in the cluster and red squares for galaxies with no spectroscopic redshift. Black circled galaxies show Hα in their SDSS spectrum. The two large circles show the two XMM fields with isocontours superimposed. The dashed circle indicates the virial radius. Mu* -24
-22
-20
Mg’
-18
-16
-14
-24
-20
100
10
1
-16
-14
2
100
10
1 14
16
18
20
22
14
16
18
u* Mr’ -24
-22
-20
20
22
g’ Mi’
-18
-16
-14
-24
-22
-20
-18
-16
-14
100
10
1
α
counts/0.5mag/deg2
=-
2
Abell 85
α
Abell 85
2
1000
=-
1000
counts/0.5mag/deg2
-18
α
counts/0.5mag/deg2
=-
2
Abell 85
α
counts/0.5mag/deg2
-22
1000
Abell 85
=-
1000
100
10
1 14
16
18
r’
20
22
14
16
18
20
22
i’
Fig. 2. Global luminosity functions for the south part of the cluster and filament region of Abell 85.
4
Conclusions
The filament of Abell 85, discovered in X-rays, is confirmed in the optical, and our results agree with the previous interpretation that the filament is made of groups falling on to the cluster. Our Hα detections may be preferentially concentrated in the filament but the statistics are too low to draw a firm conclusion. References Bou´e, G., Durret, F., Adami, C., Mamon, G., Ilbert, O., & Cayatte, V. 2008, A&A in press, arXiv:0807.4262 Durret, F., Forman, W., Gerbal, G., Jones, C., & Vikhlinin, A. 1998, A&A, 335, 41 Durret, F., Lima Neto, G.B., Forman, W., & Churazov, E. 2003, A&A 403, L29 Durret, F., Lima Neto, G.B., & Forman, W. 2005, A&A 432, 809 Serna, A., & Gerbal, D. 1996, A&A 309, 65