Naunyn-Schmiedeberg's Archives of Pharmacology https://doi.org/10.1007/s00210-018-1572-7
ORIGINAL ARTICLE
Angiotensin II type 1 receptor blockers decrease kynurenic acid production in rat kidney in vitro Izabela Zakrocka 1,2 & Katarzyna M. Targowska-Duda 3 & Artur Wnorowski 3 & Tomasz Kocki 1 & Krzysztof Jóźwiak 3 & Waldemar A. Turski 1 Received: 26 June 2018 / Accepted: 19 October 2018 # The Author(s) 2018
Abstract Glutamate (GLU) mainly through N-methyl-D-aspartate (NMDA) receptors plays pivotal role in kidney function regulation. Kynurenic acid (KYNA), a GLU receptors antagonist, is synthesized from kynurenine by kynurenine aminotransferases (KATs). Previously, it was shown that angiotensin II type 1 receptor blockers (ARBs) decrease KYNA production in rat brain in vitro. The aim of this study was to examine the influence of six ARBs: candesartan, irbesartan, losartan, olmesartan, telmisartan, and valsartan on KYNA production on rat kidney in vitro. The effect of ARBs was determined in kidney homogenates and on isolated KAT II enzyme. Among tested ARBs, irbesartan was the most effective KYNA synthesis inhibitor with IC50 of 14.4 μM. Similar effects were observed after losartan (IC50 45.9 μM) and olmesartan administration (IC50 108.1 μM), whereas candesartan (IC50 475.3 μM), valsartan (IC50 513.9 μM), and telmisartan (IC50 669.5 μM) displayed lower activity in KYNA synthesis inhibition in rat kidney homogenates in vitro. On the other hand, valsartan (IC50 27.5 μM) was identified to be the strongest KAT II inhibitor in rat kidney in vitro. Candesartan, losartan, and telmisartan suppressed KAT II activity with IC50 equal to 83.2, 83.3, and 108.3 μM, respectively. Olmesartan and irbesartan were the weakest KAT II inhibitors with IC50 values of 237.4 and 809.9 μM, respectively. Moreover, molecular docking suggested that studied ARBs directly bind to an active site of KAT II. In conclusion, our results indicate that ARBs decrease KYNA synthesis in rat kidney through enzymatic inhibition of KAT II, which may have impact on kidney function. Keywords Kynurenic acid . Kidney . Renin-angiotensin system . Angiotensin II type 1 receptor blockers . Rat . Nephroprotection
Abbreviations ACE-I Angiotensin-converting enzyme inhibitor ARB Angiotensin II type 1 receptor blocker AT1R Angiotensin II type 1 receptor Ang II Angiotensin II CNS Central nervous system Electronic supplementary material The online version of this article (https://doi.org/10.1007/s00210-018-1572-7) contains supplementary material, which is available to authorized users. * Izabela Zakrocka
[email protected] 1
Department of Experimental and Clinical Pharmacology, Medical University of Lublin, Jaczewskiego 8b, 20-090 Lublin, Poland
2
Department of Nephrology, Medical University of Lublin, Jaczewskiego 8, 20-090 Lublin, Poland
3
Department of Biopharmacy, Medical University of Lublin, Chodźki 4a, 20-093 Lublin, Poland
DMSO GFR GLU HPLC IC50 KAT KYN KYNA NMDA PMP RAS
Dimethyl sulfoxide Glomerular filtration rate Glutamate High-performance liquid chromatography Half-maximal inhibitory concentration Kynurenine aminotransferase Kynurenine Kynurenic acid N-Methyl-D-aspartate 4′-Deoxy-4′-aminopyridoxal-5′-phosphate Renin-angiotensin system
Introduction High intrarenal angiotensin II (Ang II) concentration, apart from its physiological actions, may also contribute to kidney injury through vasoconstriction, podocyte damage, and induction of inflammation (Fukuda et al. 2012). It is widely
Naunyn-Schmiedeberg's Arch Pharmacol
accepted that most Ang II actions occur via type 1 receptor (AT1R) activation, which leads to increased Ang II uptake as well as to angiotensinogen production in the proximal tubule, that augments intrarenal Ang II concentration (Satou et al. 2015). AT1R blockers (ARBs) provide vasodilation, reduction in intraglomerular pressure, and urinary albumin excretion (Kobori et al. 2013). Due to non-hypotensive pleiotropic effects, ARBs became essential drugs in the prevention of kidney function decline (Zhang et al. 2017). It is also known that glutamate (GLU) plays crucial role in renal functions (Dryer 2015). It contributes to acid-base regulation through ammonia excretion in response to hypertonicity or podocyte damage (Altintas et al. 2014). Renal GLU receptors are mainly represented by N-methyl-D-aspartate (NMDA) ionotropic receptors (Bozic and Valdivielso 2015) and metabotropic receptors (Perfilova and Tyurenkov 2016). Overactivity of GLU signaling in the kidney is linked with renal pathologies, and thus NMDA receptor antagonists are claimed to be nephroprotective (Pundir et al. 2013; Lin et al. 2015); however, results of other studies remain controversial (Giardino et al. 2009). Kynurenic acid (KYNA) is an endogenous antagonist of GLU receptors acting preferentially at NMDA receptor (Stone and Addae 2002). KYNA is produced from kynurenine (KYN) in the reaction catalyzed by kynurenine aminotransferases (KATs). In addition to wellknown role in central nervous system (CNS) disorders, KYNA possesses natriuretic properties (Bądzyńska et al. 2014). It has been shown by our laboratory that angiotensinconverting enzyme inhibitors (ACE-Is) modified in vitro KYNA production in rat brain (Zakrocka et al. 2016) and kidney (Zakrocka et al. 2017a). Additionally, it has been recently reported that ARBs decreased KYNA production in rat brain in vitro (Zakrocka et al. 2017b). The focus of this study was to examine the effect of six the most commonly used ARBs: candesartan, irbesartan, losartan, olmesartan, telmisartan, and valsartan on KYNA production on rat kidney in vitro. We hypothesized that ARBs would modify KYNA synthesis and KAT II activity in rat kidney in vitro.
Materials and methods Animals Tests were performed on male Wistar rats (Experimental Medicine Center, Lublin, Poland) weighing 150–200 g. Animals were housed under standard laboratory conditions with food and water available ad libitum. Procedures were carried out between 7 a.m. and 1 p.m. All animals were housed in the laboratory conditions minimum 7 days before tests were performed. All applicable international, national
and institutional guidelines for the care and use of animals were followed. All procedures performed in this study involving animals were in accordance with the ethical standards of the I Local Ethics Committee for Animal Experiments in Lublin, Poland.
Chemical substances L-Kynurenine (sulfate salt), candesartan cilexetil, irbesartan, losartan potassium, olmesartan (RNH-6270), telmisartan, valsartan, dimethyl sulfoxide (DMSO), sodium chloride, potassium chloride, magnesium sulfate, calcium chloride, sodium phosphate monobasic, sodium phosphate dibasic, glucose, distilled water, Trizma base, acetic acid, pyridoxal 5′-phosphate, 2-mercaptoethanol, pyruvate, and glutamine were purchased from Sigma-Aldrich. Substances used for highperformance liquid chromatography (HPLC) were obtained from J.T. Baker Chemicals and from Sigma-Aldrich.
Evaluation of KYNA production in rat kidney in vitro Adult male Wistar rats were used. Rat kidneys were collected after decapitation and immediately placed on ice. The kidneys were weighed and homogenized in oxygenated Krebs-Ringer buffer at pH 7.4 (1:4; w/v). Later, the kidney homogenate was transferred to test tubes, pre-filled with oxygenated Krebs-Ringer buffer (900 μL in every tube). Then, the homogenate (50 μL) was incubated for 2 h at 37 °C in the presence of L-KYN (10 μM) and one of the following ARBs: candesartan, irbesartan, losartan, olmesartan, telmisartan, and valsartan. Increasing concentrations of the compounds of interest were tested: 1 μM, 10 μM, 50 μM, 100 μM, 500 μM, and 1 mM. Due to limited solubility, telmisartan was examined only up to 500 μM concentration. At least six independent tissue samples were used for each measurement. The reaction was stopped on ice by adding 1 N HCl (100 μL per sample). All samples were centrifuged (15,133×g, 15 min), and the supernatants were subjected to the HPLC analysis (Thermo Fisher Scientific HPLC system, ESA catecholamine HR-80, 3 μm, C18 reverse-phase column, mobile phase 250 mM zinc acetate, 25 mM sodium acetate, 5% acetonitrile, pH 6.2, flow rate 1.0 mL/min; fluorescence detector: excitation 344 nm, emission 398 nm) and the KYNA was quantified fluorometrically. To analyze the influence of every tested ARB, three rats in each experiment were used.
Evaluation of KAT II activity in rat kidney in vitro KAT II activity in rat kidney in vitro was analyzed according to the method presented by Gramsbergen et al. (1992). To examine KAT II activity, kidneys were homogenized in dialysate buffer composed of 5 mM Tris-acetate buffer (pH 8.0)
Naunyn-Schmiedeberg's Arch Pharmacol
supplemented with 50 μM pyridoxal 5′-phosphate and 10 mM 2-mercaptoethanol. Homogenate was centrifuged (15,133×g, 15 min) and the obtained supernatant was dialyzed against 4 L of the dialysate buffer for 12 h at 8 °C using cellulose membrane dialysis tubing. Then, the obtained enzyme sample was incubated for 2 h at 37 °C with L-KYN (2 μM), glutamine (2 mM), and our compounds of interest (1 μM, 10 μM, 50 μM, 100 μM, 500 μM, and 1 mM) at pH 7.0. The reaction was terminated by transferring all samples into ice-cold bath. Samples were centrifuged and analyzed by the means of HPLC as described in previous section. All assays were carried out in triplicates. To explore the effect of every ARB, three rats per drug were used.
Molecular docking of ARBs and kynurenine to KAT II The available crystal structure of the human (h) KAT II in complex with its substrate KYN and co-factor [PMP (4′-deoxy-4′-aminopyridoxal-5′-phosphate)] at 1.95 Å atomic resolution (PDB ID: 2R2N) (Han et al. 2008) was used to perform the molecular docking. More specifically, candesartan, olmesartan, and valsartan structures (Molfile) were imported from the ChEMBL Database and optimized using the semiempirical method AM1, and then transferred for the subsequent step of ligand docking. Molegro Virtual Docker (v 6.0.0, Molegro ApS, Aarhus, Denmark) was used for docking simulations of flexible ligands into the rigid KAT II target. The docking space was defined to cover KYN (substrate) and the co-factor (PMP) as previously described (Zakrocka et al. 2017b). KYN was then removed and each ARB was docked to the KAT II structure. The actual docking simulations were performed using the following settings: numbers of runs = 100, maximal number of poses returned = 10. Additional docking was performed for KYN to check the correctness of the docking procedure. The lower energy conformations were selected from each cluster of superposed poses for each studied ligand.
Perturbations tool of Genevestigator software. ARB-related treatments were identified using Bsartan^ as a search term. Retrieved expression values were plotted as log2 using GraphPad Prism 6. Error bars represent standard deviation.
Statistical analysis The data were plotted as mean ± standard deviation (SD), until noted otherwise. Differences between the means of the treatments were evaluated using one-way analysis of variance (one-way ANOVA) followed by Tukey’s multiple comparison test. The IC50 values (half-maximal inhibitory concentrations) were calculated by fitting the experimental data to fourparameter logistic equation. Statistical analyses were performed using GraphPad Prism 6.
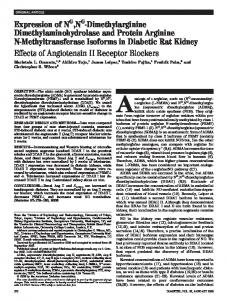
Results Evaluation of KYNA production in rat kidney in vitro De novo production of KYNA in rat kidney homogenate under standard conditions in the presence of 10 μM KYN was 9.37 ± 0.47 pmol/mg protein/2 h. Irbesartan was the most active among tested compounds. It attenuated KYNA production by 78% with IC50 of 14.4 μM (Fig. 1). Losartan displayed similar activity with IC50 equal to 45.9 μM. Olmesartan expressed limited capacity to block KYNA production with maximal inhibition of 57.3% and IC 50 of 108.1 μM. Candesartan, valsartan, and telmisartan displayed comparable activity with IC50 values equal to 475.3, 513.9, and 669.5 μM, respectively. These three ARBs suppressed the production of KYNA roughly to 50% at maximal concentration.
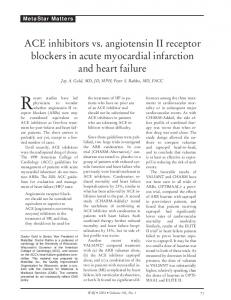
Evaluation of KAT II activity in rat kidney in vitro The mean KYNA production by KAT II under standard conditions was 40.66 ± 2.58 pmol/mg protein/2 h. With IC50 of 27.5 μM, valsartan was identified to be the most potent
Microarray data mining Previously published data from microarray experiments were retrieved from public repositories using Genevestigator software ver. 6.00 (Hruz et al. 2008). Data on gene expression in rat and human kidney were obtained using Anatomy tool of the software. The data originated from Affymetrix Rat Genome 230 2.0 Array and from Affymetrix Human Genome U133 Plus 2.0 Array. The following rat genes were included into the analysis: Kyat1 (KAT I), Aadat (KAT II), Kyat3 (KAT III), and Got2 (KAT IV). Corresponding human genes were also studied. Databases were queried for data on ARBs effect on the expression of KAT-coding genes in rat kidney using
Fig. 1 Influence of ARBs on KYNA production in rat kidney in vitro. Data are expressed as a percentage of control production, mean ± SD, n=3
Naunyn-Schmiedeberg's Arch Pharmacol
inhibitor of KAT II in rat kidney in vitro (Fig. 2). Candesartan, losartan, and telmisartan suppressed KAT II with IC50 equal to 83.2, 83.3, and 108.3 μM, respectively; however, candesartan and telmisartan were able to inhibit KYNA production to about 94%, while losartan elicited only 65.2% of inhibition at highest doses. Olmesartan and irbesartan were the least potent inhibitors with IC50 values of 237.4 and 809.9 μM, respectively.
Molecular docking of ARBs and KYN to KAT II The molecular docking results of candesartan, olmesartan, and valsartan showed that each studied ARB binds to the KAT II active site. Our results suggested a similar KYN orientation within the KAT II active site as determined in the three-dimensional crystal structure of KAT II with KYN (Han et al. 2008). This also confirmed the correctness of the docking procedure as it was previously published (Zakrocka et al. 2017b). Our previous findings indicated that losartan, irbesartan, and telmisartan bind to the same binding pocket as KYN within the KAT II active site (Zakrocka et al. 2017b). The docking presented in this work suggested at least two orientations of each studied ligand in the KAT II active site (see Figs. 3 and 4). More specifically, three possible orientations for olmesartan are presented in Fig. 3. In two orientations, olmesartan interacts with residues indicated for KYN (as previously published in Zakrocka et al. 2017b), including Ile19 (A), Arg20 (A), Gly39 (A), Leu40 (A), Tyr74 (A), Leu293 (A) from one subunit, and Tyr142 (B), Ser143 (B), Asn202 (B), Tyr233 (B), Phe355 (B), Phe387 (B), and Arg399 (B) from the opposite subunit (see details in Fig. 3(B, C)) as well as other residues presented in Fig. 3. Moreover, hydrogen bonds are formed between olmesartan (orientations 1 and 2) and four residues, including Ser17 (A) (hydroxyl group), Arg20 (A) and Arg399 (A) (guanidinium group), and Asn202 (B) (amino or carboxamide group) as well as between ligand and two water molecules (see Fig. 3(B, C)). Additional hydrogen
Fig. 2 Influence of ARBs on KAT II activity in rat kidney in vitro. Data are expressed as a percentage of control production, mean ± SD, n = 3
bonds are suggested between olmesartan in orientations 1 and 2 and PMP (co-factor) bound to the KAT II active site. Moreover, in orientation 2, tetrazole moiety is oriented in the opposite direction compared to orientation 1. In the orientation 3 of olmesartan, tetrazole moiety is rotated compared to orientation 1. However, the same residues from subunit A and only two residues (Tyr142 and Ser143) from subunit B were suggested as a common with KYN bound to KAT II. Hydrogen bonds are formed with four residues, two Ser17 (A) (hydroxyl group) and Arg20 (guanidinium group) (A) that are also suggested for orientations 1 and 2, Gln289 (A) (hydroxyl group), and Tyr142 (B) (hydroxyl group) (see Fig. 3(D)) as well as with six water molecules. Additional residues involved in olmesartan bindings were presented in Fig. 3(D) and Table S1 (see Supplementary Materials). In the case of candesartan, three orientations of the ligand were suggested by the molecular docking (Fig. 4a). In each orientation, candesartan interacts with the same residues as KYN, including Ile19 (A), Arg20 (A), Gly39 (A), Leu40 (A), Tyr74 (A), Leu293 (A) from one subunit, and Tyr142 (B), Ser143 (B), Asn202 (B), Tyr233 (B), Phe355 (B), Phe387 (B), and Arg399 (B) from the opposite subunit as well as other residues presented in Table S1. The higher number of residues involved in hydrogen bonding is found for candesartan in orientation 2. In particular, the hydrogen bond interactions are formed with five residues Ser17 (A) (hydroxyl group), Leu40 (A) (amino group), Arg399 (B) (guanidinium group), Asn202 (B) (amino group), and Tyr142 (B) (hydroxyl group), as well as with four water molecules. In orientations 1 and 3, candesartan forms hydrogen bonds with PMP (cofactor) bound to the KAT II active site, while less number of residues is involved in the hydrogen bonds formation (see Table S1 in Supplementary Materials). Finally, the molecular docking data suggest that valsartan binds in two orientations to the same site as previously indicated for other ARBs at the KAT II active site (for more details see Fig. 4b and Table S1 in Supplementary Materials). In orientation 1, lower number of residues [Ser17 (A) (hydroxyl group), Arg20 (A) and Arg399 (B) (guanidinium group), and Asn202 (B) (amino group)] were involved in hydrogen bond Fig. 3 Binding pocket of olmesartan within the KAT II crystal structure (a). Three different olmesartan orientations (b, c, and, d) overlap the KYN binding to KAT II active site (Han et al. 2008). Ligand (shown in magenta, cyan, and yellow) and co-factor (shown in orange) are rendered in stick mode (a-d), residues involved in ligand and PMP binding are shown in gray and green, respectively (b-d). For panels b-d: Residues from chain A are labeled with an asterisk to differentiate chain A from chain B residues. Black solid lines indicate hydrogen bonds as well as salt bridges formed between each ligand and amino acid residues, blue solid lines between ligands and water molecules, and yellow solid lines the hydrogen bonds formed between ligand and the co-factor. All residues involved in hydrogen bonding are marked in red. Oxygen atoms are colored red, nitrogen blue, phosphorus yellow, and chlorine green. All hydrogen atoms are hidden
Naunyn-Schmiedeberg's Arch Pharmacol
Naunyn-Schmiedeberg's Arch Pharmacol
Discussion
Fig. 4 Binding pocket of candesartan and valsartan within the KAT II crystal structure. Three candesartan and two valsartan orientations overlapping the KYN binding pocket within the KAT II (Han et al. 2008). Candesartan (a) and valsartan (b) are rendered with co-factor (shown in orange) in stick mode, while the KAT II surface is shown in gray
formations compared to orientation 2 [Ser77 (A), Leu293 (A), Asn202 (A), Arg20 (A), and Arg399 (B)]. However, additional three hydrogen bonds are suggested between valsartan in orientation 1 and PMP bound to the KAT II active site.
KAT expression in rat and human kidney Expression pattern of rat (Fig. 5a) and human (Fig. 5b) genes coding for KATs was studied based on microarray data. Profiling of Aadat, Kyat3, and Got2 genes coding for KAT II–KAT IV indicated that KATs are expressed at medium to high level in rat kidney. Human KAT-coding genes were expressed at similarly high level. Publically available microarray data repositories were searched for data on ARB effects on the expression of KAT-coding genes in rat kidney. Single experiment revealed that candesartan (1300 mg/kg) displayed no significant capacity to alter the expression of Aadat, Kyat3, nor Got2 in rat kidney upon 72-h treatment (Fig. 5c). No other microarray ARB-related data on gene expression in rat kidney were available at the time of the analysis.
In the present study, we found that all examined ARBs decrease KYNA production in rat kidney in vitro. Furthermore, molecular docking suggests that ARBs may bind to an active site of KAT II, an isoenzyme involved in KYNA production, confirming that ARBs lead to enzymatic inhibition of KYNA production. Gene expression profiling conducted on publically available microarray data revealed that KAT isoforms are expressed at considerable level in both rat and human kidneys. This data stands in line with previously published results on positive activity of KATs in renal tissue (Costa et al. 1999). Further data mining revealed only a single, negative experimental result regarding effects of ARBs on the expression of KAT-coding genes in kidney. Thus, it is hard to draw any conclusion whether ARBs can affect the KYNA production through inhibition of KATs expression. However, results of our enzymatic assays confirm that ARBs suppress KYNA synthesis via inhibition of KAT II activity, one of the best characterized KATs in rat kidney (Buchli et al. 1995). These observations are further supported by in silico docking of ARBs molecules to KAT II holoenzyme. Our results indicate that the studied ARBs bind to residues within the active site of KAT II, mirroring the interactions of the natural substrate, LKYN, which suggest the competitive mechanism of inhibition. Furthermore, recent work by Song et al. (2018) showed intensive immunohistochemical KAT II staining in rat kidney cortex. High level of KAT II expression in the kidney indicates its importance in KYNA renal production and suggests that impairment of KAT II activity may have substantial effect on kidney function. This supposition is strengthened by the finding that in mice lacking the KAT II gene, a decrease in blood creatinine level was observed (Yu et al. 2004). The effect of renin-angiotensin system (RAS) inhibition by ACE-Is or ARBs on KYNA production in rat tissues in vitro was recently explored. In previous studies, it was reported that ACE-Is variably affect KYNA synthesis in rat brain cortical slices in vitro. Lisinopril increased whereas ramipril decreased it and perindopril was ineffective (Zakrocka et al. 2016). What is more, lisinopril increased the activity of KAT I in rat brain cortex in vitro, ramipril decreased the activity of KAT I and KAT II, however perindopril did not change the activity of both analyzed enzymes (Zakrocka et al. 2016). More homogenous effects were exerted by ACE-Is in rat kidney in vitro. All tested ACE-Is (lisinopril, perindopril, and ramipril) lowered KYNA production in rat kidney in vitro (Zakrocka et al. 2017a). Lisinopril decreased the activity of KAT I in rat kidney, ramipril lowered the activity of both KAT I and KAT II, and perindopril did not have any influence on examined enzyme activity (Zakrocka et al. 2017a). Such discrepancies may be related to higher KATs’ concentration and KYNA
Naunyn-Schmiedeberg's Arch Pharmacol
Fig. 5 Expression of KAT-coding genes in rat and human kidneys. a Expression of Aadat, Kyat3, and Got2 mRNA in rat kidney. The genes code for KAT II, KAT III, and KAT IV, respectively (n = 4949). Probe for Kyat1 (gene coding for KAT I) was not present in the selected microarray platform. b Renal expression of human KYAT1, AADAT, KYAT3, and GOT2 genes coding for four isoforms of KAT: KATs I, II, III, and IV (n = 1313). c Effect of candesartan (1300 mg/kg) on the expression of Aadat (KAT II), Kyat3 (KAT III), and Got2 (KAT IV) in rat kidney at 72-
h time point. Empty symbols: vehicle control (n = 9); filled symbols: candesartan treatment (n = 3). One-way ANOVA with Tukey’s post hoc test; n/s, not significant. First quartile (Q1), interquartile range (IQR), and fourth quartile (Q4) of expression values of all genes of all samples within microarray platform that were available through Genevestigator software are marked on the right side of each plot. Expression values falling within these three ranges can be considered as low, medium, and high, respectively
production in rat kidney compared to the brain (Pawlak et al. 2003). Previously, three ARBs, irbesartan, losartan, and telmisartan, were reported to inhibit KYNA synthesis and both KATs’ activity in rat brain cortex in vitro (Zakrocka et al. 2017b). In the present study, all six studied ARBs consequently inhibited KAT II activity and reduced KYNA synthesis in kidney homogenates in vitro. Taken all these findings together, we may suggest that RAS inhibitors are regulators of cerebral and renal KYNA synthesis. Since all examined ARBs are known to prevent kidney damage and according to our study decrease KAT II activity and KYNA production in rat kidney, the hypothesis that this phenomenon contributes to the nephroprotective effect exerted by ARBs should be considered. Indeed, some researchers categorize KYNA as a uremic toxin. High KYNA serum concentration was reported in rat model of chronic renal failure (Pawlak et al. 2001b) as well in patients with endstage kidney failure (Pawlak et al. 2001a). Moreover, Grams et al. (2017) reported that KYNA serum level is negatively correlated with measured glomerular filtration rate (GFR). Presented results do not answer the question if high serum KYNA concentration is the cause or a result of kidney failure. As KYNA is secreted with the urine, it can be easily accumulated in kidney failure. Nevertheless, Kaczorek et al. (2017) showed that KYNA supplementation in feed could be harmful to multiple organs of rainbow trout, including kidney. Similarly, Giardino et al. (2009) have shown that NMDA receptor blockade is one of the mechanisms dysregulating function of podocytes, leading to proteinuria and renal failure (Giardino et al. 2009). In contrary, KYNA was shown to protect kidneys in various models of kidney damage. KYNA attenuated kidney damage in rats with bilateral renal ischemia (Pundir et al. 2013). From this point of view, it can be suggested that inhibition of KYNA synthesis in the kidney can be responsible for ARBs
renal side effects. Indeed, several lines of evidence suggest ARBs nephrotoxicity. Miloradović et al. (2016) showed that losartan administered in rats with ischemic acute renal failure caused prominent tubular necrosis and interstitial edema. Reduction in GFR after losartan treatment was also presented (Miloradović et al. 2016). Moreover, Weir (2017) reported that GFR decrease is a common side effect of RAS inhibitors. In this manner, lower renal KYNA production observed in our study may explain ARBs toxicity. Presented results indicate that all six investigated ARBs have inhibitory effect on KAT II activity and KYNA synthesis. Among examined ARBs, the strongest effect on KYNA production in the kidney homogenate was exerted by irbesartan, losartan, and olmesartan, whereas valsartan, candesartan, and losartan were the most effective KAT II inhibitors in rat kidney in vitro. Recorded differences between inhibitory effectiveness of ARBs in kidney homogenates and KAT II assay may be related to different experimental settings. KYNA production in kidney homogenate represents the activity of all KAT isoenzymes found in renal tissue. In order to examine effect of drugs upon KAT II activity, the partially purified renal enzymes were used to limit the interference of endogenous substances, like 3-hydroxykynurenine, that may affect KYNA production, as it was reported in rat brain (Guidetti et al. 1997). Moreover, glutamine was added to the enzymatic assay to lower the activity of KAT I and to facilitate the analysis of renal KAT II activity. Since KAT II is one of the best described KAT isoenzymes and there are no specific enzymatic assays used to measure KAT III and KAT IV activity, KAT II activity examination and molecular docking to KAT II active site were the main targets of our study. In the present study, six drug concentrations were utilized to analyze if examined ARBs inhibit KYNA synthesis dose dependently. The highest investigated concentration was 1 mM. However, it should be noted that most of the tested
Naunyn-Schmiedeberg's Arch Pharmacol
ARBs exerted significant inhibitory action at concentration as low as 50 μM. Similarly, in other studies, ARBs were tested up to 100 μM (Li et al. 2018) or 250 μM (Kato et al. 2017) concentrations. Based on our results, we conclude that ARBs decrease KYNA production in rat kidney in vitro via enzymatic inhibition of KYNA synthesis. Presented data extend our knowledge about ARBs in the kidney and add a new mechanism of their action. Further studies are needed to explore the exact role of KYNA in the kidney. Author contributions IZ, KTD, AW, KJ, and WAT conceived and designed research. IZ, KTD, AW, and TK conducted experiments. IZ, KTD, AW, and WAT analyzed data. IZ, KTD, AW, KJ, and WAT wrote the manuscript. All authors read and approved the manuscript. Funding This study was supported by the grant from National Science Centre (NCN) PRELUDIUM 4, No UMO-2012/07/N/NZ4/02088 and grant for young scientists from the Ministry of Science and Higher Education No. MNmb515/2016.
Compliance with ethical standards All applicable international, national, and/or institutional guidelines for the care and use of animals were followed. All procedures performed in studies involving animals were in accordance with the ethical standards of the I Local Ethics Committee for Animal Experiments in Lublin, Poland. Conflict of interest The authors declare that they have no conflict of interest. Open Access This article is distributed under the terms of the Creative Commons Attribution 4.0 International License (http:// creativecommons.org/licenses/by/4.0/), which permits unrestricted use, distribution, and reproduction in any medium, provided you give appropriate credit to the original author(s) and the source, provide a link to the Creative Commons license, and indicate if changes were made.
References Altintas MM, Moriwaki K, Wei C, Möller CC, Flesche J, Li J, Yaddanapudi S, Faridi MH, Gödel M, Huber TB, Preston RA, Jiang JX, Kerjaschki D, Sever S, Reiser J (2014) Reduction of proteinuria through podocyte alkalinization. J Biol Chem 289:17454– 17467. https://doi.org/10.1074/jbc.M114.568998 Bądzyńska B, Zakrocka I, Sadowski J, Turski WA, KompanowskaJezierska E (2014) Effects of systemic administration of kynurenic acid and glycine on renal haemodynamics and excretion in normotensive and spontaneously hypertensive rats. Eur J Pharmacol 743: 37–41. https://doi.org/10.1016/j.ejphar.2014.09.020 Bozic M, Valdivielso JM (2015) The potential of targeting NMDA receptors outside the CNS. Expert Opin Ther Targets 19:399–413. https:// doi.org/10.1517/14728222.2014.983900 Buchli R, Alberati-Giani D, Malherbe P, Köhler C, Broger C, Cesura AM (1995) Cloning and functional expression of a soluble form of kynurenine/alpha-aminoadipate aminotransferase from rat kidney. J Biol Chem 270:29330–29335 Costa CV, Ragazzi E, Caparrotta L et al (1999) Liver and kidney kynurenine aminotransferase activity in different strains of rats. Adv Exp Med Biol 467:629–635
Dryer SE (2015) Glutamate receptors in the kidney. Nephrol Dial Transplant 30:1630–1638. https://doi.org/10.1093/ndt/gfv028 Fukuda A, Wickman LT, Venkatareddy MP, Sato Y, Chowdhury MA, Wang SQ, Shedden KA, Dysko RC, Wiggins JE, Wiggins RC (2012) Angiotensin II-dependent persistent podocyte loss from destabilized glomeruli causes progression of end stage kidney disease. Kidney Int 81:40–55. https://doi.org/10.1038/ki.2011.306 Giardino L, Armelloni S, Corbelli A, Mattinzoli D, Zennaro C, Guerrot D, Tourrel F, Ikehata M, Li M, Berra S, Carraro M, Messa P, Rastaldi MP (2009) Podocyte glutamatergic signaling contributes to the function of the glomerular filtration barrier. J Am Soc Nephrol 20: 1929–1940. https://doi.org/10.1681/ASN.2008121286 Grams ME, Tin A, Rebholz CM, Shafi T, Köttgen A, Perrone RD, Sarnak MJ, Inker LA, Levey AS, Coresh J (2017) Metabolomic alterations associated with cause of CKD. Clin J Am Soc Nephrol 12:1787– 1794. https://doi.org/10.2215/CJN.02560317 Gramsbergen JBP, Schmidt W, Turski WA, Schwarcz R (1992) Agerelated changes in kynurenic acid production in rat brain. Brain Res 588:1–5. https://doi.org/10.1016/0006-8993(92)91337-E Guidetti P, Okuno E, Schwarcz R (1997) Characterization of rat brain kynurenine aminotransferases I and II. J Neurosci Res 50:457– 465. https://doi.org/10.1002/(SICI)1097-4547(19971101)50: 33.0.CO;2-3 Han Q, Robinson H, Li J (2008) Crystal structure of human kynurenine aminotransferase II. J Biol Chem 283:3567–3573. https://doi.org/ 10.1074/jbc.M708358200 Hruz T, Laule O, Szabo G, Wessendorp F, Bleuler S, Oertle L, Widmayer P, Gruissem W, Zimmermann P (2008) Genevestigator V3: a reference expression database for the meta-analysis of transcriptomes. Adv Bioinforma 2008:1–5. https://doi.org/10.1155/2008/420747 Kaczorek E, Szarek J, Mikiewicz M, Terech-Majewska E, Schulz P, Małaczewska J, Wójcik R, Siwicki AK (2017) Effect of feed supplementation with kynurenic acid on the morphology of the liver, kidney and gills in rainbow trout (Oncorhynchus mykiss Walbaum, 1792), healthy and experimentally infected with Yersinia ruckeri. J Fish Dis 40:873–884. https://doi.org/10.1111/jfd.12567 Kato Y, Mukai Y, Rane A, Inotsume N, Toda T (2017) Combined effect of telmisartan and fluvastatin on arachidonic acid metabolism in human liver microsomes. Xenobiotica 48:898–903. https://doi.org/ 10.1080/00498254.2017.1384079 Kobori H, Mori H, Masaki T, Nishiyama A (2013) Angiotensin II blockade and renal protection. Curr Pharm Des 19:3033–3042. https://doi. org/10.2174/1381612811319170009 Lin CS, Hung SF, Huang HS, Ma MC (2015) Blockade of the N-methylD-aspartate glutamate receptor ameliorates lipopolysaccharide-induced renal insufficiency. PLoS One. https://doi.org/10.1371/ journal.pone.0132204 Li H, Zhao JL, Zhang YM, Han SX (2018) Inhibitory effects of candesartan on KCa3.1 potassium channel expression and cell culture and proliferation in peripheral blood CD4+T lymphocytes in Kazakh patients with hypertension from the Xinjiang region. Clin Exp Hypertens. https://doi.org/10.1080/10641963. 2017.1377212 Miloradović Z, Ivanov M, Jovović Đ, Karanović D, Vajić UJ, MarkovićLipkovski J, Mihailović-Stanojević N, Milanović JG (2016) Angiotensin 2 type 1 receptor blockade different affects postishemic kidney injury in normotensive and hypertensive rats. J Physiol Biochem 72:813–820. https://doi.org/10.1007/s13105-016-0514-4 Pawlak D, Pawlak K, Malyszko J, Mysliwiec M, Buczko W (2001a) Accumulation of toxic products degradation of kynurenine in hemodialyzed patients. Int Urol Nephrol 33:399–404. https://doi. org/10.1023/A:1015238418500 Pawlak D, Tankiewicz A, Buczko W (2001b) Kynurenine and its metabolites in the rat with experimental renal insufficiency. J Physiol Pharmacol 52:755–766
Naunyn-Schmiedeberg's Arch Pharmacol Pawlak D, Tankiewicz A, Matys T, Buczko W (2003) Peripheral distribution of kynurenine metabolites and activity of kynurenine pathway enzymes in renal failure. J Physiol Pharmacol 54:175–189 Perfilova VN, Tyurenkov IN (2016) Glutamate Metabotropic Receptors: Structure, Localisation. Functions Usp Fiziol Nauk 47:98–112 Pundir M, Arora S, Kaur T, Singh R, Singh AP (2013) Effect of modulating the allosteric sites of N-methyl-D-aspartate receptors in ischemia-reperfusion induced acute kidney injury. J Surg Res 183: 668–677. https://doi.org/10.1016/j.jss.2013.01.040 Satou R, Shao W, Navar LG (2015) Role of stimulated intrarenal angiotensinogen in hypertension. Ther Adv Cardiovasc Dis 9:181– 190. https://doi.org/10.1177/1753944715585512 Song C, Clark SM, Vaughn CN, Nicholson JD, Murphy KJ, Mou TCM, Schwarcz R, Hoffman GE, Tonelli LH (2018) Quantitative analysis of kynurenine aminotransferase II in the adult rat brain reveals high expression in proliferative zones and corpus callosum. Neuroscience 369:1–14. https://doi.org/ 10.1016/j.neuroscience.2017.11.001 Stone TW, Addae JI (2002) The pharmacological manipulation of glutamate receptors and neuroprotection. Eur J Pharmacol 447:285–296. https://doi.org/10.1016/S0014-2999(02)01851-4
Weir MR (2017) Acute changes in glomerular filtration rate with reninangiotensin system (RAS) inhibition: clinical implications. Kidney Int 91:529–531. https://doi.org/10.1016/j.kint.2016.11.019 Yu P, Di Prospero NA, Sapko MT et al (2004) Biochemical and phenotypic abnormalities in kynurenine aminotransferase II-deficient mice. Mol Cell Biol 24:6919–6930. https://doi.org/10.1128/MCB. 24.16.6919-6930.2004 Zakrocka I, Turski WA, Kocki T (2016) Angiotensin-converting enzyme inhibitors modulate kynurenic acid production in rat brain cortex in vitro. Eur J Pharmacol 789:308–312. https://doi.org/10.1016/j. ejphar.2016.07.023 Zakrocka I, Kocki T, Turski WA (2017a) The effect of three angiotensinconverting enzyme inhibitors on kynurenic acid production in rat kidney in vitro. Pharmacol Reports 69:536–541. https://doi.org/10. 1016/j.pharep.2017.01.023 Zakrocka I, Targowska-Duda KM, Wnorowski A, Kocki T, Jóźwiak K, Turski WA (2017b) Angiotensin II type 1 receptor blockers inhibit KAT II activity in the brain—its possible clinical applications. Neurotox Res 32:639–648. https://doi.org/10.1007/s12640-0179781-2 Zhang F, Liu H, Liu D, Liu Y, Li H, Tan X, Liu F, Peng Y, Zhang H (2017) Effects of RAAS inhibitors in patients with kidney disease. Curr Hypertens Rep 19:72. https://doi.org/10.1007/s11906-017-0771-9