SAGE-Hindawi Access to Research Stroke Research and Treatment Volume 2010, Article ID 729391, 6 pages doi:10.4061/2010/729391
Research Article Ankle Blood Pressure and Pulse Pressure as Predictors of Cerebrovascular Morbidity and Mortality in a Prospective Follow-Up Study Heikki J. Hietanen,1 Rauni P¨aa¨ kk¨onen,2 and Veikko Salomaa2 1 Department 2 National
of Clinical Physiology, Helsinki Deaconess Institute, Alppikatu 2, 00530 Helsinki, Finland Institute for Health and Welfare (THL), Helsinki, Finland
Correspondence should be addressed to Heikki J. Hietanen,
[email protected] Received 23 August 2010; Revised 24 November 2010; Accepted 23 December 2010 Academic Editor: Bruce Ovbiagele Copyright © 2010 Heikki J. Hietanen et al. This is an open access article distributed under the Creative Commons Attribution License, which permits unrestricted use, distribution, and reproduction in any medium, provided the original work is properly cited. Background and Objective. We examined the association of elevated ankle blood pressure (ABP), together with exercise blood pressure, with incident cerebrovascular (CV) morbidity and mortality in a prospective follow-up study of 3, 808 patients. The results were compared with pulse pressure, another indicator of arterial stiffness. Methods. Patients with normal ankle and exercise brachial blood pressures were taken as the reference group. Pulse pressure was considered as quartiles with the lowest quartile as the reference category. Results. A total of 170 subjects had a CV event during the follow-up. Multivariate adjusted hazard ratio of a CV event was 2.24 (95% CI 1.43–3.52, P < .0001) in patients with abnormal ABP. The pulse pressure was significant only in the model adjusted for age and sex. Conclusion. The risk of a future CV event was elevated already in those patients among whom elevated ABP was the only abnormal finding. As a risk marker, ABP is superior to the pulse pressure.
1. Introduction High ankle blood pressure (ABP) might be an emerging risk marker for early subclinical damage of arterial vessels evaluated as elevated ankle blood pressure alone [1, 2] or in conjunction with the elevated ankle brachial index (ABI) [3–5]. The high ABP or high ABI provides an indication of arterial stiffness or atherosclerosis of the vessel wall whereas the low ankle pressure or low ABI is indicative of advanced atherosclerosis, which has reached the point where the blood flow is impeded. Several studies have demonstrated that there is a nonlinear, U-shaped association between the ankle brachial index and total mortality or cardiovascular events [4–10]. On the other hand, while the normal ABI does not exclude significant peripheral arterial disease [6, 11, 12] the ABP alone could be useful in evaluating early vascular changes. The pulse pressure (PP) has been used as a crude indicator of arterial stiffness [13–17]. The increased PP predicts
dementia [18] and cardiovascular mortality [15], acting more on coronary than cerebrovascular (CV) vessels [19]. In hypertensive subjects with high PP, stroke mortality is increased [20, 21]. In many recently published papers the central PP is more closely related to vascular damage than the peripheral PP [13, 22–26], and the peripheral pressure does not necessarily accurately reflect the central pressure. The difference between central and peripheral PP is dependent on age, height, and heart rate making the evaluation of aortic pulse pressure from a peripheral pulse pressure difficult. Elevated ABP may provide a pivotal opportunity to identify persons at high risk of stroke or TIA. Accordingly, the main aim of the present study was to assess the utility of ABP, together with exercise brachial BP, as a predictor of CV events in a prospective setting. The second aim was to investigate whether the elevated ABP predicts CV events better than the pulse pressure. Both measurements reflect aortic stiffness. We hypothesized that the ABP would be superior to the pulse pressure for screening purposes.
2
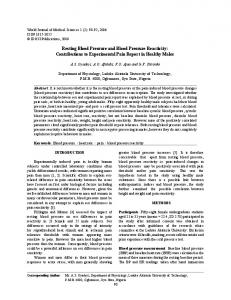
2. Material and Methods This prospective follow-up study was initiated in August 1989. The methods of baseline data collection have been described in our previous paper [1]. The subjects were derived from a group of 4,038 consecutive ambulatory patients who underwent a symptom-limited bicycle exercise test at the Deaconess Institute between August 1989 and December 1995. Patients with a history of cardiovascular disease (including those with a history of cerebrovascular events) at baseline investigation were excluded from the analyses, and the final study group consisted of 3,808 patients. The study was approved by the Ethical Committee of the National Public Health Institute of Finland. The ankle and brachial blood pressures were obtained simultaneously after a 5 min rest in supine position using the Doppler sonography for the ABP and the standard mercury sphygmomanometer for the left arm blood pressures. Subjects were divided to five groups based on the ABP at rest and exercise blood pressures (EBPs) at a moderate exercise level (men 150 Watts, women 80 Watts) as shown in the flow chart (Figure 1). The reference group consisted of “normal” patients with normal ABP (215 mmHg). Patients in group 4 had elevated EBP, but the ABP was normal. The discrepancy between the ABP and EBP indicates significant atherosclerotic changes in conduit vessels. Group 5, the unclassifiable group, consisted of patients, who could not tolerate the moderate exercise level. The follow-up was 16 years, until the end of 2007 using record linkage of the study data with the National Hospital Discharge Register and the National Causes of Death Register. The endpoint was a major CV event, that is, death due to CV, nonfatal stoke, or a transient ischemic attack (TIA). The 9th (until 31.12.1995) and 10th versions of the International Classification of Diseases (ICD-9 and ICD-10) were used for coding of causes of death and hospitalizations. We took as CV events the ICD-9 codes 431, 436, 4330A, 4331A, 4339A, 4340A, 4341A, 4349A, and 435 or the ICD-10 codes I61, I63-I64. G45. These registers cover all deaths and hospitalizations in Finland. Thus, the coverage of follow-up was 100% for symptomatic stroke events leading to hospitalization or death in Finland. It is however likely that all TIAs have not been hospitalized and those treated on an ambulatory basis are not identified as CV events in the present study. Altogether, 170 CV events were observed during the follow-up. Of them, 31 were fatal. As a whole, the study consisted of 53,044 person-years of followup. 2.1. Statistics. Data are expressed as mean ± SD for continuous variables or counts and proportions for categorical variables. The following cardiovascular risk factors were dichotomized: early parental cardiovascular death (yes or no), self-reported elevated cholesterol (>6 mmol/l, yes or no), self-reported elevated blood glucose (>6 mmol/l, yes or no), and current smoking (yes or no). Age, BMI,
Stroke Research and Treatment smoking (years, packet/day), and blood pressure (mmHg) were handled as continuous variables. Student’s t-tests were used for comparisons of normally distributed variables, between persons with and without a CV event during the follow-up. Categorical variables were compared using chisquare tests. Associations between the blood pressure groups, and CV mortality and morbidity (first events) were analyzed using Kaplan-Meier curves and log-rank tests. Cox proportional hazards models were used for estimating the multivariateadjusted independent associations of the blood pressure groups or the quartiles of pulse pressure with the risk of a CV event. Results were expressed as hazard ratios (HRs) and 95% confidence intervals (CIs) compared to the “normal” group or to the lowest quartile of pulse pressure. The basic models were adjusted for age and sex. The larger models were further adjusted for BMI, physical working capacity (METs), self reported blood glucose and cholesterol, current smoking, resting brachial systolic blood pressure, and early parental history of cardiovascular disease. The statistical analyses were carried out with R (Version 2.11.1).
3. Results Baseline characteristics of the study participants are outlined in Table 1, stratified by the CV event. A total of 170 subjects developed a CV event (30 TIAs, 109 nonfatal strokes and 31 fatal strokes) during the follow-up. The patients with a CV event were older and the blood pressures were higher. In patients without a CV event almost all other risk factors were more favorable compared with the CV event group. Figure 2 shows Kaplan-Meier curves for CV event in different blood pressure groups. The curves diverge continuously and significantly (P = .001, log rank test) throughout the 16 years of follow-up. The patients with elevated ankle blood pressure with or without exaggerated exercise blood pressure had 2.62.7-fold risk of a CV event compared with the reference group in the age- and gender-adjusted model (Table 2). In the wider model the hazard ratio was 2.2–2.4. In patients with obstructive changes in leg arteries (Group 4) the risk of a future CV event was 2.7-fold in the basic model and 2.4-fold in the multivariate adjusted model. The greatest hazard ratio (7.8 in the basic model and 5.8 in the wider model) was found in the unclassifiable patients (Group 5). In this group, 55 patients had ABI < 1.0, and 25 patients had ABI < 0.9. Pulse pressures in the five blood pressure groups were 42.7 ± 11, 54.4 ± 15, 58.5 ± 14, 49.0 ± 14, and 52.6 ± 16 mmHg, respectively. Correlation between the pulse pressure and the ankle blood pressure in the blood pressure groups I–III was high (r 2 = 0.48). The correlation was lost, however, when obstructive changes were observed in the conduit vessels (Group 4) (r 2 = 0.11). The risk of a CV event by quartile of pulse pressure is shown in Table 3. The reference category is the lowest quartile of the pulse pressure. Significantly elevated risk for a CV event was found only for the fourth quartile in the smaller model.
Stroke Research and Treatment
3
All patients n = 4038
Excluded due to vascular disease at baseline, n = 230
Reference group ABP < 175 mmHg EBP ≤ 215 mmHg n = 2169
Group 2 ABP ≥ 175 mmHg EBP ≤ 215 mmHg n = 775
Group 3 ABP ≥ 175 mmHg EBP > 215 mmHg n = 497
Group 4 ABP < 175 mmHg EBP > 215 mmHg n = 215
Group 5 unclassifiable n = 140
Figure 1: A flow-chart describing derivation of the blood pressure groups from all consecutive patients undergoing a clinical exercise test during the period 1989 to 1995. ABP: ankle blood pressure, EBP: brachial exercise blood pressure at the level of 150 Watts for men and 80 Watts for women. Kaplan-Meier curves for cerebrovascular morbidity 1
Survival function
0.9
0.8
0.7
0.6
0.5 0 Reference Group 1 Group 2 Group 3 Group 4 Group 5
N= N= N= N= N=
2169 775 497 228 125
50 2154 757 483 221 125
100 (months)
150
200
2123 721 464 214 100
1655 492 285 157 70
147 39 13 13 5
Figure 2: Kaplan-Meier curves for cerebrovascular (CV) events according to specified blood pressure group. Log-rank test for the difference between the blood pressure groups: P < .0001. The numbers indicate people remaining in the follow-up at different points in time. The reference group consists of patients with normal brachial pressure (