Journal of Applied Life Sciences International 3(4): 143-156, 2015; Article no.JALSI.2015.036 ISSN: 2394-1103
SCIENCEDOMAIN international www.sciencedomain.org
Application of Artificial Neural Networks to Estimate Color Surface Features of Three Maturity Stages of Tomato Based on Dimensions and Weight A. S. Kassem1, M. A. Sabbah1, A. M. Aboukarima2* and R. M. Kamel3 1
Department of Agricultural and Biosystems Engineering, Faculty of Agriculture, Alexandria University, Alexandria, Egypt. 2 Agricultural Engineering Research Institute, Agricultural Research Center, Giza, Egypt. 3 Department of Food Science and Technology, Faculty of Agriculture, Alexandria University, Alexandria, Egypt. Authors’ contributions This work was carried out in collaboration between all authors. Author ASK is supervisor and reviewed the measurements and the final manuscript. Author MAS is the second supervisor and reviewed the measurements and the final manuscript. Author AMA performed the artificial neural network analysis, managed the literature review and wrote the first draft of the manuscript. Author RMK made the system, run experiments and data analysis. All authors read and approved the final manuscript. Article Information DOI: 10.9734/JALSI/2015/19709 Editor(s): (1) Muhammad Kasib Khan, Department of Parasitology, University of Agriculture, Pakistan. Reviewers: (1) Anonymous, Universiti Malaya, Malaysia. (2) Angelo Maria Giuffre, University “Mediterranea” of Reggio Calabria, Italy. Complete Peer review History: http://sciencedomain.org/review-history/10585
th
Original Research Article
Received 24 June 2015 Accepted 23rd July 2015 th Published 16 August 2015
ABSTRACT Aims: The aim of this research was to investigate the effect on application of artificial neutral network (ANN) to estimate the color surface of fruit of three maturity stages of tomatoes based on fruit dimensions (length and width) and weight. Study Design: Simple machine vision system was built to extract color surface features of tomato samples. Place of Study: Agricultural and Bio-systems Engineering Department, Faculty of Agriculture, Alexandria University, Egypt. Methodology: Samples of variety of tomatoes (Baladi variety) were manually harvested from the field at Educo, El- Beheira Governorate, Egypt. Three maturity stages of the variety were harvested _____________________________________________________________________________________________________ *Corresponding author: Email:
[email protected],
[email protected];
Kassem et al.; JALSI, 3(4): 143-156, 2015; Article no.JALSI.2015.036
in different days by eye inspection based on their color. The maturity stages were green, pink and red. The weight and dimensions of each maturity samples were measured. Samples images were taken on a white background and manual mode, no zoom, no flash were used by the camera. Surface color of the tomato samples was analyzed quantitatively. ANN model to estimate the surface color was applied. Results: The evaluation results of testing data set showed that ANN could be able to estimate color 2 surface features of tomatoes at different accuracy as evaluated by coefficient of determination (R ) of 0.7161, 0.8273, 0.8605, 0.5448, 0.8056, 0.7954 and 0.854, respectively for L*, a* b* Hue, Chroma, color index and color difference with true red. The obtained weights from the ANN training process were formulated in Excel spreadsheet. Conclusion: The studied color surface features of tomato for three maturity stages and input variables well correlated. The tomato weight contributed significantly in estimating all surface color features of tomato compared to the length and width. The developed Excel spreadsheet could be used as a quick tool to estimate color surface features of tomato. Keywords: Artificial neural networks; color surface features; Excel spreadsheet; Tomato.
1. INTRODUCTION Tomatoes have a large quantity of water (93.5%), calcium (0.07%) and niacin. These components are essential in the metabolic activities of humans and a good source of vitamins A, C and E [1-2]. Tomato is also a good source of minerals [3]. Tomato color has been used as quality parameters [4] by which consumers consider a tomato to be of high quality if it has good color and uniform ripening [5]. Additionally, visible quality of tomato is another parameter to evaluate fruits. It based on visual quality determinants such as freshness, mold growth, decay, shriveling, smoothness, shininess and homogeneity [6-7]. Tomato is commercial commodity that plays a major role in Egyptian economy. It is considered as one of the major vegetable crops because of its nutritional, consumption, processing and export value. Information regarding color surface features of tomato is vital for grading systems and it is also necessary for assessing quality of tomato. On the other hand, machine vision with image processing [8] or similar techniques [9-10] are required to get color surface features of tomato. This is time consumed and expensive cost as the tomato is generally harvested at different maturity [11]. Stages of tomato maturity are classified as mature green: fruits are mature and entirely light to dark green, breaker: Yellow or pink color appearance first but not more than 10%, turning: Yellow or pink color is between 10 to 30%, pink: Pink or red color ranges between 30 to 60% and red: Red color is more than 60% but less than 90% [12]. Researchers have been developed mathematical models to get tomatoes quality parameters from
their dimensional measurements. Clement et al. [13] reported that lycopene content of tomato was accurately predicted along with color variables such as Hunter and color parameters (a, L and b). Taheri-Garavand et al. [14] modeled tomato mass using single and multiple variable regressions based on tomato dimensional characteristics. First projected areas and actual volume as a dimensional characteristics were the most appropriate factors for estimating tomatoes mass. Ghazavi et al. [15] estimated mass of tomatoes for three ripeness levels based on three dimensions (length, width and thickness). Izadi et al. [16] calculated tomato fruit mass based on intermediate and diameter using a nonlinear regression. Recently, artificial neural networks (ANNs) are recognized as good tools for dynamic modeling as reported by numerous researches papers in different fields as example modeling of tomato drying process [17], sorting orange fruit [18], classification of tomato [19-20], egg weight estimation [21], prediction of quality characteristics of apples [22], prediction tomato maturity stage [23] and evaluating tomato maturity using color grading system [8]. ANNs do not require parameters of physical models and have the ability to learn from experimental data. Furthermore, they are capable of handling complex systems with nonlinearities and interactions between decision variables [22]. The main objective of this study was to build an ANN model to estimate color surface features (L*, a* b* Hue, Chroma, color index and color difference with true red) of three maturity stages of tomatoes based on dimensions and weight. The obtained weights from the ANN training process could be formulated in Excel spread
144
Kassem et al.; JALSI, 3(4): 143-156, 2015; Article no.JALSI.2015.036
sheet to be used as a quick tool to estimate color surface features.
expression, and the color value to be taken should be the average color value of a whole tomato [8].
2. MATERIALS AND METHODS 2.1 Samples of Tested Tomato Samples of variety of tomatoes (Baladi variety) were manually harvested from the field at Educo, El-Beheira Governorate, Egypt. Three maturity stages of the variety were harvested in different days by eye inspection based on their color. The maturity stages were green, pink and red. The weight and dimensions of each maturity samples were considered. Tomato length is the lowest dimension and width is the largest one of fresh tomatoes. All dimensions were obtained using digital vernier caliper. The weight of the fresh tomato samples were obtained using electrical digital balance XP 3000 (accuracy ± 0.1 g, range 3000 g).
2.2 Color Surface Features Extraction Simple machine vision system was built to extract color surface features of tomato samples (Fig. 1). The experiments were conducted at Agricultural and Biosystems Engineering Department, Faculty of Agriculture, Alexandria University, Egypt. The lighting chamber dimensions are 30×30×30 cm and fabricated from wood. Four lighting 26 W fluorescent lamps were used as light source (lumen = 1250 +/20%). The lamps were situated 15 cm above the tomato sample and at an angle of 90º with the sample. A color digital camera, model BenQ DCL1020 with 10.0 Mega Pixels was located vertically over the background at a distance of 30 cm. The angle between the camera lens and the lighting source axis was approximately 90°. The camera was fixed on the top of the lighting chamber. Samples images were taken on a white background and manual mode, no zoom, no flash were used by the camera. Images are stored in JPEG format. The camera was connected to the USB port of a PC (Pentium 4, Intel, 2.8 GHZ, 512MB RAM, 60 GB hard disk) provided with a control software version 1.0.1 of Windows for image acquisition by BenQ to visualize and acquire the digitalized images directly from the computer. Measurements of surface color were made at four positions on the surface of each tomato. Average data for four positions were used in the analysis. Maturity of tomato can be determined by its color
Fig. 1. Simple vision system
2.3 Surface Color Features Hunter Lab system is one type of measuring color systems. It has proven valuable in describing visual color deterioration and providing useful information for quality control in various fruits and vegetables. The color parameters are expressed as L (lightness), a (redness / greenness) and b (yellowness / blueness). The Hunter “L” value represents the lightness or darkness of a sample on a scale of 0 to 100 (100 being white and 0 being black). Hunter “a” value represents the greenness or redness of the sample (-50 being green and +50 being red). Hunter “b” value is also rated on a scale of -50 to +50, with -50 representing blue and +50 representing yellow. The surface color of the tomato samples was analyzed quantitatively using Photoshop [24] (Fig. 2). The Histogram Window of Photoshop used to determine the color distributions along the x-axis and y-axis (Fig. 3). In Fig. 3, the Histogram Window displays the statistics (mean, standard deviation, median, percentage, and so on) of the color value L. The Histogram Window can also display the statistics for two other color values (a and b), which is done by selecting a and b under the Channel drop-down menu. Hence, the mean color of tomatoes samples can be obtained easily using the Histogram Window. The Lightness, a, and b in the Histogram Window are not standard color values. However, they can be converted to L*, a* and b* values using the following formulas [25]:
145
Kassem et al.; JALSI, 3(4): 143-156, 2015; Article no.JALSI.2015.036
When a* < 0,
Lightness 100 255
(1)
a*
240a 120 255
(2)
b*
240b 120 255
(3)
L*
H°= 180+ tan
-1
(5)
Hue or true color is the angle between the color vector and the a+ axis, 2
Another different surface color features could be calculated according to the following equations [26]: Hue= H°= tan -1 (b*/a*)2
(b*/a*)
2 0.5
Chroma= (a* + b* )
Color index = (2000 x a*)/(L* x (a*2+b*2)0.5 ) (7) [27] 2
Color difference with true red (DE) = [(L*-50) + (a*-60)2 +b*2] 0.5 (8)
(4)
Fig. 2. Analyzing tomato surface color using photoshop software
Fig. 3. Histogram window of Photoshop software
146
(6)
Kassem et al.; JALSI, 3(4): 143-156, 2015; Article no.JALSI.2015.036
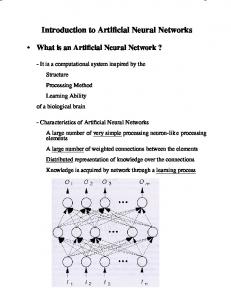
2.4 Modeling Surface Color Features by ANN Artificial neural networks (ANN) are used to handle experimental data, and their benefits have been more and more recognized in various fields of technology and science (such as biology, ecology, physics, chemistry, agronomy, economy, medicine, mathematics and computers science [28]. Multilayer artificial neural networks are often used in biological and agricultural research. The input and output layers are always needed, and in between them there are middle layers that are called hidden. Artificial neural networks can perform various tasks, the most popular being: Approximation, classification of formulas, prediction, compression, interpolation and association [28]. In this study, feed forward multilayer artificial neural networks are built by the help of commercially available QNET 2000 software [29]. This software is a Windows-based package, which supports standard back-propagation algorithm for training purposes. QNET 2000 operates via a graphical user interface (GUI) that enables the user to load the training and test sets, design the network architecture and feed values for the training parameters. The ANN used in this study was a standard backpropagation neural network. Before training, a certain pre-processing steps on the network inputs and targets to make more efficient neural network training was performed using the following formula:
T
(t t min ) (0.85 0.15) 0.15 (9) (t max t min )
Where t is the original values of input and output parameters, T is the normalized value; tmax and tmin are the maximum and minimum values of the input and the output parameters in training data set, respectively. The training data was used to compute the network parameters. The testing data was used to ensure robustness of the network parameters. In this study, the software was prepared to select randomly the testing data points (10 patterns) from the whole date set (237 patterns). Table 1 depicts some of input and related output data. Table 2 illustrates minimum and maximum values of the input and output variables in the used data set for training process of ANN model.
The input parameters of the network were three maturity stages (green, pink and red) of tomato, length, width and weight of samples. The output parameters were L*, a* b* Hue, Chroma, color index and color difference which represent surface color features of tomato. Different networks with single and two hidden layers topology were tried. However, in this study, trial and error approach was used to find out the optimal number of neurons in the hidden layer(s). The number of neurons in the hidden layer(s) of the network was changed from 2 to 20 neurons. Also, transfer function was varied; however, they were sigmoid and hyperbolic tangent (tanh) in the hidden layer(s). The learning rate was varied by software itself and the momentum coefficient was fixed. The training process determines the ANN weights. At the beginning of training process, the weights are initialized with a set of random values. The goal of learning is to determine a set of weights that will minimize the error function [30]. As training proceeds, the weights are systematically updated according to a training rule. The best ANN model was elected based on highest correlation coefficient and lowest training error. The best ANN architecture had 15 neurons in the first hidden layer as depicted in Fig. 4 to model color surface features. The Iterations was 46176 epochs, training error was 0.065127, test set error was 0.070025, learning rate was 0.019964 and momentum factor was 0.8. Table 3 presents network statistics from Qnet software for color surface features during training and testing phase. By inspection the results in Table 3, it is clear that correlation coefficients were in the range of 0.7381 to 0.92763 for testing data set, showing that color surface features of tomato and input variables well correlated.
2.5 Evaluation of Models Predictability The actual and the predicted surface color features were evaluated by using popular error criteria. They were mean absolute error (MAE), root means square error (RMSE) and mean relative error (MRE). They are computed as follows:
147
MAE
1 i N q im - qip N i 1 2
i N
q RMSE
(10)
im
q ip
i 1
(11)
N
Kassem et al.; JALSI, 3(4): 143-156, 2015; Article no.JALSI.2015.036
100 i N q im - q ip MRE N p im i 1 Where
(12)
qim and qip are actual surface color
features and predicted surface color features by ANN model, respectively and N is number of observations. The coefficient of determination (R2) is also determined to reflect the degree of fit 2 for the ANN model [31]. The closer the R value is to 1, the better the model fits to the actual data [32].
2.6 Spreadsheet Design Microsoft Excel spreadsheet is easy user interface for calculations and compatible with most computer operating systems. In this study, a spreadsheet was created using Microsoft Excel 2010 to be used as a quick tool to estimate color surface features for three maturity stages (green, red and pink) of tomato based on the obtained weights from training the ANN model. The
spreadsheet contains two worksheets. The first one called inputs and result, on which the required input data and outputs for color surface features for three maturity stages (green, red and pink) of tomato, are seen. The second one contains all calculations. When Excel file runs, the user is met a table containing the inputs variables (Fig. 5) which is tomato dimensions (length and width) and weight and three maturity stages (green, red and pink). The spreadsheet contains conditions for minimum and maximum values of inputs to ensure that the ranges of the data are within data. Fig. 6 shows screenshot for outputs variables (color surface features for three maturity stages (green, red and pink) of tomato in Excel. Thus the developed spreadsheet is an easy user interface tool for estimation lightness, redness/greenness and yellowness/blueness of three maturity stages (green, red and pink) of tomato. Additionally, Hue, Chroma, Color Index and Color difference with true red of such maturity stages could be obtained.
Fig. 4. The best ANN architecture for predicting surface color feature of tomato
148
Kassem et al.; JALSI, 3(4): 143-156, 2015; Article no.JALSI.2015.036
Table 1. Some of input and related output data using in training ANN model
Green
Pink
Red
1 1 1 0 0 0 0
0 0 0 1 1 0 0
0 0 0 0 0 1 1
Inputs Tomato length (mm) 48.6 50.2 41.5 42.6 43.3 39.1 36.0
Tomato width (mm) 73.9 70.5 64.4 56.3 69.5 59.8 66.7
Tomato weight (g) 134.1 121.0 95.9 78.9 124.4 85.5 109.4
L*
a*
b*
Hue
49.77 42.90 43.65 36.88 41.53 35.11 34.91
-18.06 -16.27 -17.03 1.62 -8.40 19.13 21.25
34.25 28.53 30.42 22.60 21.48 17.38 19.30
74.46 71.99 72.60 89.71 81.29 39.56 39.53
Outputs Chroma 38.72 32.84 34.87 22.65 23.06 25.85 28.71
Color Index -18.74 -23.09 -22.38 3.88 -17.55 42.16 42.40
Color difference with true red 85.25 81.74 83.07 63.96 72.19 46.85 45.85
Table 2. Minimum and maximum of the input and output variables in the used data set for training process of ANN model Statistical parameters
Green
Pink
Red
Minimum Maximum
1 0
1 0
1 0
Inputs Tomato length (mm) 59.2 28
Tomato width (mm) 94 43.6
Tomato weight (g) 309.4 20.2
149
L*
a*
b*
Hue
28.41 51.80
-19.20 -7.24 2.27 78.79 34.25 90.00
Outputs Chroma 13.23 80.33
Color index -28.97 59.29
Color difference with true red 29.75 86.11
Kassem et al.; JALSI, 3(4): 143-156, 2015; Article no.JALSI.2015.036
Table 3. Network statistics from Qnet software after training and testing stages to estimate surface color features of tomato Processing stage L* Training Testing a* Training Testing b* Training Testing Hue Training Testing
Standard deviation
Bias
Maximum error
Correlation coefficient
3.09592 3.03154
-0.19103 -0.67316
10.50714 5.08882
0.82402 0.84624
6.54529 6.69825
0.4853 0.65249
58.10199 12.91714
0.92453 0.90956
2.8305 1.63161
-0.1451 -0.10581
25.56071 2.75278
0.85419 0.92763
8.78819 11.4786 Chroma 4.52468 1.69993
-0.83494 1.35406
38.49367 19.65178
0.85734 0.7381
0.02028 -0.22733
54.08829 3.37742
0.61557 0.89757
1.00778 1.34861
35.02653 24.49221
0.94358 0.89185
-0.50177 -0.56725
19.46864 11.01188
0.95344 0.92415
Training Testing Color Index Training 9.67935 Testing 12.05633 Color difference with true red (DE) Training 4.82068 Testing 5.80568
Fig. 5. Screenshot for inputs and outputs variables in Excel environment
3. RESULTS AND DISCUSSION 3.1 Statistical Analysis of Dimensions and Weight of Tomato Samples Describing fruit size distributions is important in horticultural research [33]. They reported that
fruit size data are often non-normal and skewness can be positive or negative depending on factors such as the measured variable, the stage of fruit growth and the treatment applied. Table 4 illustrates statistical distribution parameters (mean, standard deviation, kurtosis and skewness) for length and width at different studied tomatoes maturity stages. Meanwhile,
150
Kassem et al.; JALSI, 3(4): 143-156, 2015; Article no.JALSI.2015.036
Table 5 illustrates the statistical distribution parameters for weight at different studied tomatoes maturity stages. From Table 4 and Table 5 positive skewness implies that the measured variables of length, width and weight at different studied tomatoes maturity stages distribution is shifted toward values less than the mean. From Table 4, there are also differences in fruit dimensions between the maturity stages. Mean of length of green, pink and red stages are
47.087, 43.31 and 40.64 mm, respectively. Meanwhile, mean of width of green, pink and red stages are 67.38, 65.01 and 62.08 mm, respectively. The shape of tomatoes was slightly wider than long. Moreover, from Table 5, there are differences in fruit weight between the maturity stages. The mean of weight of green, pink and red stages are 113.35, 118.82 and 105.28 g, respectively. The quite large positive skewness for attributes values reflects asymmetry in the distribution caused largely by a number of relatively high values.
Fig. 6. Screenshot for calculations in excel environment Table 4. Statistical distribution parameters (mean, standard deviation, kurtosis and skewness) for length and width at different studied tomatoes maturity stages Statistical parameters Mean Standard deviation Kurtosis Skewness Count
Green 47.09 3.31 1.24 0.14 91
Length (mm) Pink Red 43.31 40.64 5.01 4.62 0.49 0.74 0.49 0.17 76 70
151
Green 67.38 6.58 0.99 0.53 91
Width (mm) Pink 65.01 9.90 0.46 0.82 76
Red 62.08 9.62 0.59 0.69 70
Kassem et al.; JALSI, 3(4): 143-156, 2015; Article no.JALSI.2015.036
Table 5. Mean, standard deviation, kurtosis and skewness for weight at different studied tomatoes maturity stages Statistical parameters Mean (g) Standard deviation (g) Kurtosis Skewness Count
Maturity stages Green Pink Red 113.35 118.82 105.28 27.02 49.64 47.38 3.35 2.84 5.65 1.45 1.58 1.89 91 76 70
3.2 Statistical Analysis of Surface Color Features of Tomato Samples Table 6 illustrates statistical distribution parameters (mean, standard deviation, kurtosis and skewness) for color parameters (L*, a* and b*) at different studied tomatoes maturity stages. From Table 6, the means of L*,a* and b* for green maturity are 44.96,-16.70 and 28.59, respectively., The means of L*,a* and b* for pink maturity are also 39.54,7.27 and 23.17, respectively. Moreover, the values of the means of L*,a* and b* for red maturity are 35.65, 19.62 and 18.06, respectively. In similar work, Vazquez-Cruza et al. [34] found that values of L*,a* and b* for green maturity of tomato as 61.78, -5.26 and 18.67, respectively. For pink maturity of tomato, they found that values of L*,a* and b* as 43.87,16.69 and 51.19,
respectively. Meanwhile, for red maturity of tomato, they found that values of L*,a* and b* as 34.97, 26.33 and 34.11, respectively. The details of other surface color features of tomato were presented in another work [35]. Table 7 illustrates correlation coefficients among surface color features and length, width and weight of tomatoes classes. From Table 8, the highest correlation is between width and normalized mean L* for red class (r=0.66). There are postive and negative correlation among length, width and wieght and surface color features of tomatoes classes.
3.3 Analysis of ANN Model Preliminary trails indicated that one hidden layer performed better results than other two hidden layers in ANN model to learn and predict the correlation between input and studied output parameters. However, there are no specific rules to select number of hidden layers during structure of an ANN model and many researches have been made in evaluating the number of neurons in the hidden layer but still none was accurate [36]. As in Vazquez-Cruz et al. [34] found that among the various ANN structures, model of good performance was produced by a four layers ANN structure for lycopene prediction with hyperbolic tangent transfer function.
Table 6. Mean, standard deviation, kurtosis and skewness for surface color features (L*, a* and b*) at different maturity stages Statistical parameters Mean Standard deviation Kurtosis Skewness Count
L* 44.96 2.97 -0.07 0.04 91
Green a* -16.70 1.01 -0.54 -0.17 91
b* 28.59 2.36 -0.64 0.20 91
L* 39.54 4.77 -0.62 0.26 76
Pink a* 7.27 11.24 -1.29 -0.19 76
b* 23.17 4.38 30.91 -4.45 76
L* 35.65 3.86 3.17 1.32 70
Red a* 19.62 7.64 53.95 6.90 70
b* 18.06 2.71 -0.54 0.22 70
Table 7. Correlation coefficients among surface color features and length, width and weight of tomatoes classes Color features Mean L* Mean a* Mean b* Hue Chroma Color index DE
Length 0.35 -0.35 0.17 -0.13 0.21 0.18 0.27
Green Width 0.45 -0.31 0.26 0.06 0.28 0.33 0.28
Weight 0.42 -0.39 0.31 0.04 0.34 0.30 0.36
Length 0.30 0.16 0.33 -0.16 0.53 0.05 -0.14
152
Pink Width 0.47 0.10 0.33 -0.06 0.45 0.02 -0.08
Weight 0.43 0.16 0.31 -0.13 0.50 0.06 -0.14
Length 0.37 0.13 0.36 -0.13 0.18 -0.18 -0.33
Red Width 0.66 0.15 0.57 0.06 0.25 -0.49 -0.42
Weight 0.63 0.13 0.50 0.05 0.22 -0.45 -0.36
Kassem et al.; JALSI, 3(4): 143-156, 2015; Article no.JALSI.2015.036
Fig. 7. Relationships and coefficients of determination between the actual and the estimated surface color features measurements during testing stage using ANN model 153
Kassem et al.; JALSI, 3(4): 143-156, 2015; Article no.JALSI.2015.036
Fig. 7 above shows the relationships and coefficients of determination (R2) between the actual and the estimated surface color features measurements during testing stage using ANN model. The figure clearly shows that the points, during the testing process, are uniformly scattered around the regression lines with moderate correlations represented by values of 2 coefficients of determination (R ) that was of 0.7161, 0.8273, 0.8605, 0.5448, 0.8056, 0.7954 and 0.854, respectively for L*, a* b* Hue, Chroma, color index and color difference with true red. Thus the ANN model proved to be an extremely powerful tool to estimate surface color features of tomato. Additionally, model performance is evaluated by looking at the error criteria between ANN output and actual values. Table 8 illustrates error criteria for evaluation ANN model. The amount of RMSE is equal to 3.0315,6.6982, 1.6316,11.4786, 1.6999,12.0563 and 5.8057, respectively for L*, a* b* Hue,
Chroma, color index and color difference with true red as listed in Table 8 for testing stage.
3.4 Contribution of Each Input to the Computed Output Value An important feature of the Qnet program is that it allows quantification of the relative contribution of each input neuron to the computed output value. Hence, it is possible to investigate the most relevant factors affecting L*, a* b* Hue, Chroma, color index and color difference with true red concentration. Individual contributions of each input are shown in Fig. 8. It indicates that the tomato weight (Input Node 6) contributes most to the all surface color features of tomato. Thus the tomato weight contributes significantly in estimating all surface color features of tomato compared to other variables.
Table 8. Error criteria for evaluation ANN model to estimate surface color features of tomato for testing data set (10 patterns) Error criteria 2 R RMSE MAE MRE
L* 0.7161 3.0315 2.3298 1.3966
a* 0.8273 6.6982 4.7938 44.7763
b* 0.8605 1.6316 1.3675 0.5554
Hue 0.5448 11.4786 8.2005 -5.8542
Chroma 0.8056 1.6999 1.2961 0.4501
Color Index 0.7954 12.0563 9.1789 39.2747
DE 0.8540 5.8057 4.1408 -0.3790
Fig. 8. Relative contribution of each input variables on surface color features of tomato
154
Kassem et al.; JALSI, 3(4): 143-156, 2015; Article no.JALSI.2015.036
4. CONCLUSION 7. In this study, tomato dimensions (length and width) and tomato weight were utilized as input variables in artificial neural networks model to estimate color surface features (L*, a* b* Hue, Chroma, color index and color difference with true red) for three maturity stages (green, red and pink) of tomato. The results of the developed artificial neural networks model were evaluated by coefficient of determination (R2) which was in the range of 0.545 to 0.854. The obtained weights from the developed artificial neural networks training process were formulated in Excel spreadsheet to be used as a quick tool to estimate such color surface features.
8.
9.
10.
COMPETING INTERESTS We hereby declare that there is no competing interest among the authors or with any organization.
11.
REFERENCES 1.
2.
3.
4.
5.
6.
Olaniyi J, Akanbi W, Adejumo T, Akande O. Growth, fruit yield and nutritional quality of tomato varieties. Afr. J. Food Sci. 2010;4(6):398-402. Jaramillo J, Rodriguez V, Guzman M, Zapata M, Rengifo T. Technical manual: Good agricultural practices in the production of tomato under protected conditions. FAO; 2007. Colla G, Mitchell JP, Poudel DD, Temple SR. Changes of tomato yield and fruit elemental composition in conventional, low input and organic systems. J. Sustainable Agric. 2002;20:53-67. Jha SN. Nondestructive evaluation of food quality, chapter 2 "Color Measurements and Modeling". DOI 10.1007/978-3-64215796-7_2, C_ Springer-Berlin Heidelberg. 2010;17-40. Gastélum-Barrios A, Bórquez-López RA, Rico-García E, Toledano-Ayala M, SotoZarazúa GM. Tomato quality evaluation with image processing: A review. African Journal of Agricultural Research. 2011; 6(14):3333-3339. Islam MZ, Mahmuda AM, HJ Lee, KS Lee, Hong SM, Jeong MJ, Kim IS, Hong SK, Choi IL, Baek JP, Kang HM. Selection of non-perforated breathable film to enhance storability of cherry tomato for modified atmosphere storage at different Temperatures. Protected Horticulture and Plant Factory. 2014;23(2):116-122.
12.
13.
14.
15.
16.
17.
18.
155
DOI: http://dx.doi.org/10.12791/KSBEC Islam MZ, Mele MA, Jeong MJ, Kim IS, Hong SK, Choi IL, Baek JP, Kang HM. Influence of silicon spray on storability of truss tomato in MA storage. Journal of Agricultural, Life and Environmental Sciences. 2014;26(3):6-11. Ukirade NS. Color grading system for evaluating tomato maturity. International Journal of Research in Management, Science & Technology. 2014;2(1):41-45. Polder G, van der Heijden GWAM, Young IT. Spectral image analysis for measuring ripeness of tomatoes. Trans. ASAE. 2002; 45(4):1155-1161. Gómez A, Hu G, Wang J, Pereira A. Evaluation of tomato maturity by electronic nose. Computers and Electronics in Agriculture. 2006;54(1):44-52. Frary A, Nesbitt TC, Grandillo S, Knaap VD, Cong B, Liu JP. A quantitative trait locus key to evolution of tomato fruit size. Science. 2000;289(5476):85-88. DOI: 10.1126/science.289.5476.85. Yamaguchi M. Solanaceous fruits: Tomato, eggplant, peppers and others, 291–312. In: Yamaguchi, M. (ed.). World vegetables, AVI Book, New York;1983. Clement A, Dorais M, Vernon M. Nondestructive measurement of fresh tomato lycopene content and other physicochemical characteristics using visible-NIR spectroscopy. J. Agric. Food Chem. 2008;56(21):9813–9818. Taheri-Garavand A, Rafiee S, Keyhani A. Study on some morphological and physical characteristics of tomato used in mass models to characterize best post harvesting options. Australian Journal of Crop Science. 2011;5(4):433-438. Ghazavi MA, Karami R, Mahmoodi M. Modeling some physico-mechanical properties of tomato. Journal of Agricultural Science. 2013;5(1):210-223. Izadi H, Kamgar S, Raoufat MH. Mass modeling of tomato based on physical characteristics. International Journal of Agronomy and Plant Production. 2013; 4(10):2631-2636. Movaghameijad K, Nikzad M. Modeling of tomato drying using artificial neural network. Computers and Electronics in Agriculture. 2007;59(1-2):78–85. Rasekhi R, Raoufat MH. Sorting orange fruit by machine vision and neural networks techniques. Efficient and safe production processes in sustainable
Kassem et al.; JALSI, 3(4): 143-156, 2015; Article no.JALSI.2015.036
agriculture and forestry. XXXIV CIOSTA 28. Samborska IA, Alexandrov V, Sieczko L, CIGR V Conference; 2011. Kornatowska B, Goltsev V, Cetner M D, 19. De Grano AV, Pabico J. Automating the Kalaji HM. Artificial neural networks and classification of tomato (lycopersicon their application in biological and esculentum) maturity using image analysis agricultural research. SOAJ Nano Photo and neural networks. Trans. Nat. Acad. Bio Sciences. 2014;2:14-30. Scien. Tech. Phili. 2007;29(1):131-132. 29. Vesta Services, Inc. Qnet2000 Shareware, 20. De Grano AV, Pabico J. Neural networkVesta Services, Inc., 1001 Green Bay Rd, based computer color vision for grading STE 196, Winnetka, IL 60093; 2000. tomatoes (Lycopersicon esculentum). The 30. Garson GD. Interpreting neural-network Philippine Journal of Crop Science. connection weights. Artificial Intelligent 2007;31(1):130. Expert. 1991;6(4):46–51. 21. Asadi V, Raoufat MH. Egg weight 31. Nath A, Chattopadhyay PK. Optimization estimation by machine vision and neural of oven toasting for improving crispness network techniques (A case study Fresh and other quality attributes of ready to eat Egg). Internatıonal Journal of Natural and potato-soy snack using response surface Engineering Sciences. 2010;4(2):1-4. methodology. Journal of Food 22. Scala KD, Meschino G, Vega-Gálvez A, Engineering. 2007;80(4):1282-1292. Lemus-mondaca R, Roura S, Mascheroni 32. Sin HN, Yusof S, Abdulhamid NS, R. An artificial neural network model for Abdulrahman R. Optimization of enzymatic prediction of quality characteristics of clarification of sapodilla juice using apples during convective dehydration. response surface methodology. Journal of Food Sci. Technol. (Campinas). 2013; Food Engineering. 2006;73(4):313-319. 33(3):411-416. 33. Nihal De Silva H, Lai CD, Ball RD. Fitting 23. Hahn F, Priddy K, Keller P, Fogel D, SB distributions to fruit sizes with Bezdek J. Neural networks predict tomato implications for prediction methods. maturity stage. Proc. SPIE 3722, Journal of Agricultural, Biological, and Applications and Science of Computational Environmental Statistics. 1997;2(3): Intelligence. 1999;2:394-399. 333-346. DOI:10.1117/12.342913. 34. Vazquez-Cruza MA, Jimenez-Garciaa SN, Available:http://dx.doi.org/10.1117/12.3429 Luna-Rubioc R, Contreras-Medinaa LM, 13 (March 22, 1999). Vazquez-Barriosb E, Mercado-Silvab E, 24. Adobe Systems. Adobe Photoshop 7.0. Torres-Pachecoa I, Guevara-Gonzaleza User Guide. San Jose, CA: Adobe RG. Application of neural networks to Systems; 2002. estimate carotenoid content during 25. Yam KL, Papadakis SE. A simple digital ripening in tomato fruits (Solanum imaging method for measuring and lycopersicum). Scientia Horticulturae. analyzing color of food surfaces. Journal of 2013;162:165–171. Food Engineering. 2004;61(1):137–142. 26. López Camelo AFL, Gómez PA. 35. Kassem AS, Sabbah MA, Aboukarima AM, Kamel RM. A study on color sorting of Comparison of color indexes for tomato tomatoes maturity using machine vision ripening. Horticulture Brasileira. 2004; and artificial neural networks. Egyptian 22(3):534-537. Journal of Agricultural Research. 2015; 27. López Camelo AF, PA. Gómez, Cacace 93(1):147-161. JE. Modelo para describir los cambios de color en tomate (cv. Tommy) durante la 36. Karsoliya S. Approximating number of hidden layer neurons in multiple hidden poscosecha. In: Congreso Argentino De layer BPNN architecture. International Horticultura, 18, 1995. Termas de Río Journal of Engineering Trends and Hondo, Argentina. Resúmenes, ASAHO. Technology. 2012;3(6):714-717. 1995;212. _________________________________________________________________________________ © 2015 Kassem et al.; This is an Open Access article distributed under the terms of the Creative Commons Attribution License (http://creativecommons.org/licenses/by/4.0), which permits unrestricted use, distribution, and reproduction in any medium, provided the original work is properly cited.
Peer-review history: The peer review history for this paper can be accessed here: http://sciencedomain.org/review-history/10585 156