sensors Article
Application of MEMS Accelerometers and Gyroscopes in Fast Steering Mirror Control Systems Jing Tian 1,2,3,4, *, Wenshu Yang 1,3 , Zhenming Peng 2 , Tao Tang 1,3 and Zhijun Li 1,3 1 2 3 4
*
Institute of Optics and Electronics, Chinese Academy of Science, Chengdu 610209, China;
[email protected] (W.Y.);
[email protected] (T.T.);
[email protected] (Z.L.) School of Opto-Electronic Information, University of Electronic Science and Technology of China, Chengdu 610054, China;
[email protected] Key Laboratory of Optical Engineering, Chinese Academy of Sciences, Chengdu 610209, China University of Chinese Academy of Sciences, Beijing 100039, China Correspondence:
[email protected]; Tel.: +86-189-8002-6386
Academic Editors: Slawomir Wiak and Manuel Pineda Sanchez Received: 30 December 2015; Accepted: 22 March 2016; Published: 25 March 2016
Abstract: In a charge-coupled device (CCD)-based fast steering mirror (FSM) tracking control system, high control bandwidth is the most effective way to enhance the closed-loop performance. However, the control system usually suffers a great deal from mechanical resonances and time delays induced by the low sampling rate of CCDs. To meet the requirements of high precision and load restriction, fiber-optic gyroscopes (FOGs) are usually used in traditional FSM tracking control systems. In recent years, the MEMS accelerometer and gyroscope are becoming smaller and lighter and their performance have improved gradually, so that they can be used in a fast steering mirror (FSM) to realize the stabilization of the line-of-sight (LOS) of the control system. Therefore, a tentative approach to implement a CCD-based FSM tracking control system, which uses MEMS accelerometers and gyroscopes as feedback components and contains an acceleration loop, a velocity loop and a position loop, is proposed. The disturbance suppression of the proposed method is the product of the error attenuation of the acceleration loop, the velocity loop and the position loop. Extensive experimental results show that the MEMS accelerometers and gyroscopes can act the similar role as the FOG with lower cost for stabilizing the LOS of the FSM tracking control system. Keywords: MEMS accelerometer; MEMS gyroscope; acceleration feedback control; multi-loop control; light of sight stabilization
1. Introduction The fast steering mirror (FSM) control system is extensively applied in optoelectronic tracking equipment, which is increasingly mounted on airplanes, vessels, vehicles and other moving platforms. The traditional FSM control system usually uses fiber-optic gyroscopes (FOGs) and charge-coupled devices (CCDs) to implement strap-down stabilization. The disturbance suppression of the FSM control system is limited for its only two closed-loops [1–3]. In recent years, the noise of MEMS gyroscopes has been reduced with the development of research and production in MEMS industry. The noise density of the SCR1100-D02 gyroscopes used in this paper ? reaches 0.0085 (˝ /s){ Hz [4]. MEMS gyroscopes can be mounted on the frame of FSMs and used for the stabilization of the FSM control system as they have relatively smaller size, lower weight and lower power consumption. However, the bandwidth of MEMS gyroscopes with low noise is general less than 100 Hz, which limits the bandwidth of the velocity closed-loop and the disturbance suppression ability of the FSM control system. In order to further improve the disturbance suppression ability of the FSM control system, an acceleration loop can be implemented, so that the control system contains an Sensors 2016, 16, 440; doi:10.3390/s16040440
www.mdpi.com/journal/sensors
Sensors 2016, 16, 440
2 of 13
acceleration closed-loop, a velocity closed-loop and a position closed-loop. Considering the installation position of the sensors is limited to the narrow spces of the reverse side of the mirror, linear MEMS accelerometers with small size, low weight and low power consumption are used in the acceleration closed-loop. A detailed description of the method about using two linear accelerometers for measuring the angular acceleration of the FSM is mentioned in [5]. The linear MEMS accelerometers used in this ? paper are Model 1221 units with a bandwidth above 400 Hz and noise density of 14 ug{ Hz [6]. The acceleration feedback control (AFC) is a kind of high-precision robust control. It was proposed by Studenny and Belanger in 1984 [7] and its application in mechanical arm control was reported in a paper in 1991 [8]. In 1994, Bram de Jager studied the application of AFC in tracking control [9]. Application research on acceleration feedback performed in torque control and direct-driven mechanical arm shows that AFC is a highly effective technique [10,11]. In the previous research, the actuator was a rotary motor. In theory, the acceleration open-loop transfer function of this system driven by the rotary motor characterizes a low-pass filter. However, the actuators used in the FSM control system are voice coil motors, and the acceleration open loop transfer function includes a quadratic differential. In recent years, some scholars have used accelerometers and the focal plane array (FPA) to implement closed-loop control of the FSM [5,12]. Accelerometers have poor low-frequency response ability, while there exists a large drift in the double integral data of accelerometers, which should be corrected with the FPA, thus it is difficult to use only accelerometers in a FSM control system. The position information obtained from double integration of the accelerometers fused with FPA data was used to achieve position loop control [5]. Strictly speaking, it is a single loop position control method. Tang combined a CCD and accelerometers to implement dual closed-loop control with acceleration and position [12]. In order to avoid the saturation of double integration, the acceleration controller was designed as a bandpass filter. Therefore, there is still a quadratic differential effect within the low-frequency range, and the disturbance suppression of the FSM control system for low-frequency vibration is insufficient. In this paper, under the conditiona of a low velocity closed-loop bandwidth, a three-closed-loop control model (MEMS accelerometer feedback, MEMS gyroscope feedback and CCD feedback) is proposed to replace the two-closed-loop control model (FOG feedback and CCD feedback) in the FSM control system. A lag controller is used to accomplish the acceleration closed-loop control. The velocity controller can be designed as a PI type controller, because the velocity open loop response with AFC exhibits mainly an integrator. This paper is organized as follows: Section 2 presents a detailed introduction to the control model of the FSM, mainly describing the CCD-based control structure and the implementation of AFC. Section 3 discusses and analyzes the performance of MEMS accelerometers and gyroscopes. Section 4 sets up the experiments used to verify this method. Concluding remarks are presented in Section 5. 2. Control System Model The configuration of the FSM control system is illustrated in Figure 1. The sensors include MEMS accelerometers, fiber-optic or MEMS gyroscopes and a CCD. The controller is used to implement the control algorithm. The driver actuates the voice coil motors to achieve the stabilization control of FSM. The light source is used to simulate the target for the CCD.
G p (s)
U (s)
s2 2 T s 1 s 1 e 2 n n
(1)
n is approximately between several Hz to tens of
The open loop natural frequency of FSMs, Sensors 2016, 16, 440
Hz, and the damping factor is much smaller than 1 [13].
3 of 13
Sensors 2016, 16, 440
3 of 13
G p (s)
( s ) K 1 2 s 2 U (s) T s 1 s 1 e 2 n n
The open loop natural frequency of FSMs,
(1)
n is approximately between several Hz to tens of
Hz, and the damping factor is much smaller than 1 [13].
U
Figure 1. 1. Configuration Configuration of of the the FSM FSM control control system. system. Figure
in Figure 2. The system theresonance FOG is shown The traditional mechanicalFSM part control of the FSM is a with typical element, while its electrical part including the drivers and the voice coil motors of the FSM is a typical first-order inertial element, which is 1 depicted as . Therefore, the FSM position open loop response can be expressed as follows [12]: d ( s ) Te s ` 1
Cvθpsq ( s)
G p psq “
U
Upsq
“
(s )
Gv (K s) 2ξ s2 ` s`1 $n 2 $n
1 ¨ Te s ` 1
(1)
Figure 1. Configuration of the FSM control system.
The open loop natural frequency of FSMs, $n is approximately between several Hz to tens of Hz, and the damping factor ξ is much smaller than 1 [13]. The traditional FSM control system with the FOG is shown in Figure 2. The traditional FSM control system with the FOG is shown in Figure 2. Figure 2. FOG control system.
The FSM acceleration open loop response Gv(s) is a differential d ( s ) of Gp(s), which is depicted in (s ) Equation (1):
Cv ( s )
Gv ( s )
( s ) K s Gv ( s ) 2 s 2 U (s) T s 1 s 1 e 2 n n
(2)
The velocity controller can be presented as follows: Figure 2. FOG control system. Figure 2. FOGcontrol system. 1
Cv s Gv
s Tlow s
(3)
The FSM acceleration open loop response G Gvv(s) is a differential differential of of G Gpp(s), which is depicted in Tlow(s) is a low-pass filter to reduce vibrations and noise. The disturbance attenuation can be Equation (1): . depicted as follows: θpsq s ( s )“ 2 KK Gv psq “ ¨ (2) s Upsq T s s 2ξ s Gv ( s) 2 ` 1 s`1 e `1 (4) (2) s2 $2n U( s ) T s 1 s sG 1 es s 1 G$n s C d
v
2 v
n The velocity controller can be presented as follows: n
FOG
The velocity controller can be presented as follows: Cv psq “ Gv´1 psq Tlow psq
1 v
(3)
Cv s G s Tlow s (3) Tlow (s) is a low-pass filter to reduce vibrations and noise. The disturbance attenuation can be depicted as is follows: a low-pass filter to reduce vibrations and noise. The disturbance attenuation can be Tlow(s) . θ psq 1 depicted as follows: “ (4) . 1 ` Gv psq Cv psq GFOG psq θd psq s 1 d s 1 Gv s Cv s GFOG s
(4)
Sensors 2016, 16, 440 Sensors 2016, 16, 440
4 of 13 4 of 13
(s)represents represents the the characteristics characteristics of of the the FOG FOG [14]. The FSM control The second-order filter GFOG FOG(s) system with the MEMS accelerometers and gyroscopes is shown in Figure gyroscopes is shown in Figure 3. 3. d Cv (s )
Ca (s )
Ga (s )
Figure Figure 3. 3. MEMS MEMS control control system. system.
The FSM acceleration open loop response Ga(s) is a quadratic differential of Gp(s), which is The FSM acceleration open loop response Ga (s) is a quadratic differential of Gp (s), which is depicted in Equation (1): depicted in Equation (1): .. θpsq KK s22 ( s ) G psq “ (5) ¨ Gaa ( s ) Upsq “ s2 2 2ξ (5) U ( s ) s ` 2s ` 1 TTeess` 11 $2n2 $n s 1
n
n
The ideal acceleration controller can be designed as the inverse transfer function Ga (s). In order order The ideal can be designed as the The inverse transfer function Ga(s). Incan to increase the acceleration system gain,controller an integrator should be added. ideal acceleration controller be to increase the system gain, an integrator should be added. The ideal acceleration controller can be presented as follows: 2 presented as follows: 2ξ s ` s`1 1 $n 22 Te s ` 1 $n Ca psq “ Ka ¨ ¨ s (6) ¨ 2 s K s 1 s2 2 (6) n 1 Te s acceleration 1 ncancellation, Since the controller has complete pole-zero closed-loop transfer the Ca ( s ) K a 2 s K s are some disadvantages for the function may have high bandwidth theoretically. However, there controller, such as the saturated double integration, the worse disturbance suppression and stability of Since the controller has complete pole-zero cancellation, the acceleration closed-loop transfer the system induced thebandwidth inaccurate control function which is there derived inaccurate fitting of a (s) function may have by high theoretically. However, arefrom some disadvantages forGthe due to the noise and measuring error of accelerometers. To avoid these deficiencies, the acceleration controller, such as the saturated double integration, the worse disturbance suppression and stability controller C’a is designed (7):control function which is derived from inaccurate fitting of of the system induced by in theEquation inaccurate
Ga(s) due to the noise and measuring error K of accelerometers. To avoid these deficiencies, the a Te s ` 1 ¨ (7) Ca1 “ acceleration controller C’a is designed in Equation (7): s T s`1 1
K ' a T es 1 where Te s+1 is used to compensate phaseClag. The is used to compensate the quadratic integrator (7) a s constant T1s 1 is used to filter the high-frequency noise. differential partly. The lag element with small time The designed value of T1 should be smaller than 0.01, otherwise the bandwidth of the control system where Tes+1 is used to compensate phase lag. The integrator is used to compensate the quadratic will be too low. The closed-loop acceleration transfer function is expressed as follows: differential partly. The lag element with small time constant is used to filter the high-frequency noise. The designed value of T1 should Ka Ks be smaller than 0.01, otherwise the bandwidth of the control ˆ 2 ˙ transfer function is expressed as follows: system will be too low. The closed-loop acceleration s 2ξ pT1 s ` 1q s ` 1 ` 2 Ka Ks $n $nK a Ks Ga_closed “ “ ˆ 2 ˙ K Ks 2 s 2ξ sa ˙ 2 1` ˆ pT s ` 1q ` s ` 1 ` Ka Ks 1 (8) T1s 1 s2 2 2ξs 1 2 $n $Ks n K pT1 s ` 1q n2 ` n s `1 a Ga _ closed $ $n K a Ks n s2 2 KTa Ks 1“ 1 2 s 1˙ K a Ks ˆ ˙ 2 1s ˆ 2 s 2ξ (8) n 1 1 s2 ` K aKn ` T TT1s12 s13 ` 2 1 2 `s 2ξT s`1 1` $ $ $n $ n n n n n K a Ks 2T1 2 2 T1 3 1 s 2 s K a K T1 s 1 n2 n n n
Sensors 2016, 16, 440
5 of 13
SensorsThis 2016,equation 16, 440
is similar to a band pass filter. Ga_closed is approaching zero at high frequency. 5 ofOn 13 the basis of analyzing of Equations (1) and (8), the denominator of the Equation (8) can be simplified to KaKs + 1 at low frequency. And then Ga_closed can be simplified as follows: This equation is similar to a band pass filter. Ga_closed is approaching zero at high frequency. On K abe Ks simplified a Ks (8), the denominator of theK a Ks the basis of of Equations (1)Kand Equation (8) can Ga' analyzing _ closed K a Ks 1 T1 3 1 And 2T1 2 G 2 2 (9) to KaKs + 1 at low frequency. then T1 s T1 be simplified K follows: s a_closed K a K can s 1 K aas s 1 n2
n
2
n
n
n
K Ks Ka Ks Ka Ks 1 ˆ ˙a ˆ ˙ ˙ Ga_closed “ (9) « ˆKa, thus the value « KaKs is large It is clear the acceleration controller has a high gain of 1 2ξT T1that 2ξ 2ξ K Ks ` 1 a 1 s3 ` ` s2 ` Ka K ` T1 ` s`1 Ka K ` T1 ` s`1 2 2 $n the closed loop at low $n frequency which is $smaller $n certain$ngain of enough to keep than that of the n
ideal closed loop. The analysis will be verified by the subsequent experiments. The acceleration It is clear that the acceleration controller has a high gain Ka, thus the value of KaKs is large disturbance attenuation is as follows: enough to keep certain gain of the closed loop at low frequency which is smaller than that of the ideal closed loop. The analysis will be verified by s the subsequent 1 experiments. The acceleration disturbance (10) attenuation is as follows: ..d s 1 Ga s Ca s θ psq 1 “ (10) .. psq 1 ` G Ca psq a θd psq The velocity open loop response of the FSM with AFC at low frequency is depicted in Equation The (11): velocity open loop response of the FSM with AFC at low frequency is depicted in Equation (11): K K K K 1
Gv _ a _ closed Ga _ closed s1 Gv_a_closed “
s
Ga_closed “
a
a
KKa aKs s Ka K2 K 1 « ˙ 2 2 2ξ s 1 K a Ks K Ks `1 s a pT1 s ` 1q n ` n s ` 1 ` Ka Ks
T1s 1ˆ
2
(11) (11)
$n $n 2 Therefore, the traditional PI controller can meet the velocity closed-loop control. The Therefore, the traditional PI two controller meet the closed-loop disturbance disturbance attenuation of the loop can (velocity andvelocity acceleration loop)control. control The system can be attenuation of the two loop (velocity and acceleration loop) control system can be depicted as follows: depicted as follows: . θ psq s 11 ¨ . “s 1 `1 GG Ca apsq s a psq a sC θ psqd d
11 G Ca C sapsq 1 1 G s psq 1 `CCv v spsq s 1 a` aG psq s 1 Ga sa Ca Csa psq
(12) (12)
From Equation (12), we can see that the supersession supersession bandwidth is subject to the acceleration closed-loop bandwidth. Comparing Equations (4) and (12), the disturbance attenuation with MEMS accelerometers and gyroscopes is better than that with FOG as long as the MEMS accelerometer bandwidth is higher than that of FOG. The multi-loop multi-loop control control structure structure of ofthe theFSM FSMwith withthe theMEMS MEMSaccelerometers accelerometers and gyroscope and gyroscope is is shown in Figure 4. theFor the FSM system, control the system, the isobjective is to improve suppression disturbance shown in Figure 4. For FSM control objective to improve disturbance suppression performance.performance.
d (s) s2 ( s ) d
C p (s)
Cv ( s)
Ca ( s )
Ga ( s )
( s)
Figure of multiple multiple closed closed loops. loops. Figure 4. 4. Stabilization Stabilization control control structure structure of
(s)
Sensors 2016, 16, 440
6 of 13
Where Ga (s) is the acceleration open loop transfer function, Ca (s) is the acceleration controller, . Cv (s) is the velocity controller, Cp (s) is the position controller, θpsq is the angular velocity output, θd psq ..
is the disturbance angle and θd psq is the disturbance acceleration. The disturbance suppression of the FSM with three closed loops can be expressed as follows: 1 Ga Ca Cv Ga Ca s 1 ` Ga Ca «1 « 1, 1 Ga Ca 1 ` Ga Ca 1` Cv s 1 ` Ga Ca Eθ
(13)
1 1 1 1 ` Ga Ca ` Ga Ca Cv ` 2 Ga Ca Cv C p s s 1 1 1 “ ¨ ¨ 1 Ga Ca 1 Ga Ca 1 ` Ga Ca 1` Cv C 1 s 1 ` Ga Ca v s 1 ` Ga Ca 1` Cp 1 Ga Ca s 1` Cv s 1 ` Ga Ca 1 1 1 ¨ « ¨ 1 1 1 ` Ga Ca 1 ` Cv 1 ` C p s s “
θpsq “ θd psq
(14)
Therefore, the disturbance suppression of the system is equal to the product of the individual suppression of three closed loops. For the velocity open loop transfer function without AFC, the function sensitivity is equal to 1. With AFC, the function sensitivity becomes: ˆ .
a Sθ Ga “
pGa ` ∆Ga qCa Cv 1 Ga Ca Cv 1 ¨ ´ ¨ 1 ` pGa ` ∆Ga qCa s 1 ` Ga Ca s ∆Ga {Ga
˙ ˆ ˙ Ga Ca Cv 1 { ¨ 1 ` Ga Ca s
«
Ga Ca 2
p1 ` Ga Ca q
«
1 1 ` Ga Ca
(15)
.
a Providing that the gain of the acceleration controller is large enough, Sθ Ga is far less than 1. When the relevant structures and parameters of the system change greatly, the robustness of the velocity closed-loop system with AFC will not be affected. The gain of the acceleration controller actually exceeds 100, and so the system with the MEMS accelerometers and gyroscope feedback is robust.
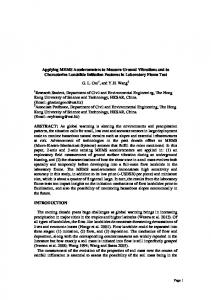
3. Analyzing of the MEMS Accelerometers and Gyroscopes The MEMS accelerometer and gyroscope have smaller size, lower weight, lower price and lower power consumption than the FOG. Figure 5 and Table 1 depict the difference of the three types of sensors. Sensors 2016, 16, 440 7 of 13
Figure of inertial inertialsensors. sensors. Figure 5. 5. Picture Picture of Table 1. Comparison of the three types of sensors.
FOG (FOG50) Size Weight
Ø55 mm × 45 mm 250 g
MEMS Gyroscope (SCR1100-D02) 25 mm × 20 mm × 8 mm 25 g
MEMS Accelerometer (Model 1221) 20 mm × 16 mm × 8 mm 20 g
Sensors 2016, 16, 440
7 of 13
Sensors 2016, 16, 440
7 of 13
Table 1. Comparison of the three types of sensors. MEMS Gyroscope MEMS Accelerometer FOG (FOG50) (SCR1100-D02) (Model 1221) Figure 5. Picture of inertial sensors. Figure 5. Picture of inertial sensors. Ø55 mm ˆ 45 mm 25 mm ˆ 20 mm ˆ 8 mm 20 mm ˆ 16 mm ˆ 8 mm 250 g 25 g 20 g Table 1. Comparison of the three types of sensors. 50,000 Yuan Yuan 1900 Yuan Table 1. Comparison of the three1200 types of sensors. 6W 0.15 W 0.1 W MEMS Gyroscope MEMS Accelerometer
Size Weight Price Power consumption
MEMS Gyroscope MEMS Accelerometer FOG (FOG50) FOG (FOG50) (SCR1100-D02) (Model 1221) (SCR1100-D02) (Model 1221) TheSize FOG-basedØ55 Inertial Measurement Unit mounted on the mirror base as the mm × 45 mm 25 mm × 20 mm × 8 mm 20 mmis× usually 16 mm ×used 8 mm Size Ø55 mm × 45 mm 25 mm × 20 mm × 8 mm 20 mm × 16 mm × 8 mm feedback component of the closed-loop in25the Weight 250velocity g g high precision FSM control 20 g system. The Weight 250 g 25 g 20 g bandwidth the FOG have significant effects on the performance of the FSM control system. Priceand noise of 50,000 Yuan 1200 Yuan 1900 Yuan Price 50,000 Yuan 1200 Yuan 1900 Yuan The bandwidth Power of the FOG for the latter experiment is about 500 Hz. The characteristics of the FOG Power 6W 0.15 W 0.1 W noise are depicted in Figure66.W 0.15 W 0.1 W consumption consumption Fiber Gyroscope Noise Fiber Gyroscope Noise
0.03 0.03
0.1 0.1
0.025 0.025
Amplitude Amplitude /s /s
0.05 0.05
Noise Noise /s/s
Spectrum of Noise Spectrum of Noise X: 100.4 Y: X: 0.03103 100.4 Y: 0.03103
0 0
-0.05 -0.05
0.02 0.02 0.015 0.015 X: 301.2 Y: X: 0.009533 301.2 Y: 0.009533 X: 501.9 Y: 0.005917 X: 501.9 Y: 0.005917
0.01 0.01 0.005 0.005
-0.1 -0.1 1 1
2 2
3 4 3Time 4(s)
5 5
6 6
7 7
0 0
500 500
Time (s)
1000
1500
1000 1500 Frequency (Hz) Frequency (Hz)
2000 2000
2500 2500
Figure FOG Figure 6. 6. FOG noise noise characteristics. characteristics. Figure 6. FOG noise characteristics.
The peak value of the FOG noise is equal to 0.25˝°/s, and the RMS value is about 0.037˝°/s. Aside The peak value value of of the the FOG FOG noise noiseisisequal equalto to0.25 0.25 °/s, the RMS RMS value value isisabout about0.037 0.037 °/s. /s, and the /s. Aside from some “spikes”, the amplitude value of amplitude-frequency curve is smooth. The bandwidth from some some “spikes”, “spikes”, the theamplitude amplitudevalue valueofofamplitude-frequency amplitude-frequencycurve curve smooth. The bandwidth is is smooth. The bandwidth of of the MEMS gyroscope for the latter experiment is less than 100 Hz, which is lower than that of the of MEMS gyroscope latter experiment is less 100 which Hz, which is lower that the thethe MEMS gyroscope for for the the latter experiment is less thanthan 100 Hz, is lower than than that of theofFOG. FOG. Figure 7 shows the characteristics of the MEMS gyroscope noise. FOG. 7 shows the characteristics the MEMS gyroscope FigureFigure 7 shows the characteristics of the of MEMS gyroscope noise. noise. Gyroscope Noise Gyroscope Noise
x 10 -3 Spectrum of Noise x 10 Spectrum of Noise -3
2 2
Amplitude Amplitude /s /s
Gyroscope Noise Gyroscope Noise /s/s
0.05 0.05
0 0
-0.05 -0.05
2 2
4
Time4(s) Time (s)
6 6
1.5 1.5 1 1 0.5 0.5
0 0
500 500
1000
1500
2000
2500
1000 1500 2000 2500 Frequency (Hz) Frequency (Hz)
Figure 7. MEMS gyroscope noise characteristics. Figure Figure 7. 7. MEMS MEMS gyroscope gyroscope noise noise characteristics. characteristics.
The peak value of the MEMS gyroscope noise is equal to 0.12 ˝ /s, and the RMS value is about 0.015 ˝ /s, which is smaller than that of the FOG. The MEMS gyroscope noise maily foucus on the frequencies ranging from 0 to 200 Hz.
Sensors 2016, 16, 440
8 of 13
The peak value of the MEMS gyroscope noise is equal to 0.12 °/s, and the RMS value is about 8 of 13 0.015 °/s, which is smaller than that of the FOG. The MEMS gyroscope noise maily foucus on the frequencies ranging from 0 to 200 Hz. The practical bandwidth of the MEMS accelerometer accelerometer is about 1000 Hz, which is higher than that of the FOG. The characteristics characteristics of of the the noise noise are are shown shown in in Figure Figure 8. 8.
Sensors 2016, 16, 440
Spectrum of Noise
Accelerometer Noise
-3
x 10 5
9 8
3
7
2
Amplitude /s2
Accelerometer Noise /s2
4
1 0 -1 -2
6 5 4 3 2
-3
1
-4 1
2
3
4
Time (s)
5
6
7
0
500
1000
1500
2000
2500
Frequency (Hz)
Figure 8. 8. MEMS noise characteristics. characteristics. Figure MEMS accelerometer accelerometer noise
The peak value of the MEMS accelerometer transformed noise is equal to 0.01 °/s2, and the RMS The peak value of the 2MEMS accelerometer transformed noise is equal to 0.01 ˝ /s2 , and the RMS value is about 0.00135 °/s . The amplitude value of amplitude-frequency curve is mainly smooth value is about 0.00135 ˝ /s2 . The amplitude value of amplitude-frequency curve is mainly smooth aside aside from some “spikes”. from some “spikes”. From the aforementioned analysis, the combination of MEMS gyroscopes and accelerometers From the aforementioned analysis, the combination of MEMS gyroscopes and accelerometers can be used to replace the FOG for accurately measuring the FSM’s high bandwidth disturbance, can be used to replace the FOG for accurately measuring the FSM’s high bandwidth disturbance, and and then the stabilized FSM with MEMS accelerometers and gyroscopes feedback can be then the stabilized FSM with MEMS accelerometers and gyroscopes feedback can be accomplished accomplished to replace the strap-down FSM for the line-of-sight (LOS) stabilization. Furthermore, to replace the strap-down FSM for the line-of-sight (LOS) stabilization. Furthermore, the price of the the price of the combination of two MEMS accelerometers and one MEMS gyroscope is 5000 Yuan, combination of two MEMS accelerometers and one MEMS gyroscope is 5000 Yuan, which is one-tenth which is one-tenth of the price of one FOG. of the price of one FOG. 4. Experimental 4. ExperimentalVerification Verification The FSM FSM control control system system is is aa two-axis two-axis system. system. This This experiment experiment focuses axis due due to to the the The focuses on on one one axis symmetry of the two axes. The experimental setup, which includes a disturbance platform, symmetry of the two axes. The experimental setup, which includes a disturbance platform, a stabilizeda stabilizedaplatform, laseranlight, and an imagesystem processing system (CCD), is shown in two Figure 9. The platform, laser light,a and image processing (CCD), is shown in Figure 9. The platforms twodriven platforms are driven by voice coildisturbance motors. The disturbance platform simulates theofdisturbance are by voice coil motors. The platform simulates the disturbance the carrier, of the carrier, on which the fiber-optic gyroscope1 (FOG1) and the eddy current sensor on which the fiber-optic gyroscope1 (FOG1) and the eddy current displacementdisplacement sensor are used for are used for disturbance measurement, FOG1 is used to measure disturbance angular velocity of the disturbance measurement, FOG1 is used to measure disturbance angular velocity of the platform, and platform, eddy is used to measureangle the of disturbance angle the platform. Theisstabilized the eddy isand usedthe to measure the disturbance the platform. Theofstabilized platform mounted platform is mounted on the disturbance platform. The MEMS linear accelerometers mounted on the on the disturbance platform. The MEMS linear accelerometers mounted on the stabilized platform stabilized to measure the of angular acceleration of the platform. The2fiber-optic are used toplatform measure are the used angular acceleration the platform. The fiber-optic gyroscope (FOG2) is gyroscope 2 (FOG2) is used to measure the angular velocity of the stabilized platform. light used to measure the angular velocity of the stabilized platform. The light source is used toThe simulate source is used to simulate the target, and the mirror reflects the laser light into the image processing the target, and the mirror reflects the laser light into the image processing system which detects the system which detectsplatform the LOSand of provides the stabilized platform and provides LOS and error. The schematic LOS of the stabilized LOS error. The schematic diagram physical diagram diagram and physical diagram are shown in Figure 9. are shown in Figure 9. The MEMS MEMS accelerometer accelerometer bandwidth bandwidth exceeds exceeds 1000 1000 Hz, Hz, and and the the angular angular acceleration acceleration can can be be The obtained from fromtwo two accelerometers. The bandwidth theexceeds FOG 500 exceeds 500the Hz, and the obtained lineline accelerometers. The bandwidth of the of FOG Hz, and bandwidth bandwidth of the MEMS gyroscope is less than 100 Hz. of the MEMS gyroscope is less than 100 Hz. From Equation Equation (5), (5), the the open open loop loop acceleration acceleration characteristic characteristic of the FSM FSM at at low low frequency frequency is is From of the similar to a second-order integrator. Figure 10 shows the open loop and the closed-loop acceleration similar to a second-order integrator. Figure 10 shows the open loop and the closed-loop acceleration response. The The acceleration acceleration closed-loop closed-loop bandwidth bandwidth exceeds exceeds 700 700 Hz Hz and and the the closed-loop closed-loop acceleration acceleration response. response includes frequency which is depicted in Equation (9).The response includes aa little littledifferential differentialeffect effectatatlow low frequency which is depicted in Equation (9).
Sensors 2016, 16, 440
9 of 13
Sensors 2016, 16, 440 9 of 13 static acceleration noise of AFC is about 0.0028 °/s2, which is about twice than the noise of MEMS Sensors 2016, 16, 440 9 of 13 accelerometers. ˝ /s2 , iswhich static acceleration of of AFC is about 0.0028 °/s2, which about is twice thantwice the noise MEMS The static accelerationnoise noise AFC is about 0.0028 about thanofthe noise of accelerometers. MEMS accelerometers.
Figure 9. Experimental apparatus: (a) global diagram; (b) local diagram.
Figure 9. Experimental apparatus: (a) global diagram; (b) local diagram. Figure 9. Experimental apparatus:Bode (a) Diagrams global diagram; (b) local diagram. Magnitude(dB)
10
0
Magnitude(dB)
10 0
Bode Diagrams
-10 -20
-10 -30
MEMS accelerometers opened MEMS accelerometers closed 0
10
-20
1
10
200
Phase(deg)
-30 0 10 100
3
10
1
2
10
3
10
10
0
200
Phase(deg)
2
10
MEMS accelerometers opened MEMS accelerometers closed
-100
100
-200 0 10
0
1
2
10
10
3
10
Frequency(Hz)
-100 -200 0 10
Figure 10. FSM acceleration response. 1
2
10
10 Frequency(Hz)
Figure Figure 10. 10. FSM FSM acceleration acceleration response. response.
3
10
Sensors 2016, 16, 440 Sensors 2016, 16, 440
10 of 13 10 of 13
Theclosed-loop closed-loopbandwidth bandwidthofofthe thesingle singleFOG FOGvelocity velocity loop about 220 Figure which The loop is is about 220 HzHz in in Figure 11,11, which is is higher than that of the MEMS gyroscope velocity loop with MEMS accelerometer feedback. higher than that of the MEMS gyroscope velocity loop with MEMS accelerometer feedback. Therefore, Therefore, the lower will bandwidth produce effectposition on the outer the lower bandwidth producewill some adversesome effectadverse on the outer loop. position The staticloop. noiseThe of static noise of the single FOG velocity loop is about 0.05 °/s, which is larger than that of the MEMS ˝ the single FOG velocity loop is about 0.05 /s, which is larger than that of the MEMS velocity loop velocity loop AFC. Thisdifferent is due tobandwidth the different bandwidth of these sensors. with AFC. Thiswith is due to the of these sensors. Bode Diagrams Magnitude(dB) Magnitude(dB)
0 -20 -40 -60 0 10 0
FOG feedback MEMS sensors feedback 10 1
1
10 2
2
1
10 2
Phase(deg) Phase(deg)
200 100 0 -100 -200 0 10 0
10 1 Frequency(Hz)
2
Figure11. 11.FSM FSMvelocity velocityresponse. response. Figure
Figure 12 shows the CCD closed-loop response of the velocity closed-loop FSM with FOG Figure 12 shows the CCD closed-loop response of the velocity closed-loop FSM with FOG feedback feedback and with MEMS sensors feedback. The sample rate of the CCD is 100 Hz, which limits the and with MEMS sensors feedback. The sample rate of the CCD is 100 Hz, which limits the bandwidth bandwidth of the CCD closed-loop. The closed-loop bandwidths of two kinds of systems all reach of the CCD closed-loop. The closed-loop bandwidths of two kinds of systems all reach about 16 Hz. about 16 Hz. The static position error of the system with FOG feedback is approximately 0.113 pixel, The static position error of the system with FOG feedback is approximately 0.113 pixel, while the static while the static position error with MEMS sensors feedback is 0.115 pixel, which is a little larger than position error with MEMS sensors feedback is 0.115 pixel, which is a little larger than that with FOG that with FOG feedback. The primary causes are electronic and sensor noises. feedback. The primary causes are electronic and sensor noises.
Magnitude(dB) Magnitude(dB)
Bode Diagrams 0 -20 -40 -60 -80 0 10 0
FOG feedback MEMS sensors feedback 10 1
1
10 2
2
1
10 2
Phase(deg) Phase(deg)
200 100 0 -100 -200 0 10 0
10 1 Frequency(Hz)
2
Figure Figure12. 12.CCD CCDclosed-loop closed-loopresponse. response.
observed from from Figure Figure 13 13 that that the the disturbance disturbance suppression suppression of of the the MEMS MEMS accelerometer accelerometer ItIt isis observed closed-loop at low frequency is weaker than at medium frequency because of the non-ideal closed-loop at low frequency is weaker than at medium frequency because of the non-ideal acceleration controller C’’aa in Equation (5). Benefiting from the high closed-loop bandwidth, the MEMS accelerometer loop keeps the disturbance suppression ability in the range of 200 Hz.
Sensors2016, 2016,16, 16,440 440 Sensors
11ofof13 13 11 Bode Diagrams
Phase(deg)
Phase(deg) Magnitude(dB) Magnitude(dB)
acceleration controller C’ a in Equation (5). Benefiting from the high closed-loop bandwidth, the 0 Sensors 2016, 16, 440 MEMS accelerometer loop keeps the disturbance suppression ability in the range of 200 Hz. 11 of 13 -10 -20 Bode Diagrams
-30 0 0
-1010
1
2
10
3
10
10
-20 50 -30 0
010
1
2
10
3
10
10
-50 50100
1
2
10
3
10
10
Frequency(Hz)
0
-50 suppression characteristics of the acceleration closed-loop. Figure 13. Disturbance 0
10
1
2
10
3
10
10
Phase(deg)
Phase(deg)
Magnitude(dB)Magnitude(dB)
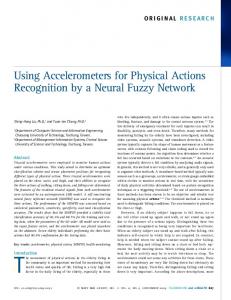
Frequency(Hz) The disturbance suppression characteristics of the FSM control system with the CCD and gyroscope feedback are shown in Figure 14. The disturbance suppression with MEMS inertial Figure Figure 13. 13. Disturbance Disturbance suppression suppressioncharacteristics characteristicsof ofthe theacceleration accelerationclosed-loop. closed-loop. sensors matches with that with FOG. It is observed from Figure 14 and Table 2 that, with MEMS accelerometers feedback control, the The disturbance disturbance suppression suppression characteristics of of the FSM FSM control system system with the the CCD CCD and and The disturbance suppression of the FSMcharacteristics multi-loop controlthe system iscontrol improved. Thewith experimental result gyroscopefeedback feedbackareare shown in Figure 14. disturbance The disturbance suppressionMEMS with inertial MEMS sensors inertial gyroscope shown in Figure 14. The accords with the aforementioned analyzing about Equationssuppression (4), (12) andwith (14). sensors matches with that with FOG. matches with that with FOG. It is observed from Figure 14 and Table 2 that, with MEMS accelerometers feedback control, the Diagrams disturbance suppression of the FSM multi-loopBode control system is improved. The experimental result 0 accords with the aforementioned analyzing about Equations (4), (12) and (14).
-50 0 -100 0 -5010
Bode Diagrams FOG feedback MEMS sensors feedback 1
200 -100 100 0 10 0 200 -100 100 -200 0 010
2
10
10
FOG feedback MEMS sensors feedback 1
10
1
10 Frequency(Hz)
2
10
2
10
-100
Figure 14. 14. Disturbance Disturbance suppression suppressioncharacteristics. characteristics.
Figure -200 0 10
1
10 Frequency(Hz) between disturbance suppressions
2
10
2. Comparison of two kinds of FSM control systems. It isTable observed from Figure 14 and Table 2 that, with MEMS accelerometers feedback control, the disturbance suppression of the FSM multi-loop control system is improved. The experimental result Frequency with FOG with MEMS Inertial Sensors Figure 14. Disturbance suppression characteristics. accords with the aforementioned analyzing about Equations (4), (12) and (14). 1 Hz −81.39 dB −74.38 dB TheTable MEMS accelerationbetween feedback loop hassuppressions more than 700 Hzkinds bandwidth (shown in Figure 10). 2. Comparison disturbance of two of FSM 10 Hz −46.39 dB −45.56 dB control systems. However, the disturbance attenuation of the AFC is limited by the non-ideal acceleration feedback 20 Hz −35.77 dB −45.42 dB FOG with MEMS controller belowFrequency 10 Hz. Therefore, thewith disturbance attenuation of theInertial MEMSSensors gyroscope feedback 40 Hz −25.57 dB −38.8 dB Hz weaker than −81.39 −74.38 below dB system with AFC is1little that ofdB the FOG feedback system 10 Hz and is better 100 Hz −21.97 dB −31.52 dB 10 Hz −46.39 dB −45.56 dB between 10 to 100 Hz. 20 Hz −35.77 dB −45.42 dB The MEMS acceleration feedback loop has more than 700 Hz bandwidth (shown in Figure 10). 40 Hz −25.57 dB −38.8 dB However, the disturbance attenuation of the AFC is limited by the non-ideal acceleration feedback 100 Hz −21.97 dB −31.52 dB
The MEMS acceleration feedback loop has more than 700 Hz bandwidth (shown in Figure 10). However, the disturbance attenuation of the AFC is limited by the non-ideal acceleration feedback
Sensors 2016, 16, 440
12 of 13
Table 2. Comparison between disturbance suppressions of two kinds of FSM control systems. Frequency
with FOG
with MEMS Inertial Sensors
1 Hz 10 Hz 20 Hz 40 Hz 100 Hz
´81.39 dB ´46.39 dB ´35.77 dB ´25.57 dB ´21.97 dB
´74.38 dB ´45.56 dB ´45.42 dB ´38.8 dB ´31.52 dB
5. Conclusions MEMS gyroscopes and accelerometers were introduced to replace the FOGs in the FSM control system. The modeling of the FSM acceleration via linear accelerometers was discussed from the viewpoint of its practical implementation. The simplification for implementing the AFC into the FSM control system was presented mainly in terms of the closed-loop stability and error attenuation. The algebraic expression shows that the AFC can effectively enhance the robustness of the closed-loop control system. Three types of inertial sensors was discussed in terms of size, weight, price, power consumption and performance. The experimental results showed that the MEMS accelerometers feedback can effectively enhance the stabilization performance of the closed-loop control system, and the combination of MEMS accelerometers and gyroscopes can act the role of the FOGs with lower cost in the FSM control system. Future work will concentrate on reducing the cost of the FSM control system under conditions of good closed-loop performance. The use of only accelerometers may be an effective method, which will be our next work. The accelerometer signal may be processed by two-dimensional digital filters [15]. Acknowledgments: We would like to gratefully acknowledge Jiang Bian for his optical technical support. Author Contributions: Jing Tian is the head of the research group that conducted this study. He proposed the original idea, analysed the theory, carried out the experiment, and writing this paper. Wenshu Yang and Zhenming Peng contributed to the research through their general guidance and advice. Tao Tang joined analyzing the theory and writing this paper. Zhijun Li joined the experiment. Conflicts of Interest: The authors declare no conflict of interest.
References 1. 2.
3. 4.
5.
6. 7. 8.
Lawrence, M.G. Microradian-Level Inertial Line-of-Sight Stabilization Systems with Wide-Angle-Search Capability. In Proceedings of the SPIE 1696, Controls for Optical Systems, Orlando, FL, USA, 21–22 April 1992. Dickson, W.C.; Yee, T.K.; Coward, J.F.; McClaren, A.; Pechner, D.A. Compact fiber optic gyroscopes for platform stabilization. In Proceedings of the SPIE 8876, Nanophotonics and Macrophotonics for Space Environments VII, 88760L, San Diego, CA, USA, 21–25 August 2013. Hilkert, J.M. A comparison of inertial line-of-sight stabilization techniques using mirrors. In Proceedings of the SPIE 5430, Acquisition, Tracking, and Pointing XVIII, Orlando, FL, USA, 12 April 2004. SCR1100-D02 Single Axis Gyroscope with Digital Spi Interface. Available online: http://www.murata. com/~/media/webrenewal/products/sensor/gyro/scr1100/scr1100-d02%20datasheet%20v2%201.ashx? la=zh-cn (accessed on 30 December 2015). Ortiz, G.G.; Portillo, A.; Lee, S.; Ceniceros, J.M. Functional demonstration of accelerometer-assisted beacon tracking. In Proceedings of the SPIE 4272, Free-Space Laser Communication Technologies XIII, San Jose, CA, USA, 20 January 2001. Model 1221 Low Noise Analog Accelerometer. Available online: http://www.silicondesigns.com (accessed on 2 December 2012). Studenny, J.; Belanger, P.R. Robot Manipulator Control by Acceleration Feedback. In Proceedings of the 23rd IEEE Conference on Decision and Control, Las Vegas, NV, USA, 12–14 December 1984. Studenny, J.; Belanger, P.; Daneshmend, L.K. A Digital Implementation of The Acceleration Feedback Control Law on a PUMA 560 Manipulator. In Proceedings of the 30th IEEE Conference on Decision and Control, Brighton, UK, 11–13 December 1991; Volume 3, pp. 2639–2648.
Sensors 2016, 16, 440
9. 10. 11. 12. 13. 14.
15.
13 of 13
De Jager, B. Acceleration assisted tracking control. IEEE J. Control Syst. 1994, 14, 20–27. [CrossRef] Han, J.; Tan, D.; Jiang, X. Joint Acceleration Feedback Control for Direct-drive Robot Decoupling. Acta Autom. Sin. 2000, 26, 289–295. Han, J.; He, Y.; Zhao, X. Mobile Robot System: Modeling, Estimation and Control; Science Press: Beijing, China, 2001. Tang, T.; Huang, Y.; Fu, C.; Liu, S. Acceleration Feedback of a CCD-Based Tracking Loop for Fast Steering Mirror. Opt. Eng. 2009, 48. [CrossRef] Cochran, R.W.; Vassar, R.H. Fast Steering Mirrors in Optical Control Systems. In Proceedings of the SPIE 1303, Advances in Optical Structure Systems, Orlando, FL, USA, 16–19 April 1990. Lam, Q.M.; Stamatakos, N.; Woodruff, C.; Ashton, S. Gyro Modeling and Estimation of Its Random Noise Sources. In Proceedings of the AIAA Guidance, Navigation, and Control Conference and Exhibit, Austin, TX, USA, 11–14 Auguest 2003. Ding, D.-W.; Du, X.; Li, X. Finite-Frequency Model Reduction of Two-Dimensional Digital Filters. IEEE Trans. Autom. Control 2015, 60, 1624–1629. [CrossRef] © 2016 by the authors; licensee MDPI, Basel, Switzerland. This article is an open access article distributed under the terms and conditions of the Creative Commons by Attribution (CC-BY) license (http://creativecommons.org/licenses/by/4.0/).