APPLICATIONS OF GAS CHROMATOGRAPHY Edited by Reza Davarnejad and Mahboubeh Jafarkhani
Applications of Gas Chromatography Edited by Reza Davarnejad and Mahboubeh Jafarkhani
Published by InTech Janeza Trdine 9, 51000 Rijeka, Croatia Copyright © 2012 InTech All chapters are Open Access distributed under the Creative Commons Attribution 3.0 license, which allows users to download, copy and build upon published articles even for commercial purposes, as long as the author and publisher are properly credited, which ensures maximum dissemination and a wider impact of our publications. After this work has been published by InTech, authors have the right to republish it, in whole or part, in any publication of which they are the author, and to make other personal use of the work. Any republication, referencing or personal use of the work must explicitly identify the original source. As for readers, this license allows users to download, copy and build upon published chapters even for commercial purposes, as long as the author and publisher are properly credited, which ensures maximum dissemination and a wider impact of our publications. Notice Statements and opinions expressed in the chapters are these of the individual contributors and not necessarily those of the editors or publisher. No responsibility is accepted for the accuracy of information contained in the published chapters. The publisher assumes no responsibility for any damage or injury to persons or property arising out of the use of any materials, instructions, methods or ideas contained in the book. Publishing Process Manager Daria Nahtigal Technical Editor Teodora Smiljanic Cover Designer InTech Design Team First published March, 2012 Printed in Croatia A free online edition of this book is available at www.intechopen.com Additional hard copies can be obtained from
[email protected] Applications of Gas Chromatography, Edited by Reza Davarnejad and Mahboubeh Jafarkhani p. cm. ISBN 978-953-51-0260-1
Contents Preface VII Chapter 1
Gas Chromatography Application in Supercritical Fluid Extraction Process 1 Reza Davarnejad and Mostafa Keshavarz Moraveji
Chapter 2
Interaction Parameters of Surfactant Mixtures by Inverse Gas Chromatography 17 Eleuterio Luis Arancibia, Pablo C. Schulz and Susana M. Bardavid
Chapter 3
Applications of Chromatography Hyphenated Techniques in the Field of Lignin Pyrolysis 41 Shubin Wu, Gaojin Lv and Rui Lou
Chapter 4
Degradation Phenomena of Reforming Catalyst in DIR-MCFC Kimihiko Sugiura
Chapter 5
Chapter 6
65
Recent Strategies in Organic Reactions Catalyzed by Phase Transfer Catalysts and Analyzed by Gas Chromatography P. A. Vivekanand and Maw-Ling Wang
83
POP and PAH in Bizerte Lagoon, Tunisia 117 Trabelsi Souad, Ben Ameur Walid, Derouiche Abdekader, Cheikh Mohamed and Driss Mohamed Ridha
Preface This book presents a critical review of various chromatography techniques for a limited number of processes. Most techniques are illustrated by examples. The processes described are necessarily limited to those which appear to the authors to have the greatest validity and practical use. Wherever possible, we have included recommendations delineating the best techniques for analyzing each sample. Recommended techniques are often illustrated by detailed examples. Although the book is intended to serve primarily the practicing engineer, especially the process or chemical engineer, other engineers (such as environmental engineers) and chemists concerned with analyzing techniques may find it useful. Most new techniques are still empirical in nature, although there are often theoretical bases for the correlation; wherever possible, the theory is outlined to provide the user with the foundation of the proposed chromatography techniques. Special thanks are due to all respectful authors for their excellent contributions to this book and to Ms. Martina Durovic and Ms. Daria Nahtigal for extensive assistance and support.
Reza Davarnejad and Mahboubeh Jafarkhani Department of Chemical Engineering, Faculty of Engineering, Arak University Iran
1 Gas Chromatography Application in Supercritical Fluid Extraction Process Reza Davarnejad* and Mostafa Keshavarz Moraveji
Department of Chemical Engineering, Faculty of Engineering, Arak University, Iran 1. Introduction There are two types of application for gas chromatography (GC) in the supercritical fluid extraction process. Gas chromatography is a type of supercritical extraction apparatuses which can separate a component from a multi-component mixture during supercritical extraction. Therefore, this application can be the alternative to conventional gas chromatography, which needs high temperatures for the evaporation of the feed mixture and for liquid chromatography, where liquid solvents may be replaced. This process results in a different transport velocity along the stationary phase for different molecules. Molecules having weak interaction forces with the stationary phase are transported quickly while others with strong interactions are transported slowly. Beside the interactions with the stationary phase, the solvent power of the mobile phase determines the distribution of the components. Furthermore, supercritical gases have a high solvent power and exert this solvent power at low temperatures. Another application of GC in supercritical fluid extraction is consideration and analysis of extraction product. The obtained products from various types of supercritical apparatuses (such as phase equilibrium and rate test apparatus) should be analyzed. However, different types of analyzer can be used but, the conventional GC with a suitable column has widely been recommended. Although several columns for detecting a lot of components have been designed and fabricated by some companies but due to lacking of suitable columns for some components or unclear peaks obtained from some columns, an extra process (such as esterification of the fractionated fish oil) before GC analyze is sometimes required. In this application, the samples obtained from the supercritical extraction apparatus are not under pressure or their pressures have broken down by a damper (in online GC). In this chapter both types of GC application in supercritical fluid extraction with examples will be illustrated.
2. Gas chromatography apparatus In supercritical fluid chromatography (SFC) the mobile phase is a supercritical gas or a near critical liquid. Compared to gas chromatography (GC), where a gas is under ambient *
Corresponding Author
2
Applications of Gas Chromatography
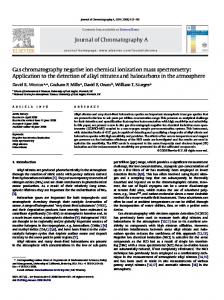
pressure (for example in the second type of apparatus applied in supercritical process), and liquid chromatography (LC), where a liquid is used as mobile phase, the solvent power of the liquid mobile phase in SFC can be varied by density, e.g., by pressure changes at constant temperature. Solubility increases in general with pressure under supercritical conditions of the mobile phase, temperature sensitive compounds can be processed. The chromatographic separation can be carried out at constant pressure (isobaric operation) or with increasing pressure (pressure programmed). In addition, temperature can be varied. SFC has one more adjustable variable for optimization of elution than GC or LC (Brunner, 1994). A supercritical fluid has properties similar to a gas and also similar to a liquid. While density and solvent power may be compared to those of liquids, transport coefficients are more those of a gas. SFC, because of its mobile phase, can cover an intermediate region between GC and LC, as illustrated in Figure 1 with respect to density and diffusion coefficient. For preparative and production scale operations, SFC has the advantage of easy separation of mobile phase from separated compounds. A disadvantage is that strongly polar and ionic molecules are not dissolved by supercritical gases, which can be advantageously used in SCF (Brunner, 1994).
Fig. 1. Areas for the different mobile phases in chromatographic separations with respect to component properties (Schoenmakers and Uunk, 1987). Most gases which can be used in SFC are non-polar. Therefore, polar substances of a feed mixture can only be eluted by adding a polar modifier. Polar gases like ammonia or sulfur dioxide are reactive compounds under pressure the equipment must be able to withstand corrosive conditions. On the other hand, carbon dioxide is easy to handle and safe. Polar modifiers, which are easier to handle than ammonia or sulfur dioxide may instead be applied. To make effective use of the possibilities of SFC, allowable pressures should be high.
Gas Chromatography Application in Supercritical Fluid Extraction Process
3
Composition of the mobile phase can substantially influence separation in SFC (Brunner, 1994). Retention times of substances may be very much different due to polarity or other physico-chemical properties of the components of the mobile phase. Pickel (1986) investigated large differences in the separation of aromatic hydrocarbons with CO2, N2O, C3H8 and C3H6. Gases applied in SFC are mostly non-polar. The polarity of carbon dioxide at low densities is comparable to that of n-hexane and at higher densities to that of methylene chloride. Nitrous oxide and the alkanes butane or pentane behave similar. Polar substances are eluted only after long retention times and in broad peaks even not at all. In these cases, a polar modifier, added to the gaseous mobile phase, introduces the necessary polarity to the mobile phase. The modifier then determines the elution sequence, which can be changed by the amount and the type of modifiers (Brunner, 1994). With increasing content of a modifier in the mobile phase, retention times become shorter. For polycyclic aromatic compounds, Leyendecker et al. (1986) investigated the influence of 1.4-dioxane as modifier on n-pentane as mobile phase. Temperature and pressure can be employed in supercritical chromatography as parameters for influencing separation characteristics. Temperature directly determines vapor-pressure of the feed components and density of the mobile phase and, indirectly, adsorption equilibrium. With higher temperatures, vapor-pressures of the feed components increase exponentially. Density decreases proportionally to temperature if conditions are far from critical, but in the region of the critical point of the mobile phase, which is the main area of application of SFC, density varies dramatically with temperature. The solvent power of the mobile phase, which increases with density, is therefore changed substantially in this region. The influence on chromatographic separation depends on the relative importance of these two effects, if other conditions remain unchanged (Brunner, 1994). Pressure mainly influences density of the mobile phase. With increasing pressure, the influence of temperature is diminishing, since density varies less with temperature at higher pressures (Brunner, 1994). SFC allows the variation of temperature and pressure for optimizing separation conditions as well as during the separation process itself. Such an operational mode is called pressure and temperature programming. Temperature programming is well known from gas chromatography, but is less common in SFC, since pressure programming can be very effective. Pressure and temperature programming may be combined to density programming (Brunner, 1994). In preparative chromatography, conditions are kept constant during separation, since feed mixtures of several injections may be on their way at the same time in the column. The elution of substances of different molecular weight in isobaric SFC separations is better than in isothermal GC, since vapor pressure is not so important in SFC. Compared to LC, the tendency of peak broadening is lower in SFC, since diffusion coefficients are far higher (Brunner, 1994). Flow rate of the mobile phase is a further important parameter which affects the number of theoretical stages in chromatographic separations. Due to the low viscosity of near critical mobile phases, flow rate in SFC can be high, and number of theoretical stages remains nearly constant over a wide range of flow rate. A more detailed discussion of
4
Applications of Gas Chromatography
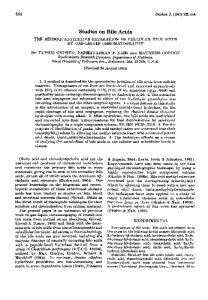
chromatographic fundamentals and especially analytical applications of SFC can be found in the abundant literature on analytical SFC (Gere et al., 1982; Lee and Markides, 1990; Smith, 1988; Wenclawiak, 1992; White, 1988). The apparatus (as shown in Figure 2) consists of the separation column as central part in a temperature controlled environment (1), the reservoir for the mobile phase (2), a unit for establishing, maintaining and controlling pressure (3), an optimal unit for adding a modifier (4), the injection part for introducing the feed mixture (5), a measuring device (detector) for determining concentration of the eluted substances (6), a sample collection unit (7), a unit for processing the mobile phase (8) and another one for processing data and controlling the total apparatus (9) (Brunner, 1994). The flow of the supercritical gas under pressure is maintained by long-stroke piston-pumps, reciprocating piston-pumps or membrane-pumps which deliver the mobile phase in liquefied form. The fluid is then heated to supercritical conditions before entering the column. Pressure and flow rate must be kept as constant as possible in order to maintain constant conditions for separation and to achieve a stable base line in the chromatogram. Oscillating pumps therefore can have three heads which deliver at different times or a pulsation dampener in order to minimize pulsation (Brunner, 1994).
Fig. 2. Flow scheme of apparatus for SFC (Brunner, 1994). 2.1 Columns Columns for chromatographic separation with supercritical are chosen, like other chromatographic columns, according to the needs of the separation. For analytical purposes the choice is between packed and capillary column. Capillary columns are used with a length between 10 m and 25 m. Pressure drop is low compared to liquid mobile phases. Therefore, capillary columns with inner diameters of 50 to 100 µm can be used and a high
Gas Chromatography Application in Supercritical Fluid Extraction Process
5
number of theoretical stages verified. Separations with capillary columns can be nearly as effective as in gas chromatography. While in early applications steel capillaries had been used in SFC, since 1980, fused silica capillary columns have replaced the steel capillaries. Stationary phases mostly stem from polysiloxanes and polyglycols. Frequently used stationary phases have been listed in the literature (Brunner, 1994). Under conditions of SFC, the compounds of the stationary phases may be slightly soluble in the mobile phase and are therefore fixed by linking them by chemical reactions. Numerous packed columns are available, many from HPLC applications. Normal phase chromatography (polar stationary phase, non-polar mobile phase) and reverse phase chromatography (non-polar stationary phase, polar mobile phase) are applied, but are not as important in SFC as in HPLC, since a polar mobile phase in SFC involves a polar modifier. Most separations in SFC are carried out with unmodified silica gel or chemically modified silica gel as stationary phase (Brunner, 1994). For packed columns particles are available with diameters in the range of 3 to 100 µm. For analytical purposes particles in the range of 3 to 5 µm have a high separation power in a packing and enable a high linear velocity of the mobile phase leading to short retention times. For preparative purposes particles in the range of 20 to 100 µm are used (Brunner, 1994). Special filling techniques are necessary to ensure a homogeneous packing. Saito and Yamauchi (Saito et al., 1988; Saito and Yamauchi, 1988; Saito et al., 1989) and Yamauchi and Saito (Yamauchi et al., 1988; Yamauchi and Saito, 1990) applied columns of 7 to 20 mm diameter, Perrut (1982, 1983, 1984) a column of 60 mm inner diameter and 600 mm length with particles of 10-25 µm, Alkio et al. (1988) a 900 mm long column with 40-36 µm diameter particles. The length of the column is dependent on the allowable pressure drop. Pressure drop usually is in the range of 1 to 4 MPa for 250 mm. In this range for the pressure drop capillary factors are nearly independent of pressure drop as demonstrated by Schoenmakers et al. (1986). To avoid unacceptable pressure drop, Saito et al. applied a recycling technique (Saito et al., 1988; Saito and Yamauchi, 1988; Saito et al., 1989). A cycle pump transports the eluted substances several times to the beginning of the column. Thus, the separation power of the column can be enhanced, without increasing pressure drop. Peak broadening occurs due to the cyclic operations. 2.2 Detectors Detection of a substance is necessary in analytical and preparative chromatography. In general, the same detectors are used as in gas and liquid chromatography. Selection of a detector depends on the quantity of substance available and the chemical nature the compound. A flame ionization detector (FID) detects substances down to nanogram quantities. Between two electrodes a voltage of 300 V and a hydrogen flame are maintained. If a substance with at least one carbon-hydrogen bonding is eluted from the column to the detector, it is burned and ions are formed, which leads to a current between the electrodes. The current is amplified and processed as a signal for the concentration of the substance. Nearly all substances can be detected. Response factors mainly differ according to number of carbon atoms, therefore calibration is easy (Brunner, 1994).
6
Applications of Gas Chromatography
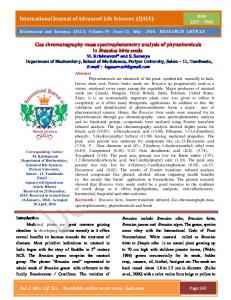
The ultraviolet spectroscopy detector (UV) is a nondestructive detector, which can be applied at column pressure. It is widely used, but is limited to substances with chromophoric groups. Saturated hydrocarbons, fatty acids and glycerides may be difficult to detect quantitatively. These substances may be detected with a refractive increment detector (RID), where the variation of refractive index of the mobile phase caused by dissolved substances is applied for detection. Other detectors are the fluorescence detector and the light-scattering detector (Brunner, 1994). In a light-scattering detector the mobile phase is intensively mixed with an inert gas and heated while flowing downward a tube (Upnmoor and Brunner, 1989; Upnmoor and Brunner, 1992). The inert gas and the temperature increase reduce solvent capacity of the mobile phase. The eluted substances precipitate and are carried out droplets or particles into the detection chamber. Into this chamber a tungsten lamp delivers visible light, which is dispersed by droplets or particles. The dispersed light is detected by a photomultiplier under an angle of 60º. The signal is proportional to the mass of light-scattering particles. Therefore, the light-scattering detector acts as mass detector and its signal is independent on chromatographic groups. It can be applied for detection of chromatographic and nonchromatographic substances in a mixture, as for example, in fatty acids and glycerides (Brunner, 1994). 2.3 Expansion of mobile phase and sample collecting system In analytical SFC, the mobile phase is either expanded after or before detection. Downstream to a detector, which is operated under column pressure, expansion can be achieved by normal expansion valves. They can act as back pressure regulators may be controlled by a central unit. At interesting alternative to an expansion valve was designed by Saito and Yamauchi, who use time-controlled opening and closing of an unrestricted tube for expansion. This has the advantage that blocking of the tube by precipitating substances is avoided. Another expansion technique was adapted from GC: A glass capillary is formed into long, thin capillary, as so-called restrictor. Problems with blocking and difficulties with reproducible manufacturing of the restrictors are disadvantages of this solution. In analytical SFC expansion techniques are determined by detection needs. The amount of substances is small and can easily be handled. The quantity of the mobile phase is not small and it must be recycled. To avoid backmixing, the recycled mobile phase must be totally free from any dissolved substances. In most cases they will be in the range of 0.1 or even 0.01% (Brunner, 1994). Then, separation methods for the dissolved substances from the mobile phase become important. Figure 3 shows a chromatographic system proposed by Perrut (1982, 1983, 1984). After elution and detection, the mobile phase together with the dissolved substance is heated and expanded. By these means the solvent power of the mobile phase is reduced and the substance precipitates; it is collected in one of several collecting vessels, one for each substance. The substances are removed after sufficient quantities of each of the substances have accumulated after several injections. Before the expanded mobile phase can be recycled by a cycle pump, it is passed through an adsorbing bed, where remaining quantities of the dissolved substances and other un wanted substances (as, for example, water) are removed. As in any solvent cycle, make up gas must be added, and a small part of the solvent must be removed for disposal or for special cleaning (Brunner, 1994).
Gas Chromatography Application in Supercritical Fluid Extraction Process
7
In preparative SFC so far mostly extracts from plants like lemon peel oil, tocopherols from wheat germ or ubichinones have been treated. Unsaturated fatty acids from fish oil, mostly processed as esters, is a subject investigated heavily in recent years (Davarnejad et al., 2008).
Fig. 3. Flow scheme of a preparative SFC with recycle of the mobile phase (Perrut, 1982, 1983, 1984). More specialized applications deal with polymers or the fractionation of coal tar. Berger and Perrut (1988) have reviewed the applications of preparative SFC. 2.4 Injection techniques Injection of the mixture to be separated is accomplished for analytical purposes by sample loops which may be filled at ambient pressure and are injected into the flow of the mobile phase by switching a multiposition valve in the appropriate position. Such valves can be manufactured as linear moving or rotating valve, as shown in Figure 4. For preparative separations the feed is pumped by metering pumps into the flow of the mobile phase. Intensive mixing can be achieved in line by static mixers. Other possibilities comprise a column, where the mixture is placed under ambient pressure and is then eluted by the mobile phase and transported to the separation column, or a combination with a gas extraction unit. The extract of the gas extraction process can be directly passed through the chromatographic column. The separated substances can be collected. The extract from an extraction unit is diluted with respect to the interesting compounds. It can be collected on a column and after some time transported to the chromatographic separation (Brunner, 1994). This operational mode is illustrated in Figure 5.
8
Applications of Gas Chromatography
Fig. 4. Multiposition-valves for injection of samples into a SFC (Brunner, 1994).
Gas Chromatography Application in Supercritical Fluid Extraction Process
9
Fig. 5. Coupling of SFE with SFC. Concentration of compounds in a collecting column (Yamauchi and Saito, 1990). According to this type of apparatus, some examples in details have been shown by Brunner (1994).
3. General gas chromatography apparatus The obtained products from various types of supercritical apparatuses (such as phase equilibrium and rate test apparatus) should be analyzed. However, different types of analyzer can be used, but the conventional GC with a suitable column has widely been recommended. Although several columns for detecting a lot of components have been designed and fabricated by some companies, but due to lacking of suitable columns for some components or unclear peaks obtained from some columns, an extra process (such as esterification of the fractionated fish oil) before GC analyze is required. In this application, the samples obtained from the supercritical extraction apparatus are not under pressure or their pressures have broken down by a damper (in the online GC). Since this type of apparatus has been explained in detail in the other chapters, therefore an example from its application is illustrated in this section.
10
Applications of Gas Chromatography
3.1 Triacylglycerols analysis 3.1.1 Introduction Most of the fatty acids of palm oil are present as triacylglycerols (TAGs). The different placements of fatty acids and fatty acid types on the glycerol molecule produce a number of different TAGs. About 7 to 10 percent of saturated TAGs are predominantly tripalmitin (Karleskind and Wolff, 1996) and the fully unsaturated triglycerides constitute 6 to 12 percent (Karleskind and Wolff, 1996; Kifli, 1981). The TAGs in palm oil are partially defined most as of the physical characteristics of the palm oil such as the melting point and crystallization behavior (Sambanthamurthi et al., 2000). Detailed information about Malaysian tenera palm oil TAGs have been given in various references (Sambanthamurthi et al., 2000; Kifli, 1981; Sow, 1979). Fatouh et al. (2007) studied the supercritical extraction of TAGs from buffalo butter oil using carbon dioxide solvent. They concluded that increasing the pressure and temperature of the extraction led to increasing the solvating power of the supercritical carbon dioxide. In these studies, the TAGs were extracted during the early stage of the fractionation thereby creating low-melting fractions. Conversely, TAGs were concentrated in the fractions (i.e. high-melting fractions) obtained towards the end of the process. According to the literature, mole fraction solubility data of pure triacylglycerols in CO2 were reported at temperatures of 40, 60 and 80 ºC in the range of 10-10 to 10-2 (Soares et al., 2007). These data depended on the type of triacylglycerols and operating pressure. That means high pressure had a good effect on solubility of triacylglycerols in CO2. Furthermore, tricaprylin had the higher solubility in CO2 (around 10-2 at high pressures) than the rest (Jensen and Mollerup, 1997; Bamberger et al., 1988; Weber et al., 1999). In this research, phase equilibrium of TAGs from crude palm oil in sub and slightly supercritical CO2 is studied. For this purpose, the samples obtained from the phase equilibrium supercritical fluid extraction apparatus are carefully analyzed by a HPLC in terms of TAGs. 3.1.2 Experiment 3.1.2.1 Materials and methods Crude palm oil and CO2 (99.99%) respectively as feed and solvent were purchased from United Oil Palm Industries, Nibong Tebal, Malaysia and Mox Sdn. Bhd. 1,3-dipalmitoyl-2oleoyl-glycerol (99%) (POP), 1,2-dioleoyl-3-palmitoyl-rac-glycerol (99%) (POO) and 1,2dioleoyl-3-stearoyl-rac-glycerol (99%) (SOO) as standards were purchased from SigmaAldrich. Acetone (99.8%) and acetonitrile (99.99%) as solvent and mobile phase were obtained from J.T.Baker and Fisher Scientific, respectively. The phase equilibrium supercritical fluid extraction apparatus and calculations procedure have been shown and explained in detail in the references (Davarnejad, 2010; Davarnejad et al., 2010; Davarnejad et al., 2009). The operating conditions were set at 10.8, 7.0, 2.7 and 1.7 MPa for temperature of 80 ºC, 11.1, 7.6, 6.1 and 1.1 MPa for temperature of 100 ºC and 7.4, 5.4, 3.3 and 0.6 MPa for temperature of 120 ºC.
Gas Chromatography Application in Supercritical Fluid Extraction Process
11
For TAGs analysis, the following stages are carried out step by step using a HPLC (brand: Shimadzu, Japan; model: 10 Series) which is equipped with a capillary column (Aglient Lichrosphere RP-18250×4 mn) and oven temperature is also set at 50 ºC. 1.
2. 3.
4.
The standard solutions of POO, POP and SOO with concentrations of 10, 25 and 50 ppm are prepared by diluting these chemicals with acetone separately. These solutions are prepared by diluting these chemicals which are initially prepared at a concentration of 200 ppm. A mobile phase containing 75% acetone and 25% acetonitrile (v/v) is prepared. The chromatography interface, vacuum degasser, pump (LC-8A pump with maximum flow rate of 150 cm3/min) and refractive index (RI) detector are switched on respectively. The computer, printer and GC are switched on.
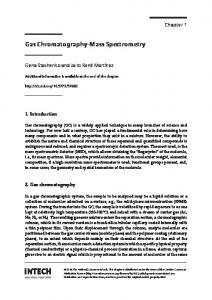
The HPLC diagram obtained from each sample is shown as following and compared with the diagrams obtained from the standard materials. Then, by applying the standard equation: Samples concentration (ppm)=sample area/standard area ×standard concentration Samples concentration in terms of each substance is calculated.
SOO POP POO
Fig. 6. HPLC chromatogram of crude palm oil TAGs for vapor phase at pressure of 5.4 MPa and temperature of 120 ºC. 3.1.3 Results and discussion Two-phase equilibrium data based on different TAGs are illustrated in Tables 1-3 as following:
12
Applications of Gas Chromatography
Pressure (MPa)
Liquid phase, CO2 mole fraction
Vapor phase, CO2 mole fraction
0.9 0.9 1 1
1 1 1 1
1 1 1 1
1 1 1 1
0.9 0.9 1 1
1 1 1 1
T=80 ºC 10.8 7.0 2.7 1.7 T=100 ºC 11.1 7.6 6.1 1.1 T=120 ºC 7.4 5.4 3.3 0.6
Table 1. Two-phase equilibrium calculated data based on CO2 at 80,100 and 120 ºC in order to POP analysis Pressure (MPa)
Liquid phase, CO2 mole fraction
Vapor phase, CO2 mole fraction
0.9 0.9 1 1
1 1 1 1
1 1 1 1
1 1 1 1
0.9 0.9 1 1
1 1 1 1
T=80 ºC 10.8 7.0 2.7 1.7 T=100 ºC 11.1 7.6 6.1 1.1 T=120 ºC 7.4 5.4 3.3 0.6
Table 2. Two-phase equilibrium calculated data based on CO2 at 80,100 and 120 ºC in order to POO analysis
13
Gas Chromatography Application in Supercritical Fluid Extraction Process
Pressure (MPa)
Liquid phase, CO2 mole fraction
Vapor phase, CO2 mole fraction
0.9 0.9 1 1
1 1 1 1
0.9 1 1 1
1 1 1 1
0.9 0.9 1 1
1 1 1 1
T=80 ºC 10.8 7.0 2.7 1.7 T=100 ºC 11.1 7.6 6.1 1.1 T=120 ºC 7.4 5.4 3.3 0.6
Table 3. Two-phase equilibrium calculated data based on CO2 at 80,100 and 120 ºC in order to SOO analysis The mole fractions of CO2 in the equilibrium supercritical extraction of the POP substance for the liquid and vapor phases are shown in Table 1. The POP substance mole fractions in the vapor phase increased with increasing the pressure at 80 ºC. This trend was also observed in the liquid phase. A regular trend was not observed in the vapor and liquid phases at 100 ºC and 120 ºC. It seems that high temperatures (such as 100 ºC and 120 ºC) to cause this irregularity however, the maximum solubility was carried out at 120 ºC which is reasonable because high temperature increases TAGs solubilities in CO2 (Soares et al., 2007). The maximum solubility of POP substance in CO2 was observed at 80 ºC and 10.8 MPa, at 100 ºC and 7.6 MPa as well as at 120 ºC and 5.4 MPa, respectively. The optimum conditions around these operating regions for the maximum solubility of the POP substance were at 120 ºC and 5.4 MPa. The mole fractions of CO2 in the equilibrium supercritical extraction of the POO substance for the liquid and vapor phases are shown in Table 2. The POO substance mole fractions in the vapor phase increased with increasing the pressure at 80 ºC. This trend was also observed in the liquid phase. A regular trend was not observed in the vapor and liquid phases at 100 ºC and 120 ºC. Since POO is from TAGs group, this subject is reasonable as it was legitimized for POP. The maximum solubility of the POO substance was observed at 7.6 MPa and 100 ºC as well as at 5.4 MPa and 120 ºC, respectively. The optimum conditions around these operating regions for the maximum solubility of the POO substance was observed at 120 ºC and 5.4 MPa. The mole fractions of CO2 in the equilibrium supercritical extraction of the SOO substance for the liquid and vapor phases are shown in Table 3. The SOO substance mole fractions in
14
Applications of Gas Chromatography
the vapor phase increased with increasing the pressure at 80 ºC; this trend was also observed in the liquid phase. A regular trend was not observed in the vapor and liquid phases at 100 ºC and 120 ºC. Since SOO also is from TAGs group, this subject is reasonable as it was legitimized for POP and POO. The maximum solubility of the SOO substance was observed at 7.6 MPa and 100 ºC as well as at 5.4 MPa and 120 ºC. The optimum conditions around these operating regions for the maximum solubility of the SOO substance was observed at 120 ºC and 5.4 MPa. The experimental results showed that although highest extraction using CO2 was observed at 120 ºC and 5.4 MPa for all of the TAGs substances but, maximum solubilities at the mentioned operating conditions were obtained for POP (y=1), POO (y=1) and SOO (y=1) respectively. The obtained result was confirmed by the overall conclusion which stated that the fats and oils composed of shorter chain fatty acids are more soluble than those with longer chain fatty acids (Fatouh et al., 2007). Soares et al. (2007) also illustrated that high temperature had a desired effect on TAGs solubility in CO2 as this output was obtained from the current research as well where this statement supported the results above. Tan et al. (2008) also confirmed that high temperature had a positive effect on TAGs extraction using CO2. They observed that monounsaturated fatty acids (such as POP) had a maximum yield of extraction in supercritical CO2 as this output was obtained from current research. That means POP had a higher solubility in CO2 in comparison with POO and SOO. Although they proposed high pressures for supercritical extraction of TAGs but they conducted their experiments at operating pressures more than 10 MPa and they studied yield of extraction. 3.1.4 Conclusions In the mutual solubility study of TAGs from crude palm oil which is related to the experiment, it was shown that by using the supercritical fluid extraction process, the highest mole fraction percentage of TAGs solubility was obtained at approximately 2.2% (at 5.4 MPa and 120 ºC). According to our calculations, the data slightly varied in seventh or eighth decimal points for the reported data due to the chromatography influence. In order to the calculations procedure, the significant part of these calculated data (solubility data) is prepared from the pressure increments. Furthermore, high temperature increased TAGs solubility in CO2.
4. References Alkio, M. Harvala T. Komppa, V. (1988). Preparative scale supercritical fluid chromatography. In: Perrut, M. (ed.) Proceedings of 2nd International Symposium on Supercritical Fluids. Bamberger, T. Erickson, J.C. Cooney, C.L. Kumar, S.K. (1988). Measurement and model prediction of solubilities of pure fatty acids, pure triglycerides, and mixtures of triglycerides in supercritical carbon dioxide, J. Chemical & Engineering Data, Vol. 33, No. 3, pp. 327–333. Berger, C. Perrut, M. (1988). Purification de molecules d’interet biologique par chromatografie preparative avec eluant supercritique, Technoscope Biofutur, Vol. 25, pp. 3-8.
Gas Chromatography Application in Supercritical Fluid Extraction Process
15
Brunner, G. (1994). Gas Extraction: an Introduction to Fundamentals of Supercritical Fluids and the Application to Separation Processes, Springer, 0-387-91477-3, New York. Davarnejad, R. Kassim, K.M. Ahmad, Z. Sata, S.A. (2009). Solubility of β-carotene from crude palm oil in high temperature and high pressure carbon dioxide, J. Chemical & Engineering Data, Vol. 54, No. 8, pp. 2200-2207. Davarnejad, R. Ahmad, Z. Sata, S.A. Moraveji, M.K. Ahmadloo, F. (2010). Mutual solubility study in supercritical fluid extraction of tocopherols from crude palm oil using CO2 solvent, International J. Molecular Sciences, Vol. 11, No. 10, pp. 3649-3659. Davarnejad, R. Kassim, K.M., Ahmad, Z. Sata S.A. (2008). Extraction of fish oil by fractionation through the supercritical carbon dioxide, J. Chemical & Engineering Data, Vol. 53, No. 9, pp. 2128-2132. Davarnejad, R. (2010). Phase equilibrium study of β-carotene, tocopherols and triacylglycerols in supercritical fluid extraction process from crude palm oil using carbon dioxide as a solvent, PhD. thesis, Universiti Sains Malaysia, Malaysia. Fatouh, A.E. Mahran, A. El-Ghandour, M.A. Singh, R.K. (2007). Fractionation of buffalo butter oil by supercritical carbon dioxide. LWT, Vol. 40, No. 10, pp. 1687-1693. Gere, D. Board, R. Mc-Manigill, D. (1982). Parameters of Supercritical Fluid Chromatography Using HPLC Columns, Hewlett-Packard, 43-5953-1647, Avondale, Pennsylvania. Jensen, C.B. Mollerup, J. (1997). Phase equilibria of carbon dioxide and tricaprylin, J. Supercritical Fluids, Vol. 10, No. 2, pp. 87–93. Karleskind, A. Wolff, JP. (1996). In: volume 1: Properties, Production and Applications, Intercept Limited, Andover, UK. Kifli, H. (1981). Studies on palm oil with special reference to interesterification. PhD. Thesis, University of St Andrews, Scotland. Lee, M.L. Markides, K.E. (eds) (1990). Analytical supercritical fluid chromatography and extraction, Proceedings of Chromatography, Provo, Utah. Leyendecker, D. Leyendecker, D. Schmitz, F.P. Klesper, E. (1986). Chromatographic behavior of various eluents and eluent mixtures in the liquid and in the supercritical state. J. Chromatography A, Vol. 371, pp. 93-107. Perrut, M. (1982). Demande de brevet francais, No. 82 09 649. Perrut, M. (1983). Brevet European, No. 00 99 765. Perrut, M. (1984). US Patent, No. 44 78 720. Pickel, K.H. (1986). Chromatografische Untersuchungen mit Hochkompressiblen Mobilen Phasen, Dissertation, Universität Erlangen-Nürnberg. Saito, M. Yamauchi, Y. Hondo, T. Senda M. (1988). Laboratory scale preparative supercritical chromatography in recycle operation: instrumentation and applications. In: Perrut, M. (ed.), Proceedings of 2nd International Symposium on Supercritical Fluids. Saito, M. Yamauchi, Y. (1988). Recycle chromatography with supercritical carbon dioxide as mobile phase, J. High Resolution Chromatography, Vol. 11, No. 10, pp. 741-743. Saito, M. Yamauchi, Y. Inomata, K. Kottkamp, W. (1989). Enrichment of tocopherols in wheat germ by directly coupled supercritical fluid extraction with semi-preparative supercritical chromatography, J. Chromatographic Science, Vol. 27, No. 2, pp. 79-85.
16
Applications of Gas Chromatography
Saito, M. Yamauchi, Y. (1990). Isolation of tocopherols from wheat germ oil by recycle semipreparative supercritical fluid chromatography, J. Chromatography A, Vol. 505, No. 1, pp. 257-271. Schoenmakers, P.J. Verhoeven, F.C.C.J.G. (1986). Effect of pressure on retention in supercritical fluid chromatography with packed columns, J. Chromatography A, Vol. 325, pp. 315-328. Sambanthamurthi, R., Sundram, K Tan, Y.A. (2000). Chemistry and biochemistry of palm oil, Progress in Lipid Research, Vol. 39, No. 6, pp. 507-558. Schoenmakers, P.J. Uunk, L.G. (1987). Supercritical fluid chromatography-recent and future developments. European Chromatography News, Vol. 1, No. 3, pp. 14-22. Smith, R.M. (ed.) (1988). Supercritical Fluid Chromatography, Roy Soc Chem, London. Soares, B.M.C. Gamarra, F.M.C. Paviani, L.C. Gonçalves, L.A.G. Cabral, F.A. (2007). Solubility of triacylglycerols in supercritical carbon dioxide, J. Supercritical Fluids, Vol. 43, No. 1, pp. 25-31. Sow, HP. (1979). Modification in the chemical composition of palm oil by physical, chemical and biochemical treatment, PhD. thesis, Universiti Sains Malaysia, Malaysia. Tan, T.J. Jinap, S. Kusnadi A.E. Abdul Hamid, N.S. (2008). Extraction of cocoa butter by supercritical carbon dioxide: optimization of operating conditions and effect of particle size, J. Food Lipids, Vol. 15, No. 2, pp. 263-276. Upnmoor, D. Brunner, G. (1989). Retention of acidic and basic compounds in packed column supercritical fluid chromatography, Chromatographia, Vol. 28, No. 9-10, pp. 449-454. Upnmoor, D. Brunner, G. (1992). Packed column supercritical fluid chromatography with light scattering detection. I. Optimization of parameters with a carbon dioxide/methanol mobile phase, Chromatographia, Vol. 33, No. 5-6, pp. 255-260. Weber, W. Petkov, S. Brunner, G. (1999). Vapor liquid equilibria and calculations using the Redlich-Kwong-Aspen-equation of state for tristearin, tripalmitin, and triolein in CO2 and propane, Fluid Phase Equilibria, Vol. 158, pp. 695-706. Wenclawiak, B. (ed.) (1992). Analysis with Supercritical Fluids: Extraction and Chromatography, Springer, Berlin Heidelberg New York London Paris Tokyo Hong Kong Barcelona Budapest. White, C.M. (ed.) (1988). Modern Supercritical Fluid Chromatography, Hüthig, Heidelberg Basel New York. Yamauchi, Y. Saito, M. Hondo, T. Senda, M. Milet, J.L. Castiglioni, E. (1988). Coupled supercritical fluid extraction-supercritical fluid chromatography using preconcentration/separation column: Application to fractionation of lemon peel oil. In: Perrut, M. (ed.) Proceedings of 2nd International Symposium on Supercritical Fluids. Yamauchi, Y. Saito, M. (1990). Fractionation of lemon-peel oil by semi-preparative supercritical fluid chromatography, J. Chromatography A, Vol. 505, No. 1, pp. 237246.
2 Interaction Parameters of Surfactant Mixtures by Inverse Gas Chromatography Eleuterio Luis Arancibia1, Pablo C. Schulz2 and Susana M. Bardavid1 1INQUINOA
2INQUISUR
- CONICET- FACET – UNT- Tucumán, – CONICET –FQ –UNS – Bahia Blanca, Argentina
1. Introduction Inverse Gas Chromatography (IGC) is an accurate and versatile technique for determining a variety of properties of different materials (Voelkel, A. et al., 2009). IGC has also shown to be an effective way to determine thermodynamic properties in polymer materials, especially to obtain Flory-Huggins interaction parameters, which can be used to calculate energy densities interaction (B23) in polymer-polymer systems. These parameters have been employed for evaluating thermodynamic miscibility in polymer mixtures (Deshpande, et al., 1974; Lezcano, et al., 1995). The major difficulty in those determinations relies on the dependence of the parameters obtained on the solvents used as probe solutes. In spite of the fact that the relations obtained from interaction studies through IGC can be applied to miscible systems, the studies in systems that present partial or total inmiscibility have been made in several polymer systems (Du, et al., 1999; Zhikuan, C. & Walsh, D.J., 1983). The relation from which B23 data are obtained describes a ternary system as a simple balance of the corresponding binary ones. It is well known their small contribution to this relation (Etxeberria, et al., 1994, 1995). Besides, the interaction parameter is several orders of magnitude smaller than that of the retention property determined by IGC. An attempt to reduce the uncertainty in the B23 parameter has led to establish an adequate selection of probe solutes (Etxeberria et al., 2000). These authors have also demonstrated that the results obtained from IGC as well as from static technique are similar when CO2 is used as a probe solute. As indicated by several authors, the polymer-polymer interaction parameter determined by IGC shows a clear dependence on the solvent used as a probe. In order to solve this problem, different methods have been proposed (El-Hibri, et al., 1988; Etxeberria, et al., 1994, 2000; Farooque, & Deshpande, 1992; Huang, 2003a, 2003b; Prolongo, et al., 1989; Zhao, & Choi, 2001). Farooque and Deshpande’s proposed methodology (Farooque, & Deshpande, 1992) has allowed the determination of reliable polymer-polymer interaction parameters by IGC. Huang’s later proposal (Huang, 2003a, 2003b) based on a methodology similar to the latest
18
Applications of Gas Chromatography
has been applied to several systems and has been compared with the previous methodology using retention data in polymer materials (Benabdelghani, et al., 2006). In the case of liquid crystals, they have been thoroughly investigated as stationary phases by gas liquid chromatography (GLC) from an analytical point of view (Janini, et al., 1975; Janini, et al., 1980; Martire, et al., 1968). They have also been used in studies of solution thermodynamic, by inverse gas chromatography (IGC) of solutes in liquid crystals (CL) and in polymer liquid crystals (CLP) at infinite dilution (Chow & Martire, 1971; Romannsky & Guillet, 1994; Romannsky, et al., 1994; Shillcock & Price, 2004). Huang et al. (Huang, et al., 2007) has studied the solution properties of a series of organic solutes in liquid crystals using IGC through activity coefficients and free energy transference of solute between mesophases and an isotropic phase. In these systems, constant values of free energy of transference have been obtained applying lattice’s model of polymer solutions (Flory, 1953) and Flory’s treatment of liquid crystals (Flory, 1956; Flory, 1984). The treatment of the data obtained via IGC in order to get thermodynamic properties using Flory’s classic model has been more frequently applied to mesophases than to Flory’s liquid crystal model. In the derivation of this model, the expression that corresponds to the non-combinatory contribution has been discarded (Abe & Flory, 1978; Flory & Abe, 1978); thus, the interaction parameter 1,2 between probe solute and stationary phase, that represents the energy exchange of interactions, has not been included. This might be one of the reasons because the interaction parameter is obtained preferably by Flory’s classic model of polymers. Since the probe solute is at near infinite dilution, the order of the liquid crystal phase is not destroyed by the probe solute inclusion. The accessibility of the probe molecules in a mesophase could be limited by its ordering. This means that the main interaction occurs with the hydrocarbon chains of the bilayers and the interactions are mainly of dispersive character. We can estimate the degree of interaction solute – stationary phase by Flory Huggins’ interaction parameter obtained by IGC using surfactants as stationary phase. The amphiphilic molecular structure of surfactants has a significant influence in the crystals phase structure. The packing of the surfactants is produced so that the liphophilic groups of the different molecules are associated with every lipophilic region. Their hydrophilic groups are equally associated within the polar region. In this way, they form the so called bilayers which are usually formed in crystals of simple or double hydrocarbon chain surfactants. Some surfactant crystals do not melt in a liquid phase directly but go through anhydrous liquid crystal phases (thermotropic liquid crystals) before reaching the isotropic liquid state. The liquid crystals of anhydrous surfactants are thermotropic since they result only from the temperature increase on anhydrous crystals (Laughlin, 1994). This chapter is part of a series of works done in this laboratory, where several surfactant properties such as solubility parameters, surfactant-surfactant interaction parameters in several systems made up by cationic surfactants of different hydrocarbon length chain have been determined by IGC (Bardavid, et al., 2003, 2007; Proverbio, 2003; Schaefer, 2008). The vast majority of the works related to surfactant mixtures have been made at low concentration in aqueous solutions. The mixing of different types of surfactants gives rise to synergies that provide the opportunity to optimize product performance. For surfactant mixtures the characteristic phenomena are the formation of mixed monolayers at the
Interaction Parameters of Surfactant Mixtures by Inverse Gas Chromatography
19
interface and mixed micelles in the bulk solution. In such solutions, adsorption behaviour, aggregates’ microstructure, and rheological properties can be manipulated to tailor the properties of the different products. In ionic anhydrous surfactant systems, the structures of liquid crystals and crystals are based on the simultaneous fulfillment of two kinds of interactions: van der Waals interactions in the hydrocarbon bilayers and the electrostatic interactions in the ionic bilayers. Sometimes, steric interactions can appear in the hydrocarbon bilayers, and polar interactions or hydrogen bonds can appear in the ionic bilayers (Schulz et al., 1996). A combination of these interactions can be especially disclosed in mixed amphiphiles systems, and their study can lead to a better understanding of their influence in the formation and stability of the microstructures mentioned above. The cationic surfactants mixed systems are becoming more important and in the future additional complex formulation a and multiple technological products will be required. The extension to a thermodynamic approximation of multicomponents including additional phenomena like solubility will allow the establishment of more complex systems (Holland & Rubingh, 1990). There is not much information about studies of cationic surfactant mixture phases (Varade, et al., 2008), or the miscibility of pure surfactant mixtures (Bardavid, et al., 2007, 2010) that allow resemblance to the behaviour of surfactant mixtures interactions in mixed micelles. In this chapter we present the results obtained from the study of miscibility of cationic surfactant mixtures of three systems made up by mixtures of surfactants of equal polar head and different hydrocarbon chains by determining surfactant-surfactant interaction parameters through IGC. The implementation of this technique has also allowed us to analyze the use of two methodologies of measurement in order to obtain the parameter B23 for cationic surfactants and to contrast them with the ones obtained in polymeric materials. With this work we hope to enlarge the information about the behaviour of pure surfactant mixtures, and analyze the non-ideality degree in the mixtures and its possible causes.
2. Experimental 2.1 Materials Dodecylpyridinium chloride (DPC), Hexadecylpyridinium bromide (Cetylpyridinium bromide (CPB)), Dodecyltrimethylammonium bromide (DTAB), Octadecyl trimethylammonium bromide (OTAB), (Aldrich, analytical grade, USA) Didodecyldimethylammonium bromide (DDAB) and Dioctadecyldimethylammonium bromide (DODAB) (Sigma, analytical grade, USA) were used as received. All probe solutes were chromatographic quality or reagent grade and were used without further purification. 2.2 Differential Scanning Calorimetry (DSC) DSC was performed on a Perkin Elmer DSC 6 calorimeter, between 293 and 523 K, with a scanning rate of 10 degree min−1 and using samples of 5–10 mg for pure surfactants and 10– 15 mg for materials collected over chromatography support. The instrument was calibrated with indium.
20
Applications of Gas Chromatography
2.3 Inverse Gas Chromatography (IGC) Pure surfactants and their mixtures were used as stationary phase and deposited on Chromosorb W or G, AW, 60/80, which was employed as solid support. The column filler was prepared using methanol as a solvent in a rotary evaporator under a flow of dry nitrogen and was kept in a dry atmosphere before filling the columns (stainless steel pipes). The column was loaded and conditioned for 1 h at 363 K under a flow of carrier gas. The amount of stationary phase on the support was determined by calcinations of about one gram of material. The data employed in the specific retention volume computation were obtained by using a column 100 cm long, 1/4 inch external diameter, and the packing characteristics are included in Table 1. System DDAB (2) – DODAB (3) Stationary phase Mass packing (g) DDAB (2) + DODAB (3) 7.2653 DDAB (2) + DODAB (3) 7.6432 DDAB (2) + DODAB (3) 7.8634 DDAB (2) + DODAB (3) 7.0268 DDAB (2) + DODAB (3) 7.0906 DDAB (2) + DODAB (3) 7.8856 System DPC (2) – CPB (3) Stationary phase Mass packing (g) DPC (2) + CPB (3) 13.2318 DPC (2) + CPB (3) 12.9175 DPC (2) + CPB (3) 12.9056 DPC (2) + CPB (3) 12.6945 DPC (2) + CPB (3) 12.9240 DPC (2) + CPB (3) 12.5835 System DTAB (2) – OTAB (3) Stationary phase Mass packing (g) DTAB (2) + OTAB (3) 7.2301 DTAB (2) + OTAB (3) 6.7947 DTAB (2) + OTAB (3) 7.4240 DTAB (2) + OTAB (3) 7.3281 DTAB (2) + OTAB (3) 7.2392 DTAB (2) + OTAB (3) 7.0746
Loading(w/w) (%) 9.12 9.22 9.23 9.53 9.60 9.11
Weight fraction (w2) 0.0000 0.1643 0.3281 0.5037 0.7325 1.0000
Loading(w/w) (%) 7.44 7.82 7.72 7.42 7.39 7.41
Weight fraction (w2) 0.0000 0.1598 0.3461 0.5409 0.7590 1.0000
Loading(w/w) (%) 10.09 10.04 10.02 9.99 11.64 10.03
Weight fraction (w2) 0.0000 0.1102 0.3652 0.5963 0.8331 1.0000
Table 1. Column loading data and the weight fraction at the different mixtures. The retention time measurement for each solute was performed with a Hewlet Packard, HP 6890 series, GC System, equipped with a flame ionization detector (FID). Column temperature was measured in a range between 343.1 and 403.1 K with an Iron-Constantan thermocouple
Interaction Parameters of Surfactant Mixtures by Inverse Gas Chromatography
21
placed in the direct environment of the column. The temperature stability during experiments was ± 0.2 K. The employed solutes were n-hexane, n-heptane, n-octane, n-nonane, cyclohexane, methylcyclohexane, benzene, toluene, ethyl acetate, dichloromethane, trichloromethane and carbon tetrachloride. Nitrogen was used as carrier gas. Flow rates were measured at the beginning of each experiment with an air-jacketed soap film flowmeter placed at the outlet of the detector. Inlet pressures were measured with a micrometry syringe (trough the injector septum) which was connected to an open branch mercury manometer. To ensure that the results were independent of sample size and flow rate and those measurements were being made at infinite dilution the usual checks were made (Conder & Young, 1978). Solutes were injected with 10 μl Hamilton syringes, as steam in equilibrium with pure liquid. For all the solutes and for all the range of stationary phase concentrations the peaks were symmetric. The injector was kept at 423 K and the detector at 453 K. Retention times (tR) were measured with a Chem Station system and the retention specific volumes (V 0g ) were calculated with the following relationship (Conder & Young, 1978): F p pw Vg0 j f 273.15 t R t0 0 Tf p0 w
(1)
where j is the James-Martin compressibility correction factor, p0 represents the outlet column pressure, Ff is the flow rate measured at pressure p0 and temperature Tf, w is the mass of the stationary phase into the column and pw is the water vapour pressure at Tf; t0 is the dead time, which was measured by using the methane peak obtained with the FID.
3. Data reduction Specific retention volumes were fitted to the equation (Conder & Young, 1978):
ln Vg0 H s0 / RT cons tan t
(2)
where Hs is the sorption heat. The values obtained for Hs, as well as their respective standard deviations, were calculated using Marquartd-Levenberg’s algorithm (Marquartd, 1963) and can be seen in Table 2. Values of standard deviations in Hs smaller than 1.5 % are obtained in the regression of specific retention values vs. 1/T, although most of the values were near 1.0 %. The meaning of Hs depends on the physical state of the stationary phase. For a solid, Hs correspond to the molar adsorption enthalpy. For the liquid mesophase, it was assumed that the solute is dissolved in the stationary phase so Hs corresponds to the molar solution enthalpy. The average per cent error values Hs for DDDAB is 0.88 , and 0.74 for DODAB. For the DPB-CPB systems the average error % is 0.79 for DPC and for CPB is 1.20 . Finally, for the mixed systems DTAB-OTAB the average error in Hs values is generally bigger than the previous ones and from the calculated values we get a value of 1.38 for the average error in DTAB and of 1.10 for the values in OTAB.
22
n-Hexane n-Heptane n-Octane Benzene Toluene Cyclohexane Methylcyclohexane Dichloromethane Trichloromethane Carbon tetrachloride Ethyl acetate
n-Hexane n-Heptane n-Octane Benzene Toluene Cyclohexane Methylcyclohexane Dichloromethane Trichloromethane Carbon tetrachloride Ethyl acetate
n-heptano n-Octano n-nonano Benceno Tolueno Cyclohexane Methylcyclohexane Dichloromethane Trichloromethane Carbon tetrachloride Ethyl acetate
Applications of Gas Chromatography
System DDDAB-DODAB DDDAB DODAB Hs Hs 28.7 0.3 30.7 0.3 33.4 0.4 34.8 0.4 38.6 0.2 39.3 0.3 33.5 0.2 33.7 0.4 37.5 0.4 37.6 0.2 29.8 0.4 31.1 0.2 33.6 0.2 33.6 0.2 33.2 0.3 32.3 0.3 43.8 0.4 43.4 0.2 35.5 0.2 34.3 0.2 33.3 0.3 32.6 0.1 System DPC-CPB DPC CPB Hs Hs 29.5 0.1 27.4 0.5 33.6 0.2 31.8 0.5 38.1 0.2 35.9 0.4 32.9 0.3 30.2 0.3 37.3 0.2 35.1 0.6 29.8 0.2 27.2 0.4 32.2 0.3 30.5 0.5 31.4 0.4 27.1 0.2 40.4 0.3 35.9 0.3 33.9 0.3 31.4 0.2 31.6 0.4 28.6 0.3 System DTAB-OTAB DTAB OTAB Hs Hs 35.0 0.5 33.1 0.3 39.4 0.2 38.4 0.4 43.3 0.7 40.7 0.5 38.5 0.2 35.2 0.4 42.6 0.8 39.0 0.5 30.9 0.6 28.7 0.3 33.5 0.6 31.3 0.4 33.8 0.2 30.8 0.3 47.2 0.8 43.1 0.4 34.7 0.8 32.5 0.4 33.6 0.3 29.7 0.3
Difference 2.0 1.4 0.7 0.2 0.1 1.3 0.0 -0.9 -0.4 -1.2 -0.7
Difference -2.1 -1.8 -2.2 -2.7 -2.6 -2.6 -1.7 -4.3 -4.5 -2.5 -3.0
Difference -1.9 -1.0 -2.6 -3.3 -3.6 -2.2 -2.2 -3.0 -4.1 -2.2 -3.9
Table 2. Solution heat (kJ.mol-1) and standard deviations for of the surfactant mixtures.
Interaction Parameters of Surfactant Mixtures by Inverse Gas Chromatography
23
Activity coefficients at infinite dilution in terms of mole fraction were obtained by the following expression (Price et al., 2002):
ln i ln
273.15R Vg0 p10 M 2
p10 B11 V1 RT
(3)
where M2 stands for molar mass of surfactant, p10, V1 stands for vapour pressure and molar volume of pure solute. B11 is the second virial coefficient for solute–solute interactions. Patterson (Patterson et al., 1971) suggested using the weight fraction, w, in which case equation (3) may be replaced by expression: ln i ln
273.15 R Vg0 p10 M1
p10 B11 V1 RT
(4)
where M1 is the molar mass of the solute. The Flory-Huggins theory of non-athermal solutions gives:
1 ln a1 ln a1 comb. ln a1 noncomb. ln 1 1 i i2 r
(5)
where the volume fraction, , is defined in terms of the specific volumes. For the limiting case in which 1 tends to unity, using the equations (4) and (5), the probe solute-surfactant Flory-Huggins interaction parameter, 1i, can be calculated from the specific retention volumes, Vºg, by the expression (Conder & Young, 1978; Deshpande, et al., 1974): 273.15 Rv p0 B V V 11 1 i 1 1 1 Vg0 p10V1 RT Vi
1i ln
(6)
where vi stands for the specific volume of the surfactant experimentally measured in the laboratory. The vapour pressures were computed using Antoine equations and the coefficients were taken from Riddick, Bunger and Sakano (Riddick, et al., 1986). The solute densities at different temperatures were estimated from Dreisbach's compilation (Dreisbach, 1955). The second virial coefficient of the solutes was calculated by Tsonopoulos's correlation using critical constants tabulated in Reid et al. (Reid et al., 1986). When the stationary phase is a surfactant mixture, Equation (7) allows to determine the ternary probe solute (1)-surfactant (2)-surfactant (3) interaction parameter, 1(23), assuming an additive specific volume for the surfactant mixture, m=w2 2 + w3 3 where wi is the weight fraction of surfactant i in the mixture (Deshpande, et al., 1974).
24
Applications of Gas Chromatography
273.15 R w v w v p0 B V V V 2 2 3 3 1 2 1 1 3 1 1 1 11 0 0 RT V2 V3 Vg p1V1
1(23) ln
(7)
where i stands for the volume fraction for i component in the stationary phase. Vi is the molar volume of component i in the mixture. On the contrary, assuming the Scott-Tompa approximation (Tompa, 1956), which describes a ternary system as a simple balance of the corresponding binary systems it is possible to calculate the surfactant-surfactant interaction parameter, 23, by: V1 V2
2 12 3 13 23 23 1(23)
(8)
As it has been indicated by different authors, the polymer-polymer interaction parameter determined by IGC shows a clear dependence on the solvent used as a probe. In order to solve this problem, different methods have been proposed. The Farooque and Deshpande (Farooque, & Deshpande, 1992) and the Huang (Huang, 2003a, 2003b) methodologies will be applied to retention data obtained from the use of surfactant anhidrous mixtures in order to carry out a comparative analysis of the behaviour of these methodologies in the determination of surfactant-surfactant interaction parameters. Farooque and Deshpande (Farooque, & Deshpande, 1992) methodology gives a reliable true interaction parameter after a rearrangement of Eq. (8):
1(23) 13 13 2 12 V1 V1
23 V2
2 3
(9)
A plot of the left side of this expression versus the first term of the right-hand side yields a be lineal function from whose slope 2 can be calculated and from the intercept 23 can obtained. The physical meaning of the slope was interpreted in terms of an effective average column composition that the solutes are probing. Huang (Huang, 2003a, 2003b)et. al. have proposed an alternative rearrangement of Eq.( 8): 1(23)
V1
3 13 23 2 12 23 V 1 V2
(10)
A linear plot can be obtained from the left-hand side vs. first term of right-side of Eq.(10) allowing that the interaction parameter can be obtained. In both methodologies, if the conditions given by Al-Saigh and Munk (Al-Saigh & Munk, 1984) are obeyed, the surfactant-surfactant interaction parameter can be calculated through the specific retention volume without calculating the individual parameter. The values of the surfactant-surfactant interaction parameters can be analyzed as 23/V2 or as 23 when multiplied by V2, or as the equivalent quantity B23 = RT (23/V2) (in J.cm-3) called energy density.
Interaction Parameters of Surfactant Mixtures by Inverse Gas Chromatography
25
4. Results and discussion 4.1 Surfactants as stationary phases
In this chapter both DSC and IGC were used to confirm the stationary phase stability with temperature. The phase transition temperatures were determined with DSC on pure surfactants between 293 and 523 K. The same technique was also employed to analyze the thermal behaviour of both surfactants deposited over the solid support in a 10 % (w/w) percentage, approximately. Chow and Martire (Chow & Martire, 1971) compared IGC and DSC studies on two azoxy liquid crystals and reported no measurable adsorption effects from the interface above a film thickness of 100 nm. Witkiewicz (Rayss, J. et al., 1980) reported surface orientation effects up to depth of 2 nm, but in a later work reported constant specific retention volumes above a stationary phase loading of above 5% (Marciniak & Witkiewicz, 1981). Zhou et al. (Zhou, 1994) in the GC and IR study of liquid crystal deposited on different types of silica have shown that for a percentage under of 7 % of the stationary phase loading, the ln Vg vs 1/T plot did not show discontinuity. The loading used in this work was near of 10 % on Chromosorb W in all the cases. The retention diagram of ln Vg vs 1/T for solute probes in DODAB and DDAB coated on Chromosorb W, NAW, 60/80, is shown in Figure 1 (Bardavid, et al., 2007). For both surfactants, specific retention volumes were obtained between 303 K and 423 K. On heating the crystalline solid, the retention decreases until the crystalline solid-to-liquid crystal transition is reached. Then there is a large increase in retention, which once the system phase change finished, decreases with increasing temperature. For DDAB and DODAB changes in retention are observed at 343.1 K and 358.1 K respectively.
Fig. 1. The retention diagram for solute probes in DDAB (a) and DODAB (b) coated on Chromosorb W. Solutes: (●), toluene; (■), carbon tetrachloride; (▼), n-octane. DSC measurements of the phase transition temperature for DDAB y DODAB have been described in the literature (Schulz, et al., 1994, 1998). The experimental measurements for DDAB (Bardavid, et al., 2007), DSC analysis shows a temperature transition between the solid phase and liquid crystal mesophase through two peaks at 336.8 K and 349.2 K. These values were coincident with those obtained in bibliography (Schulz, et al., 1994). The first peak
26
Applications of Gas Chromatography
corresponds to the melting of hydrocarbon tails of DDAB and that at 349.2 K corresponds to the melting of the DDAB polar heads bilayer giving an anhydrous lamellar liquid crystal which in some circumstances (i.e., when lamellae are parallel to the slide surface) appears as pseudo-isotropic. There is another phase transition at 445.9 K that could be the transition to isotropic liquid. DSC values in the literature have been informed up to 445.9 K. DSC analysis for pure DODAB shows a phase transition at 361.8 K (Bardavid, et al., 2007). According to the literature (Schulz, et al., 1994) this transition corresponds to the melting of DODAB crystals to a liquid which was named a pseudoisotropic liquid (Schulz, et al., 1998). We have not detected in our thermogram the hydrocarbon tails transition temperature, perhaps because both transitions (i.e., the melting of the polar and the apolar layer) occur at almost the same temperature giving an overlapping of their peaks; but we have detected another transition temperature at 439.3 K that we considered as the transition from mesophase to isotropic liquid. The transitions for DDAB and DODAB in literature (Schulz, et al., 1994, 1998) were studied up to smaller temperatures than ours. DDAB and DODAB supported on Chromosorb W NAW show a slight displacement toward smaller temperatures with respect to pure surfactants. There is previous information about discrepancies in the results when liquid and supported samples are analyzed by DSC, with lower values of transition temperature for the last ones (Shillcock & Price, 2003). The systems DPC and CPB, either pure or mixed, are lamellar mesophases at the working temperature (Laughlin, 1990). The obtained results trough DSC in pure surfactant samples for the change from crystal phase to liquid crystal phase is one peak at 343.1 K and others two peaks at 436.1 K and 513.1 K for DPC (Bardavid, et al., 2011). In the case of CPB one peak is at 339.4 K and the other two at 421.7 K and 518.1 K ( Bardavid, et al., 2011). When the surfactants are deposited on chromatographic support (Chromosorb G, AW, 60/80) the values obtained through DSC for the phase changes are at
Temperature (K)
360
340
320
300
280 0 ,0
0 ,2
0 ,4
0 ,6
0 ,8
1 ,0
W e ig h t fra c tio n o f D P C (w 2 )
Fig. 2. Phase transition temperature for the surfactant mixtures DPC-CPB deposited on the solid support as function of the weight fraction of component 2 (DPC).
Interaction Parameters of Surfactant Mixtures by Inverse Gas Chromatography
27
339.1 K for DPC and at 335.9 K for CPB. In Figure 2 we have included the values of phase transition temperature for the surfactant mixtures deposited on the solid support as function of the weight fraction of component 2 (DPC) ( Bardavid, et al., 2011). When the studied system consists of DTAB and OTAB either pure or mixed, deposited on Chromosorb W, produced lamellar mesophases at work temperature (Laughlin, 1990). DSC experiments showed the phase changes from crystal to liquid crystal occurring at 372.5 K for DTAB and at 378.1 K for OTAB (Bardavid, et al., 2010). IGC measurements of the retentive behavior of n-octane and toluene between 338.1 and 423.1 K indicate (in the ln Vg vs. 1/T plot) retention changes at 368.1 K for DTAB and 373.1 K for OTAB. The anhydrous crystal to lamellar phase transition in pure dodecyltrimethylammonium chloride (DTAC) occurs at about 356.1 K (Blackmore & Tiddy, 1990). Taking into account the effect of changing the counterion, the agreement is good. The DSC technique is very accurate in determining the pure component properties and the IGC results can be used as supplement to the DSC results in the case of surfactant deposited on solid support. The values of transition temperatures obtained by IGC are always lower than those obtained by DSC, and even more when the very start detection method is used to obtain the transition temperature by means of gas chromatography (Benabdelghani, et al., 2006; Nastasovic & Onjia, 2008; Shillcock & Price, 2003). According to these results, it is possible to point out that both pure surfactants and their mixtures appear as a lamellar mesophase at the working temperature (388-403 K). Thus, we can infer that the probe solutes dissolve in a stationary phase formed by an ordered structure of lamellar mesophase. 4.2 Interaction parameter in mixtures
The systems studied, which are made up by cationic surfactants deposited on Chromosorb W or G, being either pure or mixed, appear as lamellar mesophase at work temperature (Laughlin, 1990) and their temperatures of transition phases have been determined by DSC and IGC. In two systems we have used Chromosorb W, 60/80, with a charge close to 10 % of stationary phase, and when Chromosorb G, 60/80 was used, the percentage of charge of stationary phase was close to 7 %. These values are considered to be adequate for this type of chromatographic support (Conder & Young, 1978; Nastasovic & Onjia, 2008). To ensure that the results were independent of sample size and flow rate and since measurements were being made at infinite dilution, the usual checks were made (Conder & Young, 1978). As shown by Etxabarren et al. (Etxabarren, et al., 2002), in polymeric materials the polymerprobe solute interaction parameters depend on the polymer molecular mass in intermediate concentration zones, and this dependence vanishes at very high concentration as in the case presented in IGC. These conclusions have lead us to analyze the behaviour in surfactant mixtures which present molecular mass that are much lower than those of the polymers with Tompa’s approximation (Tompa, 1956) to ternary systems in Flory Huggins’s theory. As pointed out in the introduction, the measurements made in liquid state through IGC allow the determination of thermodynamic properties (Deshpande, et al., 1974), especially of interaction parameters that play an important role in determining the miscibility of
28
Applications of Gas Chromatography
mixtures. The behaviour of surfactant mixtures has been determined by IGC allowing the experimental determination of surfactant-surfactant interaction parameters in systems with different characteristics (Bardavid, et al., 2007, 2010, 2011). Negative values of B23 are indicative of attractive interactions and hence higher miscibility. On the contrary, positive values of B23 would indicate repulsive interactions between the two polymers and they are related to immiscibility (Al-Saigh & Munk, 1984; Benabdelghani, et al., 2006; Deshpande, et al., 1974; DiPaola-Baranyi &. Degre, 1981; Etxeberria et al., 2000; Shi & Screiber, 1991). From a theoretical point of view, this parameter should be constant with the concentration. Nevertheless, it has frequently been found that its value changes with concentration (Etxeberria, et al., 1994). Through IGC (Bardavid, et al., 2007) we have studied the system DDAB (didodecyldimethyl ammonium bromide) and DODAB (dioctadecyldimethyl ammonium bromide), which are two twin tailed surfactants, the system DTAB (Dodecyltrimethyl ammonium bromide) and OTAB (Octadecyltrimethylammonium bromide) (Bardavid, et al., 2010) and the system DPC (Dodecylpyridinium chloride) and CPB (Hexadecylpyridinium bromide) (Bardavid, et al., 2011). The values of B23 obtained in the former were positive in all the range of concentration and at all temperatures. They were also indicative of high inmiscibility and they coincided with the behaviour of these surfactant mixtures in aqueous solutions (Feitosa, et al., 2006). This is not surprising because the structure of anhydrous lamellar liquid crystals formed by melting the crystals must fulfill the same conditions that lamellar mesophases formed in aqueous solutions, i.e., polar headgroups must be in polar layers and the chains in apolar bilayers. In the system DTAB and OTAB most of the values in B23 are negative for each studied temperature. Negative values of B23 suggest that the interaction between surfactants is more favourable as DTAB concentration increases. There are some precedents in aqueous solutions in which these surfactants form mixed micelles (Akisada, et al., 2007; Schulz, et al., 2006). In the system DPC and CPB all the B23 values are positive in the range of concentration and temperature studied. These values are lower than the B23 values obtained in the DDAB and DODAB system. To our knowledge, studies of mixtures DPC and CPB, neither pure nor aqueous solution, have not been carried out. In this mixture of surfactants deposited on a solid support, an ordering can be expected due to the fact that the polar head would be directed to a solid surface. There is some indication that the pyridinium head group may interact specifically with surface sites, most likely by hydrogen bonding (Fuerstenau & Jia, 2004). Thus it is expected that the repulsion between the counter ions and the -electron cloud on the pyridinium ring together with lower charge on nitrogen atom is responsible for high -value of such surfactants ( being the micelle ionization degree), higher than their trialkylammonium counter-parts (Bhat, et al., 2007). This would explain the difference in the behaviour in these systems. As usual, in polymer mixtures increasing the temperature the interactions become weaker; thus the values of B23 become more positive at higher temperatures (Benabdelghani, et al., 2006). A similar behaviour can be observed in the systems with the surfactants studied.
Interaction Parameters of Surfactant Mixtures by Inverse Gas Chromatography
29
4.3 Farooque-Deshpande and Huang methodology
Farooque and Deshpande (Farooque, & Deshpande, 1992) and Huang’s (Huang, 2003a, 2003b) methodologies have been shown to be effective and reliable to determine the interaction parameter 23 in polymers by IGC, since these parameters were questioned because of their dependence on the probe solutes used. We have applied the thermodynamic relations determined by IGC for polymer mixtures to anhydrous surfactant mixtures and have proved that the results obtained show a behaviour that is coherent among the systems studied. Similarly, we have proved that the results are coherent with some results obtained in aqueous solutions of cationic surfactants. It’s worth noting that the equations used in the measurement of B23 would be only valid for miscible mixtures, although they have been applied successfully to several systems that show immiscibility (Du, et al., 1999; Zhikuan, & Walsh, 1983). Benabdelghani et al. (Benabdelghani, et al., 2006) have carried out an analysis of both methodologies in a study of phase behaviour of poly(styrene-co-methacrylic acid)/poly(2,6-dimethyl-1,4-phenylene oxide) through IGC of polymer mixtures. They have concluded that both methods show similar interaction parameter values and that both can be considered as reliable to determine the true polymer mixture parameters. The possibility to count with experimental data in three binary systems of anhydrous surfactants, their molar volume and to devise a method to classify miscibility in mixtures has led us to apply both methodologies to surfactant mixtures. Besides, this allows us to prove if both methods can be used in these types of substances. In Table 3 we have included the values obtained from the intercept, its errors and the correlation coefficients with the lineal fitting of the data applied to the equations (9 and 10) using both methodologies for the system DDAB – DODAB. This system presents positive values of B23 that indicate the presence of immiscibility in this mixture. Several observations can be made on the obtained values. First, the interception values in this system (DDAB – DODAB), are nearly equal for both methodologies. Using Huang’s methodology the errors are the double or larger. The correlation coefficients of the lineal regression are excellent in Huang’s methodologies in contrast to Farooque y Deshpande’s (F-D) (Farooque, & Deshpande, 1992) which are good. These results are similar to those obtained from the comparison between both methods made by Benabdeghani et al. (Benabdelghani, et al., 2006) in the system Poly(styrene-comethacrylic acid) – Poly(2,6-dimethyl-1,4-phenylene oxide), which have led them to conclude that both methods are reliable to calculate interaction parameter values in polymer mixtures with miscible and immiscible regions. In Table 4 we have included the system DPC – CPB, which also presents positive values of B23 that indicate the presence of immiscibility in this mixture, where the situation is different. In general, the intercept values are lower using Huang’s method and errors are higher (five times or more) than those determined by F-D method. Something peculiar appears at a minor percentage of component 3 (CPB). At all temperatures the obtained intercept values are similar and the errors obtained by Huang are slightly higher.
30
Applications of Gas Chromatography
363.1 K w2(DDDAB) 0.1643 0.3281 0.5037 0.7325 Average 373.1 K w2 0.1643 0.3281 0.5037 0.7325 Average
Huang
F-D ord.104 18.64 19.98 18.34 17.06
ord.104 21.11 23.54 21.81 20.62
.105 1.28 2.05 4.90 4.51 3.18
r² 0.9779 0.9902 0.9796 0.9926
ord.104 18.91 19.61 17.30 15.04
F-D .105 2.95 3.11 3.83 4.63 3.63
r² 0.9260 0.9812 0.9900 0.9931
Huang ord.104 21.34 23.41 20.57 19.40
383.1 K w2 0.1643 0.3281 0.5037 0.7325 Average
ord.104 25.95 27.86 26.47 24.48
F-D .105 1.80 2.12 3.80 7.81 3.88
r² 0.9538 0.9908 0.9912 0.9801
Huang ord.104 27.17 28.30 25.27 25.68
393.1 K w2 0.1643 0.3281 0.5037 0.7325 Average
ord.104 32.59 33.76 33.36 30.96
F-D .105 4.31 3.41 4.21 6.12 4.51
r² 0.8580 0.9835 0.9906 0.9910
Huang ord.104 35.00 35.32 34.60 33.34
403.1 K w2 0.1643 0.3281 0.5037 0.7325 Average
ord.104 40.50 41.19 39.76 37.40
F-D .105 3.48 5.09 6.09 7.75 5.60
r² 0.8936 0.9684 0.9847 0.9886
Huang ord.104 42.28 42.45 40.44 39.43
.105 3.40 2.51 6.15 3.63 3.92
r² 0.9999 0.9999 0.9996 0.9998
.105 5.16 5.10 6.31 6.05 5.65
r² 0.9997 0.9997 0.9996 0.9996
.105 7.16 5.14 7.68 13.69 8.42
r² 0.9996 0.9998 0.9995 0.9981
.105 8.24 5.09 7.04 10.61 7.74
r² 0.9995 0.9998 0.9996 0.9990
.105 12.64 12.18 13.24 18.72 14.19
r² 0.9991 0.9991 0.9988 0.9974
Table 3. Intercepts (ord), standard deviations (), and correlation coefficients (r2) in the system DDDAB – DODAB.
31
Interaction Parameters of Surfactant Mixtures by Inverse Gas Chromatography
348.1 K w2(DPC) 0.1598 0.3461 0.5409 0.7590 Average
ord.104 9.41 8.48 8.66 12.07
F-D .105 3.46 3.84 4.85 3.81 4.08
r² 0.9846 0.9944 0.9958 0.9984
Huang ord.104 4.94 3.17 3.54 10.14
358.1 K w2 0.1598 0.3461 0.5409 0.7590 Average
ord.104 15.30 14.80 13.36 17.74
F-D .105 5.39 3.60 3.82 3.50 4.08
r² 0.9557 0.9950 0.9975 0.9986
Huang ord.104 12.34 8.76 7.14 16.50
368.1 K w2 0.1598 0.3461 0.5409 0.7590 Average
ord.104 18.28 18.51 16.67 21.93
F-D .105 3.91 2.99 3.84 2.86 3.40
r² 0.9846 0.9952 0.9976 0.9991
Huang ord.104 10.56 10.23 7.39 19.57
ord.104 20.50 21.42 18.90 23.85
F-D .105 7.51 4.81 4.78 1.81 4.73
r² 0.9676 0.9942 0.9974 0.9997
Huang ord.104 7.33 7.53 2.65 17.53
378.1 K 0.1598 0.3461 0.5409 0.7590 Average
.105 11.45 11.46 10.12 4.40 10.76
r² 0.9990 0.9990 0.9990 0.9999
.105 15.39 12.38 11.42 3.87 10.76
r² 0.9982 0.9989 0.9991 0.9999
.105 23.39 17.84 16.37 3.07 15.17
r² 0.9964 0.9979 0.9982 0.9999
.105 47.29 35.96 32.48 8.27 31.00
r² 0.9874 0.9925 0.9939 0.9995
Table 4. Intercepts (ord), standard deviations (), and correlation coefficients (r2) in the system DPC– CPB. In Huang’s method the correlation coefficients for all percentages and at all temperatures are greater than 0.999 and in the method F – D the value of these coefficients is between 0.95 and 0.999. In Table 5, the values obtained from the intercept, their error and correlation coefficients from the lineal fitting of the data for the system DTAB – OTAB are included. This system presents a partial miscibility in accordance with the values of B23 obtained by F – D, the intercept values determined by both methodologies present major differences between the systems studied; all the values determined by F - D are negative except for the first values at the last two temperatures.
32
388.1 K w2(DTAB) 0.1102 0.3652 0.5963 0.8331 Average 393.1 K w2 0.1102 0.3652 0.5963 0.8331 Average 398.1 K w2 0.1102 0.3652 0.5963 0.8331 Average
Applications of Gas Chromatography
ord.104 -6.31 -13.52 -15.20 -13.89
ord.104 -1.20 -9.62 -11.31 -9.98
ord.104 2.44 -5.77 -7.87 -5.97
F-D .105 43.51 43.27 41.07 45.15 43.25
r² 0.9763 0.9940 0.9745 0.9523
Huang ord.104 12.45 0.45 -2.81 -1.72
F-D .105 39.70 39.74 41.13 41.82 40.60
r² 0.9731 0.9948 0.9732 0.9632
Huang ord.104 18.84 5.79 2.66 3.31
r² 0.9716 0.9750 0.9705 0.9364
Huang ord.104 22.97 10.53 7.58 8.11
F-D .105 36.96 36.54 38.10 38.54 37.53
403.1 K 0.1102 0.3652 0.5963 0.8331 Average
5.89 -3.25 -5.28 -3.05
.105 33.96 34.79 35.94 37.07 35.44
r² 0.9548 0.9564 0.9632 0.9566
.105 80.74 79.42 82.05 81.04 80.81
r² 0.9548 0.9575 0.9549 0.9558
.105 81.64 79.58 82.38 82.71 81.58
r² 0.9536 0.9573 0.9544 0.9545
.105 82.02 82.77 86.20 88.26 84.81
r² 0.9534 0.9538 0.9506 0.9487
Huang
F-D ord.104
.105 81.23 80.88 74.23 80.22 79.14
r² 0.9674 0.9913 0.9414 0.9579
ord.104 26.53 14.29 10.89 12.12
Table 5. Intercepts (ord), standard deviations (), and correlation coefficients (r2) in the system DTAB-OTAB. In Huang’s methodology, the only negative intercept values correspond to those of the last two weight fractions at the first temperature, but in this methodology the values show incoherence at the different temperatures. The highest errors appear in Huang’s method (close to the double) and the correlation coefficients are good and similar in both methodologies (0.94 -0.99 in F-D and 0.94-0.96 in Huang). In all systems we can point out that the major errors correspond to Huang’s methodology, with a good correlation of the lineal regression in this method. This behaviour is similar to that obtained by Benabdelghani et al. (Benabdelghani, et al., 2006) in polymers, and as
Interaction Parameters of Surfactant Mixtures by Inverse Gas Chromatography
33
pointed out by these authors, this could be due to the fact that the experimental points fitted in Huang’s method are far from the intercept and its determination is subject to a major error. The enlargement of the values that correspond to the intercept in Huang’s methodology leads to the duplication of errors and to results that are less numerically stable in relation to F-D methodology. It is worth mentioning that besides the intrinsic errors of the chromatographic method in the determination of the parameter 23/V2 (obtained from a delicate balance between a ternary system (1(2,3)) and two binary systems (12 and 13)), there would be experimental errors of the method as pointed out by Etxeberria et al. (Etxeberria et al., 2000). One way of reducing the uncertainty in the values of B23 is an adequate selection of probe solvents. In this way, we have tried to cover all the possible chemical structures and polarities, avoiding the tests with similar retention among the retentive possibilities in this type of surfactant. We have included hydrocarbons in the probe solutes although they are not recommended for the experimental determination of polymer interaction parameters (Etxeberria et al., 2000). In Table 2, we have included values of solution enthalpies obtained of the retention time data vs. 1/T, their errors at a level of reliability of 95 % and the differences between the values of solution enthalpies for each of the systems studied. In general terms we can point out that the system DDAB – DODAB presents the slightest differences between Hºs, and the minor error among the systems studied. Besides, both stationary phases would show a major apolar character due to the major density of hydrocarbon chain. The other two systems present similar values of solution heat and the highest values in the component with a minor hydrocarbon chain. We have calculated the average errors in the solution heat of the systems studied, which are also included in Table 2. Thus, we can observe that the system DDAB – DODAB presents a minor average error in the solution heat of 0.81 %, the system DPC – CPB is intermediate with an average value of 1.01 % and the third system DTAB – OTAB presents a major value of 1.21 %. The third system presents the lower values of V0g among the systems we studied and the major experimental errors in this retention parameter. The percentage values of the errors in the system DTAB – OTAB are very different from those calculated in the other systems following the method F – D, and there is a large difference in the errors obtained from a retention time correlation as a function of 1/T. We have observed that in the results determined in the three systems by Huang’s methodology (Huang, 2003a, 2003b) the value of the slope shows that when the withdrawal from the unit is greater, the difference between the intercept values is bigger in both methodologies. In Table 6 we have included the values obtained from the differences between the intercept values determined by both methods in the systems studied and the slope calculated by Huang’s methodology for the first values of temperature. As it can be seen in Table 6, the highest values of the differences between intercept values are visible when the deviation of the slope from the unit is major. We have plotted the values of the differences between the ordinate values in the method F-D (Farooque, & Deshpande, 1992) and in Huang’s methodology (Huang, 2003a, 2003b) as a function of the
34
Applications of Gas Chromatography
slope determined by Huang’s method. Figure 3 shows that in the systems DDAB-DODAB and DPC-CPB, the dots rest on a straight line, with a major concentration of the values closeness to the unitary slope value. When the slope values are higher, the differences between both methods are greater. DDAB–DODAB system 363.1 K w2 0.1643 0.3281 0.5037 0.7325
Ord.104 F-D 18.64 19.98 18.34 17.06
348.1 K w2 0.1598 0.3461 0.5409 0.7590
F-D 9.41 8.48 8.66 12.07
388.1 K w2 0.1102 0.3652 0.5963 0.8331
F-D -4.31 -3.52 -15.20 -13.89
Huang Difference 18.91 -0.27 19.61 0.37 17.30 1.04 15.04 2.02 DPC-CPB system
Huang slope 1.000 1.006 1.013 1.023
Huang Difference 4.94 4.47 3.17 5.31 3.54 5.12 10.14 1.93 DTAB-OTAB system
Huang slope 1.037 1.045 1.044 1.018
Huang 12.45 0.45 -2.81 -1.72
Huang slope 0.8908 0.8903 0.8795 0.8563
Ord.104
Ord.104 Difference -16.76 -13.97 -12.39 -12.17
Table 6. Differences of the values between the intercept values determinate by both methodologies and the slope calculated by Huang’s methodology. The dots corresponding to the system DTAB-OTAB, are in a part of the graph opposite to the values found in the other two systems. In this system, it can be observed the higher differences between the ordinate values, the major errors in both methodologies; the errors in Huang’s method are twice as big as those found in F-D, the correlation coefficients are similar and the slopes in Huang’s method are minor than the unit. In general terms, we can point out that the F-D method is numerically more stable than Huang’s methodology in these systems. This would be due to the algebraic treatment of the departure expression. The higher values of the correlation coefficient in the regression are the result from the scale expansion in Huang’s methodology. As a conclusion, in these systems the results of the comparison between the methodologies are in agreement with what Benabdelghani et al. (Benabdelghani, et al., 2006) said. We also found that when the value of withdrawal of the slope from the unit in Huang’s method is higher, the values are less reliable and there are higher errors than in the method of F-D.
Interaction Parameters of Surfactant Mixtures by Inverse Gas Chromatography
35
Fig. 3. Differences between the ordinate values in the method F-D and in Huang’s methodology as a function of the slope determined by Huang’s method.
5. Conclusions The studied systems were different mixtures of anhydrous cationic surfactants, deposited on solid support, that has been used as stationary phases in IGC and the results were analyzed in term of mixtures miscibility. The determination of the thermodynamic miscibility was realized by the values of surfactant-surfactant interaction parameters obtained by the same method used in polymeric materials. The comparative use of two phenomenological methodologies allowed us to calculate the surfactant-surfactant interaction parameter in anhydrous cationic surfactant mixtures; the obtained results were similar to those obtained by Benabdelghaie et al. (Benabdelghani, et al., 2006) in polymeric materials.
36
Applications of Gas Chromatography
We also found that when the value of withdrawal of the slope from the unit in Huang’s method is higher, the values are less reliable and there are major errors than in the method of F-D.
6. Acknowledgments This work was sponsored by CIUNT (Consejo de Investigaciones de la Universidad Nacional de Tucumán) and partially by UNS. E.L.A. is a member of CONICET (Consejo Nacional de Investigaciones Científicas y Técnicas de la Republica Argentina).
7. References Abe, A. & Flory, P.J., (1978). Statistical thermodynamics of mixtures of rodlike particles. 2. Ternary systems. Macromolecules, 11, 1122-1126 Al-Saigh, Z. Y., & Munk, P., (1984). Study of polymer-polymer interaction coefficients in polymer blends using Inverse Gas Chromatography. Macromolecules, 17, 803809 Akisada, H. , Kuwahara, J., Koga, A., Motoyama, H. & Kaneda, H., (2007). Unusual behavior of CMC for binary mixtures of alkyltrimethylammonium bromides: Dependence on chain length difference. J. Colloid Interface Sci., 315, 678-684 Bardavid, S. M., Schulz, P. C. & Arancibia, E. L., (2003). Solubility parameter determination of cationic surfactant by Inverse GC. Chromatographia, 57, 529-532 Bardavid, S. M., Schulz, P. C. & Arancibia, E. L., (2007). IGC studies of binary cationic surfactant mixtures. J. Colloids Interface Sci., 316, 114-117 Bardavid, S. M., Schulz, P. C. & Arancibia, E. L., (2010). Miscibility of anhydrous cationic surfactant mixtures. J. Mol. Liquids, 156, 165-170 Bardavid, S.M., Schulz, P.C. & Arancibia, E.L., (2011). Interaction parameter of anhydrous cationic surfactant mixtures by IGC. Acepted in the J. Solution Chemistry (2011) Benabdelghani, Z., Etxeberria, A., Djadoun, S., Uruin, J. J. & Uriarte, C., (2006). The phase behaviour of poly(styrene-co-methacrylic acid)/poly(2,6-dimethyl-1,4-phenylene oxide) by Inverse Gas Chromatography. J. Chromatog. A, 1127, 237-245 Bhat, M. A., Dar, A. A., Amin, A., Rashid, P. I. & Rather, G. M., (2007). Temperature dependence of transport and equilibrium properties of alkylpyridinium surfactants in aqueous solutions. J. Chem. Thermodyn., 39, 1500–1507 Blackmore, E. S. & Tiddy, G. J. T. , (1990). Optical microscopy, multinuclear NMR (2H, 14N and 35Cl) and X-ray studies of dodecyl-and hexadecyl-trimethylammonium chloride/water mesophases. Liquid Crystals, 8, 131-151 Chow, L. C. & Martire, D. E., (1971). Thermodynamics of solutions with liquid crystal solvents. III. Molecular interpretation of solubility in nematogenic solvents. J. Phys. Chem., 75, 2005-2015 Conder, J. R. & Young, C. L., (1978) Physicochemical Measurement by Gas Chromatography, Wiley, New York Deshpande, D. D., Patterson, D., Screiber, H. P. & Su, C. S., (1974). Thermodynamic interactions in polymer Systems by Gas-Liquid-Chromatography. IV.
Interaction Parameters of Surfactant Mixtures by Inverse Gas Chromatography
37
Interactions between components in a mixed stationary phase. Macromolecules, 7, 530- 535. DiPaola-Baranyi, G. & Degre, P., (1981). Thermodynamic characterization of polystyrenepoly(butyl methacrylate) blends. Macromolecules, 14, 1456-1460. Dreisbach, R. R., (1955) Advances Chemistry Series, publishing by A.C.S. Du, Q., Chen, W. & Munk P., (1999). Inverse Gas Chromatography. 8. Apparent probe dependence of 23’ for a poly(vinil chloride)-poly(tetramethylene glycol) blend. Macromolecules, 32, 1514-1518 El-Hibri, M. J., Cheng, W., & Munk, P., (1988). Inverse Gas chromatography. 6. Thermodynamics of poly(-caprolactone)-polyepichlorohydrin blends. Macromolecules, 21, 3458-3463 Etxabarren, C., Iriarte, M., Uriarte, C., Etxeberria, A. & Iruin, J. J., (2002). Polymer-solvent interaction parameters in polymer solutions at high polymer concentrations. J. Chromatogr. A, 969, 245-254 Etxeberria, A., Uriarte, C., Fernandez-Berridi, M.J. & Uruin, J.J., (1994). Probing polymerpolymer interaction parameters in miscible blends by Inverse Gas Chromatography: Solvent effects. Macromolecules, 27, 1245-1248 Etxeberria, A., Iriarte, M., Uriarte, C., & Iruin, J. J., (1995). Lattice Fluid Theory and Inverse Gas Chromatography in the analysis of polymer-polymer interactions. Macromolecules, 28, 7188-7195 Etxeberria, A., Etxabarren, C. & Iruin, J. J., (2000). Comparison between static (sorption) and dynamic (IGC) methods in the determination of interaction parameters in polymer/polymer blends. Macromolecules, 33, 9115-9121 Farooque, A. M. & Deshpande, D. D., (1992). Studies of polystyrene-polybutadiene blend system by inverse gas chromatography. Polymer, 33, 5005-5018. Feitosa, E., Alves, F. R., Niemiec, A., Real Oliveira, M. E.C. D., Castanheira, E. M. S. & Baptista, A. L. F., (2006). Cationic liposomes in mixed didodecyldimethylammonium bromide and dioctadecyldimethylammonium bromide aqueous dispersions studied by Differential Scanning Calorimetry, Nile Red Fluorescence, and Turbidity. Langmuir, 22, 3579-3585 Flory, P. J., (1953) Principles of Polymer Chemistry, Cornell University Press, Ithaca (NY) Flory, P. J., (1956). Statistical thermodynamics of semi-flexible chain molecules. Proc. R. Soc., Lond. A, 234, 60-73 Flory, P. J. & Abe, A., (1978). Statistical thermodynamics of mixtures of rodlike particles. 1. Theory for polydisperse systems. Macromolecules, 11, 1119-1122 Flory, P. J., (1984). Molecular theory of liquid crystals. Liquid Crystal Polymers I. Advances in Polymer Science, 59, 1-36 Fuerstenau, D. W. & Jia, R., (2004). The adsorption of alkylpyridinium chlorides and their effect on the interfacial behavior of quartz. Colloids and Surfaces A: Physicochem. Eng. Aspects, 250, 223–231 Holland, P. M. & Rubingh, D. N., (1990) In Cationic Surfactants; Holland, P. M. & Rubingh, D. N. , Eds.; Surfactant Science Series; Marcel Dekker, New York, Vol. 37
38
Applications of Gas Chromatography
Huang, J. C., (2003a). Analysis of the thermodynamic compatibility of poly(vinyl chloride) and nitrile rubbers from Inverse Gas Chromatography. J. Appl. Polym. Sci., 89, 12421249 Huang, J. C., (2003b). Determination of polymer-polymer interaction parameters using Inverse Gas Chromatography. J. Appl. Polym. Sci., 90, 671-680 Huang, J. C., Coca, J. & Langer, S. H., (2007). Liquid crystal solutions at infinite dilution: Solute phase transfer free energy and solubility parameter variations at phase conversion temperatures. Fluid Phase Equilib., 253, 42-47 Janini, G. M., Johnston, K. & Zielinski, W. L. Jr., ( 1975). Use of a nematic liquid crystal for gas- liquid chromatographic separation of polyaromatic hydrocarbons. Anal. Chem., 47, 670- 674 Janini, G. M., Manning, W. B., Zielinski, W. L. Jr.& Muschik, M., (1980). Gas-liquid chromatographic separation of bile acids and steroids on a nematic liquid crystal. J. Chromatogr., 193, 444-450 Laughlin, R. G., (1990). Cationic Surfactants, Physical Chemistry, Ed. Rubingh, D. N. & Holland, P. M., Marcel Dekker, New York Laughlin, R., (1994). The aqueous phase behaviour of surfactants, Academic Press Inc., San Diego, CA Lezcano, E. G., Prolongo, M. G. & Salom Coil, C., (1995). Characterization of the interactions in the poly(4-hydroxystyrene)/poly(s-caprolactone) system by Inverse Gas Chromatography. Polymer, 36, 565-573 Marciniak, W. & Witkiewicz, Z., (1981). Effect of the amount of liquid crystal and type of support on some properties of the liquid crystalline stationary phase-support system. J. Chromatogr. , 207, 333-343 Marquartd, D. W., (1963). An Algorithm for Least-Squares Estimation of Nonlinear Parameters. SIAM Journal on Applied Mathematics 11 (2) 431–441 Martire, D. E., Blasco, P. A., Carone, P. E., Chow, L. C.& Vicini, H., (1968). Thermodynamics of solutions with liquid-crystal solvents. I. A Gas-Liquid Chromatographic study of cholesteryl myristate. J. Phys. Chem., 72, 3489-3495 Nastasovic, A. B. & Onjia, A. E., (2008). Determination of glass temperature of polymers by Inverse Gas Chromatography. J. Chromatog. A, 1195, 1-15 Patterson, D., Tewari, Y.B. , Schreiber, H.B. & Guillet, J.E., (1971). Application of Gas-Liquid Chromatography to the thermodynamics of Polymer Solutions. Macromolecules , 4, 356-359 Price, G. J., Hickling, S. J. & Shillcock, I. M., (2002). Applications of Inverse gas Chromatography in the study of liquid crystalline stationary phases. J. Chormatogr. A, 969, 193-205 Prolongo, M. G., Masegosa, R. M. & Horta, A., (1989). Polymer-polymer interaction parameter in the presence of a solvent. Macromolecules, 22 4346-4351 Proverbio, Z. E., Bardavid, S. M., Arancibia, E. L. & Schulz, P. C., (2003). Hydrophilelipophile balance and solubility parameter of cationic surfactants. Colloids and Surf. A, Physicochem. Eng. Aspects, 214, 167-171
Interaction Parameters of Surfactant Mixtures by Inverse Gas Chromatography
39
Rayss, J., Witkiewicz, Z. , Waksmundzki, A. & Dabrowski, R., (1980). Effect of the support surface on the structure of the film of liquid crystalline stationary phase. J. Chromatgr. A., 188, 107-113 Reid, R. C., Prausnitz, J. M. & Poling, B. E., (1986). The properties of Gases and Liquids, 4th Ed., McGraw-Hill, New York Riddick, A. R., Bunger, W. B. & Sakano, T. K., (1986). Organic Solvents. Techniques of Chemistry, 4th Ed., Wiley-Interscience, New York Romannsky, M. & Guillet, J. E., ( 1994). The use of Inverse Gas Chromatography to study liquid crystalline polymers. Polymer, 35, 584-589 Romannsky, M. , Smith, P. F., Guillet, J. E. & Griffin, A. C., (1994). Solvent interactions with an insoluble liquid-crystalline polyester. Macromolecules, 27, 6297-6300 Schaefer, C. R. de, Ruiz Holgado, M. E. F. de & Arancibia, E. L., (2008). Effective solubility parameters of sucrose monoester surfactants obtained by Inverse Gas Chromatography. Fluid Phase Equilib., 272, 53-59 Shi, Z. H. & Screiber, H. P., (1991). On the application of Inverse Gas Chromatography to interactions in mixed stationary phases. Macromolecules, 24, 3522-3527 Shillcock, L. M. & Price, G. J. , (2003). Inverse Gas Chromatography study of poly(dimethyl siloxane)-liquid crystal mixtures. Polymer, 44, 1027-1034 Shillcock, L. M. & Price, G. J. , (2004). Interactions of solvents with low molar mass and side chain polymer Liquid Crystals measured by Inverse Gas Chromatography. J. Phys. Chem. B, 108, 16405- 16414 Schulz, P. C. , Puig, J. E. , Barreiro, G. & Torres, L. A. ( 1994) . Thermal transitions in surfactant- based lyotropic liquid crystals. Thermochimica Acta 231, 239-256 Schulz, P.C., Abrameto, M., Puig, J.E., Soltero-Martínez, F.A. & González-Alvarez, A., (1996). Phase Behavior of the Systems n-Decanephosphonic Acid - Water and nDodecanephosphonic Acid- Water. Langmuir, 12, 3082-3088 Schulz, P. C. , Rodriguez, J. L., Soltero-Martinez, A. Puig, J. E. & Proverbio, Z. E., (1998). Phase behaviour of the dioctadecyldimethylammonium bromide-water system. J. Thermal Anal., 51, 49-62 Schulz, P. C., Rodríguez, J. L., Minardi, R. M., Sierra, M. B. & Morini, M. A., (2006). Are the mixtures of homologous surfactants ideal? J. Colloid & Interface Sci., 303, 264271 Tompa, H., (1956). Polymer Solutions, Butterworths, London Varade, D., Aramaki, K. & Stubenrauch, C., (2008). Phase diagrams of water– alkyltrimethylammonium bromide systems. Colloids Surf. A: Physicochem. Eng. Aspects, 315, 205-209 Voelkel, A., Strzemiecka, B., Adamska, K. & Milczewska, K., (2009). Inverse Gas Chromatography as a source of physicochemical data. J. Chromatogr. A, 1216, 15511566 Zhao, L. & Choi, P., (2001). Determination of solvent-independent polymer-polymer interaction parameter by an improved Inverse Gas Chromatographic approach. Polymer, 42, 1075-1081 Zhikuan, C. & Walsh, D. J., (1983). Inverse Gas Chromatography for the study of one phase and two phase polymer mixtures. Eur. Polym. J., 19, 519- 524
40
Applications of Gas Chromatography
Zhou, Y. W. , Jaroniec, M., Hann, G. L. & Gilpin, R. K., (1994). Gas Chromatographic and Infrared studies of 4’-cyano-4-biphenyl 4-(4-pentenyloxy)benzoate coated on porous silica. Anal. Chem., 66, 1454- 1458
3 Applications of Chromatography Hyphenated Techniques in the Field of Lignin Pyrolysis Shubin Wu, Gaojin Lv and Rui Lou South China University of Technology, China
1. Introduction Due to the urgency of the current world energy supply-and-demand situation, the need for clean sources of energy is receiving an increasing attention. In the framework of a future sustainable development, biomass is one of the most often considered sources of renewable energy (Bridgewater et al., 1999). There are many ways of converting biomass into useful products and energy, such as direct combustion processes, thermochemical processes, biochemical processes, and agrochemical processes etc. Of these, pyrolysis forms the focus of this study (Bridgewater, 2004; Mohan et al., 2006). The pyrolysis of lignocellulose is very complex, primarily due to the inherent complexity of the substrate, which changes continuously both chemically and structurally throughout the decomposition process (Hosoya et al., 2007; Lv et al., 2010a). The chemical structure and major organic components in biomass are extremely important in biomass pyrolysis processes. Knowledge of the pyrolysis characteristics of the three main components is the basis and thus essentially important for a better understanding of biomass thermal chemical conversion. Lignin is one of the main components of woody biomass, and the worldwide production of technical lignins as a by-product from chemical pulping processes stands at approximately 50 million t/yr (Harumi et al., 2010). However, it is merely used as fuel to recover energy in conventional pulping industry. Only recently, with the upcoming focus on biorefineries, lignin has gained new interest as chemical resources. Analytical pyrolysis is a well-known technique to analyse lignin pyrolysis and various authors published different analytical methods to determine decomposition characteristics of lignin. Many researchers presented that the pyrolysis of lignin primarily occurred in a wide temperature range (200-600oC) by means of thermogravimetric analysis method (Domínguez et al., 2008; Lv et al., 2010b). Some researchers (Liu et al., 2008; Wang et al., 2009) also compared the pyrolysis behavior of lignin from different tree species using thermogravimetry–Fourier transform infrared spectroscopy (TG–FTIR). Pyrolysis–gas chromatography/mass spectrometry (Py-GC/MS), which is an advanced pyrolysis methods combined with hyphenated separation and detection systems (i.e. GC-MS), is often used for studying degradation mechanisms of lignin because of its strong ability to identify the pyrolysis products (Atika et al., 2007; Windt et al., 2009).
42
Applications of Gas Chromatography
On lignin pyrolysis, their product analysis, and further deriving the cracking mechanism, many researchers have done considerable works. For example, Baumlin et al. (2006) have reported the results of experiments performed on the flash pyrolysis of two types of lignins, i.e. kraft lignin and organocell lignin, to produce hydrogen. Nowakowskia et al. (2010) presented an international study of fast pyrolysis of lignin. Jegers and Klein (1985) had reported that various catechol (1,2-dihydroxybenzene), o-cresol (2-methylphenol) and other phenols products go along with the formation of guaiacols during the course of lignin pyrolysis, the yields of those products are different corresponding to the different kinds of lignin and pyrolysis conditions. According to Britt et al. (1995), lignin pyrolysis occurred mainly by a free-radical reaction mechanism. The relative distribution of products is dependent on pyrolysis conditions, such as sources of raw materials, pyrolysis temperature, heating rate, pyrolysis atmosphere, and catalyst etc. (Garcia et al., 2008). To sum up, there have already emerged lots of studies about lignin pyrolysis, and their focus and concerns were also varied. But so far, to our knowledge, limited information is available in the literature concerning the product generation and distribution regularities of lignin pyrolysis under the influence of parameters like temperatures and catalysts. Therefore, the objectives of this work were to attempt to carry out fast pyrolysis of several lignin samples (one enzymatic/mild acidolysis lignin and two technical lignins were used) and analyse the products by Py-GC/MS, in order to firstly establish the potential of this method for lignin processing and secondly to investigate the effects of temperature and catalysts on lignin pyrolysis.
2. Hyphenated techniques In the case of samples originating in the real world, each of the techniques has a place, and often several must be used in order to obtain a complete overview of the nature of the sample. The use of multiple techniques and instruments, which allow more than one analysis to be performed on the same sample at the same time, provide powerful methods for analyzing complex samples (Kealey & Haines, 2002). If the instruments are combined so that the analyses are done essentially at the same time, this is called a simultaneous approach and is often written with a hyphen, so that they may be referred to as hyphenated techniques, for example gas chromatography-mass spectrometry (GC-MS) and gas chromatographyinfrared spectrometry (GC-IR). By using many techniques in combinations, the advantages to the analyst in the additional information, time saving and sample throughput are considerable. 2.1 Gas Chromatography-Mass Spectrometry (GC-MS) The use of chromatographic techniques to separate mixtures is one of the most important analytical tools. The separated components may then be identified by other techniques. Mass spectrometry is the most important of these. 2.1.1 Separation Gas chromatography, is a common type of chromatography used in analytic chemistry for separating and analyzing compounds that can be vaporized without decomposition. Typical
Applications of Chromatography Hyphenated Techniques in the Field of Lignin Pyrolysis
43
uses of GC include testing the purity of a particular substance, or separating the different components of a complex mixture, such as bio oil. When used to prepare pure compounds from a mixture, GC can separate the volatile components of mixtures by differential migration through a column containing a liquid or solid stationary phase (Fu, 2008). Solutes are transported through the column by a gaseous mobile phase and are detected as they are eluted. Solutes are generally eluted in order of increasing boiling point, except where there are specific interactions with the stationary phase. An elevated temperature, usually in the range 50-350oC, is normally employed to ensure that the solutes have adequate volatility and are therefore eluted reasonably quickly. 2.1.2 Identification Mass spectrometry (MS) is an analytical technique in which gaseous ions formed from the molecules or atoms of a sample are separated in space or time and detected according to their mass-to-charge ratio, m/z (Sparkman, 2000). It is usually used for determining masses of particles, for determining the elemental composition of a sample or molecule, and for elucidating the chemical structures of molecules, such as phenols, aldehydes, and other chemical compounds. The MS principle consists of ionizing chemical compounds to generate charged molecules or molecule fragments and measuring their mass-to-charge ratios. The numbers of ions of each mass detected constitute a mass spectrum. The spectrum provides structural information and often an accurate relative molecular mass from which an unknown compound can be identified or a structure confirmed. 2.1.3 Combination Gas chromatography-mass spectrometry (GC-MS) is a common combined technique, comprising a gas chromatograph (GC) coupled to a mass spectrometer (MS), by which complex mixtures of chemicals may be separated, identified and quantified. A schematic diagram of a GC-MS is shown in Fig. 1. In this technique, a gas chromatograph is used to separate different compounds. This stream of separated compounds is fed online into the ion source, a metallic filament to which voltage is applied. This filament emits electrons which ionize the compounds. The ions can then further fragment, yielding predictable patterns. Intact ions and fragments pass into the mass spectrometer's analyzer and are eventually detected (Adams, 2007; Lee & Eugene, 2004). This makes it becoming an ideal tool of choice for the analysis of the hundreds of relatively low molecular weight compounds found in biomass pyrolysis liquid products (bio oil). In order to make a compound be analysed by GC-MS, it must be sufficiently volatile and thermally stable. In addition, functionalised compounds may require chemical modification (derivatization) prior to analysis, to eliminate undesirable adsorption effects that would otherwise affect the quality of the data obtained (Wu, 2005). Bio oil samples are usually needed to be solvent extracted, and dehydrated before GC-MS analysis. The prepared sample solution is injected into the GC inlet where it is vaporized and swept into a chromatographic column by the carrier gas. The sample flows through the column and the compounds comprising the mixture of interest are separated by virtue of their
44
Applications of Gas Chromatography
Fig. 1. Schematic of a GC-MS system relative interaction with the coating of the column (stationary phase) and the carrier gas (mobile phase). The latter part of the column passes through a heated transfer line and ends at the entrance to ion source (Fig. 1) where compounds eluting from the column are converted to ions. Then the ions are separated in a mass analyser (filter). After that, the ions enter a detector the output from which is amplified to boost the signal. The detector sends information to a computer that records all of the data produced, converts the electrical impulses into visual displays and hard copy displays. In addition, the computer also controls the operation of the GC-MS system. 2.2 Pyrolysis-Gas Chromatography/Mass Spectrometry (Py-GC/MS) Pyrolysis-gas chromatography/mass spectrometry (Py-GC/MS), which extends the combination to include three distinct techniques, is an instrumental method that enables a reproducible characterisation of the intractable and involatile macromolecular complexes found in virtually all materials in the natural environment (Bull, 2005). It differs from GCMS in the type of sample analysed and the method by which it is introduced to the GC-MS system. Instead of the direct injection of a highly refined organic solution, a few amount (usually TBAB> TOAB> BTEAB > QSO3. TEAB and QSO3 (4-(trialkylammonium) propansultan), which are more hydrophilic, do not possess high reactivity. THAB, TBAB and TOAB of appropriate hydrophilic and hydrophobic properties exhibit high reactivity to obtain high conversion of 1-bromobutane. Further, it is favorable for the reaction in choosing quaternary ammonium salts of larger carbon numbers. The reason is that the lipophilicity is strong using the quaternary ammonium salts of larger carbon number(Wang & Rajendran, 2007b, 2007c; Wang & Chen, 2008).
Fig. 4. A plot of -ln(1-X) of 1-bromobutane vs. time with different quaternary ammonium salts; 4 mmol of 1-bromobutane, 6 mmol of phthalimide potassium salt, 50 ml of acetonitrile, 0.7 mmol of PTC, 0.5 g of toluene (internal standard), 800 rpm, 70 0C. (Reprinted with permission from Wang, et al., 2005. Copyright (2011) Elsevier).
92
Applications of Gas Chromatography
2.2 O-alkylation In this work, ultrasonic irradiation assisted synthesis of dimethoxydiphenylmethane (DMODPM) from the reaction of methanol and dichlorodiphenylmethane (DCDPM) was successfully carried out in a liquid-liquid phase-transfer catalytic (LLPTC) reaction (Scheme 3) (Wang & Chen, 2009). Hydrolysis of the ketal product in acidic solution is avoided by carrying out the reaction in a basic solution. Two major advantages of carrying out the reaction under PTC conditions are i) it enhances the reaction and increases the yield and ii) also minimizes the by products. Cl
H3CO OCH 3
Cl 2CH3OH
4
5
2KOH
PTC Ultrasound Irr.
2KCl
2H2O
6
Scheme 3. Synthesis of DMODPM under LLPTC conditions(Wang & Chen, 2009). The effects of the reaction conditions on the conversion of DCDPM, as well as the apparent rate constant (kapp,1) of the first reaction in the organic-phase solution, were investigated in detail. The product DMODPM and the reactants (DCDPM and ethanol) were all identified by GC-MS and NMR and IR spectroscopies. The GC mass spectrum of 6 showed a peak at
Fig. 5. GC-MS chromatogram of dimethoxydiphenylmethane(6).
Recent Strategies in Organic Reactions Catalyzed by Phase Transfer Catalysts and Analyzed by Gas Chromatography
93
m/z 228 (M+) (Fig.5) Their concentrations (or contents) were analyzed by GC with GC17A model instrument (Shimadzu). The stationary phase was 100% poly(dimethylsiloxane). The carrier gas was N2 (30 mL/min). The column was db-1 type. 2.2.1 Reaction mechanism and kinetic model We believe that methanol first dissolves and reacts with KOH to produce potassium methoxide (CH3OK or MeOK) in the aqueous solution. Then, CH3OK further reacts with TBAB catalyst (QBr) to form tetrabutylammonium methanoxide (MeOQ or QOR), which is an active organic-soluble intermediate. This active intermediate (MeOQ) then reacts with DCDPM through two sequential reaction steps in the organic phase to produce the desired product, dimethoxydiphenylmethane (DMODPM). The reaction mechanism of the overall reaction is expressed in Scheme 4.
Aqueous Phase
2ROH + 2KOH 2QX + 2ROK Interface
Organic Phase
QX + CMODPM
k1
QX + DMODPM
k2
2ROK +
2H2O
2ROK +
2KX
QOR + DCDPM QOR + CODPM
Scheme 4. Mechanism of DMODPM synthesis under LLPTC conditions. where ROH, ROK, and QOR represent methanol, potassium methoxide, and tetrabutylammonium methanoxide, respectively; CMODPM and DMODPM are the monochloro-substituted (chloromethoxydiphenylmethane) and dichloro-substituted (dimethoxydiphenylmethane) products, respectively; and QX is the quaternary ammonium salt, where X can be either chloride or bromide. k1 and k2 are the two intrinsic rate constants of the organic-phase reactions. For a two-phase phase-transfer catalytic reaction, the rate is usually determined by four steps, i.e., (a) the ionic aqueous-phase reaction, (b) the organic-phase reaction, (c) the mass transfer of species QOR (active intermediate) from the aqueous phase to the organic phase, and (d) the mass transfer of species of the regenerated catalyst QBr from the organic phase to the aqueous phase. The mass transfers of species from the aqueous phase to the organic phase and vice versa are all fast. The ionic aqueous-phase reaction is also very fast. Therefore, it is obvious that the organic-phase reaction, which is usually slow, is the rate-determining step. The ionic reaction in aqueous solution is fast. Also, MeOQ formed from the reaction of potassium methoxide and tetrabutylammonium bromide (TBAB) is an organic-soluble compound. The transfer of MeOQ from the aqueous phase to the organic phase is also fast. Therefore, the two sequential reactions in the organic phase are the rate-determining steps for the whole reaction. From the GC spectrum of the reaction samples, only DMODPM product was observed and no CMODPM was observed. This fact indicates that the second reaction is faster than the first one. Following the Bodenstein steady-state assumption, the production rate of CMODPM equals the consumption rate of CMODPM in the reaction solution. Once CMODPM is produced, it reacts with QOR very quickly to produce the final product DMODPM in the second reaction of the organic phase. Thus, the first reaction in the
94
Applications of Gas Chromatography
organic phase is the rate-determining step. Also, CMODPM was not observed. Thus, the rate of the change of CMODPM with respect to time was set to be zero, as shown in Eq 16. Consequently, the first reaction in the organic phase is the rate-determining step. Thus, we have d CMODPM org dt
0
(16)
where the subscript “org” denotes the species in the organic solution. The material balances for DCDPM, CMODPM, and DMODPM in the organic-phase solution are
d DCDPM org
d CMODPM org dt
dt
k1 DCDPM org QOR org
k1 DCDPM org QOR org k2 [CMODPM ]org [QOR ]org
d DMODPM org dt
(17) (18)
k2 QOR org CMODPM org
(19)
k1 k2 DCDPM org k2
(20)
Combining eqs. (16) and (18) results in,
CMODPM org From eqs. (17), (19) and (20), we get
d DCDPM org dt
d DMODPM org dt
(21)
This result indicates that the consumption rate of DCDPM equals the production rate DMODPM in the organic phase. No other byproducts were observed during or after the reaction. Therefore, by integrating the equation after combining Eqs 17, 20, and 21, we have ln(1 X ) k appt
(22)
where kapp,1 is the apparent rate constant and X is the conversion of DCDPM, i.e. X
DMODPM org DCDPM org ,i DCDPM org DCDPM org ,i DCDPM org ,i k
app ,1
k1 QOR org
(23) (24)
where the subscript i represents the initial conditions of the species. The rate at which the reactant DCDPM is consumed can be calculated from Eq 17 and the rate at which the final product DMODPM is produced can be calculated from Eq 19. By applying the pseudosteady-state approach, the rate of the final product (DCDPM ) can be calculated from Eq 17. As shown in Eq 22, it is obvious that the reaction follows a pseudo-first-order rate law. The kapp,1 values were obtained by plotting the experimental data for -ln(1 - X) vs. time (t). Thus,
Recent Strategies in Organic Reactions Catalyzed by Phase Transfer Catalysts and Analyzed by Gas Chromatography
95
the reaction rate was calculated from Eq 17. Unexpected products were noticed in the absence of KOH and phase-transfer catalyst. However on the addition of KOH and PTC, DMODPM product was obtained in a small quantity. Therefore to enhance the reaction rate greatly, ultrasonic irradiation was employed in the reaction. The kinetics results obtained based on GC analysis (Fig. 6) under various conditions is discussed in the following sections.
Fig. 6. GC analysis (temperature programming) condition for following O-alkylation 2.2.2 Effect of ultrasonic power and frequency To ascertain the influence of various ultrasonic frequencies on the rate of the two phase reaction of DCDPM and methanol with same output power of 300 W, the ultrasonic frequency was varied in the range of 20-50 kHz under otherwise similar conditions using TBAB as the catalyst. The kinetic profile of the reaction is obtained by plotting -ln(1 - X) versus time (Fig. 7). From these observed results, it can be inferred that ultrasonic assisted phase-transfer catalysis significantly increases the rate of the reaction.
96
Applications of Gas Chromatography
Fig. 7. Effect of the ultrasonic frequency on the conversion of DCDPM. Conditions: 0.228 g of TBAB, 90 mmol of methanol, 2.75 mmol of DCDPM, 40 mL of chlorobenzene, 5 g of KOH, 10 mL of water, 0.1 g of toluene, 400 rpm, 60 °C 300 W. (Reprinted with permission from Wang & Chen, 2009. Copyright (2011) American Chemical Society) Without the application of ultrasonic power to the reaction solution, the conversion of DCDPM is low. The reaction follows a pseudo-first-order rate law, and the conversion is increased with higher ultrasonic frequency, indicating that ultrasonic waves enhance the nucleophilic substitution. The chemical effects of the ultrasound can be attributed to intense local conditions generated by cavitational bubble dynamics, i.e., the nucleation, formation, disappearance, and coalescence of vapor or gas bubbles in the ultrasonic field. However, in the phase-transfer catalytic reaction, rate enhancements are typically due to mechanical effects, mainly through an enhancement of mass transfer. The use of sonication techniques for chemical synthesis has also attracted considerable interest in recent years, because they can enhance the selectivity and reactivity, increase the chemical yields, and shorten the reaction time. In addition, there is no decomposition of phase-transfer catalysts under the experimental conditions. In this work, we found that the kapp,1 values with ultrasonic conditions (unconventional method) under the present experimental conditions are higher than those of the silent conditions (conventional method) (Wang & Rajendran, 2006; Wang &
Recent Strategies in Organic Reactions Catalyzed by Phase Transfer Catalysts and Analyzed by Gas Chromatography
97
Rajendran, 2007b, 2007c; Wang and Chen, 2010; Vivekanand & Wang, 2011). Similar increase in rate constant values was observed on varying ultrasonic power (Fig. 8). The corresponding kapp,1 values are shown in Table 2.
Fig. 8. Effect of the ultrasonic power on the conversion of DCDPM. Conditions: 0.228 g of TBAB, 90 mmol of methanol, 2.75 mmol of DCDPM, 40 mL of chlorobenzene, 5 g of KOH, 10 mL of water, 0.1 g of toluene, 400 rpm, 60 °C, 40 kHz. (Reprinted with permission from Wang & Chen, 2009. Copyright (2011) Ultrasonic Power (W)
100
200
300
400
500
600
kapp (×103, min-1)
4.0
7.1
10.3
12.4
14.2
15.2
a- Gas chromatographic analysis
Table 2. Effect of ultrasonic power on the apparent rate constants (kapp,1) for the phasetransfer catalytic reaction of MeOH and DCDPMa 2.3 C-alkylation Recently, the kinetics of monoalkylation of benzyl cyanide with n-bromopropane (BP) has been studied under phase transfer catalysis (PTC) conditions using aqueous potassium hydroxide as the base and tetrabutylammonium bromide as phase transfer reagent under
98
Applications of Gas Chromatography
ultrasonic condition (Vivekanand & Wang, 2011) (Scheme 5). Gas chromatography analyzed reaction was carried out at 50 0C under pseudo-first-order conditions by employing nbromopropane as a limiting reactant and benzyl cyanide as a excess agent (Fig. 9).
Fig. 9. GC Chromatogram of C-alkylation of benzyl cyanide. A:1-bromopropane (Retention time = 2.15 min.); IS:Toluene (Retention time = 4.40 min.); B:Chlorobenzene (Retention time = 6.19 min.); C:Benzylcyanide (Retention time = 12.52 min.); Product: 2-Phenylvaleronitrile (Retention time = 14.35 min.).
Recent Strategies in Organic Reactions Catalyzed by Phase Transfer Catalysts and Analyzed by Gas Chromatography
PhCH2CN 7
99
KOH / PTC C3H7Br PhCH(C3H7)CN o 50 C/Ultrasound 9 8
Scheme 5. Alkylation of benzyl cyanide under PTC assisted ultrasonic condition. The kinetic results indicates a material balance between reactant and products, i.e., the consumption of the amount of reactant (BP) equals to the sum of the generation of the amount of the product (2-phenylvaleronitrile) under ultrasonic conditions. Thus, rate of the decrease of n-bromopropane is consistent with the rate of production of 2phenylvaleronitrile. Pseudo-first order kinetics was indicated by the linearity of the plot of ln(1-X) versus time. The effect of various experimental parameters on the rate of the reaction has been studied; based on the experimental results, an interfacial mechanism was proposed. Similar PTC assisted C-alkylation reactions were analyzed by GC under various reaction conditions and an interfacial mechanism was proposed for these alkylation reactions(Vivekanand and Balakrishnan, 2009b, 2009c). 2.3.1 Effect of organic solvents In this work, cyclohexanone, chlorobenzene, anisole, benzene, cyclohexane, were chosen as organic solvents to investigate their reactivities. From the plot of -ln(1−X) versus time, the rate constants are obtained. As shown in Table 3, the dielectric constants(ε) for these organic solvents are in the order Cyclohexanone (ε = 8.2 ) > Chlorobenzene (ε = 5.6) > Anisole (ε = 4.3) > Benzene (ε = 2.28) > Cyclohexane (ε = 2.02). The order of the reactivity of the reactions in these six organic solvents is Cyclohexanone > Chlorobenzene > Anisole > Benzene > Cyclohexane. The dielectric constants are usually used as the main index in choosing an appropriate organic solvent in a PTC system; i.e., the reaction rate increases with increasing dielectric constant of the organic solvent. As the dielectric constant values of solvents increases, the activity of the nucleophilic reagent and also the distance between the bromide atom and the propyl group is increased. Therefore, the rate of the reaction increases (Wang and Chen, 2009 & Wang et al., 2009).
εa kapp (×10-3, min-1)
Solvents Cyclohexane 2.02 2.2
Benzene 2.28 2.9
Anisole 4.3 5.7
Chlorobenzene Cyclohexanone 5.6 8.2 7.0 9.8
a-Dielectric constant.
Table 3. Effect of the organic solvents on the apparent rate constants (kapp) under ultrasonic condition: 21.93 × 10⁻² mol of benzyl cyanide, 10g of KOH, 20 mL of H2O, 0.1 g of internal standard (toluene), 20 mL of solvent, 21.96 × 10⁻³ mol of n-bromolpropane, 0.3 g of TBAB, 600 rpm, 50 °C; under ultrasound conditions (50 kHz, 300 W). (Reprinted with permission from Vivekanand & Wang, 2011. Copyright (2011) Elsevier). 2.4 Suzuki cross coupling reaction Suzuki cross coupling reaction (Miyaura and Suzuki, 1995; Corbet and Mignani, 2006) has been recognized as a powerful and convenient tool for the carbon–carbon bond forming
100
Applications of Gas Chromatography
methods in the synthesis of pharmaceutical agents, organic materials, as well as natural products(Tomori, et al., 2000 & Kertesz et al., 2005). As a consequence, a considerable number of homogenous palladium catalysts have been used to obtain high yields of desired product. A good number of Suzuki cross coupling reaction have been realized in organic solvents because of the solubility of typical reaction components like aryl, allyl or benzyl halides and boronic acids as well as their coupling products. In recent times, there has been great interest in developing green chemical reactions that make carbon-carbon bonds using water as a solvent and applying these reactions in academic and industrial lab settings(Deveau & Macdonald, 2004; Li, 2005; Liu, et al., 2006). Hence researchers started do deal with the coupling reaction in aqueous two-phase systems (Genet et al., 1995) with water-soluble palladium complexes as catalysts allowing easy separation of the water phase which contains the palladium catalyst and a strong base to bind the formed hydrogen halide. In such biphasic systems, phase-transfer reagents were added to promote the transport of the water-soluble palladium catalyst to the interface of the reactant. Enhancement effect on the reaction rate was observed depending on the structure of the added amphiphiles. Thus coupling of broad range of aryl halides with organoboron compounds can be readily promoted by use of a phase transfer catalyst in a biphasic solvent system (Y.G.Wang et al., 2007 & Sahu et al., 2009). Specifically, this procedure is efficient for the cross-coupling of aryl halides with electron-withdrawing substituents and sterically demanding substituents(Miura et al., 2007). The phase-transfer catalyst system efficiently promotes the cross-coupling of electronic variation in the aryl halides. Paetzold and Oehme (2000) reported the palladium-catalysed cross coupling of 1iodoanisole with phenylboronic acid in an aqueous solution of sodium carbonate in the presence of different phase transfer catalysts (Scheme 6). The coupling reaction of analyzed by GLC (column HP 1; program: 2 min at 50 0C then 100C/min up to 260 0C). Gas Chromatography analysis revealed that on increasing concentration of the PTC, the rate of the reaction was increased and the formation of byproducts was suppressed.
X
HO
B
OH
R'
R PdCl2[PhP(CH2)4SO3K]2/CTAB
R 10
R'
Na2CO3 11
R' 12
R' 13
Scheme 6. Palladium-catalyzed cross coupling of iodoanisole with phenylboronic acid in the presence of PTC. Majority of PTC’s gave yields of >90% except cetylammonium tetrafluoroborate (Table 4; entry 1) which inhibits the reaction. The amphiphiles with low hydrophilic lipophilic balance (Table 4; entries 2, 5-9) and short chain amphiphiles (Table 4; entries 15 and 16) gave lower activities. Not only, the cetyltrimethylammonium bromide was favored as phase transfer reagent (Table 4; entry 10), but also zwitterionic amphiphiles, e.g.,
Recent Strategies in Organic Reactions Catalyzed by Phase Transfer Catalysts and Analyzed by Gas Chromatography
101
alkyldimethylammonium propane sulfonates (Table 4; entries 3 and 14) are excellent promoters. Dependence of anion was observed by authors while tetraalkylammonium salts were employed as PTC’s (Table 4; entries 3, 4, 10-14). In addition to yield enhancement, the authors also reported that in presence of PTC, the selectivity increases by the suppression of formation of the biphenyl side product (13). Further the authors explored the reaction in presence of supported detergents(Paetzold et al., 2004). Entry No.
PTC
1 2 3 4 5 6 7 8 9 10 11 12 13 14 15 16 17
Cetylammonium tetrafluroborate Polyoxyethylene(16)methylester C12 3-Dodecyltrimethylammonium propane sulfonate Dodecyltrimethylammonium bromide N-Lauroyl-alanine, sodium salt N-Lauroyl-proline, sodium salt Polyoxyethylene(20)sorbitanmonolaurate Polyoxyethylene(6)lauryl ether Polyoxyethylene(10)lauryl ether Cetyltrimethylammonium bromide Cetyldimethylammonium bromide Cetyltrimethylammonium tetrafluoroborate Cetyltrimethylammonium sulfate 3-Cetyldimethylammonium propane sulfonate Tetra-n-butylammonium bromide Benzyltrimethylammonium bromide No Catalyst
Yield (%) 60 Min. 360 min. 20 47 74 95 89 94 84 94 85 89 84 89 78 26 67 75 70 78 98 99 89 94 77 92 78 91 90 98 73 88 70 86 65 85
Table 4. Effect of a phase-transfer catalyst in a biphasic solvent system on the Suzuki crosscoupling reactions The coupling reaction of iodobenzene and phenylboronic acid occurs in aqueous medium in presence of palladium complexes and calix[n]arenes with good yields(Baur et al., 2001). The influence of water soluble macrocycles (Fig.10; 14-19) on the Suzuki reaction was analyzed by gas chromatography. The kinetic runs of aryl-aryl coupling reactions were stopped at small levels of conversion to exclude product inhibition effects and the yields were determined by GC. For comparison purpose, control experiments were carried out under identical conditions without addition of any macrocycle (Table 5, entry 9). The initial yields were found to be 4 to 8 times higher compared to the uncatalyzed reaction. Authors attributed the observed increase of initial yields to balance of binding ability of the host molecule and phase transfer properties. In order to avoid competition of organic solvent with the starting materials, apart from iodobenzene no additional organic solvent was employed in the investigation. Of the two bases compared, Cs2CO3 was found to be superior to diisopropylamine. All the calixarenes were found to be more superior to β-cyclodextrin. The mono-substituted calyx[4]arene 15, the macrocyclic system with lowest solubility, was found to be more active than other tested macrocyclic systems.
102
Applications of Gas Chromatography
14
15
16
17
18(n=4) 19(n=6)
Fig. 10. Structure of various calixarenes.
Recent Strategies in Organic Reactions Catalyzed by Phase Transfer Catalysts and Analyzed by Gas Chromatography
Entry No.
Macrocycle (equiv.)
1 2 3 4 5 6 7 8 9
18 (10 mol %) 19 (10 mol %) 19 (25 mol %) 17 (10 mol %) 17 (25 mol %) 16 (10 mol %) 15 (10 mol %) 14 (10 mol %) -
103 Yield (%)
HNPr2
Cs2Co3
No Base
2.4 2.9 2.6 5.8 7.5 2.2 3.6 2.1 ≡1.0
8.1
1.1
5.5 12.7 3.4 3.2
0.1 0.1 -
Table 5. Suzuki coupling reaction in presence of different macrocycles. 2.5 Epoxidation The high-additive-value epoxides are extensively used in insulating materials, adhesives, coating materials, construction materials and electronic parts. Due to growing attraction of PTC assisted epoxidation reactions, we examined the epoxidation of dicyclopentadiene (19) in presence of sodium tungstate, phosphoric acid and hydrogen peroxide under phase transfer catalysis conditions by gas chromatography(Wang et al., 2004). High conversion of dicyclopentadiene and a trace amount of by-product were obtained. The kinetics of the reaction was carried out in a 150 ml three-necked Pyrex flask, which permitted agitating the solution, inserting thermometer, taking samples and adding the feed. Known quantities of sodium tungstate and phosphoric acid were completely dissolved in hydrogen peroxide aqueous solution for preparing the active catalyst. The solution was put into the reactor, which was submerged into a well-controlled temperature water bath within ± 0.1 ◦C. Then, measured quantities of Aliquat 336 in chloroform, dicyclopentadiene in chloroform and biphenyl (internal standard) were introduced to the reactor to start the reaction. Samples were collected from the organic layer of the mixture (by stopping the stirring for 10–15 s each time) at regular time intervals. The samples were analyzed by gas chromatography (Shimadzu, 17A) for the three products; 1,2-epoxy-3a,4,7,7a-tetrahydro-4,7methano-indene (20), 5,6-epoxy-3a,4,5,6,7,7a-hexahydro-4,7-methano-indene (21) and 1,2,5,6-diepoxy-octahydro-4,7-methano-indene (22). Gas chromatography (GC) mass analysis reveals molecular ion peaks at 148 (M+) (Fig. 11a) , 148(M+) (Fig. 11b) and 164 (M+) (Fig. 11c) for compounds 20, 21 and 22 respectively. The GC analyzing conditions were:
Column: 30m x 0.525mm i.d. capillary column containing 100% poly(dimethylsiloxane) Injection temperature: 2500C Carrier gas: N2 at a flow rate of 20 mL/min Elution time of reactant A and products B, C, D: 3.82, 6.67, 7.24, and 9.43 min, respectively Detector: flame ionization detector (FID)
104
Fig. 11. Continued
Applications of Gas Chromatography
Recent Strategies in Organic Reactions Catalyzed by Phase Transfer Catalysts and Analyzed by Gas Chromatography
105
Fig. 11. GC-MS analysis of (a) 1,2-epoxy-3a,4,7,7a-tetrahydro-4,7-methano-indane(20), (b) 5,6-epoxy-3a,4,5,6,7,7a-hexahydro-4,7-methano-indene(21);(c) 1,2,5,6-diepoxy-octahydro-4,7methano-indene (22). Initially, from the ion exchange reaction (between hydrogen peroxide, phosphoric acid, sodium tungstate and quaternary ammonium salt in the aqueous phase), the active catalyst Q3{PO4[W(O)(O2)2]4} was generated. In general, there are eight active oxygen atoms on each molecule of the active catalyst Q3{PO4[W(O)(O2)2]4}. Nevertheless, we assume that each time only one active oxygen atom of the active catalyst is consumed in reacting with dicyclopentadiene in each reaction step. The remaining seven oxygen atoms are no longer active and needed for regeneration, i.e., the molecular formula of the catalyst after reaction is assumed to be Q3{PO4[W(O)(O2)2]3[W(O)(O2)(O)]}. Thus, three products, which include the epoxidation of two single-site double bonds and one two-site double bond of dicyclopentadiene molecule, are produced. The reaction mechanism is thus proposed as shown in Scheme 7.
106
Applications of Gas Chromatography ka,1
4Na2WO4 + 8H2O2 + H3PO4
H3{PO4[W(O)(O2)2]4 + 8NaOH + 4H2O
Aqueous Phase ka,2
Q3{PO4[W(O)(O2)2]4 + 3HCl Interface
H3{PO4[W(O)(O2)2}4 + 3QCl
ka,3
Q3{PO4[W(O)(O2)2]4 kQPWO
Q3{PO4[W(O)(O2)2]3[W(O)(O2)(O)]} + H2O2 kQPW
Q3{PO4[W(O)(O2)2]4 + Organic Phase
k1
Q3{PO4[W(O)(O2)2]3[W(O)(O2)(O)]} +
19
Q3{PO4[W(O)(O2)2]4 +
k2
Q3{PO4[W(O)(O2)2]3[W(O)(O2)(O)]} + O
k3
Q3{PO4[W(O)(O2)2]3[W(O)(O2)(O)]} + O
20 O
21
19 Q3{PO4[W(O)(O2)2]4 + 20
O
22
k4
Q3{PO4[W(O)(O2)2]4 + O
O
Q3{PO4[W(O)(O2)2]3[W(O)(O2)(O)]} + O 22
21
O
Scheme 7. Mechanism of dicyclopentadiene’s epoxidation under PTC conditions. (Reprinted with permission from Wang, et al., 2004. Copyright (2011) Taylor and Francis). where ka,1, ka,2, and ka,3 are the three aqueous-phase intrinsic rate constants, k1, k2, k3, and k4 are the four organic-phase intrinsic rate constants and kQPW and kQPWO are the mass transfer coefficents of the regenerated catalyst Q3{PO4[W(O)(O2)2]3[W(O)(O2)(O)]} and the active catalyst Q3{PO4[W(O)(O2)2]4}, respectively. Thus, the entire reaction involves the following steps:
the ion exchange, the complex reaction in the aqueous phase, formation of the active catalyst at the interface between two phases, the epoxidation in the organic phase, and the mass transfer of active catalyst.
Thus based on the experimental result, the conversion follows pseudo first-order rate law, i.e., d DCPDI org dt
kapp DCPDI org
(25)
where [DCPDI]org is the concentration of dicyclopentadiene in the organic phase. The subscript ‘‘org’’ denotes the characteristics of the species in the organic phase. In the beginning of experiment, we have t 0, DCPDI org
DCPDI org, i
(26)
The subscript ‘‘i’’ denotes the characteristics of the species at the initial condition. On solving equations (25) and (26), we have
Recent Strategies in Organic Reactions Catalyzed by Phase Transfer Catalysts and Analyzed by Gas Chromatography
ln(1 X ) k appt
107 (27)
where kapp is the apparent rate constant. X is the conversion of dicyclopentadiene, i.e., X 1
[DCPDI ]org [DCPDI ]org ,i
(28)
Assuming that the individual organic-phase reaction follows pseudo first-order rate law, we have
d DCPDI org dt
( k1 k2 )[QPWO ]org [DCPDI ]org
(29)
where [QPWO]org is the concentration of the active catalyst in the organic phase QPWO (i.e., Q3{PO4[W(O)(O2)2]4}). For a constant concentration of active catalyst in the organic phase, Eq (28) is reduced to k
app
( k1 k 2 ) QPWO org
(30)
As shown in the above equation, kapp represents the sum of two apparent rate constants of the two primary reactions, which are indicated in the reaction mechanism. From Eq (27), the apparent rate constant kapp can be obtained by a plot of - ln(1-X) versus time. 2.5.1 Effect of the amount of Aliquat 336 As shown in Table 6, the apparent rate constant value increases sharply with the increase in the amount of Aliquat 336 only upto 0.95x10³ mol. Nevertheless, the apparent rate constant does not continue to increase when the catalyst loading exceeded 0.95x10³ mol. We attribute the aforesaid fact to limited quantity of the active catalyst that is generated using a limiting amount of Na2WO4 and H3PO4. Generally, only the active catalyst Q3{PO4[W(O)(O2)2]4} promotes the reaction. The production of the active catalyst from the reaction of quaternary ammonium salt, sodium tungstate, hydrogen peroxide, and phosphoric acid takes place only in a stoichiometric quantity. The free sodium tungstate, phosphoric acid, quaternary ammonium salt and hydrogen peroxide do not enhance the reaction. Consequently, increasing the amount of Aliquat 336 does not enhance the reaction. We observed, the products (20), (21) and (22) being produced when an appropriate amount of Aliquat 336 was employed. On the other hand if a small amount of Aliquat 336 was used, only products (20) and (21) were produced. 2.5.2 Effect of the H2O2 Table 7 indicates the effect of amount of H2O2 on the rate of the reaction. The rate decreased with the increase in the volume of H2O2. Nonetheless, this variation is not significant. The foremost cause is probably that the oxidation of dicyclopentadiene by free H2O2 takes place when a larger volume of H2O2 is employed. The active catalyst distributes between aqueous and organic phases, and most of the active catalyst is soluble in the organic phase. Therefore, the active catalyst of a slight portion dissolves in the aqueous phase by increasing
108
Applications of Gas Chromatography
the volume of H2O2. Hence, the concentration of the active catalyst in the organic phase is slightly decreased by increasing the volume of hydrogen peroxide. The reaction between the active catalyst and the reactant takes place in the organic phase. Thus, the reaction rate slightly decreased with the increase in the volume of hydrogen peroxide due to low concentration of active catalyst in the organic phase(Wang and Rajendran, 2007a,b & Wang and Chen, 2008). Amount of Aliquat 336 x 103 (mol) k1,app x 102(min-1) k2,app x 102(min-1) k3,app x 102(min-1) k4,app x 102(min-1)
1.24
1.07
0.95
0.77
0.58
0.39
0.21
0.08
0
2.79 1.51 0.63 1.11
2.99 1.57 0.69 1.24
3.15 1.70 0.79 1.41
3.15 1.70 0.79 1.41
1.61 0.81 0.20 0.55
1.91 0.96 0.42 0.82
1.17 0.56 0.25 0.40
0.44 0.19 0 0
0.12 0 0 0
Table 6. Influence of the amount of catalyst on the conversion of dicyclopentadiene based on GC analysis Volume of H2O2(mL) k1,app x 102(min-1) k2,app x 102(min-1) k3,app x 102(min-1) k4,app x 102(min-1)
65
55
45
35
25
1.97 1.23 0.50 0.90
2.13 1.35 0.57 1.04
2.26 1.39 0.63 1.04
2.71 1.61 0.67 1.22
2.37 1.53 0.62 1.11
a-by GC analysis
Table 7. Influence of the volume of hydrogen peroxide on the conversion of dicyclopentadienea Previously, we reported (Wang & Huang, 2003) GC analyzed comparison of epoxidation conversion of olefins under phase transfer catalysis conditions. The results are shown in Table 8. In Olefins (23-38), the double bond in the ring is more easily oxidized than that of the terminal one using hydrogen peroxide as an oxidant. We compared the epoxidation results of olefins (27), (29) & (31) with those of olefins (34), (36) & (38). The results indicates higher conversion of olefins with double bond in five-carbon, six-carbon and eight-carbon rings than that of the aliphatic terminal bond. With minimum steric hindrance, only two hydrogen atoms appear on the double bond of the ring. On the other hand, there is larger steric hindrance for the double bond of the chain end when using the large-sized catalyst (Q3{PO4[W(O)O4]4}). Due to this phenomenon, it is difficult for the oxygen atom in the active complex catalyst to combine with the terminal carbon-carbon double bond. As stated previously, the double bond of the ring can easily be epoxidized. Therefore, conversion of dicyclopentadiene (19) is larger than that of the olefins (23), & (25), which have only one double bond in the ring. Three different products were obtained from olefin (19) for the two double bonds in the ring. Since, six-carbon ring epoxide is more stable, conversion of olefin (27) is higher than olefin (29). On comparing the conversion of olefins (27), (29) & (30), we found that the conversion of 1,5- cyclooctadiene (100%) was the highest and the conversion of cyclohexene (92%) was the lowest. The reason for this is
Recent Strategies in Organic Reactions Catalyzed by Phase Transfer Catalysts and Analyzed by Gas Chromatography
109
that the six-carbon ring is the most stable, whereas the eight-carbon ring is the most unstable. The conversion of straight chain compounds [(34), (36) & (38)] was much lower than those of the above reactants [(19), (23) (25), (27), (29), & (31)]. Comparing the results of (34) and (36), the conversion of 1-hexene was larger than that of 1-octene. Generally, the double bonds of the six-carbon chain have more chances to be attacked by the active catalyst than those of the 8-carbon chain. In the case of (38), there are two double bonds on the chain end of 1,7octadiene. However, epoxidation of 1,7-octadiene gave only one product because of the short reaction time. Nevertheless bis-epoxy product was noticed on extending the reaction time.
Entry
Olefin
Product
Conversiona
O
1
75 24
23
O 2
92 25
26
O 3
O
20 19
21
O O
22
O
4
98
28
27
O
5
92
29
30
O
O
6 31
98
32
O 33
100
110
Applications of Gas Chromatography
7
8
9
O
34
35
O 36
37
O 38
39
25
10
20
a Gas chromatography (Shimadzu GC 9A with FID using 100% poly(dimethylsiloxane), capillary column, 30m_0.525 mm and nitrogen as the carrier gas).
Table 8. Structural influence of different olefins on their epoxidation under PTC conditions (Wang & Huang, 2003) analyzed by GC a. (Reprinted with permission from Wang & Huang, 2003. Copyright (2011) Springer).
3. Conclusions Current chapter describes recent developments and a perspective in kinetics of phase transfer catalysis assisted organic reactions analyzed by Gas Chromatography. The combination of PTC with sonochemistry can also be an interesting approach for determining efficient reaction conditions, provided that PTC remains stable under exposure to ultrasounds. Research reports from leading laboratories that touch on all the themes noted herein and many others are assembled. The topics are organized by five broad groupings, viz., Nalkyaltion, O-Alkylation, C-alkylation, Suzuki coupling and epoxidation. The N-alkylation study reveals that the stirring speed has positive influence on rate of the reaction only up to 400 rpm and the favorable quaternary ammonium salt for the reaction will be the one with larger carbon numbers. In the ultrasonic irradiation assisted synthesis of dimethoxydiphenylmethane, higher the ultrasonic frequenzy and power, higher will be the rate constant values. C-alkylation study indicates the influence of dielectric constant values on the rate of the reaction. GC-analyzed Suzuki coupling reactions indicates the application of PTC in these reactions. Kinetics of epoxidation of dicyclopentadiene shows that the rate of the reaction depends only upto certain amount of catalyst. Nevertheless the volume of hydrogen peroxide has a negative influence on the rate of the reaction. Thus, PTC approach leads in establishing genuinely sustainable chemical industrial processes within the context of the forthcoming paradigm shift in worldwide production of highly valuable substances.
4. Acknowledgments We gratefully acknowledge support of this work by the National Science Council, Taiwan (NSC), under several grants.
5. References Awasthi, S. Rao A. N.,& Ganesan, K.. (2009). An environmental-benign approach for the synthesis of alkylthiocyanates. J. Sulfur Chem., Vol.30, No.5, pp.513–517, ISSN: 17415993
Recent Strategies in Organic Reactions Catalyzed by Phase Transfer Catalysts and Analyzed by Gas Chromatography
111
Baelen, G.V., Maes, B. U. W. (2008). Study of the microwave-assisted hydrolysis of nitriles and esters and the implementation of this system in rapid microwave-assisted Pdcatalyzed amination. Tetrahedron, Vol. 64, No.23, pp.5604-5619, ISSN: 0040-4020 Barbasiewicz, M., Marciniak, K., & Fedoryn´ski, M. (2006). Phase transfer alkylation of arylacetonitriles revisited.Tetrahedron Lett. Vol.47, No.23, pp.3871-3874, ISSN: 00404039 Baur, M., Frank, M., Schatz, J., & Schildbach, F. (2001).Water-soluble calyx[n]arenes as receptor molecules for non-polar substrates and inverse phase transfer catalysts. Tetrahedron, Vol.57, No.32, pp.6985-6991, ISSN: 0040-4020 Bogdal, D., Lukasiewicz, M., Pielichowski, J., & Bednarz, S. (2005). Microwave-assisted epoxidation of simple alkenes in the presence of hydrogen peroxide. Synth. Commun.,Vol.35, No.23, pp.2973-2983, ISSN: 0039-7911 Bravo, R., Caltabiano, L. M., Fernandez, C., Smith, K. D., Gallegos, M., Whitehead Jr., R. D., Weerasekera, G., Restrepo, P., Bishop, A. M., Perez, J. J. , & Needham, L.L., Barr, D. B. (2005). Quantification of phenolic metabolites of environmental chemicals in human urine using gas chromatography–tandem mass spectrometry and isotope dilution quantification. J CHROMATOGR B., Vol.820, No.2, pp.229-236, ISSN: 15700232 Cardador, M. J., Serrano, A., & Gallego, M. (2008). Simultaneous liquid–liquid microextraction/methylation for the determination of haloacetic acids in drinking waters by headspace gas chromatography. J CHROMATOGR A., Vol.1209, No.1-2, pp.61–69, ISSN: 0021-9673 Chatti, S., Bortolussi, M., Loupy, A., Blais, J. C., Bogdal, D., & Majdoub, M. (2002). Efficient synthesis of polyethers from isosorbide by microwave-assisted phase transfer catalysis. Eur. Poly. J. Vol.38, No.9, pp.1851-1861, ISSN: 0014-3057 Chatti, S., Bortolussi, M., Bogdal, Blais, D. J. C., & Loupy, A. (2004). Microwave-assisted polycondensation of aliphatic diols of isosorbide with aliphatic disulphonylesters via phase-transfer catalysis. Eur. Poly.J. Vol.40, No.3, pp.561-577, ISSN: 0014-3057 Corbet, J. P., Mignani, G. (2006). Selected patented cross-coupling reaction technologies. Chem. Rev., Vol.106, No.7, pp.2651-2710, ISSN: 0009-2665 Deveau, A. M., & Macdonald, T. L. (2004). Practical synthesis of biaryl colchicinoids containing 3’,4’-catechol ether-based A-rings via Suzuki cross-coupling with ligandless palladium in water. Tetrahedron Lett., Vol.45, No.4, pp.803-807, ISSN: 0040-4039 Devulapelli, V. G., & Weng, H.S. (2009). Synthesis of cinnamyl acetate by solid–liquid phase transfer catalysis: Kinetic study with a batch reactor Catal. Commun. Vol.10, No.13 , pp.1638-1642, ISSN: 1566-7367 Fiamegos, Y. C., Kefala, A.P., & Stalikas, C. D. (2008). Ion-pair single-drop microextraction versus phase-transfer catalytic extraction for the gas chromatographic determination of phenols as tosylated derivatives. J CHROMATOGR A., Vol.1190, No.1-2, pp.44-51, ISSN: 0021-9673 Fiamegos, C., Karatapanis, A., & Stalikas, C. D., (2010). Microwave-assisted phase-transfer catalysis for the rapid one-pot methylation and gas chromatographic determination of phenolics J CHROMATOGR A., Vol.1217, No.5, pp.614-621, ISSN: 0021-9673 Genet, J.P., Linquist, A., Blart, E., Mouries, V., Savignac, M., & Vaultier, M. (1995). Suzukitype cross coupling reactions using palladium-water soluble catalyst. Synthesis of
112
Applications of Gas Chromatography
functionalized dienes. Tetrahedron Lett., Vol.36, No.9, pp.1443 -1446, ISSN : 00404039 Greiner, I., Sypaseuth, F. D., Grun, A., Karsai, E., & Keglevich, G.. (2009). The role of phase transfer catalysis in the microwave-assisted N-benzylation of amides, imides and N-heterocycles. Lett. Org.Chem. Vol.6, No.7, pp.529-534, ISSN: 1570-1786 Gumaste, V. K., Khan, A. J., Bhawal, B. M., & Deshmukh, A.R. A. S. (2004). Microwave assisted phase transfer catalysis: An efficient solvent free method for the synthesis of cyclopropane derivatives. Ind. J. Chem., Sec. B., Vol.43B, No.2, pp.420-423, ISSN: 0376-4699 Hejchman, E., Maciejewska, D., & Wolska, I. (2008). Microwave-assisted synthesis of derivatives of khellinone under phase-transfer catalytic conditions Monatshefte fuer Chemie., Vol.139, No.11, pp.1337–1348, ISSN: 0026-9247 Iijima, T., Suzuki, N., Fukuda, W., & Tomoi, M. (1995).Toughening of aromatic diaminecured epoxy resins by modification with N-phenylmaleimide-styrene-phydroxystyrene terpolymers. Eur. Polym. J., Vol.31, No.8, pp.775-783, ISSN: 00143057 Jankovic, V., Mijin, D.Z., & Petrovic, S.D. (2002). Alkylation of N-substituted 2phenylacetamides: Benzylation of N-(4-nitrophenyl)-2-phenylacetamide. J.Serb.Chem.Soc., Vol.67, No.6, pp.373-379, ISSN: 0352-5139 Kertesz, M., Choi, C. H., & Yang, S. (2005). Conjugated polymers and aromaticity. Chem. Rev., Vol.105, No.10, pp.3448-3481, ISSN: 0009-2665 Lancaster, M. (2002). Green Chemistry: An Introductory Text- Royal Society of Chemistry, pp 119-122. ISSN: 0-85404-6208 Langmuir, M. E., Yang, J. R., Moussa, A. M., Laura, R., & Lecompte, K. A. (1995). New naphthopyranone based fluorescent thiol probes. Tetrahedron Lett., Vol.36, No.23, pp.3989 -3992, ISSN: 0040-4039 Li, C.J. (2005). Organic reactions in aqueous media with a focus on carbon-carbon bond formations: A decade update. Chem. Rev., Vol.105, No.8, pp.3095-3166, ISSN: 00092665 Lin, F. M., Wu, H. S., Kou, H. S., & Lin, S. J. (2003). Highly sensitive analysis of iodide anion in seaweed as pentafluorophenoxyethyl derivative by capillary gas chromatography. J. Agric. Food Chem. Vol.51, No.4, pp.867-870, ISSN: 0021-8561 Liu, L., Zhang, Y.,& Xin, B. (2006). Synthesis of biaryls and polyaryls by ligand-free suzuki reaction in aqueous phase. J. Org. Chem., Vol.71, No.10, pp.3994-3997, ISSN: 00223263 Luo, C. Lü, J., Cai, C., & Qü. W. (2004). A polymer onium acting as phase-transfer catalyst in halogen-exchange fluorination promoted by microwave. J. Fluor.Chem., Vol.125, No.5, pp.701-704. ISSN: 0022-1139 Mahdavi. H., & Tamami, B.(2005). Synthesis of 2-nitroalcohols from epoxides using quaternized amino functionalized cross-linked polyacrylamide as a new polymeric phase transfer catalyst. REACT FUNCT POLYM, Vol. 64, No.3, pp.179-185,. ISSN: 1381-5148 Makosza, M. (2000). Phase-transfer catalysis. A general green methodology in organic synthesis. Pure Appl. Chem., Vol.72, No.7, pp.1399-1403, ISSN: 0033-4545 Masuno, M.N., Young, D.M., Hoepker, A.C., Skepper, C.K., & Molinski, T.F. (2005). Addition of Cl2C: to (−)-O-Menthyl Acrylate under Sonication−Phase-Transfer
Recent Strategies in Organic Reactions Catalyzed by Phase Transfer Catalysts and Analyzed by Gas Chromatography
113
Catalysis. Efficient Synthesis of (+)- and (−)-(2-Chlorocyclopropyl)methanol. J. Org. Chem., Vol.70, No.10, pp.4162-4165, ISSN: 0022-3263 Mijin, D.Z., Jankovic, V., & Petrovic, S.D. (2004). Alkylation of N-substituted 2phenylacetamides: Benzylation of N-(4-chlorophenyl)-2-phenylacetamide. J.Serb.Chem.Soc., Vol.69, No.2, pp.85-92, ISSN: 0352-5139 Mijin, D.Z., Prascevici, M., & Petrovic, S.D. (2008). Benzylation of N-phenyl-2phenylacetamide under microwave irradiation. J.Serb. Chem. Soc., Vol.73, No.10, pp.945-950, ISSN: 0352-5139 Mikia, A., Tsuchihashia, H., Yamanob, H., & Yamashita, M. (1997). Extractive pentafluorobenzylation using a polymeric phase-transfer catalyst: a convenient one-step pretreatment for gas chromatographic analysis of anionic compounds. Anal. Chim. Acta., Vol.356, No.2-3, pp.165-175,. ISSN: 0003-2670 Miura, M., Koike, T., Ishihara, T., Sakamoto, S., Okada, M., Ohta, M., & Tsukamoto, S.-i. (2007). One‐pot preparation of unsymmetrical biaryls via Suzuki Cross‐Coupling reaction of aryl halide using phase‐transfer catalyst in a biphasic solvent system. Syn. Commun., Vol.37, No.5, pp.667-674, ISSN 0039-7911 Miyaura, N., Suzuki, A. (1995). Palladium-catalyzed cross-coupling reactions of organoboron compounds. Chem. Rev., Vol.95, No.7, pp.2457-2483, ISSN: 0009-2665 Ohkubo, M., Nishimura, T. , Jona, H., Honma, T., & Morishima, H. (1996). Practical synthesis of indolopyrrolocarbozoles. Tetrahedron, Vol.52, No.24, pp.8099-8112, ISSN: 0040-4020 Paetzold, E., & Oehme, G.. (2000). Efficient two-phase Suzuki reaction catalyzed by palladium complexes with water-soluble phosphine ligands and detergents as phase transfer reagents. J. Mol. Catal. A: Chem. Vol.152, No. 1-2, pp.69-76, ISSN: 1381-1169 Paetzold, E., Jovel, I., & Oehme, G.. (2004). Suzuki reactions in aqueous multi-phase systems promoted by supported detergents. J. Mol. Catal. A: Chem. Vol.214, No. 2, pp.241247, ISSN: 1381-1169 Sahu, K. B., Hazra, A., Paira, P., Saha, P., Naskar. S., Paira, R. , Banerjee, S., Sahu, N. P., B.Mondal, N., Luger, P., & Weber, M. (2009). Synthesis of novel benzoxazocino quinoliniums and quinolones under PTC conditions and their application in Suzuki cross coupling reaction for the construction of polynuclear heteroaromatics. Tetrahedron, Vol.65, No.34, pp.6941–6949, ISSN: 0040-4020 Sakayanagi, M., Yamada, Y., Sakabe, C., Watanabe, K., & Harigaya, Y., (2006). Identification of inorganic anions by gas chromatography/mass spectrometry. Forensic Sci. Int., Vol.157, No.2-3, pp.134-143, ISSN: 0379-0738 Sasson, Y., & Neumann, R.(1997). Handbook of Phase Transfer Catalysis, Blackie Academic and Professional (Chapman & Hall), ISBN: 0751402583, London. Settimo, A.Da., Primofiore, G., Settimo, F.Da., Simorini, F. , Motta, C.La., Martinelli, A., & Boldrine, E. (1996). Synthesis of pyrrolo[3,4-c]pyridine derivatives possessing an acid group and their in vitro and in vivo evaluation as aldose reductase inhibitors. Eur. J. Med. Chem., Vol.31, No.1, pp.49-58, ISSN: 0223-5234 Sharma, P., Kumar, A., & Sharma, M. (2006). Synthesis of 4-[2-(2-methylprop-1-enylidene)2,3-dihydro-1H-benzimidazole-1-yl]-1-napthol via azo group insertion of dimethylvinylidenecarbene under phase transfers catalysis conditions. Catal. Commun. Vol.7, No.9, pp. 611-617. ISSN: 1566-7367.
114
Applications of Gas Chromatography
Tomori, H., Fox, J. M., & Buchwald, S. L. (2000). An improved synthesis of functionalized biphenyl-based phosphine ligands.J. Org. Chem., Vol.65, No.17, pp.5334-5341, ISSN: 0022-3263 Vivekanand, P. A., & Balakrishnan, T. (2009a). Kinetics of dichlorocyclopropanation of vinylcyclohexane catalyzed by a new multi-site phase transfer catalyst. Cat. Commun., Vol.10, No. 5, pp.687-692, ISSN:1566-7367 Vivekanand, P. A., & Balakrishnan, T. (2009b). Superior catalytic efficiency of a new multisite phase transfer catalyst in the C-alkylation of dimedone – A kinetic study. Cat. Commun., Vol.10, No.10, pp.1371-1375. ISSN:1566-7367 Vivekanand, P. A., & Balakrishnan, T. (2009c). Synthesis and characterization of a novel multi-site phase transfer catalyst and a kinetic study of the intramolecular cyclopentanation of indene. Appl. Catal. A: Gen., Vol.364, No.1-2, pp.27-34. ISSN: 0926-860X. Vivekanand, P. A., & Balakrishnan, T. (2009d). Catalytic potential of a new polymeranchored multisite phase tansfer catalyst in the dichlorocarbene addition to Indene. Catal. Lett., Vol.13, No.3-4, pp.587-596, ISSN: 1011-372X Vivekanand, P. A., & Balakrishnan, T. (2009e). Evaluation of catalytic efficiency of a triplesite phase transfer catalyst and the kinetics of dichlorocarbene addition to 5-vinyl2-norbornene. Cat. Commun., Vol.10, No.15, pp.1962-1966, ISSN:1566-7367 Vivekanand, P.A., & Wang, M. L. (2011). Sonocatalyzed synthesis of 2-phenylvaleronitrile under controlled reaction conditions – A kinetic study. Ultrason. Sonochem., Vol.18, No.5 , pp.1241–1248, ISSN: 1350-4177 Wang, M.L., & Tseng, Y.H. (2002). Phase-transfer catalytic reaction of dibromo-o-xylene and 1-butanol in two-phase solution. J. Mol. Catal. A: Chem., Vol.179, No.1-2, pp.17-26, ISSN: 1381-1169 Wang, M.L., Hsieh, Y.M., & Chang, R.Y. (2003). Kinetic study of dichlorocyclopropanation of 1,7-octadiene under phase-transfer catalysis conditions at high alkaline concentration Ind. Eng. Chem. Res,. Vol.42, No.20, pp.4702-4707, ISSN: 0888-5885 Wang, M.L., & Huang, T.H. (2003). Phase-transfer catalytic epoxidation of oleins under liquid-liquid biphasic conditions. React. Kinet. Catal. Lett., Vol.78, No.2, pp.275-280, ISSN : 0133-1736 Wang, M.L., Huang. T.H., & Wu, W. T. (2004). Kinetic study of the phase transfer catalytic epoxidation of dicyclopentadiene in a two-phase medium. Chem. Eng. Comm., Vol. 191, No.1, pp.27-46, ISSN: 0098-6445 Wang, M.L., Chen, W.H., & Wang, F. S. (2005). Kinetic study of synthesizing Nbutylphthalimide under solid-liquid phase-transfer catalysis conditions J. Mol. Catal. A: Chem., Vol.236, No.1-2, pp.65-71, ISSN: 1381-1169 Wang, M.L., & Lee, Z.F. (2006). Kinetic study of synthesizing bisphenol a dially ether in a phase transfer catalytic reaction. Bull. Chem. Soc. Jpn. Vol.79, No.1, pp.80–87, ISSN: 0009-2673 Wang, M. L., & Rajendran, V. (2006). A kinetic study of thioether synthesis under influence of ultrasound assisted phase-transfer catalysis conditions. J. Mol. Catal. A: Chem., Vol.244, No.1-2, pp.237–243, ISSN: 1381-1169 Wang, M.L., & Lee, Z.F. (2007). Reaction of 4,4′-bis(chloromethyl)-1,1′-biphenyl and phenol in two-phase medium via phase-transfer catalysis J. Mol. Catal. A: Chem., Vol.264, No.1-2, pp.119-127, ISSN: 1381-1169
Recent Strategies in Organic Reactions Catalyzed by Phase Transfer Catalysts and Analyzed by Gas Chromatography
115
Wang, M. L., & Rajendran, V. (2007a). Ultrasound assisted phase-transfer catalytic epoxidation of 1,7-octadiene - A kinetic study. Ultrason. Sonochem., Vol.14, No.1, pp.46-54, ISSN:1350-4177. Wang, M. L., & Rajendran, V. (2007b). Kinetics for dichlorocyclopropanation of 1,7octadiene under the influence of ultrasound assisted phase-transfer catalysis conditions J. Mol. Catal. A: Chem., Vol.273, No.1-2, pp.5-13, ISSN: 1381-1169 Wang, M.L., & Rajendran V. (2007c). Ethoxylation of p-chloronitrobenzene using phasetransfer catalysts by ultrasound irradiation – A kinetic study. Ultrason. Sonochem., Vol.14, No.3, pp.368–374,. ISSN: 1350-4177 Wang, M. L.,& Chen, C. J. (2008). Kinetic Study of Synthesizing 1-(3-Phenylpropyl)pyrrolidine-2,5-dione under Solid-Liquid Phase-Transfer Catalysis. Org. Process Res. Dev., Vol.12, No.4, pp. 748–754, ISSN: 1083-6160 Wang, M. L., Chen, C. J., & Wang, F. S. (2009). Kinetic study of synthesizing 1-phenyl-3propyl ether under liquid-liquid phase-transfer catalytic conditions. Chem. Eng. Comm., Vol.196, No.5, pp.573–590, ISSN: 0098-6445 Wang, M.L., & Chen, W.H. (2009). Kinetic study of synthesizing dimethoxydiphenylmethane under phase-transfer catalysis and ultrasonic irradiation. Ind. Eng. Chem. Res., Vol.48, No.3, pp.1376-1383, ISSN: 0888-5885 Wang, M. L.,& Chen, C. J. (2010). Kinetic Study of Synthesizing 1-(3Phenylpropyl)pyrrolidine-2,5-dione under Solid-Liquid Phase-Transfer Catalytic Conditions Assisted by Ultrasonic Irradiation. Org. Process Res. Dev. Vol.14, No.3, pp.737-745, ISSN: 1083-6160 Wang, M. L., & Prasad, G.S. (2010). Microwave assisted phase-transfer catalytic ethoxylation of p-chloronitrobenzene—A kinetic study. J. Taiwan Inst. Chem. Eng., Vol.41, No.1, pp.81-85, ISSN: 1876-1070. Wang, Y.G., Ueda, M., Wang, X., Han, Z., & Maruoka, K. (2007). Convenient preparation of chiral phase-transfer catalysts with conformationally fixed biphenyl core for catalytic asymmetric synthesis of α-alkyl- and α,α-dialkyl-a-amino acids: application to the short asymmetric synthesis of BIRT-377. Tetrahedron,Vol. 63, No.26, pp.6042-6050, ISSN: 0040-4020. Yadav, G. D., & Bisht, P. M. (2004). Novelties of microwave assisted liquid–liquid phase transfer catalysis in enhancement of rates and selectivities in alkylation of phenols under mild conditions. Catal. Commun. Vol.5, No. , pp.259–263, ISSN: 1566-7367 Yadav, G. D., (2004). Insight into green phase transfer catalysis. Top. Catal. Vol.29, No.3-4, pp.145-161, ISSN: 1022-5528 Yadav, G. D., & Badure, O. V. (2008). Selective engineering in O-alkylation of m-cresol with benzyl chloride using liquid–liquid–liquid phase transfer catalysis. J. Mol. Catal. A: Chem. Vol.288, No.1-2, pp.33-41. ISSN: 1381-1169 Yang, H.M., & Peng, G.Y. (2010). Ultrasound-assisted third-liquid phase-transfer catalyzed esterification of sodium salicylate in a continuous two-phase-flow reactor. Ultrason.Sonochem., Vol.17, No.1, pp.239–245, ISSN: 1350-4177. Yang, H.M., & Lin, D.W. (2011). Third-liquid phase-transfer catalyzed esterification of sodium benzoate with novel dual-site phase-transfer catalyst under ultrasonic irradiation. Catal. Commun., Vol.14, No.1, pp.101-106. ISSN:1566-7367
116
Applications of Gas Chromatography
Yiannis, C. F., Nanos, C. G., Vervoort, J., & Stalikas, C. D. (2004). Analytical procedure for the in-vial derivatization—extraction of phenolic acids and flavonoids in methanolic and aqueous plant extracts followed by gas chromatography with mass-selective detection. J CHROMATOGR A., Vol.1041, No.1-2, pp.11–18, ISSN: 0021-9673
6 POP and PAH in Bizerte Lagoon, Tunisia Trabelsi Souad, Ben Ameur Walid, Derouiche Abdekader, Cheikh Mohamed and Driss Mohamed Ridha Laboratory of Environmental Analytical Chemistry, Faculty of Sciences, Bizerte, Zarzouna, Tunisia
1. Introduction Gas chromatography is the most recent branch of chromatography and includes all the chromatography processes in which the substance to be analyzed occurs in the gaseous or vapor state or can be converted into such a state. Although the first records of gas chromatography go back hundreds of years (Bayer, 1959), its true history began during World War II when a large industrial chemical company instituted a crash its development (Tietz, 1970). The first published work appeared in the early 1950´s based on the successful experiments by James and Martin (1952). In the years between 1952 and 1956 the early apparatus came into sight. The success of gas chromatography is due to its simplicity of operation, high separation power and speed. Its use involves versatile applications not only to the field of chemistry but also biology, medicine, industrial research and control, environmental health and scientific studies. In the field of environmental control the use of gas chromatography has allowed specific separations and measurements of toxic compounds on a large variety of matrices. Among these hazards, persistent organic pollutants (POPs) are carbon-based organic compounds and mixtures with toxicity and environmental persistence that include industrial products and byproducts. POPs can be transported far from their sites of release by environmental media to previously pristine locations such as the Arctic. Low POP levels might be increased by biomagnification through the transmission process in the food chain. They can be easily accumulated in the organism to levels that can potentially injure human health as well as the environment (Birnbaum, 1994; Hansen, 1998). There are 12 substances or substance groups prioritized for global action in the recently signed Stockholm Convention on Persistent Organic Pollutants, developed under the auspices of the United Nations Environment Programme (UNEP). The 12 substances, the ‘‘dirty dozen,’’ consist of eight kinds of pesticides, including dieldrin, aldrin, endrin, chlordane, heptachlor, DDT, toxaphene, mirex, two kinds of industrial chemicals [polychlorinated biphenyls (PCBs) and hexachlorobenzene (HCB)], and two kinds of byproducts (polychlorinated dibenzofurans and polychlorinated dibenzo-p-dioxins) (Stockholm Convention on Persistent Organic Pollutants, 2001). There are four characteristic parameters (persistence, bioaccumulation, toxicity, and long-range environmental transport), which can distinguish POPs from a multitude of other organic chemicals. All 12
118
Applications of Gas Chromatography
prioritized POPs or their breakdown products rank high to extreme on measurements of these parameters. Reproductive, developmental, behavioral, neurological, endocrine, and immune adverse health effects on people have been linked to POPs. POP pollution has touched every region in the world. Much attention is given to POP contamination problems, and strong action has been taken by most developed and developing nations. Among organic pollutants, polycyclic aromatic hydrocarbons (PAHs) are the most ubiquitous and constitute a major group of marine environmental contaminants. PAH show a marked hydrophobic character, resistance to biodegradation (Neff, 1979) and adverse effects on health (carcinogenic and/or mutagenic activity) (Singh et al., 1998) and ecosystem (Long et al., 1995). The carcinogenic properties of some compounds, coupled with the stability of PAHs during their atmospheric and aquatic transport, and their widespread occurrence have, in recent years, generated interest in studying their sources, distribution, transport mechanisms, environmental impact and fate (Bouloubassi & Saliot, 1993). Moreover, PAHs are quickly adsorbed onto suspended particulate. These findings prompted US EPA to include 16 PAHs within a priority pollutant list. Therefore, guidelines were proposed in order to assist the management of polluted sediments (Swarz, 1999). PAHs of coastal sediments are due to both anthropogenic and natural sources (NRC, 1985). Among anthropogenic factors, petrogenic and pyrolytic sources are the most important. Although somewhat controversial, the aromatisation of cyclic compounds could be a further source of PAHs (LaFlamme & Hites, 1978). Perylene is a good example of a PAH substance of biological origin found in both marine and freshwater sediments (LaFlamme & Hites, 1978). Again, PAHs from pyrolytic and petrogenic sources exhibit different chemical behaviour and distribution in marine sediments. In particular, PAHs from pyrolytic processes are more strongly associated with sediments and much more resistant to microbial degradation than PAHs of petrogenic origin (Gustafsson et al., 1997). The Bizerte lagoon is located in the northernmost part of Tunisia, between latitudes N°37 08’ and N°37 16’ and consists of a depression having a surface area of about 150 km2 and maximum depth of 12 m. This lagoon is known for its geostrategic position since it links the Mediterranean Sea to an internal lake (Ichkeul), which is classified as a national park and world heritage. Many decades ago, the lagoon is known as a fishery and aquaculture park related to the presence of three mytiliculture sectors especially Menzel Jemil park which is the most productive site. Many years ago, the lagoon’s banks were subjected to both urbanization and industrialization. Manufacturing facilities such as iron and steel complex, the naval construction and tyre production, urban wastewater and open-dumping-type municipal or industrial solid waste landfills scattered around the lagoon could have led to ecological perturbation of this fragile environment. Two previous preliminary studies showed that superficial coastal sediments from Bizerte lagoon were moderately contaminated by PCB (Derouiche et al., 2004) and PAH (Trabelsi & Driss, 2005). In order to perform the current contamination status in the study area data compilation and reporting together with data for POC contamination are the final steps for a comprehensive survey of Bizerte lagoon for the levels of organic contaminants, and represent an attempt to understand the effects of the agricultural and industrial chemical
119
POP and PAH in Bizerte Lagoon, Tunisia
pollution. As a result, the following interpretation and discussion will be focused on the 15 organochlorine pesticides, 20 PCBs and 20 PAHs in sediment. Additionally, data for combination of multivariate approaches were applied in order to identify possible input sources.
2. Materials and methods 2.1 Sampling Sediment samples from Bizerte lagoon were collected in December 2001 using a Van Veen grap. The first top centimetre (500g) was placed in an aluminium container and frozen on dry ice, then transferred to the laboratory with no exposure to light. Fifteen sampling stations in coastal and central areas in the lagoon are shown in Fig.1.
9°50’
9°55 Mediterranean Sea
Bizerte
37°10’
1
Menzel Abderahmen
Merazig Wadi
Menzel Jemil
2 10
11 Hlima Tinja Wadi Wadi
9
3 12
13
15
14
8 Gueniche Wadi
4
N
Menzel Bourguiba
5
Km 0
37°0
2
4
7 6 Ben Hassin Wadi
Fig. 1. Study area and sampling stations
Garek Wadi
120
Applications of Gas Chromatography
2.2 Grain size and TOC determinations The fraction of the sediment having a grain size 90%. The identification of compounds was deduced from their retention times and quantification was based on peak area measurement as well comparison with responses of the mixed PCBs standard reference material (SRM 1493).
3. Results and discussion 3.1 Sediment characteristics Different opinions exist regarding the relation between POPs concentration and characteristics of sediments. Several authors have observed that organochlorines and PAH in the sediments are mainly associated with the organic matter (Neff, 1979; Knezovich et al., 1987; Doong et al., 2002), and their total content depends on grain size distribution (Law & Andrulewicz, 1983; Doong et al., 2002). TOC contents ranged from 0.23% to 2.95% in the study area (Table1). Organic matter contents of sediments appear especially high (> 3% of dry weight) in the central zone of the lagoon and are relatively low in the peripheral zones (1.5%). This
122
Applications of Gas Chromatography
also seems to be true for the Bizerte and neighbouring cities. This finding could be explained by the massive discharge (before 1997) of raw municipal and/or industrial wastewater before implantation of wastewater plants in these cities. The mouths of Guenniche and Garek wadis are marked by a low deposit of organic matter (