Special Issue: Hotel Operations Management – Issues and Challenges
Vol. 5, January 2013
Indian Journal of
Applied Hospitality and Tourism Research Vol. 5, January 2013
CONTENTS Research Papers Kumar, S.
Meeting, Incentive, Conference and Exhibition (MICE) Tourism: 3-12 Present & Future Prospects in Chandigarh Capital Region
Kumar, B. and Lockyer, T.
Mega Events - The Impact of the Commonwealth Games on the 13-20 Hotel Industry
Patwardhan, V. and Rao, S.
Student perspectives of industrial training experience in 21-27 hospitality industry: A Study
Lockyer, T. and Elebiary, A.
Hotel Loyalty
Khanna, S. and Akhtar, S.
Frontline Employee Demographics and its Impact on Job 38-47 Satisfaction and Organizational Commitment in Hotel Industry
Kumar, S and Chahal, P.
Turnover in Indian Hotel Industry: A Study Of Employees 48 -54 Opinions
Mohsin, A. and Kumar, B.
Lessons from Literature: Hotels?
Rao, S. and Patwardhan, V.
A study of factors moderating student’s selection of Hospitality 68 - 73 Program in India
28- 37
How to Manage Staff Turnover in 55 - 67
Indian Journal of Applied Hospitality and Tourism Research
Preface
Effective service ensures guest satisfaction and is essential to remain relevant and gain competitive advantage to keep pace with the ever changing environment. As service is people oriented, management of a true Hospitality Professional through channelizing organizational objective and employees aspirations together is crucial for the proficient management of the operations. The WTO Campaign ―One billion Tourists- One billion opportunities‖ will invite more relevance to Human Resources Management in Hospitality Industry. In view of the increasingly changing needs and expectations of guests, we need to adapt to ensure best levels of service and customer loyalty. With varieties of tourist destination and increasing business opportunities in the country, MICE activities have potential for growth and is also becoming one of the focus area in the Hospitality Industry. A favourable MICE destination can be popularized by incorporating better facilities, infrastructure and competitive cost of travel and stay. Availability of trained manpower, job satisfaction and staff turnover continues to pose a huge challenge to hotels despite steps that are being taken to create more hospitality professionals. The special issue of the journal comprises of innovative research papers that offers an integrated perspective in Hotel Operations Management: Issues and Challenges and addresses the task by bringing together a collection of research papers that investigate the prospects of MICE business and analyze the impact of Commonwealth Games on the hotel industry beside exploring the issues of Human Resources Management in the Hospitality Industry through well Researched Papers on studying perspective of Industrial Training in Hospitality Industry, focusing on crucial impact of Hotel Loyalty Programme, impact of demographics on job satisfaction, study on the various causes and management of staff turnover and on moderating students selection of hospitality programme. The papers are comprehensive coverage of certain timely, crucial and challenging issues of the Tourism and Hospitality Industry. We humbly acknowledge the work of all researchers on whose contribution this Journal builds on. We would like to express our gratitude to all authors for their excellent contribution as well. We would also like to thank every single person who has assisted in the publication of this special issue. It could not have been possible without the dedication and enthusiasm of our editorial team and the referees. Good contribution with some really valuable insights, the Journal is a unique opportunity to share knowledge, understand and develop new strategies for growth with a specific focus on hospitality industry. The journal is an expression of our vision of the advancement in the Hospitality, Travel and Tourism Industry. Chief Editor
..... 2
Special Issue: Hotel Operations Management – Issues and Challenges
Vol. 5, January 2013
Meeting, Incentive, Conference and Exhibition (MICE) Tourism: Present & Future Prospects in Chandigarh Capital Region Abstract Chandigarh is always crown as first planned city in India and is known internationally for its architecture and urban design. Today, it is an administrative capital of two states and emerging business city of North India. According to MGI (2010) report on “Indian cities urbanization” Chandigarh is one of the fastest and dynamic cities of North India and currently it is a favorite place to live and hold an important place for investment and growth in years to come. This results in the growth of business tourism, especially Meeting, Incentive, Conference, Exhibitions (MICE) tourism in the Chandigarh capital region. MICE is one of the most innovative & demanding form of business tourism. Currently, MICE tourism in India is having the annual growth 15 to 20 percent. To promote a city as MICE destination requires a good amount of infrastructural facilities. Government of India (2006) plans to develop few cities as MICE destinations, Chandigarh is also one of them. This paper tries to find out the present & future prospects of MICE tourism in Chandigarh “the city beautiful”& nearby regions. For this an opinion survey of MICE stakeholders such service providers (which include hotels, travel agents) and MICE customers is done and analysis is done with the help of Situation Actor Process–Learning Action Performance (SAP- LAP) tool. Key words: MICE, Chandigarh region, Situation Actor Process–Learning Action Performance (SAP- LAP) tool.
Introduction MICE (Meetings, Incentives, Conferences and Exhibitions) are an important segment of tourism business currently experiencing remarkable competitive growth. MICE market is estimated to be $280 billion worldwide (WTO, 2008) growing at approx 10-15% annually with 14,000 meetings organized on a regular basis (ICCA, 2007). It is a part of business tourism that is worth $ 672.5 billion. The share of Asia Pacific and India is small in MICE at $ 60 billion and $ 4.8 billion respectively (The Economic times, 2008). India rank 9th with 4.3% market share in Asia- Pacific region (ICCA, 2006) as shown in table 1.
Rank 1 2 3 4 5 6 7 8 9 10 11 12 13 14 15 16 17 18 19
Table 1: Countries Share in MICE in Asia Pacific Region 2006 Percentage share MICE Percentage share MICE in in Asia Pacific Region (2006) Asia Pacific Region (1997) Australia 15.4 19.6 Japan 12.8 18.5 China-P.R. 12.4 5.6 Singapore 10.4 5.7 Republic of Korea 10.0 7.2 Malaysia 7.4 5.2 Thailand 5.8 6.4 Hong Kong, China-P.R. 4.7 5.7 India 4.3 4.3 Chinese Taipei 3.8 4.0 Philippines 2.4 3.4 Indonesia 2.0 2.5 New Zealand 1.9 2.1 United Arab Emirates 1.1 0.3 Vietnam 1.0 0.1 Macao, China-P.R 0.9 0.1 Sri Lanka 0.7 0.7 Israel 0.5 5.1 Others 2.4 3.4 Total (in percent) 100 100 Country
ICCA (2006) The above table shows that India‘s share has remained stable at 4.3% since 1997 despite increase in overall market. It also depicts that many countries have made substantial gains in this market. Their services have been the result of systematic planning to cash on the market opportunities. Regions, countries and even cities all are in race to slice their piece of MICE market. Dr. Surjeet Kumar, Asst. Professor, Department of Tourism & Hotel Management, Kurukshetra University, Kurukshetra. Email:
[email protected]
3
Indian Journal of Applied Hospitality and Tourism Research
Table 2 presents status of top 20 MICE cities in Asia pacific regions. It places Delhi at 16th position. Cities like Busan (South Korea) have experienced almost 95% growth. Table 2: Top 20 MICE Cities in Asia Pacific Region 2006 Rank
Country
Number of events organized in 2006 127 85 65 63 57 51 51 50 39 32 29 22 21 21 21 19 18 17 15 14
Number of events organized in 1997 44 43 22 28 39 36 53 28 08 31 26 22 13 01 11 13 25 08 14 09
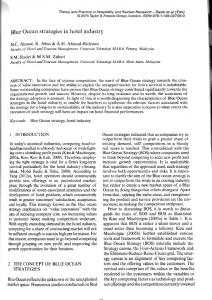
1 Singapore 2 Seoul 3 Beijing 4 Kuala Lumpur 5 Hong Kong 6 Bangkok 7 Sydney 8 Melbourne 9 Shanghai 10 Tokyo 11 Taipei 12 Manila 13 Brisbane, QLD 14 Busan. South Korea 15 Adelaide, S.A. 16 New Delhi 17 Kyoto 18 Perth, WA 19 Yokohama 20 Cairns, QLD Source: ICCA (2007) Figure 1: Chandigarh Capital Region
Per cent Increase 65.35 49.41 66.15 55.55 31.57 29.41 -3.92 44.00 79.48 3.12 10.34 00.00 38.09 95.23 47.61 31.57 -38.88 52.94 6.66 35.71
INDIA
..... 4
Special Issue: Hotel Operations Management – Issues and Challenges
Vol. 5, January 2013
The difference in growth rates values the basic issue of what makes a good MICE destination. From the view point of demand side, organisers and clients are knowledgeable and specific about their requirements. They want even the minutest need to be met. Supply side of MICE demands coordination at a very large scale. In India the supply efforts at top are initiated by the government by including MICE as are theme of incredible India campaign. It has identified few cities of New Delhi, Agra, Jaipur, Mumbai, Chennai, Bangalore & Hyderabad as potential MICE venues and building necessary infrastructure. According to MGI report (2010) Chandigarh capital region (Diagram 1) is witnessing the fastest growth rate and is one the most preferred destination to live after Delhi (National Capital Region). Chandigarh Capital Region or Greater Chandigarh consists of the Union territory of Chandigarh and adjoining areas lying in states of Haryana, Himachal Pradesh and Punjab (figure 1). The region acts as the central hub of northern India (north of Delhi). It includes cities of Panchkula, Mohali and other suburbs. Chandigarh is one of the planned cities in India, with world renowned architecture. Chandigarh is home to world famous Rock Garden, built from mostly from waste material. Another well known garden is the Rose Garden, Garden of Annuals, Fragrance Garden, Hibiscus Garden, Chrysanthemum Garden, Botanical Garden and Shanti Kunj.Chandigarh is already hosting mega international and national exhibitions and conventions like Agro Tech, Auto Shows and Consumer Fairs. The city has excellent Convention and Conference facilities. Mohali which is also known as S.A.S. Nagar, surrounds Chandigarh from three The key existing Infrastructure Installations in Mohali are International Airport, PCA Stadium – One of the Best International Cricket Stadium in India., Currently it doesn‘t possess any landmark MICE facility but Bids are already invited to make world class International convention center with a capacity of 4000 persons. Panchkula is one on the buzzing town of Haryana state. It is a hub of furniture & steel industry. Today many MICE service providers are such as hotels, travel agents, airlines, event management companies, convention centres and transport companies are providing services to transform the city into MICE destination. This paper explores what needs to be done to transform the ―city beautiful‖ Chandigarh into MICE destination.
Literature Review The importance of MICE is well reflected from researches taking place throughout the world. Due to its multiplier effect it has great significance in economic development of any nation. But for this, a huge infrastructural development is needed. MICE tourism has high expectations for the host place, it must possess the modernized exhibition venues, convenient traffic, accommodation of different grade, beautiful urban environment etc. (Xinli Xie & Qunchao Lu, 2006). This is supported by state studies of various centres. Singapore had 3,245 MICE events, up 7.8% and won 79 new because of good infrastructure is in place, efficient transportation networks, the latest information technologies and world class hotels. It says its superb conference and exhibition facilities as well as the premier shopping; dining and sight-seeing attractions provide the perfect complement to the conference experience (Singapore Tourism Board, 1999). Colliers International, (2008) puts Dubai‘s share in Middle East region MICE tourism at 30% of overall tourism visitor mass. IMEX research (2006) in its research identifies Germany as a MICE venue is rated on 10 factors. These are well organized, efficient and punctual, quality of public services, multi-cultural and tolerant society, reputation as a business-oriented destination, experience, reliability of transport, major airports, international outlook, professionalism of destination marketers and PCO‘s & technical know-how. This clearly shows the importance of MICE services & facilities. BCVB (2005) identifies Bulgaria has USP of MICE tourism is due to Accessibility (280 flights weekly), Accommodation (1500 rooms), Packages, & Entertainment (150 restaurants & clubs) Infrastructure. Business Tourism Partnership (U.K)(2003), highlight that in U.K the investments in a destination‘s infrastructure designed primarily for the MICE / Business tourist (hotels, transport and communications facilities, restaurants, attractions and amenities, even conference auditoria) provide benefits which can also be enjoyed by the leisure tourist and the indigenous population. Asia pacific MICE magazine (2008) in an interview with Frederic Bardin is Vice President of Arabian Adventures and Congress Solutions Dubai says that unprecedented expansion of Dubai‘s tourism and MICE infrastructure has prompted further development of Arabian Adventures. Now 5
Indian Journal of Applied Hospitality and Tourism Research
there objective is to make Dubai as world‘s leading MICE destinations. It is perfectly positioned to capture business from Europe, the US and Asia. We have over 105 airlines now flying to Dubai every week so it‘s very difficult to beat. Hong Kong, which is considered a hub, for example, has around 50-60 airlines flying in every week. We can get 40,000 to 45,000 people in to Dubai within three days for mega events. Kaisheng Zeng, Xiaohui Luo (2008), studies finds that Beijing Olympic Games has given a tremendous boost MICE reason the improvement in transportation and made travel more economically feasible. The increasing number of low cost airlines around the world also provides an alternative for travellers. Further they adds that the experiences and the ―legacy‖ of the Games, such as the large population of trained workers during the Games and the facilities used by the Games, will benefit China‘s MICE tourism industry, which will, in turn, stimulate China‘s inbound tourism GIBTM (2009) identifies the top twelve most important influencing factors when placing an MICE event in the Gulf/ Middle East. Which are Cost , Quality of accommodation, Quality of meeting facilities, Quality of service, Overall appeal of the destination ,Travel time to destination, Time of year, Security/safety, Availability of hotel rooms/venues, Visa procurement, International air routes & Weather. Government of India’s National Action Plan (1992) proposed that convention and conference tourism had great significance and therefore to encourage convention tourism, it was desirable to set up fully integrated convention complexes so that, more and more international conferences and conventions could be attracted to India. National Tourism Policy, Government of India (2002), mentions that India, despite its size, significance and attributes with world cities such as New Delhi and Mumbai, receives a minuscule proportion of global meetings, incentives, conventions, exhibition (MICE) market with only 97 international conventions bringing approximately 25,000 people in 2001, therefore, it is imperative for India‘s tourism development but also for development of international and domestic trade and commerce, that India construct a world class international convention center in Mumbai. WTTC (2003), ―The MICE segment will be the important driver for corporate travel in India, enhancing traffic to key cities Mumbai and Delhi, while increasing traffic to emerging nodal towns like Pune, Hyderabad and Bangalore.‖ In line with this, in the year 2005 Budget Speech the Finance minister of India has shown intention of setting up of world-class convention centre at New Delhi, Jaipur, Agra and Mumbai on the basis of Public private partnership (PPP) format. MICE in ASIA Magazine (2008, Jun) India enter into MICE tourism in 1991 with the start of economic reforms. As the economy starts flourishing, the country has started upgrading its MICE facilities. Hyderabad International Convention Centre (Hyderabad), Epicentre (Gurgaon), India International Expo Centre (Greater Noida) is few states of art world class facilities to name few. Department of tourism (2003) in ―20 year Perspective Tourism Master Plan for Chandigarh‖ has suggested few strategic projects develop Chandigarh which include to transform the Chandigarh into convention city to attract the MICE segment. ICPB (2007) in its newsletter has mention Chandigarh as an important MICE destination. Punjab tourism (2011) has already invited bids for the construction of convention venue at Mohali near Chandigarh with a capacity of 3000 persons. From the above review it emerges that Chandigarh can play a significant role in MICE tourism as this is one of the fastest growing fields.
Objective The study is exploratory in nature in the absence of directly related previous studies for reference. The purpose of the study is to analyze the opinion of MICE service providers and MICE customers regarding MICE tourism in Chandigarh region. After careful analysis of secondary literature two service providers travel agents & hotels were taken and MICE customers are chosen. Objective of proposed for the study is: To study opinion of MICE service providers (hotel & travel agencies) & customers on present and future prospects of MICE tourism in Chandigarh region. Sample For Service providers (Hotels & travel agencies) data collection was done from Chandigarh Capital region and for MICE customers the data was take from India as corporate have their headquarter in different parts of India Chandigarh has been a favorite destination in north India to live. It holds ..... 6
Special Issue: Hotel Operations Management – Issues and Challenges
Vol. 5, January 2013
number of MICE event. A structured questionnaire was designed for Hotels & travel agencies (service providers). The sample composition is as in table 3. Sample elements MICE organizers hotels & travel agencies are the sample elements. The composition is given in table 3. In all, forty service providers were identified & selected from above mention cites. While selecting MICE customers (forty) convenience sampling was used since they are spread throughout India. Table 3: Sample Elements in Composition Chandigarh Capital Region 20 20 40
Sample Elements Hotels Travel Agencies Corporate Total = 80
Total 20 20
The detailed profile of the sample elements is given below in table 4: Sample Elements Hotels Travel Agencies Corporate
Table 4: Profile of Sample Elements Sub Total Star / chain hotels 08 Independent 12 Big / Medium 16 Small 04 National 16 Multinational 24
Grand Total 20 20 40
Methods of data collection Primary Data: is collected through preparation of specifically designed questionnaire consisting of various aspects of MICE segments and also through conducting various interviews and discussions with executives related with MICE industry. Secondary data: is collected through a detailed analysis of plans related to Chandigarh
Data Analysis Profile of MICE Service Providers Twenty hotels and travel agencies dealing in MICE were surveyed (table 5).
VARIABLES Deal with MICE
Areas of MICE dealt with
Level of MICE
Table 5: Profile of MICE Service Providers HOTELS N (Valid Percent) Yes 20 (100%) No ---Meetings 20(100%) Incentive travel 14(70%) Conventions 20(100%) Exhibitions 18(90%) International 10 (50%) National 20(100%) 501-1000 4(11.7%) 1000 & above 8(23.5%)
T. A N (Valid Percent) 20(100%) --20 (100%) 17(85%) 19(95%) 17(85%) 16(80%) 20(100%) 2(5%) 1(2.5%)
Majority hotels (100 per cent) and travel agencies are dealing in MICE. Further it is observed that both of them are operating in all the major areas of Meeting, Incentives, Conference and Exhibitions. Hotels and travel agencies bring all service providers together and offer a package. Majority of them have handled less than 500 corporate clients (table 6).This only suggests towards the pyramid structure of industry where bigger players are few. Profile of MICE customers From the table 6, it can be inferred that all forty corporate (100 per cent) are buying MICE related activities. Majority of them (35.9 per cent) are buying MICE product before 1980. All corporate are buying all the components of MICE such as Meeting, Incentive, Conference and Exhibitions. All (100 per cent) are buying MICE products both at national & international level. Majority of them (57.5 per 7
Indian Journal of Applied Hospitality and Tourism Research
cent) are from Information Technology and Information Technology Enable Services. This also highlights India‘s current strength in Information Technology sector. Table 6: Profile of MICE customers Features of MICE customers Organize M.I.C.E
Organizing M.I.C.E
Type of M.I.C.E activities
Level of M.I.C.E
Company type
Yes No Before 1980 1981-1985 1986-1990 1991-1995 1996-2000 2001-2005 2006 onwards Meetings Incentive travel Conventions Exhibitions International National Both IT & ITES Engineering & Auto Engineering Automobiles FMGC Pharma Others (Banking, Reality, Steel, Mobile, fertilizers etc.)
MICE customers N (Valid Percent) 40(100%) --14(35.9%) 6(15.4%) --4(10.3%) 4(10.3%) 5(12.8%) 6(15.4%) 39(100%) 38(100%) 39(100%) 40(100%) 37(100%) 37(100%) 39(100%) 14 (35%) 7 (17.5%) 5 (12.5%) 3 (7.5%) 2 (5%) 9 (22.5%)
The opinions of twenty hotels and travel agencies each were taken on a five point Likert scale on following 20 items which include 10 questions on present status, 5 on future status, 03 descriptive questions were asked about marketing strategies & 02 questions were asked about government policies. After careful analysis, a SAP LAP analysis was prepared for Chandigarh city.
Analysis For analysing the data for meaningful results SAP-LAP analysis is done. The SAP-LAP model (Situation Actor Process–Learning Action Performance) is an innovative and holistic framework for case analysis (Sushil, 2001). In this model, the case is analyzed with respect to the mentioned heads and their interdependence is studied to gather learning from the case. Based on SAP-LAP framework, following generic steps can be used for analyzing any case. Understanding Situation: In this step, we bring out key points of the emerging situation of the case in terms of historical perspective, external environment, competition, government policies, market condition, organizational performance and so on. Major Actors and their Roles: Identification of key actors in the case and their roles, relationships, world views and freedom of choice are to be summarized. Usually, this aspect of case analysis is not well addressed in the traditional case methods. Evolving Process: In this step, we critically analyze the key process (es) evolving in the case and portray their key issues. The processes could be of any type as discussed previously. Key Learning Issues: The analysis carried out in SAP framework leads to synthesis in terms of key learning issues for the case. These can be of two types: (i) generic, and (ii) specific. The generic issues are in terms of lessons learnt from the case that can be generalized by synthesizing the lessons from other cases. The specific learning issues are linked directly with the case under consideration and are either expressed in terms of the problem areas or in terms of the objectives to be achieved. Suggested Actions: Based on the specific learning‘s of the case, alternatives are to be generated and evaluated. Based on this, actions are to be suggested to improve/resolve the case problem. Expected Performance: Finally, the impact of suggested actions on performance is assessed so as to justify the actions. The above methodology can be applied for case analysis using a variety of quantitative or qualitative tools and can be presented in a bullet form or using tabular presentation. ..... 8
Special Issue: Hotel Operations Management – Issues and Challenges
Vol. 5, January 2013
Implementation of Sap-Lap Analysis Tool With an objective to find different measures to make Chandigarh (the ―city beautiful‖), a MICE destination the opinion of MICE service providers (Hotel & Travel agencies) and MICE customers are presented with the help of SAP-LAP Analysis tool. In this model, the case is analyzed with respect to the mentioned heads and their interdependence is studied to gather learning from the case. Situation Q1. How MICE tourism is managed? The MICE tourism in Chandigarh is highly fragmented. Thought CITCO is the nodal agency works under UT administration to help the MICE service providers to bring the international MICE events to Chandigarh. At domestic level these MICE events are directly managed by MICE service providers. Q2. What is the current status of MICE tourism in Chandigarh? At domestic level, Chandigarh has a nice charm for MICE events but at international level Chandigarh has hardly any MICE event to display. Q3. What is the potential of MICE tourism in Chandigarh? MICE tourism can be an answer to many answers. It is cleared from the review of literature & MGI report (2010) on Indian cities that it is one of the most preferred destinations of northern India after Delhi (NCR). This also reflects the huge potential for MICE tourism. Actor Q1. Who are the actors in MICE tourism management? MICE service providers – Major MICE service providers are hotels, travel agencies, airlines, transport/ car rental companies, event management companies and convention venues. Policy Makers- Centre & State governments, union administration and others nodal organizations involved in planning of MICE such as ICPB, FHRAI, HAI and CITCO etc. MICE customers- all the persons who are going for MICE activities. Q2. What are their views? All are Positive about MICE growth in Chandigarh. Q3. Is there any freedom of Choice? - Service providers can work on site & off site from where they want to generate MICE business. - Increase comfortable level and will become more competitive. Process Q1. What is being done to improve MICE tourism in Chandigarh? - Improving the existing infrastructure of city. - Encouraging Public Private Partnership (PPP) mode for construction of dedicated venues as they require a huge investment. Already bids are invited for Chandigarh international convention centre. - Centre & state governments are giving financial assistance to these projects. - Improving connectivity of these cities. Metro project are already in pipeline. Q2. What should be done to improve MICE tourism in Chandigarh? - A new department or cell should be carved in CITCO. - A research cell should be setup for keep the record of MICE components & it can also find new ways for continuous improvement of the MICE - Northern Indian Universities and Institutes should be encouraged for launching dedicated courses related to MICE. - Students should be made more aware about MICE in Chandigarh and nearby region. Q3. What else should be done to improve MICE tourism in Chandigarh? MICE suppliers like hotels, travel agencies, airlines, transport/ car rental companies, event management companies and convention venues should come forward in improving educational infrastructure of MICE in Chandigarh and nearby region. Chandigarh administration should closely observe about the strategy of their competitors are taking to match the demand and supply gap of MICE.
9
Indian Journal of Applied Hospitality and Tourism Research
Learning Q1. What is the key issue related to the MICE tourism in Chandigarh? - Absence of available data related to MICE tourism. - There is a great interest for holding MICE tourism in Chandigarh and India as the confidence of world business community is increasing in Indian economy. - Indian students are still unaware of MICE concept. - Chandigarh is still not prepared for holding world class MICE events. Q2. What are the key issues related to the actors involved in MICE tourism? - The MICE policy Makers and MICE service providers should come together to analyse the shortfalls in Chandigarh. - There is a need to frame a dedicated MICE policy for Chandigarh -They should launch an aggressive market campaign to know the youth more about it. Q3. What is the key issue related to the process? - No exact figures available related to MICE tourism in Chandigarh. - Collectively all the stakeholders of MICE should try to bring more and more MICE events to Chandigarh. - Chandigarh should identify their key competitors and chalk out plan to compete with them. Action Q1.What should be done to improve the current and future status of MICE? - Big awareness campaign is needed. - Government should provide more incentives to encourage foreign investment in Chandigarh. - More benefits should be given to international organizations that are holding MICE events in Chandigarh. - The government of nearby states should establish dedicated institute for MICE training. Q2. What should be done to improve the actors involved in MICE tourism? - Collective marketing plan for cities. - All should come together to bit for an international MICE events. - More awareness campaigns are needed general public to develop a positive & pride for their city. Q3. What should be done to improve the process? - Attract more MICE service providers in promoting Chandigarh as MICE destination. - All the service providers should form a MICE consortium for promoting Indian cities which includes Chandigarh. - Single window clearance for MICE events should be there. Performance Q1. What will be the impact on the MICE tourism? - More MICE events will come to India and Chandigarh. - The Indian states will have the economical benefit. - Multiplier effect in economy as these tourists is spendthrift. - Contribution in employment generation. Q2. How will the actors of MICE be affected? - More opportunities for them. - They will become more cultural sensitive. - This will lead to more diversification & specialization. Further it can be understood with the help of figure 2. CONCLUSION The Chandigarh region holds a great potential to emerge as future MICE destination of North India. Looking at the economic significance government should take initiative to promote MICE. Based on SAP – LAP analysis finding, the following recommendation can be made for tourism policy makers and MICE tourism service providers like hotels & travel agencies. Suggestions for Policy makers Cognizance shall be taken of the importance of MICE tourism so that essential policy & infrastructure support is rolled out. ..... 10
Special Issue: Hotel Operations Management – Issues and Challenges
Vol. 5, January 2013
The role of Chandigarh Industrial Tourism Development Corporation. Ltd (CITCO) shall be relooked to make more competitive and result oriented in development of MICE related product in Chandigarh region. Knowledge base shall be created in the area to be shared with service providers.
Learning
Big awareness campaign
Absence of available data Chandigarh as MICE destination is becoming popular
Incentives in MICE sector
Need to frame dedicated policy
Collective marketing plan
Action
Chalk out plans to compete with competitors erformance
P
Creating awareness among general public
MICE tourism is Single window highly fragmented. clearance
More MICE events in Chandigarh
Multiplier & economic benefit
MICE can be answer to many problems of Chandigarh future employment problem.
More opportunities
Process
Situation
Increase in cultural understanding Improving existing infrastructure of Chandigarh
Creation of dedicated MICE tourism cell
Actor MICE Service providers
Improving educational infrastructure
Policy Makers (includes Center & state government)
Freedom of Choice Figure 2: SAP-LAP analyses of MICE Market in Chandigarh region MICE customers
Suggestions for service providers Service providers shall develop more effective network for cooperation in Chandigarh region. World class deliverables shall be developed for Chandigarh. The city administrator should develop the strategies to market Chandigarh. 11
Indian Journal of Applied Hospitality and Tourism Research
References Asia pacific MICE magazine page 36-37 BCVB (2005), General Framework of Convention Tourism. Business Tourism Partnership (U.K), (2003) Business Tourism Briefing An Overview of The UK‘s Business Visits And Events Industry. Colliers international UAE (2008), Dubai Real Estate Overview, Vol 2 p5. Department of information chdit.gov.in/think_chd.pdf
technology
(N/A)
Think
Chandigarh
A
comprehensive
Guide
retrieved
from
GIBTM(2009), 3rd Middle East Meetings Industry Research Report 2009 ICCA, (2007). The international Association Meetings Market, 1997-2006. Statistics Report. IIMB & ICPB, (2001). India as a Global Conventions destination, Prospects and Strategies, Ministry of tourism, Govt. of India. www.tourism-gov.in/surveys IMEX Global Data Exchange (2006, Aug) How international decision-makers view Germany as a destination for meetings and incentive travel, IMEX research Kaisheng Zeng, Xiaohui Luo (2008) China‘s Inbound Tourist Revenue and Beijing Olympic Games 2008 China & World Economy / 110 – 126, Vol. 16, No. 4, 2008 National Action Plan for Tourism (1992). Ministry of Civil Aviation and Tourism Govt. of
India.
National Tourism Policy (2002). Dept. of Tourism, Ministry of Tourism and Culture, Govt. of India. Singapore Tourism Board (1999), Gaining Momentum. Sushil (2001), SAP- LAP Frame work, Global Journal of Flexible Systems Management vol. 2, No. 1, pp 51-55 The Economic Times (2008, Aug 6). India aggressively tapping MICE tourism market. Xinli Xie & Qunchao Lu (2006), the Economic and Social Effects Analysis of MICE Tourism, International Journal of Business and Management (April)
-------------------------------------------
..... 12
Special Issue: Hotel Operations Management – Issues and Challenges
Vol. 5, January 2013
Mega Events - The Impact of the Commonwealth Games on the Hotel Industry Abstract This research considers the factors that affected the hotel industry over the period of the Delhi India Commonwealth Games. It begins by evaluating the accommodation pre-games anticipations for hotel rooms; it then looks at what happened during the Games and the impact on hotels. The data were gathered through a number of structured interviews held with hotel senior management. The analysis used a thematic approach to understand and make sense of the large amount of data collected. The research demonstrates that the decisions made by senior hotel management at an early stage of the planning had a large impact on the overall success of the hotel during the Games period. It also demonstrates that a number of unexpected external factors also influenced the success of hotels during the Games period. Key Words: hotel, occupancy, Commonwealth Games, sports, mega-event.
Introduction The Delhi India Commonwealth Games represented a very major investment for both public and private businesses in Delhi with both parties having different expectations of the outcome. Hiller (1998) looked at the multi-faceted influences of these types of events and suggested an economic model showing how the different external influences come together. To be able to obtain the maximum economic return as suggested by Chalip (2004) there needs to be appropriate strategic plans in place. A review of the literature identifies that there are actually a number of positive and negative impacts (Preuss and Solberg, 2006). However there is a perception that the organisation of such events becomes event leverage strategy goals (Chalip, 2004). This research specifically focuses on the hotel sector and the impact that the games had. While projections indicated there would be a need for large numbers of additional hotel rooms and that all hotels would be full, when the time came, the reality did not meet the expectations (Singh, 2010). The data for this research comes from focused interviews held with senior managers of major five-star hotels in the Delhi NCR (National Capital Region) which comprises the cities surrounding Delhi, e.g. Gurgaon, Ghaziabad, Noida etc. Through the interviews it was evident that the number of new hotels planned for the Commonwealth Games did not actually materialise, some opening only partially. If all of these properties had been available at the time of the Games then the situation for the whole industry would have been a great deal worse. The Commonwealth Games Organising Committee undertook firm contracts with many hotels at least a year before the Games and then cancelled many of the reservations at short notice. During the interviews it was suggested that the adverse media reporting un-nerved many international guests, which lead to many sports followers and relatives cancelling their plans to visit during the Commonwealth Games period.
Literature Review The hosting of large sports events such as the Commonwealth Games has traditionally been viewed by the host city as a way of stimulating the economic environment in the city (Nemeth, 2010). To be able to obtain the maximum economic return as suggested by Chalip (2004) there needs to be appropriate strategic plans in place. A review of the literature identifies that in relation to international sports events there are a number of strengths and weaknesses along with positive and negative impacts (Preuss and Solberg, 2006). There is however an interest from cities to host large mega events as they can accelerate infrastructure projects (Terret, 2008), enhance destination image and awareness levels and offer economic stimulation to the host city (Malfas et al., 2004). As a result of this perception the organisation of such events becomes event leverage strategy goals (Chalip, 2004). There is a perception that the event will have an impact on expenditure within the community by those attending the event and this in turn will have an impact on employment (Hiller, 1989). In addition the extra media coverage is thought to have a medium to long term impact on the perception of the city as a tourist destination (Horne, 2007). It has been argued that the economic impact analysis of events and tourism has been the source of not only one of the more frequently reported types of research in tourism, but also one of the least correctly applied (Crompton and McKay; 1994). The literature indicates four economic tourism impacts of mega events such as the Commonwealth Games in that the event will increase tourism at the time of the event, it will encourage event visitors to return, tourists visiting the event encourage friends back home to visit the country and finally the media coverage given during the event (Preuss 2004). The cost of hosting mega events such as the Commonwealth Games has increased very significantly but even with the large cost cities ‗line up‘ to be able to hold such events (Holloway 2006; Yongjian 2008). Bhupesh Kumar, Banarsidas Chandiwala Institute of Hotel Management, Kalkaji, New Delhi, Email:
[email protected]; and Dr. Tim Lockyer, Department of Tourism and Hospitality Management Waikato Management School, University of Waikato, New Zealand. Email:
[email protected]
13
Indian Journal of Applied Hospitality and Tourism Research
An important part of almost all mega events is the hotel and other forms of accommodation available for the tourists. As the planning for a mega event begins so does the awareness of the need for accommodation for the influx of visitors. From 2003 when the 2010 Commonwealth Games were awarded to Delhi there were a lot of projections in relation to the impact this would have on the hotel industry. Comments such as ―The hospitality sector is another area that is estimated to grow rapidly in the coming years, with the help of the Commonwealth Games‖ were widely expressed (Ghosh, 2006) with what was referred to as ―experts‖ saying that there was a wide gap between supply and demand of hotel accommodation in Delhi and forecasting that an additional 20,000 rooms would be required to cater to the tourist inflow into the city during the time of the games (Singh, 2007). Another estimate put the requirement at 30,000 rooms for 2010 (Ghosh, 2006). In the light of these projections the Delhi Development Authority auctioned over 20 sites for hotels, many in the vicinity of the games village. This was to add approximately 7500 rooms, while at the same time raising hundreds of millions for the Delhi Development Authority. In 2006, which was 4 years before the start of the Commonwealth Games, there were 6,500 rooms which had a star rating and about 7,000 rooms in the budget category (Ghosh, 2006). While projections indicated there would be a need for large numbers of additional hotel rooms, when the time came, the reality did not meet the expectations (Singh, 2010). The purpose of this research is to evaluate the decisions and actions taken by hotel management in Delhi and the resulting influences that these decisions had on individual hotels and the industry overall in light of external factors which were not easily discernible for the period leading up to the games. This paper discusses how different hotels dealt with the issues around the Games, the decisions that management made and the results of these decisions.
Methodology The data for this research derive from twenty digitally recorded interviews held with senior managers including general managers, assistant general managers, accommodation managers and food and beverage managers during 2011. The interviews took place in major five star hotels in the Delhi NCR (National Capital Region) which comprises the cities surrounding Delhi, e.g. Gurgaon, Ghaziabad, Noida etc. both in the central business area and in the surrounding NCR areas. The selection of the hotels was designed to include a number of different types and locations of hotels. The research included hotels that had a contract with the Commonwealth Games Federation for the supply of accommodation and those that did not. The research also included well established hotels and those that were developed specifically for the Commonwealth Games. The four hotels that will be discussed will be referred to as hotel A, B, C and D. Hotels A and B were central city, five star hotels; hotel C was located a little further out from central Delhi but inside the Games area and was a five star hotel; Hotel D was located near to the centre of Delhi and was also a five star hotel. The interviews were semi-structured with the same basic starting questions being asked in each of the interviews. These questions included such items as ―During Commonwealth Games, was your hotel occupancy similar to same period last year?‖; ―What were some of the main issues you experienced over the Commonwealth Games period?‖, ―How did you deal with staff and training before and during the Commonwealth Games period?‖, ―What was the revenue from other outlets? Was it higher or lower during the Games period?‖, ―What issues did you experience with the Commonwealth Games Organising Committee?‖ For this research thematic analysis was used. The purpose of thematic analysis is to identify a limited number of themes which adequately reflect textural data (Boyatzis, 1998). Familiarity with the data is an important part of the analysis. This was done in a two-step process. First a research assistant who did not participate in the interviews reviewed the text and from that identified the themes. This analysis was then discussed with the main researchers and the data were coded after discussion (Howitt and Cramer, 2008). From the coding, themes were identified which integrated substantial sets of the codes (Neuendorf, 2002). The main coded themes identified two clear parts to the thematic analysis. These fell into the external factors outside the control of the hotels and the factors that were controlled by the hotels. The themes were as follows: 1. Factors external to the hotel: Impact of public holidays during Games period; Holiday trends during the Games; Impact of security during the Games.
..... 14
Special Issue: Hotel Operations Management – Issues and Challenges
Vol. 5, January 2013
2. Factors under the control of the hotels: Hotel occupancy; The impact and decisions relating to other hotel outlets; The hotel staff and their role in the hotel operations during the Games period. The details of the themes will be discussed in the following section of this paper. Direct quotations from the interviews are presented in inverted commas and detail exact responses and thoughts held by those in management positions who were interviewed.
Data Analysis As previously indicated two themes were identified. The analysis of the data will begin with an analysis of the factors external to the hotel. These factors are important as they help to put the decisions made by various hotel management into context. 1. Factors External to the Hotel: The international experts who were employed by various organisations to give consultancy projections from 2006 right up to six months before the start of the Games proved to be hugely incorrect. Demand forecasting seriously over-inflated the number of rooms that would be required. When it came to the time for the Games, in fact no significant change in occupancy was noticed. It seems that the experts did not foresee the number of people from Delhi who would travel outside of India during that time, the number of businesses that would stop operating in Delhi and the limiting effect that security measures restricting movement in and around the Games areas would have on requirements for hotel rooms. Planning for the Commonwealth Games started many years before the date of commencement. At a very early stage in the planning, public announcements were starting to be made from various government organisations that an additional 4,000 quality hotel rooms would be required (Anurupa and Singh, 2008). As a result a number of hotel groups started planning for additional hotels to be built for the Games. Local managers advised during the interviews that ―...there would be approximately 100,000 additional tourists over the games period but this actually was about 20,000‖. As evident from the thematic analysis the reasons for the Games not meeting the volume of business that was expected falls into a number of specific areas. During the interviews it was clear that ―... the number of corporate guests had also decreased significantly‖ and this was impacted by ―... companies sending out the message that staff should not travel to Delhi during the Commonwealth Games period because the room rate would be very high‖. At the same time there was a ―... reduction in the number of local tourists as many had left Delhi for Singapore, Malaysia and Hong Kong‖. These cities directly promoted themselves saying ―... get away from the Commonwealth Games and come here.‖ Also during the Games period ―... cities such as Hong Kong reduced their rates so that anyone could afford to go there‖. In addition to the attractive promotional deals offered by various destinations in the region, during the period of the Games schools were closed for fifteen days. Because the young people were not attending school many parents took the opportunity to take a holiday. At the same time because of projected road closures and impacts of the Games on day-to-day operations many businesses in the central Delhi area stopped operating or transferred their operations to other parts of India including completely moving their staff to other cities for the period the Games were running. As a result there was little normal business being conducted in Delhi during the Games period. In Delhi corporate businesses told their staff to take holidays and not to come to work because of the problems with travelling and the concern that they ―... would be late to work every day‖. In addition the number of international visitors to Delhi was a lot smaller than anticipated. It is also important to note that the Games Organising Committee pre-booked a large number of rooms in October-December 2009, approximately a year prior to the Games, in some cases almost all the rooms available in a hotel. At that time the hotels gave the Organising Committee specific details of what the room rate would be and the number of rooms available. During the time of the Commonwealth Games there was increased security within Delhi and this level of security impacted negatively upon hotels. There were many roads that were closed. Also the movement of hotel guests was restricted. The additional security meant that potential guests were discouraged from travel and booking into and using hotel facilities. 15
Indian Journal of Applied Hospitality and Tourism Research
2. Factors under the Control of the Hotels: As indicated previously a major theme that was evident from the analysis related to hotel room pricing strategies. This first section of the data analysis will consider how each of the hotels included in the research dealt with the question of room pricing and allocation of rooms for the Games. At hotel 'A' the management followed a specific policy relating to room pricing which was that ―The room rate should be moderate‖ and hotel management reported that they increased the room rate very little for the Games. In their interview management commented that from their observation this approach was different to other hotels that saw the Games as an opportunity to ―... make a killing‖. Hotel ‗A‘ also indicated that they viewed the Games as part of a ―... long term strategy to attract guests in the future‖. It is important the note that for this hotel this strategy was adopted from the beginning of the planning process including the allocation of rooms from when the Games Organising Committee first approached the hotel asking them to tender for rooms to be booked. Management of the hotel reported that part of their strategy was to also ―... give support to the Games village‖ and by doing so felt that their involvement and support for the Games assisted them in the long term. It is important to note that for this hotel there was no reduction by the Organising Committee in the number of rooms allocated. In the interviews it was stated that it was the belief of the management that their pricing strategy was the reason although there was no firm evidence of this. At hotel 'B' they followed quite a different pricing strategy to Hotel ‗A‘. Management from the original start of planning made the decision to increase prices for rooms very significantly. This was done, they reported, because they ―... had expected the occupancy to be very high – we increased the room rate very high.‖ As a result the room rates were increased by an average of 75 percent. In the interviews management reported that the normal occupancy of the hotel would have been 82 percent but during the Games period the occupancy reduced to 70 to 72 percent. Some of the reasons given by management for this were explained as ―... the high paying cooperatives were not travelling at that time‖. In addition, ―A lot of companies moved their sales teams out of Delhi‖ for the period of the Games along with many other businesses moving their staff out of Delhi. Management at this hotel reported that when the original bids for rooms were undertaken in October 2009 there seemed to be ―No complaints about the room rates – they were expecting higher rates‖ and that the rates quoted were accepted and rooms reserved. However, as reported in the interviews, it is of particular note that ―... 20 days before the Games the Organising Committee said they did not have any bookings to give to them and requested the hotel to release all reserved rooms‖. The hotel re-visited their planning – although they said it was already too late – they looked at what the competition was offering and tried to find ways to differentiate their product from other offerings.‖ The management reported that overall the Commonwealth Games was not a success for their hotel. The way this hotel adapted to the cancellation of room reservations by the Organising Committee was to focus on those relatives and supporters of those participating in the Games. Management believed that ―... 20 percent of the guests were those related to someone competing in the Games‖. At hotel 'C' during the games period ―... all 208 rooms were fully sold out‖. In the case of Hotels ‗A‘ and ‗B‘ the Games Organising Committee contacted the hotels and made bookings a year before the Games, but in the case of this hotel (‗C‘) as it was new the bookings came a lot closer to the Games starting date and they had confirmed bookings for about ―100 rooms for the two weeks.‖ It was reported in the interview that 90 percent of occupancy was from media or through the Games Organising Committee room allocations. They also reported that they did not have the cancellations the other hotels had because their bookings from the Organising Committee were made very close to the start date of the Games and were confirmed from the start because of the opening dates of the hotel. In relation to room rates this hotel reported that they ―... kept them normal. The rooms for the Games period were not increased in price‖. It was of note that in the interview with the front office manager who had developed this strategy he said that ―... initially there was resistance from the general manager on the pricing strategy – he took some persuading. But his decision was very wise – it could have gone completely the other way‖. It was also of note that when the Organising Committee approached this particular hotel to discuss the allocation of rooms ―… they made it very clear what they could and what they could not pay.‖ Management in this hotel made the statement in relation to other hotels that ―... raising of the price seems to have backfired on some hotels giving them overall very low occupancy.‖ Hotel 'D', an established hotel that was renovated in 2009 in preparation for the Games, with planning beginning in 2003 made a conscious decision to limit the number of rooms to the Commonwealth Games as they decided that ―... if the Games did not go well the impact would not be ..... 16
Special Issue: Hotel Operations Management – Issues and Challenges
Vol. 5, January 2013
such a problem for the hotel‖. The hotel‘s pricing strategy for the Games period was initially optimistic anticipating a much higher room rate than normal over the October Games period but in reality the ―... room rate was similar to a normal October‖. The hotel, again like others, reported that there was a lot of anticipation in relation to a large increase in the number of guests staying in the hotel. However the normal occupancy in October is about 85 percent and during the Games period it was also 85 percent. During the Games period many of the guests that stayed were delegates, officials, sports persons and media people and these were on a contracted room rate. Although initially there was 30 percent of the hotel booked by the Games Organising Committee, one month before the Games this booking was cancelled. At that time hotel management ―... started to plan how they could increase occupancy‖. It was of note that the hotel at that time was less interested in room rate but rather in filling the rooms. To this end they contacted all of the various country committees to see if they had any family members attending the Games. However because these people were not being paid for by the government they were more price sensitive. The next incentive they looked at was sponsor teams and people that were brought in relating to sponsorship. Finally the hotel started contacting the technical teams directly rather than relying on the Games Organising Committee.
Other Outlets A hotel does not only operate successfully by selling rooms. There are any other aspects of a hotel‘s operation (restaurants, bars, banqueting) which can significantly affect the financial success of the hotel. This section will consider how each of the hotels participating in the interviews approached the management of other outlets. At hotel 'A' management reported that the policy of moderate pricing that was applied to room rates was also applied to other outlets, for example ―... selling prices were controlled in the lounges with only a 10 percent mark-up over cost‖. One of the reasons for this pricing strategy was that during the Games period there were a lot of security restrictions ―... on people getting into the hotel‖, and this significantly reduced the normal trade in the hotel outlets. An additional reason for the moderate pricing strategy in hotel outlets was that in addition to normal facilities the hotel provided a lounge for the media for 17 days for 24 hours a day. Special menus were arranged and the hotel felt that they ―... did everything possible to satisfy the guest‖. As a result as reported in the interviews the ―... revenue from them was less‖ during the Games period. This hotel included a number of items in the room price which impacted on their other outlets for example breakfast was included in the room rate; in addition 300 lunch boxes were prepared every day (also included in the room rate). There was some additional income for the hotel through arranging various sightseeing tours. Overall management reported that the decisions and actions they had taken contributed positively to their operational success. At hotel 'B' during the Games period it was reported that the ―... revenue from local guests was down because of traffic restrictions‖. Because people were not able to travel and because of the security restrictions it was very difficult for people to actually enter the hotel. It therefore was noticeable that people were not using the hotel‘s outlets. As a result of the low room occupancy and the lack of local traffic the revenue in the other outlets was reduced during the Games period. At hotel 'C' the other outlets increased significantly. The food and beverage outlets had complimentary arrangements for people staying in the hotel as part of the contract. Management particularly emphasised that ―The Australian group were big spenders in the bar.‖ As the hotel was away from the central business area there were ―... not many food and beverage options around the hotel.‖ An additional advantage of this hotel seems to be that because it is located away from the main central area of Delhi the level of security was less and this meant that ―food and beverage did very well; they were a lot of additional people coming in to meet the various people staying in the hotel.‖ At hotel 'D' it was reported in the interview that there was a positive financial gain on food and beverage outlets. This was higher than normal as guests were regular and corporate, but it was still less than anticipated. The reason that the revenue was higher was that ―... there was the same people staying in the hotel for an extended period and they were regular users.‖ Overall the volumes did increase but the spend per person did not increase as anticipated.
Staff and Training An important part of any hotel is the staff that they employ. This section of the paper deals with the interview questions that related directly to the staff and their training. At hotel 'A', part of a chain of hotels, management reported that it proved fairly easy to move staff to the hotel period from other properties during the Games. The staff brought to Delhi ―... were given accommodation and arrived about a month before the games.‖ In addition to the hotel staff there were ―... 150 security persons in 17
Indian Journal of Applied Hospitality and Tourism Research
the hotel provided by the government.‖ The management was asked about the training given to staff in the light of the multi-national nature of those attending the Games. The approach taken was of particular interest, as management reported that ―Because of the multiple languages spoken by the guests it was impossible to give specific language training. As a result training was given to understand body language‖. This was reported to be very successful as ―... if you do not know the language but can judge from the body language what the guest wants you can customise your service towards that.‖ Other training included teaching ―... the staff how not to say no‖ and ―how to be attentive‖. In addition training was given to the staff on ―... how to conduct themselves so that no negative impressions were left.‖ At hotel 'B' the researchers were surprised that management reported that ―... there was no additional training undertaken with the hotel staff‖. The reason given for this was stated as being the ―reduction in the occupancy.‖ At hotel 'C' because of the newness of the hotel and the fact that the hotel only became fully operational shortly before the Games no additional training was given to the staff. However, management did report that ―The staff became over enthusiastic in relation to guest service – and they needed to back off a bit.‖ The staff needed to realise that for many international visitors ―Service is good when you ask for it.‖ At hotel 'D' a lot of additional members of staff were added but the result was that there were too many staff during the Games period. The hotel ―... went through a lot of customer sensitisation training which was very broad-based because the nationalities came from all over.‖ This training was ―... attitudinal and body language based as well as situational and food based.‖ Of particular note was that training was given in relation to eye contact. The reason for this was that India has a history of the practice of Namaskar, with folded hands and eyes bowed for respect. In India there was never a manto-man talk, it was always the master-to-servant. For many of the staff this was very difficult and as a result the hotel undertook ―meeting and greetings training and exercises.‖ As reported ―If there is no eye contact, there is no recognition of body language and there would be no communication.‖ Another problem with local customs was because ―... when an Indian means yes they never actually say yes, they move their head side to side and foreigners are not able to interpret the meaning‖. The training involved learning how the guest wants to be treated, ―... but also to show what our values are‖. When asked if the training given has had a long term positive effect it was reported that between staff members yes it has but between guests no, ―... it is probably too early to expect a positive improvement‖.
Impact on Hotels Overall For hotel 'A' when asked what was the overall financial benefit of the Games to the hotel they reported that the hotel received over the Games period ―... at least 15 percent more revenue than over a comparable period‖, however the overall benefit was counteracted by the additional staff, security requirements and other operational factors. It was very noticeable to the researchers that the management were confident that they had made the right decisions, especially on room pricing. There was a strong feeling that those decisions had benefited the hotel over the long term. When asked what advice the management would give to fellow management internationally they said that the hotel should ―... have packages for different requirements of the guests‖ and to ―Ensure that people visiting experience the local ‗flavour‘ ‖. For hotel 'B' again management were asked in the future for another Games what they would do differently, it was stated by one manager that ―I would study the market – most of the hotels had put their eggs in the Commonwealth Games basket and when it backfired it financially impacted a lot of hotels. The same thing happened in the China Olympic Games – we just did not do our research properly‖. For hotel 'C' although initially there was resistance to the pricing strategy that was adopted by this hotel, because it opened late the overall result was successful. ―Having realistic room rates is key to getting any big event in a country. Everyone got so greedy with the Commonwealth Games - if hotels had been more realistic – I am sure no hotel would have been empty. High room rates definitely deter people returning. Just to charge whatever you feel like because there is a shortage of rooms impacts on the market.‖ Also, the location of this hotel and thus the slightly reduced security required seems to have benefited the other outlets particularly with people being able to visit the hotel without so many restrictions. Because they were not included in the original allocation of rooms this made the planning process easier because they had not taken on any incorrect assumptions early in their planning process. ..... 18
Special Issue: Hotel Operations Management – Issues and Challenges
Vol. 5, January 2013
To hotel 'D' one of the questions asked was what actions the hotel would take if there was a similar event to the Commonwealth Games in the future. It was of note that there was a clear understanding that the planning process would have to be improved. Although they did look at what had happened at other such international events, within Delhi up to six months before the Games ―... everyone was still saying that Delhi did not have enough hotel rooms.‖ Because of this the market was much more optimistic at that stage than it was one month from the Games. It was clear that for those guests who stayed during the Games there were no complaints, everything worked very well, the only ―... thing was that the negative publicity about the Games village and facilities that happened before the Games should not have happened.‖ It was also reported that the negative publicity was emphasised because many international media persons arrived in Delhi before the start of the Games and the Games organisers did not properly give these people something to occupy themselves by way of positive reporting. As a result the media was in Delhi, their employees were expecting reports and the only thing available was the negative aspects of the way things were being prepared for the Games. As stated ―It is my personal view that no one from the Games organisation was saying positive things about the Games and this was a fault of the Games organisers. Very late the government took control‖ and at that time ―... things began to turn around with bookings starting to come in.‖ It also was reported that although there were large projections of extra rooms opening, the end result was that there were only about an extra 1,000 rooms in five star hotels available. Many of the new developments were stalled, put on hold or hotels were only partially opened. The occupancy level in January 2011 was very similar to January 2010 ―... but what has changed is that the room rates have decreased.‖ Hotels in India were ―... among the highest rates in the world but there has now been a correction to the prices with a reduction of about 5 percent. It will take about three years for the room rates to return to where they were but also the effect of room stock that did not open during the Games means that about 3,000 more rooms will be entering the market and this will also impact on room rates.‖
Conclusions and Industry Implications From this research there are a number of important lessons that can be learnt for the hospitality and tourism industries. The first of these relates to the original estimates of the impact that the Games would have on hotel occupancy. There is strong evidence that these estimates were undertaken by consultants who considered at that time the hotel occupancy added to that the anticipated growth and also added to that sum the anticipated number of visitors to the Games. These estimates did not take into account that many businesses would either move or to a large extent cease operating during the Games period. Also it did not take into account that schools would be closed and that other destinations such as Hong Kong and Singapore would aggressively offer themselves as cheap holiday destinations. And finally as was mentioned in one of the interviews ―… India is a cricketing nation, the average person is not that interested in the types of sports undertaken at the Commonwealth Games‖. The second factor was the negative news coverage of the preparations leading up to the start of the Games. Many reporters went very early to Delhi, some several weeks before the start of the Games. There is anecdotal evidence that these reporters had nothing to report but those paying for them to be there were requiring stories. As a result the incomplete state of the various venues and villages became international headline news with night after night reports on the state of the incomplete bathrooms and other facilities. It was evident through the interviews that ―… the negative reports on the lack of readiness of the facilities, in particular the state of the bathrooms, caused a lot of cancellations‖. Third it was evident that hotel management accepted the consultants‘ estimates on the number of additional hotel rooms required and increased the room rates to a much higher level than normal. Initially these rates seemed to be appropriate and were accepted by the Commonwealth Games Organising Committee. However, when the Committee realised that the estimates were incorrect and revised their figures many of the reservations they had previously made were cancelled. This left hotels with an unexpected and sudden shortage of guests and they had to ―scramble to attract guests‖ from any source. Lastly there was evidence that those hotels that put effort into staff training and the management of other outlets benefited from their efforts. It is clear from the research that the Delhi Commonwealth Games was not a boom period for the hotels in Delhi. However, those hotels that were realistic in their plans were more successful overall than those that aggressively increased their room rates etc. One of the questions that was asked 19
Indian Journal of Applied Hospitality and Tourism Research
in all the interviews was ―Considering the six months before the Games, the Games period and six months after the Games, what impact did the Games have on your occupancy and revenue overall‖. At this point almost all reported that the Games did not increase occupancy or revenue and for some it actually declined during that period. This research has shown that especially at times of mega-events, hotel management need to undertake careful and continuous environmental scanning to verify that the information that is being provided by ‗experts‘ is actually credible and also keep a constant vigil on all the factors that impact upon the hotel. Tourism mega-events may do not necessarily mean massive benefits for the hospitality industry.
References Anurupa, B. and Singh, S. K. (2008). Commonwealth gamse and its impact on our tourism Industry, “A Study in the light of Commonwealth games Delhi 2010”. Conference on Tourism in India – Challenges Ahead, 15-17 May 2008, IIMK, (p. 19). Boyatzis, R.E. (1998). Transforming qualitative information: Thematic and code development. Thousand Oaks, CA: Sage Publications. Chalip, L. (2004), "Beyond impact: a general model for sport event leverage", in Ritchie, B.W. and Adair, D. (Eds), Sport Tourism: Interrelationships, Impacts and Issues, Channel View Publications, Clevedon, pp. 226-52. Chalip, L. (2004), "Beyond impact: a general model for sport event leverage", in Ritchie, B.W. and Adair, D. (Eds), Sport Tourism: Interrelationships, Impacts and Issues, Channel View Publications, Clevedon, pp. 226-52. Crompton, I, and McKay, S., (1994). Measuring the economic impacts of festivals and events: some myths, misapplications and ethical dilemmas, Festival Management and Event Tourism -an international journal, vol 2, no 1, pp 33-43 Ghosh, V. U. (2006). The Impact of the Commonwealth Games 2010 on Urban Development of Delhi. National Institute of Urban Affairs, 31. Hiller, H. (1989), "Impact and image: the convergence of urban factors in preparing for the 1988 Calgary Winter Olympics", in Syme, G., Shaw, B., Fenton, D. and Mueller, W. (Eds), The Planning and Evaluation of Hallmark Events, Avebury, Aldershot, pp. 119-31. Holloway, A. (2006). "Vancouver 2010." Canadian Business 79(5): 6. Horne, J. (2007), "The four 'Knowns' of sports mega-events", Leisure Studies, Vol. 26 No. 1, pp. 81-96. Howitt, D., and Cramer, D. (2008). Research methods in psychology (second Addition), Harlow, UK: Pearson Education Limited. Malfas, M., Theodoraki, E. and Houlihan, B. (2004), "Impacts of the Olympic games as mega-events", Municipal Engineer, Vol. 157, ME3, pp. 209-20, available at: www.extenza-eps.com/TELF/doi/pdf/10.1680/muen.157.3.209.49461 (accessed 25 August 2007). Nemeth, A. (2010). Mega Events, their sustainability and potential impact on spatial development: the European capital of culture. The International Journal of Interdisciplinary Social Sciences. 5(4), 265-278. Neuendorf, K.A. (2002). The content analysis guidebook. Thousand Oaks, CA: Sage Publications. Preuss, H. (2004). The Economics of Staging the Olympics: A comparison of the Games 1972-2008. Northampton, Edward Elgar Publishing, Inc. Preuss, H. and Solberg, H. (2006), "Attracting major sporting events: the role of local residents", European Sport Management Quarterly, Vol. 6 No. 4, pp. 391-411. Singh, N. (2010). Express Hospitality. CWG puts http://www.expresshospitality.com/20101031/market01.shtml
a
damper
on
Delhi
NCR
hospitality
business.
Singh, S. (2007)). 3,000 hotels room near IGI by 2010. Times of India. August 27, 2007. Terret, T. (2008), "The Albertiville Winter Olympics: unexpected legacies - failed expectations for regional economic development", The International Journal of the History of Sport, Vol. 25 No. 14, pp. 1903-21. Yongjian, D. (2008). The Olympics Economics Bonanza. China Today: 4.
..... 20
Special Issue: Hotel Operations Management – Issues and Challenges
Vol. 5, January 2013
Student Perspectives of Industrial Training Experience in Hospitality Industry: A Study
Abstract The academic curricula of hospitality management courses include essential industrial training work experience to complement traditional classroom learning and to help students gain hands-on experience, put theories into action and reflect on their future careers. Petrillose and Montgomery (1998) have recognized that internships are an important component in the hospitality curriculum, and most hospitality programs require students to undertake placements before graduation. But at the same time Richardson (2008) concludes that, having direct experience working in the tourism and hospitality industry may cause students to acquire negative views toward pursuing a career in the industry. Therefore it is felt that educational institutions and industry must have a strategic partnership and collaborate more effectively to provide high quality training programs. Focusing on student reactions, this paper aims to examine the expectation and perception of students toward their industrial training experience by identifying the factors responsible for the overall satisfaction. The areas chosen for the study includes student perceptions of relevance of training, learning aspects, practical/technical skills, working relationships, management aspects, nature of work, work environment and difficulties encountered. A questionnaire was sent to 140 final year bachelors of hotel management students, who have completed 6 months of industrial training in various 5 star hotels of the country and abroad, of which 112 usable questionnaires were returned. Statistical techniques including correlation and linear regression were used to analyze the data collected from the respondents. Based on the findings of the study, suggestions were provided to make the training experience more meaningful by improving the overall quality of the training program for the benefit of both the industry and students. Keywords: Industrial training; Hospitality Industry; Satisfaction Levels; Human Resources
Introduction Hospitality education in India plays an important role in ensuring the continuous supply of human resources to meet the ever increasing industry requirements. The number of hotel management colleges has been increased from 64 in 2006-07 to 138 in 2013-14 (AICTE, 2013). In spite of this, there is a shortfall of almost 62,000 hotel management graduates in hospitality sector (Market Plus, 2012). Figure 1: Demand – Supply gap - Hospitality sector
Source: Market plus 2012 (According to Market plus 2012 there is already a gap of nearly 478,000 between manpower demand and supply in 2009 - 10)
According to FHRAI report, only about 60% of students passing out from hotel management institutions are joining the hospitality industry in India which may be another reason for the shortfall in manpower in the industry. An important concern at this juncture relates to the quality of education provided by these institutes for preparing qualified hospitality professionals. Experience has been valued in this industry for a long time, but today, with the complexity of the industry and the fierce competition, the need for new ideas of doing business is highly appreciated, which makes education even more highly valued. In order to bridge the gap between students‘ academic experience and the requirements of employers, colleges that provide hospitality/hotel management courses make great efforts to develop industrial training programs (Yafang, 2007) and it has become an integral part of all hospitality programs in India. The benefits of this training in the form of experiential education are numerous for both the industry and trainees in order to understand each other to pursue a career within the industry. It is a triangular partnership between education providers, students and the hospitality industry which has positive effects for all the stakeholders. Internships or industrial trainings as termed in Indian context are a great opportunity for educators to increase the contact and cooperation with the hospitality industry which could enrich the industry‘s input in course development and assist educators to keep abreast of hospitality trends and future developments. Ultimately, for internship to be successful, both employer and employee must share the same perceptions about the internship and what the student can bring to internship experience (Jauhari, 2006). Vidya Patwardhan and Shreelatha Rao, Welcomgroup Graduate School of Hotel Administration (WGSHA), Manipal University, Karnataka, India. Email:
[email protected] &
[email protected]
21
Indian Journal of Applied Hospitality and Tourism Research
Industrial trainings are the first contact point between the industry and the student who is a prospective employee for the industry. Therefore emphasis should be placed in ensuring that the students are given meaningful tasks and an opportunity to train in various departments or sectors of the business (Richardson, 2004). Students spend four years preparing to become professionals and these training programs serve as a preparation ground where students can build on the skills they already possess and help them make the transition from student to full time employee. A word of caution here according to Fox (2001) is that a bad internship experience can just as quickly turn a young person away from the industry. As per AICTE guidelines of the model curriculum for undergraduate programs, all hotel management institutes offering four years of BHM program should have a minimum of 22 weeks of Industrial training over a period of four years (AICTE, 2011). As a result of this, majority of AICTE recognized hotel management colleges in the country have made provisions for a structured industrial training program of six months which will play a significant role in their attitudes‘ toward pursuing a career in the industry upon graduation. In order to attract maximum number of students to start their career in the hospitality industry, both educators and industry professionals should collaborate closely to develop a well-organized training program to meet students‘ expectations. Even though internships/trainings are considered important, research findings so far both from India and abroad, have consistently highlighted a discrepancy between student perceptions of and satisfaction with internships. Therefore the significance of this study is that it attempts to investigate students‘ satisfaction level toward their industrial training experience by identifying the underlying factors so that academic institutions, receiving organizations and students themselves can reap the benefits.
Review of Literature Internships/Industrial Training Programs From its humble beginnings till today‘s plethora of curriculum offerings, hospitality education has embraced internships as an inseparable aspect of the educational experience (Zopiatis, 2007). It has also become a trend of the co-operative education in university, which provides a solution of labor shortage for hospitality industry (Peng & Lin, 2009). In general terms, an internship is viewed as a short-term practical work experience in which students receive training and gain experience in a specific field or career area of their interest (Zopiatis, 2004). Internships, industrial exposure, supervised work experience (SWE) are opportunities given to hospitality students while carrying out a full time academic course to get introduced to real life situations which helps in making them successful professionals in the future (Singh & Dutta,2010). In India almost all hospitality related courses have incorporated industrial training programs in their curricula, in one form or the other. These programs are of the duration of about six months and students get exposed to more than two departments during this period which gives them a good exposure and an idea about work systems across the departments. At the same time, these programs are more structured in UK as compared to India majorly due to disparity in compensation (stipend), lack of pre-designated work assignments, awareness levels of work values and long work hours in Indian hotels (Jahauri,2006). A tool developed by Zopiatis (2004) provides useful insights into the current status of the triangular relationship between the stakeholders. Figure 2: The hospitality education-industry relationship: the five relationship/GAP model
Benefits of Successful Internship Programs The internship programs are a key to providing training opportunities to the next generation of industry leaders (TII, 2007). The major benefit for student interns comes from the opportunity for experiential learning. Whether students have some, little, or no idea about the kind of work they want to do, by interning they can gain firsthand knowledge about a particular type of career or work ..... 22
Special Issue: Hotel Operations Management – Issues and Challenges
Vol. 5, January 2013
environment (Jones, 2006). Furthermore, they provide an opportunity for students to apply classroom theories to practical inputs in the actual business setting, and more importantly to evaluate whether their career choice is compatible with their interests and personality. These trainings are also considered as an opportunity to assist the industry by providing qualified labor with low costs, while at the same time enhancing the students‘ learning experiences and career opportunities. Students are quality candidates for temporary or seasonal positions, overseers of short term projects and are a proven, cost-effective way to recruit and evaluate potential employees (True, 2010). Perspectives of industrial trainees Cho (2006), for instance, studied 285 student interns from seven colleges in South Korea and found that there was a significant discrepancy between their expectations (before placement) and satisfaction (after placement) of the internship, indicating that expectations were not fully met. Lam and Ching (2007) investigated the difference between expectations and perceptions of Hong Kong hospitality students towards their internship program, and they found that overall students‘ expectations toward internship were unmet. A study by Jenkins (2001) pointed out that many hospitality students, through exposure to the subject and student work experience, become considerably less interested in selecting hospitality as their first career choice. From this, it appears that there is an imbalance in the expectations perceived by students of hotel management schools and the industry expectations from these trainees. Therefore these internship programs have to be structured by meeting the needs of both educators and industry and work as "consulternships" (Neumann and Banghart, 2001). In India, one issue which seems to bother internship students is compensation and monetary rewards (Srivastava, 2007). May be a pragmatic approach towards compensation to be paid to trainees will help to reduce the intensity of this problem. As the nature hospitality jobs usually involve long working hours with high visibility especially for front positions with minimum job rotations, the interests of students toward the training may get disturbed/decreased since it affects their social life as well as an increase in stress levels. In many internship experiences, there is an inconsistency between what students believe they are capable of doing and what internship supervisors believe the student intern can do (Beggs et al., 2006). The above findings in general suggest that the industry and educators must work together to ensure that students have positive and enriching experiences during their industrial trainings which in turn will retain hospitality graduates in the industry.
Methodology Participants/samples The sampling frame of this study consists of students from four leading hotel management colleges from India, having 6 months of industrial training program over a period of four years. The questionnaire was mailed to around 230 students of these colleges and 160 completed questionnaires were obtained with the response rate of around 70%. The questionnaire was mailed to them electronically and the responses obtained were analyzed using SPSS software. Among the 160 samples, 117 (73%) were male and 43 (27%) were females. Among them, 63 (39%) trained in five star, 4 (3%) trained in four star, 82 (51%) trained in Luxury and 11 (7%) trained in other category of hotels. Survey and procedure A quantitative research design was adopted in this study. A structured questionnaire was developed based on the review of literature and the one developed by Yafang and Gongyong (2007). The questionnaire consisted of four sections. The first section comprised of 12 ―Job Related‖ variables, the second section comprised 7 ―Training and Development‖ related variables, the third section comprised 4 variables related to ―Supervisor- Subordinate Relationship‖ and the fourth section comprised 3 variables related to ―Peer Relationship‖. The above variables were measured on a 5 point Likert scale ranging very high to very low, etc. Respondents were also asked to rate their satisfaction on a 5 point Likert scale in the 5 major departments in a hotel viz. Food & Beverage , Front Office, House Keeping, Sales & Marketing/ HR, Others. The questionnaire also had a section on background information of the trainees, and also their views on the overall training experience. The responses were analyzed using SPSS software.
Analysis and Discussion The figures below show the male and female ratio as well as the category of hotel they have trained. The majority of the respondents (90.7%) trained in luxury and five star hotels and only 9.4% of them trained in other category of hotels. 23
Indian Journal of Applied Hospitality and Tourism Research
Figure 3: Gender of the respondents Frequency Percent Valid Percent Cumulative Percent 43 26.9 26.9 26.9 117 73.1 73.1 100.0 160 100.0 100.0
Female Male Total
Five star Four star Luxury Other Total
Figure 4: Category of hotel Frequency Percent Valid Percent 63 39.4 39.4 4 2.5 2.5 82 51.3 51.3 11 6.9 6.9 160 100.0 100.0
Cumulative Percent 39.4 41.9 93.1 100.0
Figure 5: Student ratings of training satisfaction Variables Mean Std. Deviation Job Related Variables Co-ordination between college and company 3.09 1.101 Nature of work performed 3.95 0.830 Opportunity for work rotation among departments 3.45 1.164 Challenging and interesting work assignments 3.31 1.046 Work environment 3.74 1.037 Autonomy involved in the work 3.38 1.045 Sense of achievement from work 3.36 1.061 Scope for technical skill development 3.64 0.878 Work pressure 3.54 0.896 Stress level 3.39 1.010 Training and Development Organization culture 3.81 0.833 Training induction 3.58 1.329 Training program (managerial inputs) 3.49 1.116 Opportunity for self-development 3.68 1.107 Application of theory to work 3.14 0.948 Opportunity to interact/ serve guests 3.81 1.096 Feedback of progress by the supervisors 3.34 1.198 Supervisor – subordinate relationship Communication between superiors and trainees 3.77 1.047 Supervisory support 3.56 1.103 Appreciation/encouragement from supervisors 3.50 1.122 Dependability 3.67 0.916 Peer Relationship Relationship between colleague/trainees 4.15 0.810 Communication with colleagues 4.32 0.739 Cooperation between trainees 4.06 0.892
N 160 160 160 160 160 160 160 160 160 160 160 160 160 160 160 160 160 160 160 160 160 160 160 160
Figure 5 presents respondents‘ satisfaction ratings with their training on a 5-point Likert Scale. The satisfaction mean scores for individual variables ranged from 3.09 to 4.32, while the overall training satisfaction was 3.61. In a scale of 0 to 5, ―Communication with colleagues‖ had a maximum arithmetic mean of 4.32, followed by ―Relationship between colleagues/ fellow trainees‖ with a mean of 4.15 and ―Co-operation between trainees‖ with a mean of 4.06. ―Co-ordination between college and hotel concerned‖ had the lowest mean of 3.09. This suggested that there should be a better coordination between the college and the hotel company where their students are getting trained. The respondents have given maximum ratings for the variables under ―Peer Relationship‖. Scale reliability analysis was done to measure the existence of internal consistency of the scale employed. Cronbach‘s Alpha computed to 0.867, which indicates a high level of internal consistency for the scale used in this survey. Figure 6: Model Summary (b) Model 1
R .566(a)
R Square .321
Adjusted R Square .200
Std. Error of the Estimate .70431
a) Predictors: (Constant), cooperation among peers, coord college hotel, work rotation, dependability, work pressure, scope technical, communication peers, application of theory, training induction, ..... 24
Special Issue: Hotel Operations Management – Issues and Challenges
Vol. 5, January 2013
supervisory support, opportunity serve guests, relationship with peers, autonomy, stress level, organization culture, training program, challenging &interesting, feedback supervisors, sense of achievement, nature work, work environment, appreciation, communication_sup_trainees, selfdevelopment b) Dependent Variable: Overall rating of the training Model Regression Residual Total
a)
Figure 7: ANOVA (b) Sum of Squares df Mean Square 31.637 24 1.318 66.967 135 .496 98.604 159
F 2.657
Sig. .000(a)
Predictors: (Constant), cooperation among peers, coord_college_hotel, work rotation, dependability, work pressure, scope_technical, communication_peers, application of theory, training induction, supervisory support, opportunity_serve guests, relationship with peers, autonomy, stress level, organization culture, training program, challenging & interesting, feedback_supervisors, sense of achievement, nature work, work environment, appreciation, communication_sup_trainees, self-development. Variables (Constant) Coordination (college & company) Nature of work Work rotation Challenging work assignments Work environment Autonomy Sense of achievement Technical skill development Work pressure Stress level Organization culture Training induction Training program Self-development Application of theory Opportunity to serve guests Supervisory feedback Communication( Sup-trainees) Supervisory support Appreciation Dependability Relationship with peers Communication (colleagues) Cooperation among peers
Figure 8: Coefficients (a) Unstandardized Standardized Coefficients Coefficients B Std. Error Beta .356 .639 -.019 .060 -.027 .052 .094 .055 .251 .053 .371 .027 .077 .036 -.082 .080 -.108 -.090 .074 -.119 .012 .077 .016 .129 .078 .144 .108 .084 .123 -.012 .075 -.015 .143 .092 .151 .088 .055 .148 -.057 .074 -.081 .039 .081 .055 .014 .070 .017 -.004 .071 -.006 .005 .067 .008 .099 .080 .132 -.008 .069 -.011 -.018 .072 -.025 .046 .079 .053 -.039 .088 -.041 -.089 .089 -.084 .155 .073 .175
t B .557 -.325 .556 4.755 .356 -1.020 -1.223 .156 1.658 1.296 -.158 1.551 1.589 -.774 .483 .201 -.059 .078 1.237 -.110 -.246 .579 -.448 -1.006 2.127
Sig. Std. Error .578 .746 .579 .000 .723 .310 .224 .876 .100 .197 .875 .123 .114 .440 .630 .841 .953 .938 .218 .912 .806 .563 .655 .316 .035
b) Dependent Variable: Overall rating of the training During the analysis, independent t- test was performed to find whether there exists any significant difference between ―Gender‖ of the trainees with regard to the four factors viz: ―Job Related Variables‖, ―Training and Development‖, ―Supervisor – subordinate Relationship‖ and ―Peer Relationship‖. Average value of the variables under the above factors was subjected to independent ttest. It was found that ―Job Related Variables‖, ―Training and Development‖, ―Supervisor – subordinate Relationship‖ did not show any significant difference with ―Gender‖ as all P values were more than 0.05. But ―Peer Relationship‖ did show a significant difference with respect to gender. Here t = 2.022 and P = 0.045. In addition to this, linear regression was conducted with the overall rating of the departments as a criterion variable. From the analysis it was found that R square value was 0.321 (figure 6) which indicated that 32% of the variations in the overall rating were accounted for by the independent variables under consideration. This was significant as indicated by the F value of 2.657 (P value < 0.05) in figure 7. An examination of the t values in figure 8 indicated that ―Work rotation‖ and ―Cooperation among Peers‖ were significant in contributing towards ―Overall Rating of the training‖. 25
Indian Journal of Applied Hospitality and Tourism Research
Overall, the mean scores of seven variables (less than 3.45) were low, which indicated that students are not fully satisfied with their training experience especially on these seven items: ‗coordination between college and company‘, ‗application of theory to work‘, ‗challenging and interesting work assignments‘, ‗feedback of progress by supervisors‘, ‗sense of achievement from work‘, ‗autonomy involved in the work‘, and ‗stress level‘. There was a question on stipend received during the training program for which 154 respondents have ticked yes and 6 of them mentioned that they have not received any stipend. When discussed with some of the respondents, it appeared that the stipend received was a meager amount which was just symbolic. Interpretation of General Opinion of Students Majority of the students have positive opinion about their training experience in general and felt that it was an eye opener for most of them about the nature of the industry. But there are also comments which are not so encouraging for both the industry as well as academia that need immediate attention. They have mainly commented upon working conditions, meager stipend ( many students), supervisors attitude towards trainees, work hours, weekly offs, poor managerial communication, work pressure, lack of appreciation for good work done, loyalty, lack of inputs regarding training objectives from the college. Some of the representative comments from the respondents regarding their overall opinion about the training program are as follows; ―Colleges should provide a training schedule to the hotels as it would be helpful for the students or else equal time to each department is not given. Also induction should be provided by hotels and this should be checked by the college. Colleges need to play an upper hand for a good and equal exposure to all students in all departments‖ ―Made no difference, it was an experience that helped us better understand the harsh realities of the hospitality industry. Now better equipped to handle the mental and physical pressure of any work arena‖ ―As far as industrial training is concerned as a part of syllabus of hospitality & hotel administration course, it lacks in knowledging the amateurs prior to training about the functioning of the hotel organization & many other aspects. I may suggest that there should be a revision of the syllabus entirely & the government should also be considerate about the same for development in the hotel & tourism industry as other developed countries have‖ ―Industrial Exposure should be compulsory in every year, so that students are aware of latest trends as well as they have fair idea about how to work during 6 months industrial training.‖ "Overall a satisfactory experience. Didn‘t have any induction (which was essential). Working atmosphere was different for each department. Main lesson learnt: never trust anyone (managers, team leaders) " "It should be a step wise process oriented journey which, it is often not. College should keep a track on the trainee's program throughout training and evaluate continuously as in the college or at least try for the same. Most of the trainees do not take training seriously hence, its credibility is lost‖
Conclusion and Recommendations Internships/industrial trainings are a vital part of hospitality management programs and play an important role in the transition of students from the college environment to the work environment. The regression analysis in the study indicated that ―Work rotation‖ and ―Co-operation among Peers‖ had significant contribution towards overall rating of their training experience. Therefore it is important for the colleges and the industry to ensure that the remaining factors, mainly some of the individual factors which have more significant relationship with training success need to be highlighted and given more attention so that the training program becomes more interesting and challenging. There has to be a proper training plan that identifies the objectives required and expected to be achieved by students so as to avoid getting any surprises once they begin their training program. Plan should have all details regarding learning outcomes, job rotation, mentors, feedback process, grievance handling etc. This will surely help in preparing students to understand the nature of the industry/work and also to face the stressful situations and works like realistic job preview. The incongruities between student expectation and their actual experience may also be reduced by having better co-ordination and supervision both by academic and industry representatives. The members of academic fraternity and industry experts meet periodically and exchange ideas for improving the quality of these training programs. As mentioned by some of the respondents, the induction program when they begin the training should be made more structured and comprehensive to give a fair idea about the work culture of the property/hotel group concerned. Industry leaders also need to think ..... 26
Special Issue: Hotel Operations Management – Issues and Challenges
Vol. 5, January 2013
about and implement better compensation systems via improved monetary rewards in order to motivate trainees to work well and learn well. The quality of internship is also contingent upon the type of evaluation/feedback sessions after completion of the training program which plays a crucial role in determining the educational value of the program. Therefore both the industry and the concerned colleges should pay more attention towards evaluating the usefulness and learning derived from the training programs through comprehensive evaluation procedures. More attention from college authorities may be given to students during training programs with regular communication via internet or on-site visits by school authorities are necessary. At the same time, the student trainees must also be committed towards learning by demonstrating a responsible attitude and professionalism. Ultimately the quality of training experience depends upon the learners‘ ability and willingness to learn. If properly selected and supervised, an internship with hands-on experience can truly be ―a gateway to the real world‖ for students (Collins, 2002). References AICTE report 2012. AICTE Approval Process Handbook 2013 – 2014. AICTE: BHMCT BHMCT_070912.pdf
Syllabus
2011.
Accessed
from
http://www.aicteindia.org/downloads/model_Curriculum_
Beggs, B.A., Ross, C.M., and Knapp, J.S. (2006) Internships in leisure services: An analysis of student and practitioner perceptions and expectations, 21, 1-20. Cho, M. (2006). Student perspectives on the quality of hotel management internships. Journal of Teaching in Travel & Tourism, 6(1), 61–76. Collins, A.B. (2002). Gateway to the real world, industrial training: Dilemmas and problems, Tourism Management,23(1), 93 -96. FHRAI report 2011-12. Accessed from http://www.aspiringminds.in/researchcell/articles/study_on_employability _variances_amongst_hotel_management_graduates.html Fox, T. (2001). A Sense of Place. Caterer and Hotelkeeper, 189 (12): 4160. Jauhari, V., & Manaktola, K. (2006). Comparison of Internship Experiences in Food Service firms in India and UK. Journal of Foodservice Business Research, vol.9, No.2/3, 187-206. Jenkins, A. K. (2001). Making a career of it? Hospitality students‘ future perspectives: An Anglo-Dutch study. International Journal of Contemporary Hospitality Management, 13(1), 13–20. Jones, E. (2006). Internships: Previewing of a profession. Occupational Outlook Quarterly. Retrieved from: http://www.bls.gov/opub/ooq/2006/summer/art02.pdf Lam, T., & Ching, L. (2007). An exploratory study of an internship program: The case of Hong Kong students. International Journal of Hospitality Management, 26(2), 336-351. Market plus, 2012. Accessed from http://tourism.gov.in/writereaddata/CMSPagePicture/file/Primary%20Content/MR/ study%20report%20on%20evaluation/MPS%20Final%20Report%20Jan%202012.pdf Newmann, B.R. and Banghart, S. (2001). Industry-university "consulternships": An Implementation Guide. International Journal of Educational Management, 15(1), 7-11. Peng, K. L., and Lin, M. C. (2009). Discussing intern program from measuring the hospitality managerial performance perception. Journal of Hospitality and Home Economics, 6(1), 13-32. Richardson, S. (2008). Undergraduate tourism and hospitality student‘s attitudes towards a career in the industry: A preliminary investigation. Journal of Teaching in Travel and Tourism. 8(1), 23-45. Singh,A., & Dutta, K. (2010). Hospitality internship placements: Analysis for United Kingdom and India. Journal of Services Research, 10(1), 85-99. Srivastava, N. (2007). Hospitality Internships: Is it really motivating?. FHRAI Magazine, 7 (5), 46-49. The Internship Institute. (2007). Intern productivity study capsule. Retrieved from http://www.internshipinstitute.org/pdf/ ProductivityCapsule.pdf True, M. (2010). Starting and maintaining a quality internship program. Grantham, PA: Messiah College. Retrieved from http://www.macic.org/wpcontent/uploads/2010/02/Starting-Maintaining-a-Quality-Internship-Program.pdf Yafang, B. & Gongong,F. (2007). A study of Hospitality Students‘ Satisfaction towards their Internship: A case from Hang Zhou, China. Accessed from www.seiofbluemountain.com/upload/product/.../2008glhy12a2.pdf Zopiatis, A. (2007). Hospitality Internship in Cyprus: a Genuine Academic Experience or a Continuing Frustration?. International Journal of Contemporary Hospitality Management, 19 (1), 65-77. Zopiatis, A. (2004). An exploratory research investigating the status and future of hospitality internships in Cyprus. Unpublished Doctoral Dissertation (D.Prof ), Middlesex University: UK.
27
Indian Journal of Applied Hospitality and Tourism Research
Hotel Loyalty Abstract This study focused on the crucial impact of loyalty programmes offered by hotels as a way to enhance repeat business. The study collected data using self-administered surveys completed by domestic hotel guests in New Zealand (i.e. residents who lived in New Zealand at the time of the study) who had stayed more than once in a particular hotel (as an indication of loyalty) over a three year time frame. Data collected from the survey were analyzed using both regression and structural equation modelling. Results indicated that loyalty programmes have a significant impact before, during and after the service encounter. First, loyalty programmes before the service encounter had a significant positive impact on guest loyalty. Second, loyalty programmes during the service encounter had a significant positive impact on guest satisfaction, and third, loyalty programmes after the service encounter had a significant positive impact on guest affective and continuance commitment. Results from the survey showed that loyalty programmes have a significant impact on guest loyalty, more than staff loyalty and staff interaction, but guest satisfaction and guest affective commitment had more significant impact on guest loyalty than loyalty programmes. The contribution of this study is that it generates an improvement over the current knowledge in the field of services marketing by explaining the significant impact of loyalty programmes on hotel guests in the hotel sector. Loyalty programmes (during the service encounter) have more significant impact on guest satisfaction than staff interaction, and guests appreciate having a hassle-free stay. Also, satisfaction and commitment should be realised before a sense of loyalty develops and it is the sense of loyalty which further drives guests to initiate the decision to become members of a hotel loyalty programme, although the study asserted the significant impact of loyalty programmes on guest loyalty. The second contribution of the study is that it found different guests tend to join hotel loyalty programmes for different reasons. For example, males look for better service, special treatment and collecting points, while females look mainly for price incentives and experiencing a unique stay. Key words: loyalty programmes, guest loyalty, guest satisfaction, affective commitment, continuance commitment, and staff interaction.
Introduction and Literature Review In today's competitive hotel business environment, understanding guests‘ expectations, perceptions and demands along with the level of service provided can have a significant impact on the sustained success of the hotel. These qualities or standards allow industry leaders to distinguish themselves from their competitors, and not only satisfy their guests, but also delight/surprise them through the level of service provided by meeting or exceeding expectations. However, guest satisfaction is not a constant phenomenon but is indeed progressive in nature (i.e. time specific) and the ever-growing volume and pace of competition and the continuous increase in customers‘ expectations, services and products that are deemed satisfactory by the customer today will undoubtedly prove unsatisfactory to the same customer tomorrow (Kandampully, 1997). Academics and practitioners alike agree that loyalty is an integral part of doing business. Few, if any, businesses can survive without establishing a loyal customer base, especially when the cost of acquiring a new customer far outweighs that of maintaining a new customer (Gremler & Brown, 1996). Loyalty programmes can represent an inexpensive means by which an organisation can collect information about its customers (Palmer, McMahon-Beattie & Beggs, 2000). Loyalty programmes based on the storage of individual consumer‘s demographic status and spending patterns can contribute significantly to an organisation‘s knowledge base. Knowing who the loyal customers are, what they buy and how often, can provide a way to gain strategic advantage. However, relatively little is known about customer loyalty especially in the service sector in spite of its obvious importance to all businesses. Experts have struggled to define precisely what being a loyal customer means and what specific factors can lead to customer loyalty. So, although customer loyalty is considered the backbone of business, it still remains a mystery (Gremler & Brown, 1996). The definition of service loyalty has varied widely and there has been no generally accepted definition for it (Lee, Barker, & Kandampully, 2003). However, by reviewing the literature, service loyalty can mean: a service organization's commitment to its customers which are manifested in activities undertaken by the organization for the development of a long-term relationship with the customer, offering loyal service, every time, all the time (Bowen & Chen, 2001). In other words, firms should give loyalty before they can expect it from customers (Kandampully, 1997). Gremler and Brown (1996) introduced a definition for service loyalty which is ―…the degree to which a customer exhibits repeat purchasing behaviour from a service provider, pass on positive recommendations, possesses a positive attitudinal disposition toward the provider, and considers using only this provider when a need for this service arises‖ (p.173). Loyal guests are of special interest to hotels. They are less price sensitive, have a higher probability to stay, they usually recommend the service to others, and they don‘t seek other alternatives offering the same service. There has been a lot of research investigating the relationship Dr. Tim Lockyer, Department of Tourism and Hospitality Management, Waikato Management School, The University of Waikato, New Zealand, Email:
[email protected]; and Dr. Ahmed Elebiary, Consulate General of Saudi Arabia in New Zealand, Auckland, Email:
[email protected]
..... 28
Special Issue: Hotel Operations Management – Issues and Challenges
Vol. 5, January 2013
between staff commitment and guest loyalty in the hotel sector and whether guest loyalty is affected by staff commitment or other variables like service quality (Anderson & Weitz, 1992; Cronin & Taylor, 1992; Reichheld, 1993; Morgan & Hunt, 1994; Bowen & Chen, 2001; Fullerton, 2003). However, little research has been conducted on how significant loyalty programmes offered by hotels are to this relationship. Do hotels use loyalty programmes to enter into one-to-one dialogue with their guests through customization/personalization (Melnyk, 2005) and do guests appreciate this kind of preferential treatment as a result of this customization and seek a long term relationship with hotel/staff, or are they more interested in redeeming the rewards (i.e., discounts) of loyalty programmes offered by hotels (Palmer et al., 2000). Understanding how or why a sense of loyalty develops in customers is a crucial management issue, as the psychology behind this development is not yet well understood (Reichheld, 1993). Berry (1995) noted that on-going relationships between businesses and their customers are receiving major interest in marketing, and the building of strong customer relationships has been suggested as a means for gaining a competitive advantage (Reichheld, 1993). Relationships emerge through interactions between the customer and the service provider happening over a single or multiple encounters following each other in a continuous or isolated way (Gronroos, 2000). This suggests services are inherently relational; where the interactors come to know each other to some degree or other and have expectations of each other‘s behaviour. Thus, a relationship is a social phenomenon which exists when there is an intermittent interaction between two parties, involving interchanges over time, with some degree of continuity between successive interactions, and with some mutuality (i.e., the behaviour of each takes account of the behaviour of the other) (Hinde, as cited in Varey, 1998). This study seeks to contribute to the development of a conceptual framework that integrates commitment, satisfaction, staff and guest loyalty, service quality, and the impact of loyalty programmes before, during and after the service encounter. Thus the main contribution of this research to marketing theory and practice (hospitality industry) is to provide an understanding of the drivers of guest loyalty in the hotel industry which is currently lacking in the literature, and how the so-called ―loyalty‖ can be observed and fostered through the optimal use of loyalty programmes. The second contribution is to provide an understanding of whether or not loyalty programmes have a significant impact on enhancing guest loyalty.
Theoretical Framework The overall goal of the research is to suggest a theoretical model (Figure 1) which represents the various interrelationships between the variables identified from the literature - commitment, satisfaction, staff and guest loyalty, and the crucial impact of loyalty programmes on enhancing guest loyalty, and further proposed in the hypotheses covering before, during and after the service encounter. Technical
H3a as
Quality H3b Tangible Quality
H4a Guest Satisfaction
H4b
Affective Commitment
H3c H2
Staff Interaction
Continuance Commitment
H1a
H4c
H1b H5
Staff Loyalty
Figure 1: Proposed model with hypotheses
Guest Loyalty
There has been a consensus among practitioners and academics that satisfaction is an antecedent for loyalty. Service loyalty denotes an organisation‘s commitment to its customers through offering loyal services, every time, all the time (Bowen & Chen, 2001). Commitment is an enduring desire to maintain a valued relationship (Moorman, Zaltman, & Deshpande, 1992). Bowen & Chen (2001) noted that service loyalty through employee commitment precedes customers‘ loyalty through their 29
Indian Journal of Applied Hospitality and Tourism Research
satisfaction. Thus, employee commitment leads to better service to customers which induces them to stay loyal to the company (Reichheld, 1993). In 2003, Fullerton‘s study demonstrated that committed customers are less likely to switch than consumers who lack commitment to the organisation. Likewise, a substantial body of research has demonstrated that commitment of an affective nature is positively related to customer retention (Anderson & Weitz, 1992; Bendapui & Berry, 1997; Gwinner, Gremler, & Bitner, 1998; Morgan & Hunt, 1994) and is a more powerful determinant of customer retention than continuance commitment (Fullerton, 2003). This leads to the following hypotheses regarding this study: H1a: H1b: H2:
Guest affective commitment has a positive effect on guest loyalty. Guest continuance commitment has a negative effect on guest loyalty. Guest satisfaction has a positive effect on guest loyalty.
The concepts of service quality, satisfaction and loyalty have been linked to each other in the literature. Berry and Parasuraman (1992) also noted that owing to the very nature of services (where they are performances rather than objects), service quality can be viewed as a total experience which may have little to do with what the provider believes; rather, it may depend solely on the beliefs of the individual customer (Zeithaml, Berry & Parasuraman, 1988). Although quality can be viewed as a form of overall attitude, satisfaction is an emotional reaction to a specific situation. Oliver (1981) noted that satisfaction soon decays into one‘s overall attitude. Thus, satisfaction, especially for employees, can have an influence on providing service quality for consumers. Gupta, McDaniel and Herath (2005) added that employee commitment is essential for service quality, in the sense that there is a high correlation between employee commitment and the customers` perception of service quality. Service quality acts as an antecedent construct and service loyalty as an outcome variable of customer satisfaction (Caruana, 2002). There has been a consensus among practitioners and academics that both service quality and customer satisfaction are antecedents for loyalty as was tested by Cronin and Taylor (1992). Cronin and Taylor‘s (1992) study revealed that service quality is an antecedent of consumer satisfaction. Therefore, in this study, service quality can have a significant effect on guest loyalty via guest satisfaction. Thus, it is proposed that service quality can have both a direct effect and indirect effect (via guest satisfaction) on guest loyalty, and this leads to the following hypotheses: H3a: H3b: H3c: H4a: H4b: H4c:
Technical quality has a positive effect on guest satisfaction. Tangible quality has a positive effect on guest satisfaction. Staff interaction has a positive effect on guest satisfaction. Technical quality has a positive effect on guest loyalty. Tangible quality has a positive effect on guest loyalty. Staff interaction has a positive effect on guest loyalty.
Loyalty has a two-way connection, in the sense that there is a cause-and-effect relationship between customer and employee loyalty (Reichheld, 1996). Due to the psychological and physical closeness that exists between employees and customers in service encounters, employees‘ attitudes often have a spill-over effect on customer satisfaction. If employees experience favourable affective responses in their jobs, their customers are likely to receive positive service experiences (Lenka, Suar, & Mohapatra, 2009). Thus the researcher expects, in accordance with previous studies (Bove & Johnson, 2006; Bowen & Chen, 2001; Reichheld, 1996; Wong & Sohal, 2003) a positive relationship between staff loyalty and guest loyalty, and this leads to the following hypothesis: H5:
Staff loyalty has a positive effect on guest loyalty.
Loyalty programmes were created by various companies to tie the buyers of a wide range of consumer goods and services to a particular brand or supplier. Consumers receive both psychological and economic benefits from a loyalty programme, and these rewards function as a positive reinforcement of consumers‘ purchase behaviour and condition them to continue doing business with the firm (Sheth & Atul, 1995). Loyalty programmes not only help build customers‘ commitment but also demonstrate a firm‘s commitment to establishing a long-term relationship with its customers. Oliver (1999) demonstrated through a conceptual framework that behavioural loyalty is preceded first by commitment, followed by affective (i.e., attitudinal) commitment. Thus, loyalty programmes that are directed toward enhancing customer‘s attitude toward the company rather than at direct stimulation of behaviour might be a key to creating behavioural loyalty (Melnyk, 2005). Previous studies (Bolton, Kannan, & Bramlett, 2000; Sheth & Atul, 1995; Yi & Jeon, 2003; Melnyk, 2005) indicated the crucial role played by loyalty programmes through the three stages indicated in the model; before, during, and after the service encounter. Therefore, the following hypotheses are proposed: ..... 30
Special Issue: Hotel Operations Management – Issues and Challenges
H6: H7: H8a: H8b:
Vol. 5, January 2013
Loyalty programmes before service encounter have a positive effect on guest loyalty. Loyalty programmes during service encounter have a positive effect on guest satisfaction. Loyalty programmes after service encounter have a positive effect on guest affective commitment. Loyalty programmes after service encounter have a positive effect on guest continuance commitment.
Methodology Two methods of analysis were considered for the survey; regression (using SPSS version 18) (Coakes, Steed, & Dzidic, 2010) and Structural Equation Modelling (SEM) using AMOS version 18 (Blunch, 2008). Both methods are required to test the validity of the model suggested in the study. Regression analysis was used as a statistical technique to analyze the relationship between a single dependent variable and one or more predictor variables (Alonso, 2000). In this case, regression analysis helped to determine whether the variance of the dependent variable (guest loyalty) is being explained by the predictors suggested in the model. A high coefficient of determination (R²) implies a good explanation. The term structural equation modelling involves two important aspects for the procedure: (a) that the casual processes under study are represented by a series of structural (i.e., regression) equations, and (b) that these structural relations can be modelled pictorially to enable clearer conceptualisation of the theory under study (Byrne, 1998). The hypothesised model can then be tested statistically in a simultaneous analysis of the entire system of variables to determine the extent to which it is consistent with the data. If goodness-of-fit is adequate, the model argues for the plausibility of postulated relations among variables; if it is inadequate, the tenability of such relations is rejected. The first step in SEM is to form a graphical depiction – a model – showing how the various concepts fit together, referred to as a path diagram (Figure 6-1) which is a form of graphical representation of a model under consideration. Such a model is equivalent to a set of equations defining a model, and is typically used as an alternative way of presenting a model pictorially (Raykov & Marcoulides, 2006). A model, then, is a set of theoretical propositions that link the exogenous variables to the endogenous variables and the endogenous variables to one another. Taken as a whole, the model explains what relationships we expect to see in the data and what relationships we do not expect to emerge (Kelloway, 1998). The model as shown in Figure 1 illustrates guest loyalty as the dependent variable and staff loyalty, service quality, guest satisfaction and guest commitment as the dimensions making up the independent variables. A characteristic of these variables is that they are not directly measurable by a generally accepted instrument; a characteristic they share with many of the concepts from the social and behavioural sciences. Such non-measurable variables are called latent variables. As latent variables cannot be measured directly, they are measured by a set of indicators, usually questions in a questionnaire; these are the so-called manifest variables. Similarly, Blunch (2008) suggested that a theory is a number of hypothesised connections among conceptually defined variables. These variables are usually latent, i.e., they are not directly measurable and must be operationalised in a series of manifest variables. A total of 51 statements made up the questionnaire that was used for measuring the variables in the model proposed in this study.
Results Six thousand self-completion surveys were delivered in New Zealand. Alreck and Settle (2004) asserted that the more the sample deviates from purely random selection, the less representative it is likely to be, and the less legitimate the results of statistical computation will be. Therefore, the delivery areas for the surveys were randomly selected, in the sense that the distribution of the survey to the letter boxes was done after drawing grid lines on a map and randomly selecting the grid where the survey would be deposited. From the 6000 surveys distributed, 635 (10.6%) usable responses were returned and 59 surveys were not usable because large sections had not been completed. The survey sample consists of more female participants (63.6%) than male participants (36.4%). The highest numbers of survey participants are older than 60 years (25.9%), and the next largest percentage are for those between the ages 51 and 60 (24.8%). There is also a considerable number of participants between the ages 41 and 50 (19.6%), and relatively fewer participants between the ages 20 and 30 (9.3%) and under 20 (3.8%) who do not use hotels much. Most of the survey participants earn between $30,001 and $50,000 yearly (20.2%). There are 113 participants (17.8%) who earn more than $100,000 per year and 17.8 per cent earn between $50,001 and $70,000 yearly. The lowest percentage for participants was for those whose annual individual income was under 31
Indian Journal of Applied Hospitality and Tourism Research
$30,000 (13.9%). For most survey participants (66.7%), family visit/vacation is the main reason they choose to stay at hotels, while 209 (33.3%) of participants said they stayed at hotels for business visits or work purposes. Most survey participants have professional occupations (53.7%), and the lowest percentage is for no paid employment (2.9%). In regards to loyalty programme membership, results showed a higher percentage for those who do not hold loyalty programme membership (72.4%) than those who are currently loyalty programme members in one of the loyalty programmes offered by hotels (27.6%). However, a total of 264 participants (41.6%) indicated that they have had a loyalty programme membership with one of the hotels in the past. Table 1 lists the 51 items in Section ‗B‘ of the survey by descending mean. The items with the highest mean were ―The hotel‘s premises were clean‖ (mean 5.80, strongly agree), and ―The hotel‘s furniture was comfortable for the guests‖ (mean 5.39, strongly agree). These were followed by ―The hotel staff provides services as promised‖ (mean 5.37, strongly agree), and ―The hotel‘s premises were noise acceptable‖ (mean 5.35, strongly agree), and ―The hotel staff were courteous, polite, and well mannered‖ (mean 5.34, strongly agree). The four items with the lowest mean scores were, ―I feel emotionally attached to the hotel‖ (mean 3.75, neither agree nor disagree), ―If I was in the hotel X loyalty programme, I‘d feel emotionally attached to the hotel‖ (mean 3.71, neither agree nor disagree), ―I feel a strong sense of belonging toward the hotel‖ (mean 3.68, neither agree nor disagree), and ―If I wanted to stay at another hotel, it would be very difficult‖ (mean 3.37, neither agree nor disagree). The four items with the highest mean and the four items with the lowest mean have been highlighted in Table 1. The data were analyzed for sample reliability and adequacy using SPSS (version 18). As indicated earlier, the Cronbach‘s alpha for the 51 statements was 0.97, which is usually perceived as a good result. The alpha coefficients for each half were 0.94 and 0.94, indicating internal consistency within the data set. Also, the alpha coefficients for items with odd and even numbers in the survey were quite similar; 0.94 and 0.93 respectively. Since the survey is made up from an odd number of items, a split would produce an unequal number of items on each half, and SPSS revealed an Unequal-length Spearman-Brown of 0.90. The Kaiser-Meyer-Olkin test of sample adequacy was 0.97, classified as ‗marvellous‘ (Ryan, 1995, p.256). From these statistical tests it can be concluded that the sample data possess rigor as measured by these criteria. Structural equation modelling was conducted to test the several paths hypothesised in the model. Structural equation modelling was selected to test the hypotheses because it is recognised as a more comprehensive and flexible approach to research design and data analysis than any other single statistical model in standard use by social and behavioural researchers (Hoyle, 1995). The superiority of structural equation modelling over other statistical techniques is based on its ability to include several observed and latent variables simultaneously in predicted paths. Although the method cannot test causality, structural equation modelling can provide necessary (not sufficient) evidence in that direction. Figure 2 illustrates the results of the AMOS program including the standardised estimates for the different constructs leading to guest loyalty. Service quality was divided into three dimensions of service quality covering the technical, tangible, and staff interaction. Guest commitment was divided into affective and continuance commitment. All arrows with solid lines indicate that the paths reached the significance level at p < 0.05, which indicates that their representative hypotheses were supported, while the dotted lines mean that the paths were insignificant at the level of p < 0.05 and thus their corresponding hypotheses were not supported, except for H3c which although was significant at the level of p < 0.01, β was negative and opposite to what was hypothesized and thus rejected. The first hypothesis covers the impact of guest commitment dimensions on guest loyalty. The standardised coefficient the first path from guest affective commitment to guest loyalty (H1a) is β = 0.31, significant at the level of p < 0.001. The second path from guest continuance commitment to guest loyalty (H1b) is not significant (β = -0.05), so the first hypothesis is partially supported. The second hypothesis indicates a path from guest satisfaction to guest loyalty. The standardized coefficient for this path is β = 0.46, significant at the level of p < 0.001. So the second hypothesis is supported. The third hypothesis covers the impact of service quality on guest satisfaction. The first path from technical to guest satisfaction (H3a) is significant at the level of p < 0.001 (β = 0.21). The second path from tangible to guest satisfaction (H3b) is significant at the level of p < 0.001 (β = 0.43). The third path from staff interaction to guest satisfaction (H3c) is significant at the level of p < 0.01 (β = -0.16). However, although the regression weight showing the impact of staff interaction on guest ..... 32
Special Issue: Hotel Operations Management – Issues and Challenges
Vol. 5, January 2013
satisfaction is significant at the level of p < 0.01 it is with a negative sign which indicates the negative impact of staff interaction on guest satisfaction, so hypothesis three is partially supported. This negative sign is probably due to the fact that guests appreciate having a hassle-free stay, which is clear from the indirect effect of staff interaction on guest satisfaction (β = 0.00), while the direct impact was negative (β = -0.16), and the total effect of staff interaction on guest satisfaction with a negative sign (β = -0.16). Therefore, although H3c was significant at the level of p < 0.01; it was with a negative sign which unfortunately is opposite to what was expected, so this hypothesis is not supported. Technical
.21
Quality
.00
.43 Tangible Quality
Guest Satisfaction
-.07
Affective Commitment
-.16 .46
Staff Interaction
Continuance Commitment
.31
.13
-.05 .21
Staff Loyalty
Guest Loyalty
Figure 2: Empirical results of the full model with Standardized Regression Weights Note: The solid lines mean the paths reach the significance level at p < 0.05, and the dotted lines means the path is insignificant at the level of p < 0.05
The fourth hypothesis covers the impact of service quality dimensions on guest loyalty. The first path from technical to guest loyalty (H4a) is not significant (β = 0.00). The second path from tangible to guest loyalty (H4b) is not significant (β = -0.08). The third path from staff interaction to guest loyalty (H4c) is significant at the level of p < 0.05 (β = 0.13). This is clear from the indirect effect of staff interaction on guest loyalty (β = -0.07), while the direct impact was negative (β = 0.13), and the total effect of staff interaction on guest loyalty had a positive sign (β = 0.06). Therefore, hypothesis four is partially supported. Hypothesis five indicates a path that goes from staff loyalty to guest loyalty. The standardised coefficient for this path is significant at a level of p < 0.001 (β = 0.21), so the fifth hypothesis is supported. Hypothesis six indicates a path that goes from loyalty programmes before service encounter to guest loyalty. The standardised coefficient for this path is β = 0.25, significant at a level of p < 0.01. So this hypothesis is supported
Discussion The objective in this study was to investigate whether or not loyalty programmes have a significant impact on enhancing guest loyalty. Results indicated the significant impact of loyalty programmes through the three stages indicated in the model; before, during, and after the service encounter. Figure 2 illustrated these three phases. Loyalty programmes before the service encounter had a significant positive impact on guest loyalty (β = 0.25, significant at a level of p < 0.01). Loyalty programmes during the service encounter had a significant positive impact on guest satisfaction (β = 0.22, significant at the level of p < 0.001), and loyalty programmes after the service encounter had significant positive impact on guest affective and continuance commitment (β = 0.68, significant at a level of p < 0.001; β = 0.22, significant at a level of p < 0.001 respectively). These results provide support for studies undertaken by Bolton et al. (2000), Yi and Jeon (2003), and Liu (2007). Therefore, results showed that loyalty programmes had a significant impact in the three stages indicated in the model; before, during, and after the service encounter, but loyalty programmes did not have the highest impact on guest loyalty considering the other variables in the model. Figure 2 illustrated the standardised regression estimates calculated by AMOS for the variables in the model. Guest satisfaction had the highest direct impact upon guest loyalty (regression estimate β = 0.46), followed by guest affective commitment (regression estimate β = 0.31), loyalty programmes before service encounter (regression estimate β = 0.25), staff loyalty (regression estimate β = 0.21), while 33
Indian Journal of Applied Hospitality and Tourism Research
staff interaction had the lowest impact (regression estimate β = 0.13). Therefore, loyalty programmes were shown to have significant impact on guest loyalty, more than staff loyalty and staff interaction, but guest satisfaction and guest affective commitment had more significant impact on guest loyalty than loyalty programmes. Results also confirmed that loyalty programmes (before service encounter) have more significant impact on guest satisfaction than staff interaction, while staff interaction has a significant negative impact on guest satisfaction. This negative impact from staff interaction to guest satisfaction is probably because those guests appreciate having a hassle-free stay. These results support the argument noted by O‘Malley (1998) and Nunes and Dreze (2006) that one of the main reasons why companies introduce loyalty programmes is to gain an insight into customer behaviour and preference by collecting information about them. This kind of information can help companies customise their customer services and segment their customers and thus consecutively enable a more personal relationship with them. Guest satisfaction had the highest impact on guest loyalty and this further provided support for previous studies (Gremler & Brown, 1996; Bowen & Shoemaker, 1998; Bowen & Chen, 2001) which argued that customer satisfaction is both an antecedent and perquisite for loyalty. However, Ball, Coello and Vilares (2006) noted, customer satisfaction is considered a necessary step but not sufficient for gaining full loyalty. Cengiz, Ayyildiz & Er (2007) argued that merely satisfying customers is not sufficient to secure customer loyalty. According to Te Peci (1999), a sense of commitment should be realised before loyalty develops. Results in the present study provide support for the arguments presented by previous researchers (Gremler & Brown, 1996; Bowen & Shoemaker, 1998; Te Peci, 1999; Bowen & Chen, 2001; Ball et al., 2006), that satisfaction and commitment are both an antecedent and prerequisite for loyalty. From the study it was clear that guest affective commitment has a more significant impact on guest loyalty (regression estimate β = 0.31) than loyalty programmes before service encounter (regression estimate β = 0.25) as shown in Figure 2, which provides support for the previous studies that suggested that a sense of commitment should be realised before loyalty develops even with satisfaction. The present study generates an improvement over the current knowledge in the field of services marketing by explaining that loyalty programmes (during service encounter) have a more significant impact on guest satisfaction than staff interaction, while staff interaction has a significant negative impact on guest satisfaction. This negative impact from staff interaction to guest satisfaction is probably due to the fact that guests appreciate having a hassle-free stay. Further, although loyalty programmes (before service encounter) were found to be neither a necessary step nor sufficient in the formation of loyalty as satisfaction and commitment; results still asserted the significant impact of loyalty programmes on guest loyalty, more than staff loyalty and staff interaction. It can thus be concluded that both satisfaction and commitment should be realised before a sense of loyalty develops and it is the sense of loyalty which further drives guests to initiate the decision to become members in a hotel loyalty programme.
References Alerck, P. L., & Settle, R. B. (2004). The survey research handbook. New York: McGraw-Hill/Irwin. Alonso, S. (2000). The antecedents and consequences of customer loyalty: The roles of customer satisfaction and consumer trust-commitment. Doctoral dissertation, University of Texas. Anderson, E. & Weitz, B. (1992). The use of pledges to build and sustain commitment in distribution channels. Journal of Marketing Research, 29(1), 18-34. Ball, D., Coello, D. S., & Vilares, M. J. (2006). Service personalization and loyalty. Journal of Services Marketing, 20(6), 391-403. Bendapudi, N., & Berry, L. (1997). Customers‘ motivations for maintaining relationships with service providers. Journal of Retailing, 73(1), 15-37. Berry, L. L. (1995). Relationship marketing of services-Growing interest, emerging perspectives. . Journal of the Academy of Marketing Science, 23(4), 236-245. Berry, L. L., & Parasuraman, A. (1992). Prescriptions for a service quality revolution in America. Organizational Dynamics, 20(4), 5-15. Blunch, N. J. (2008). Introduction to structural equation modeling using SPSS and AMOS. London: Sage publishing. Bolton, R. N., Kannan, P. K., & Bramlett, M. D. (2000). Implications of loyalty program membership and service experiences for customer retention and value. Journal of the Academy of Marketing Science, 28(1), 95-108. Bove, L. L., & Johnson, L. W. (2006). Customer loyalty to one service worker: Should it be discouraged? International Journal of Research in Marketing, 23(1), 79-91. Bowen, J. T., & Chen, S. L. (2001). The relationship between customer loyalty and customer satisfaction. International Journal of Contemporary Hospitality Management, 13(4), 213-217.
..... 34
Special Issue: Hotel Operations Management – Issues and Challenges
Vol. 5, January 2013
Bowen, J. T., & Shoemaker, S. (1998). Loyalty: A Strategic commitment? Cornell Hotel and Restaurant Administration Quarterly, 39(1), 12-25. Byrne, B. M. (1998). Structural equation modeling with LISREL, PRELIS, and SIMPLIS: Basic concepts, applications, and programming. New Jersey: Lawrence Erlbaum Associates. Caruana, A. (2002). Service loyalty: The effects of service quality and the mediating role of customer satisfaction. European Journal of Marketing, 36(7/8), 811-828. Cengiz, E., Ayyildiz, H., & Er, B. (2007). Effects of image and advertising efficiency on customer loyalty and antecedents of loyalty: Turkish banks sample. Banks and Bank Systems, 2(1), 56-78. Coakes, S. J., Steed, L., & Dzidic, P. (2010). SPSS version 18.0 for windows: Analysis without Anguish. Australia: John Willey & Sons. Cronin, J. J., & Taylor, S. A. (1992). Measuring service quality: A Reexamination and extension. Journal of Marketing, 56(3), 55-68. Fullerton, G. (2003). When does commitment leads to loyalty? Journal of Service Research, 5(4), 333-344. Gremler, D. D., & Brown, S. W. (1996). Service loyalty: Its nature, importance and implications. In Edvardsson, B., Brown, S. W., Johnston, R., & Scheuing, E. (Ed.), QUIS V: Advancing service quality: A Global perspective (pp.171-181). New York: ISQA. Gronroos, C. (2000). Service management and marketing: A Customer relationship management approach. Singapore: John Wiley & Sons. Gupta, A., McDaniel, J. C., & Herath, S. K. (2005). Quality management in service firms: Sustaining structures of total quality service. Managing Service Quality, 15(4), 389-402. Gwinner, K. P., Gremler, D. D., & Bitner, M. J. (1998). Relational benefits in services industries: The customer`s perspective. Journal of the Academy of Marketing Science, 26(2), 101-114. Hoyle, R. H. (1995). Structural equation modeling. London: Sage. Kandampully, J. (1997). Firms should give loyalty before they can expect it from customers. Managing service Quality, 7(2), 92-94. Kelloway, E. K. (1998). Using LISREL for structural equation modeling: A Researcher‟s guide. London: SAGE. Lee, S., Barker, S., & Kandampully, J. (2003). Technology, service quality, and customer loyalty in hotels: Australian managerial perspectives. Managing Service Quality, 13(5), 423-432. Lenka, U., Suar, D., & Mohapatra, P. K. J. (2009). Service quality, customer satisfaction, and customer loyalty in Indian commercial banks. The Journal of Entrepreneurship, 18(1), 47-64. Liu, Y. (2007). The long-term impact of loyalty programs on consumer purchase behavior and loyalty. Journal of Marketing, 71(4), 19-35. Melnyk, V. (2005). Creating effective loyalty programs: Knowing what (wo-)men want. Doctoral dissertation, Tilburg University. Moorman, C., Zaltman, G., & Deshpande, R. (1992). Relationships between providers and users of market research: The dynamics of trust within and between organizations. Journal of Marketing Research, 29(3), 314-329. Morgan, R. M., & Hunt, S. D. (1994). The commitment-trust theory of relationship marketing. Journal of Marketing, 58(3), 20-38. Nunes, J. C., & Dreze, X. (2006). Your loyalty program is betraying you. Harvard Business Review, 84(4), 124-131. O‘Malley, L. (1998). Can loyalty schemes really build loyalty? Marketing Intelligence & Planning, 16(1), 47-55. Oliver, R. L. (1981). Measurement and evaluation of satisfaction process in retail settings. Journal of Retailing, 57(3), 25-48. Oliver, R. L. (1999). Whence consumer loyalty? Journal of Marketing, 63(4), 33-44. Palmer, A., Mcmahon-Beattie, U., & Beggs, R. (2000). Influences on loyalty programme effectiveness: A Conceptual framework and case study investigation. Journal of Strategic Marketing, 8(1), 47-66. Raykov, T, & Marcoulides, G. A. (2006). A First course in structural equation modelling. California: Lawrence Erlbaum Associates. Reichheld, F. F. (1993). Loyalty-based management. Harvard Business Review, 71(2), 64-73. Reichheld, F. F. (1996). The loyalty effect: The hidden force behind growth, profits, and lasting value. Boston: Harvard Business School Press. Ryan, C. (1995). Researching tourist satisfaction: Issues, concepts, problems. London: Routledge. Sheth, J. N., & Atul, P. (1995). Relationship marketing in consumer markets: Antecedents and consequences. Journal of the Academy of Marketing Science, 23(4), 255-271. Te Peci, M. (1999). Increasing brand loyalty in the hospitality industry. International Journal of Contemporary Hospitality Management, 11(5), 223-229. Wong, A., & Sohal, A. (2003). Service quality and customer loyalty perspectives on two levels of retail relationships. Journal of Services Marketing, 17(5), 495-513.
35
Indian Journal of Applied Hospitality and Tourism Research
Yi, Y., & Jeon, H. (2003). Effects of loyalty programs on value perception, program loyalty, and brand loyalty. Academy of Marketing Science, 31(3), 229-240. Zeithaml, V. A., Berry, L. L., & Parasuraman, A. (1988). Communication and control processes in the delivery of service quality. Journal of Marketing, 52(2), 35-48.
Appendix A Table 1: Mean and Standard Deviation for the 51 survey items The hotel’s premises were clean. The hotel’s furniture was comfortable for the guests. The hotel staff provides services as promised. The hotel’s premises were noise acceptable. The hotel staff were courteous, polite, and well mannered. I am satisfied with my decision to choose the hotel. The hotel services adequately fulfilled my expectations. I truly enjoyed staying at the hotel. The hotel staff were knowledgeable and competent. The hotel staff helped me and responded to my requests. The hotel‘s facilities were reliable. The hotel‘s facilities were easy to use. The hotel staff cared and were concerned about guests‘ comfort. The hotel‘s facilities were visually appealing. The hotel staff provided services right from the first moment of contact. The hotel staff provided a prompt response to guest needs. The hotel services were exactly what I needed. The hotel staff understood the needs of their guests. If I was in the hotel X loyalty programme, I‘d never return to it if staff were rude. The hotel staff had a smart appearance. The hotel staff were able to take proper actions when needed. I‘d expect the service to be better and quicker as a loyalty member. The hotel provided fast check-in and check-out. If I was a member of hotel X programme, I‘d return to the hotel. The hotel staff responded to my requests promptly. I recommend hotel X to my friends and workmates. If I was in the hotel X loyalty programme, hotel X would be my first choice. If I was in the hotel X loyalty programme, I‘d still look for better deals. I always think of hotel X as an ideal accommodation. The hotel staff were enthusiastic and committed. I‘d feel more strongly connected to a hotel for which I hold a loyalty card. I consider hotel X as my first choice when I need to stay in a hotel. If I like hotel X service, I rarely switch from it just to try another hotel. Experiencing something unique is what makes me return to hotel X. The hotel services were some of best hotel services I‘ve ever received. The hotel staff went beyond their specified duties to serve me. The hotel staff gave me personal attention. I‘d feel special if I was a member of hotel X programme. The hotel staff knew exactly what my needs were. I always stay at hotel X, even though there are other options. Being recognised as a return guest is what makes me return to hotel X. If I was in the hotel X loyalty programme, I‘d feel a strong sense of belonging. If I was in the hotel X loyalty programme, I‘d judge hotel X services differently. If I wanted to stay at another hotel, it would be more costly. I hate to switch once I get used to a hotel service. I feel that I care about the success of the hotel. I stay at the hotel more as a matter of necessity than of desire. I feel emotionally attached to the hotel. If I was in the hotel X loyalty programme, I’d feel emotionally attached to the hotel. I feel a strong sense of belonging toward the hotel. If I wanted to stay at another hotel, it would be very difficult.
..... 36
Mean 5.80 5.39 5.37 5.35 5.34 5.31 5.29 5.27 5.26 5.25 5.22 5.20 5.19 5.16 5.16 5.15 5.14 5.13 5.07 5.07 5.04 4.96 4.94 4.87 4.87 4.86 4.83 4.76 4.74 4.71 4.68 4.61 4.51 4.47 4.40 4.39 4.34 4.29 4.28 4.25 4.18 4.15 4.00 3.93 3.89 3.88 3.85 3.75 3.71 3.68 3.37
S.D. 1.26 1.27 1.33 1.39 1.24 1.31 1.25 1.27 1.33 1.47 1.27 1.27 3.22 1.30 1.41 1.49 1.31 1.37 2.99 1.32 1.58 1.44 1.33 1.49 1.40 1.47 1.52 1.55 1.53 1.32 1.46 1.64 1.64 1.53 1.57 1.46 1.40 1.59 1.35 1.64 1.56 1.55 1.53 1.65 1.65 1.57 1.57 1.67 1.57 1.56 1.57
Special Issue: Hotel Operations Management – Issues and Challenges
Table 2: Summary of Results Hypotheses H1a: Guest affective commitment has a positive impact on guest loyalty H1b: Guest continuance commitment has a negative impact on guest loyalty H2: Guest satisfaction has a positive impact on guest loyalty H3a: Technical quality has a positive impact on guest satisfaction H3b: Tangible quality has a positive impact on guest satisfaction H3c: Staff interaction has a positive impact on guest satisfaction H4a: Technical quality has a positive impact on guest loyalty H4b: Tangible quality has a positive impact on guest satisfaction H4c: Staff interaction has a positive impact on guest satisfaction H5: Staff loyalty has a positive impact on guest loyalty H6:Loyalty programmes before service encounter has a direct impact on guest loyalty H7:Loyalty programmes during service encounter has a positive impact on guest satisfaction H8a:Loyalty programmes after service encounter has a positive impact on guest affective commitment H8b:Loyalty programmes after service encounter has a positive impact on guest continuance commitment
Vol. 5, January 2013
Results Supported Not Supported Supported Supported Supported Not Supported Not Supported Not Supported Supported Supported Supported
p-value p < 0.001 p > 0.05 p < 0.001 p < 0.001 p < 0.001 p < 0.01 p > 0.05 p > 0.05 p < 0.05 p < 0.001 p < 0.01
Supported
p < 0.001
Supported
p < 0.001
Supported
p < 0.001
37
Indian Journal of Applied Hospitality and Tourism Research
Frontline Employee Demographics and Its Impact on Job Satisfaction and Organisational Commitment Abstract Job satisfaction is an important human resource management issue. Human resources have become the most important competitive resources of today; higher employee job satisfaction will improve employee productivity and also improve enterprise management harmony. The hospitality industry is an international industry, and the market is extremely competitive whose profitability is generally very low. Therefore the enterprises must improve the quality of service if they want to develop in this intense environment. An effective way is to constantly improve the quality of employee service, especially the frontline employees which are an important human resource for the hotel industry as they are the ones who actually interact with the guests primarily, thus creating an impact upon them. Therefore to understand the frontline employee‟ satisfaction with their job and commitment to their organization is a must because in a global competitive environment, establishing and maintaining long-term relationship with customers is of paramount importance to the success of hospitality firms. In hospitality industry, managers need to do a great job with their frontline employees, before expecting them to deliver superior services to customers. Also a lot of previous studies have investigated the effects of various organizational variables on frontline employee performance and their job satisfaction. But very less empirical studies have been conducted to evaluate the effects of individual characteristics on job satisfaction of the employees and their commitment to their organization. Thus, in lieu of the same, the present study aims to examine the impact of selected individual characteristics of frontline employees on their commitment and job satisfaction.
Keywords: Job satisfaction, Frontline employee, Job performances, Organizational commitment etc.
Introduction In this global competitive scenario, establishing and maintaining long-term relationship with customers is of foremost importance to the success of tourism and hospitality firms (Karatepe, Uludag, Menevis, Hadzimehmedagic, & Baddar, 2006, p.547-560). The hotel industry is an international industry, and the market is extremely competitive. Frontline employees are an important human resource for the hotel industry. The success of every hospitality firm‘s business is directly related to its frontline employees. Actually, when it comes to a customer‘s perspective of a hospitality firm, the employees are the business. Therefore, the frontline employees are definitely the face of every hospitality industry as they play a very vital role in linking tourism and hospitality firms with customers and thus in maintaining and establishing long term relationships (Kusluvan, 2003). Indeed, successful service firms have invested resources into programs in order to increase their employee‘s performance and job satisfaction (George &Weimerskirch, 1994). However, in contrast with other industries, hotel industry has no routine holiday and needs to work 24 hours a day, 7 days a week. It is commonly held belief that it is the nature of the work, inadequate pay with service money oriented; long working hours, overwork loads, low job security, limited training and development opportunities contribute to an unsatisfied job than that turn to a high turnover. In actual fact, frontline employees are still undertrained, underpaid and over worked (Singh, 2000).Henceforward, many studies have found that high turnover is related to job satisfaction and these issues impact on low commitments. A careful review of the literature indicates that the organization obtain satisfactory outcomes from favoured treatment of employees. Employees who are treated well are more likely to be committed and involved to their organization than other. Incontestably, hospitality managers need to seek effective ways to be able to strengthen the job satisfaction and organizational commitment of frontline employees ((Karatepe, Uludag, Menevis, Hadzimehmedagic, & Baddar, 2006, p.547-560). In an internal marketing perspective, tourism and hospitality managers need to do a great job with their frontline employees, before expecting them to deliver superior services to customers (George, 1990). A number of literatures related to employee organization relationships have focused on perceived organizational support and positive relationship with job satisfaction and job performance. In the marketing literature, there are ample number of empirical studies that have investigated the effects of various organizational variables on frontline employee performance and job satisfaction (Brown and Peterson, 1993; Churchill, Ford, Hartley, and Walker, 1985). By contrast to this, less empirical attention has been paid to the effects of individual characteristics demographics on job satisfaction and organizational commitment (Brown and Peterson, 1994; Krishnan, Netemeyer, and Boles, 2002, Yoon, Beatty, &Suh, 2001) Dr. Suvidha Khanna, School of Hospitality and Tourism Management, University of Jammu, Jammu. Email:
[email protected], Shahnaz Akhtar, Research Scholar, School of Hospitality and Tourism Management (SHTM), University of Jammu, Jammu. Email:
[email protected]
..... 38
Special Issue: Hotel Operations Management – Issues and Challenges
Vol. 5, January 2013
To bridge the gap in the employee‘s job satisfaction literature, the main purpose of this study attempts to examine the relation of perceived organizational support on frontline employee‘s job satisfaction and organizational commitment in hotel industry.
Review of Literature Job Satisfaction:Job satisfaction has been defined as a pleasurable emotional state resulting from the appraisal of one‘s job; an affective reaction to one‘s job; and an attitude towards one‘s job. Job satisfaction describes how content an individual is with his /her job. The happier employees are within their job, the more satisfied they are said to be. Job satisfaction is not the same as motivation or aptitude, although it is clearly linked. Other influences on satisfaction include the management style and culture, employee involvement, empowerment and autonomous work position. Job satisfaction is a very important attribute which is frequently measured by organizations. Two-Factor Theory (Motivator-Hygiene Theory) Frederick Herzberg‘s two factor theory (also known as Motivator Hygiene Theory) attempts to explain satisfaction and motivation in the workplace. This theory states that satisfaction and dissatisfaction are driven by different factors – motivation and hygiene factors, respectively. An employee‘s motivation to work is continually related to job satisfaction of a subordinate. Motivating factors are those aspects of the job that make people want to perform, and provide people with satisfaction, for example achievement in work, recognition, promotion opportunities. These motivating factors are considered to be intrinsic to the job, or the work carried out. The factors associated with work that are considered to be hygienic include: policies and administrations; supervision/ managerial relationships; salaries; working conditions; status; security; and co-worker relationships. Research suggests that employees that benefit from the organization‘s support will increasingly feel a sense of praise, support, or approval from their organization. In other words, employees must gain this sense of support prior to their reciprocation of supportive human resource practices. Specifically, research had indicated that individuals, who perceive that their organization supports them, are more likely to be satisfied with their job. Organizational Commitment:The definitions of organizational commitment include identification with the organization, shared goals and values between the organization and the individual, continuing membership in the organization, and attachment to social relationships in the organization. According to Maynard et al, basically an organizational commitment is a structural phenomenon of a transaction between an individual and an organization, and its non- transferable investment result shall increase as time goes on; employees are reluctant to leave the organization because of the salary, status, position, and friendship among colleagues. Organizational commitment is typically conceptualized as being comprised of three parts: a mental state that reflects the necessity (affective commitment), perceived cost associated with leaving the organization; the desire (continuance commitment), and /or the obligation (normative commitment) to remain in the organization. Frontline employees of hospitality industry spend most of their time directly with customers. Therefore, the attitudes and behaviours of frontline employees influence customers‘ perceptions of services (Bettencourt and Brown, 2003; Hartline and Ferrell, 1996; Hurley, 1998).In addition to this, Kusluvan (2003) discusses that work- related employee attitudes and behaviours are critical determinants of employee outcomes due to the unique characteristics of services they provided to their customers. With this realization, determining what may lead frontline employees to increased performance and job satisfaction becomes a critical issue for tourism and hospitality firms. In this study, job satisfaction is defined as the ―the emotional state resulting from the appraisal of one‘s job and as can be negative, positive; or neutral‖ (Arvey, 1995). Job satisfaction is one of the most widely studying and measuring constructs in the organizational behaviour and management literature. Job satisfaction has been defined simply as a worker‘s positive or negative attitudes towards one‘s job. Job satisfaction is also defined as ones positive feeling about his/her job, but also further stated that the assessment was based on an evaluation of the job characteristics (Robbins and Judge). Each individual of values, attitudes and expectations differ; thus, motivational factors can be quite different. Similarly, job satisfaction is an employee effective response resulting from an evaluation of the work situation. Most approaches to the job satisfaction are based on the theories of motivation, among the premise of the Herzberg et al. (1959) theory, known as the Two-Factor Theory of Motivation. 39
Indian Journal of Applied Hospitality and Tourism Research
Intrinsic factors such as employee‘s opportunity for personal achievement, recognition from supervisors, the work itself, and the growth are related to job satisfaction. Conversely, extrinsic factors such as company policy, administration, supervision, and working conditions are associated with job dissatisfaction. According to Herzberg et al, the factors associated with work that are considered to be the motivators include: achievement; recognition; task (the work itself); responsibility; advancement; and personal growth. The factors associated with work that are considered to be hygienic include: policies and administration; supervision/managerial relationships; salaries; working conditions; status; security; and co-worker relationships. Gupta and Joshi (2008) had concluded in their research that job satisfaction is an important technique used to motivate the employees to work harder. It had often said that ―A Happy Employee is a Productive Employee‖. Job satisfaction is very important because most of the people spend a major part of their life at their work place as an employee. Khan (2006) reveals in his study, Hoppack brought job satisfaction to limelight and he observed job satisfaction in the combination of psychological and environmental circumstances that cause person to fully say, ―I am satisfied with my job‖. Rao (2005), concluded in his study that job satisfaction refer to person‘s feeling of satisfaction with his job, which acts as a motivation factor towards the work. It is not the self satisfaction, happiness or self-contentment but the satisfaction of the job. According to him, there are four types of theories: 1. Need Fulfilment Theory 2.Equity Theory 3.Two Factor Theory 4.Discrepancy Theory. In opinion of Aswathappa (2003), the job satisfaction of employees can be judged through the system of wage payment. Different organizations adopt different type of wage payment system. Along with wages and salaries they are paying incentives, perquisites and non-monetary benefits. According to him, he explained three theories of remuneration: A. Reinforcement and Expectancy Theory B. Equity Theory C. Agency Theory. Velnampy(2008), in his study ―Job Attitude and Employees performance of public sector organizations in Jaffna districts, Srilanka‖ concluded that job satisfaction has an impact on future performance through the job involvement, but higher performance also makes people feel more satisfied and committed. Attitudes such as satisfaction and involvement are important part of the employees for their high performance. Thus, the results of the study revealed that attitude namely satisfaction and involvement, and performance are significantly correlated. Brown,Ford,et al(2008), in their study ―Changes in HRM and job satisfaction, 1998-2004; evidence from the work place Employment Relations Survey‖ examined that their significant increases in satisfaction with the sense of achievement from work between 1998 and 2004; a number of other measures of job quality are found to have increased over this period as well. It also finds a decline in the incidence of many formal human resource management practices and satisfaction with sense of achievement. Improvements in perceptions of job security, the climate of employment relation and managerial responsiveness are the most important factors in explaining the rise in satisfaction with sense of achievement between 1998 and 2004. Shah and Shah (2008), in their study, ―Job satisfaction and Fatigue variables‖ concluded that relationship between fatigue and job satisfaction variables which were found to be significantly negative. The study also found that fatigue is negative predictor of job satisfaction.
Objectives of the Study The main purpose of this study attempts to evaluate the effect of employee demographics under study on job satisfaction and organizational commitment and also the study aims to examine the impact of Job satisfaction on organizational commitment of the frontline employees in hotel industry.
Hypothesis: H1. Demographics have positive effect on job satisfaction of frontline employees in hotel industry. H2. Frontline employee demographics positively affect their organizational commitment in hotel industry. H3. Job satisfaction has positively significant effect on organizational commitment of the frontline employees in hotel industry.
Methodology Setting and Sample: The aforementioned hypotheses were tested using data collected from a sample of frontline employees in Jammu hotels. Specifically, the sampling plan of the empirical study included frontline employees in 5 A-Star hotels in Jammu categorized by Department of Tourism, J&K. There are three reasons for ..... 40
Special Issue: Hotel Operations Management – Issues and Challenges
Vol. 5, January 2013
using data collected from a sample of frontline employees in hotels. First, frontline employees ―are in best position to evaluate performance outcomes, and their perceptions typically converge with customers‖(Babakus, Yavas, Karatepe, & Avci,2003,p.278).Second, ―service quality in many industries depends on the customer- oriented behaviours of frontline service employees‖(Bettencourt & Brown, 2003,p.394). Finally, frontlines spend most of their time directly with customers. Therefore, the attitudes and behaviours of frontline employees influence customers‘ perceptions of services (Bettencourt & Brown, 2003; Hartline & Ferrell, 1996: Hurley, 1998). According to the information received from the management of the hotels, the total numbers of frontline employees in these hotels were 77.For data collection; the researcher personally contacted all 77 respondents in the mentioned A-class five hotels in the research location. But out of all, only 50 respondents responded back and out of the 50 respondents, only 43 were the usable responses leading to 56% of the response rate. Sample sizes of 43 respondents with break-up with respect to hotels are: S.No.
Name of the Hotel
Sample size
1
K.C.Hotel (P) Ltd.
9
2
Hotel Asia
12
3
Hari Niwas Hotel Resort (P) Ltd.
6
4
Hotel Jhelum Resort (P) Ltd.
8
5
Fortune Rivera Hotel (P) Ltd.
8
Instrument Development: The study used structured questionnaire consisted of four parts:1. Part –A consists of the demographic variables like gender, age, educational status, marital status, monthly income, etc. 2. Part-B consists of the satisfaction level among the frontline employees in the hotel industry; a 23item job satisfaction index is used by the researcher developed by ―Ololube, N.P. (2006) and various factors and considerations in the hotel industry of the study area. For each item, respondents used 5point Likert scale to respond their opinion i.e. 1 being ―Strongly disagree‖- to- 5 being ―Strongly agree‖. 3. Part-C consists of the organizational commitment level among the frontline employees in the hotel industry; a 15- item structured questionnaire on organizational commitment index is taken for the study developed by ―Mowday, Steers, and Porter 1979‖.Again, for each item, respondents used 5point Likert scale to respond their opinion i.e.-e 1 being ―Strongly disagree- to- 5=Strongly agree‖. 4. Part-D consists of the Conclusions and Suggestions. Statistical Tools Applied:The following statistical tools are applied in the study: 1. Percentage is used in analyzing frontline employees‘ profile. 2. Mean is used to deduce their opinion regarding job satisfaction and organizational commitment index. 3. Regression is used to find the impact of Job satisfaction on Organizational commitment. 5. ANOVA is used to evaluate the effect of demographics on Job satisfaction and Organizational commitment.
Analysis and Interpretation In Table 1, the Demographic profile of the respondents is been given. It has been seen that out of 43 total respondents, 27(62.8%) are Male and 16(37.2%) are Female. Maximum number of the respondents fall in the age group of 20-40 (95.4%) followed by the age group of 40-60 (4.6%). It is also seen that maximum of the respondents under study are graduate 21(48.8%), followed by the professional 12(27.9%), postgraduate are 9(20.93%) and only 1(2.32%) is undergraduate. Again majority of the respondents21 (48.84%) are from operational level followed by the same number of respondents belongs to managerial and supervisory level 11 (25.58%).It is found that almost 13(30.23%) of the respondents have less than Rs. 10,000 of monthly income followed by 29(67.44%) who fall in the bracket of monthly income between Rs. 10,000- 20,000 and only 1(2.32%) out of the total respondents have monthly income between Rs. 20,000- 30,000.Almost 26(60.46%) of the respondents have their organizational tenure between 1-5 yrs, 13(30.23%) have their organizational tenure between6-10,followed by 3(6.97%) and 1(2.32%) have their organizational tenure from under 41
Indian Journal of Applied Hospitality and Tourism Research
1 yr and between 11- 15yrs.Most of the respondents 27(62.79) are single and the rest 16(37.2%)are married. Table 1: Demographic Profile of the Respondents No. %age Demographic Variable N=43 1. Gender (a) Male 27 62.8% (b) Female 16 37.2% 2. Age (a) Below 20 0 0 (b) 20 – 40 41 95.4% (c) 40 – 60 2 4.6% (d) Above 60 0 0 3. Educational Status (a) Undergraduate 1 2.32% (b) Graduate 21 48.8% (c) Post graduate 9 20.93% (d) Professional 12 27.9% (e) PhD 0 0 (f) Others 0 0 4. Hierarchal Level (a) Managerial 11 25.58% (b) Supervisory 11 25.58% (c) Operational 21 48.84% 5. Monthly Income(in Rupees) (a) Less than 10,000 13 30.23% (b) 10,000 – 20,000 29 67.44% (c) 20,000 – 30,000 1 2.32% (d) 30,000- 40,000 0 (e) Above 40,000 0 6.Organizational tenure (a) Under1Year 3 6.97% (b) 1 – 5 years 26 60.46% (c)6- 10 years 13 30.23% (d) 11-15 years 1 2.32% (e) Above 15 years 0 7. Marital Status (a) Single 27 62.8% (b) Married 16 37.2% (c) Separated 0 ___ (d) Widowed 0 ___
Table 2 provides the information on the satisfaction of frontline employees on job satisfaction index. It has been seen that satisfaction was found highest with ‗My job is challenging and full of responsibility‘ (Mean=4.674) and lowest with ‗I feel as if each working day is very long and boring‘ (Mean=2.697).The mean score of satisfaction with other job satisfaction variables are:- I am adequately paid for the job I do (Mean=4.42), I get enough incentives for the efforts I put in(Mean=4.372),I enjoy the working environment(Mean=4.625),I am satisfied the job content(Mean=4.442),My job has enough scope for me to grow and develop(Mean=4.535),I am satisfied with communication pattern in my organization(Mean=4.442),I am satisfied with my job security(Mean=4.465),I share a good professional relation with my supervisor(Mean=4.605),My job is challenging and full of responsibility(Mean=4.674),I share a good professional relation with my peers(Mean=4.488),My job has a fair(impartial) promotion policy(Mean=4.512),I feel my organization has a bright future(Mean=4.395), I am able to fulfill my family demands in terms of time(Mean=4.093), I enjoy the freedom and creativity in my job (Mean=4.186), As far as accountability of people for result is concerned, I am satisfied (4.279), I feel relaxed at my work place (Mean=4.372), I feel satisfied with my present job(Mean=4.186),My supervisor appreciates for the efforts I put in(Mean=4.395), My supervisor encourages new and innovative ideas(Mean=4.209),I feel satisfied the way the organization attract talent to the organization(Mean=4.326), My job does not make me do anything unethical or against my conscience(Mean=4.093), I feel happy that I took this job(Mean=3.605), I feel as if each working day is very long and boring(Mean=2.697) respectively.
..... 42
Special Issue: Hotel Operations Management – Issues and Challenges
S.No. 1 2 3. 4 5 6 7 8 9 10 11 12 13 14 15 16 17 18 19 20 21 22 23
S. No. 1 2 3 4 5 6 7 8 9 10 11 12 13 14 15
Table 2: Job Satisfaction index: Statements I am adequately paid for the job I do. I get enough incentives for the efforts I put in. I enjoy the working environment. I am satisfied with the job content. My job has enough scope for me to grow and develop. I am satisfied with communication pattern in my organization. I am satisfied with my job security. I share a good professional relation with my supervisor. My job is challenging and full of responsibility. I share a good professional relation with my peers. My job has a fair (impartial) promotion policy. I feel my organization has a bright future. I am able to fulfill my family demands in terms of time. I enjoy the freedom and creativity in my job. As far as accountability of people for results is concerned, I am satisfied. I feel relaxed with my work place. I feel satisfied with my present job. My supervisor appreciates for the efforts I put in. My supervisor encourages new and innovative ideas. I feel satisfied the way the organization attract talent to the organization. My job does not make me do anything unethical or against my conscience. I feel happy that I took this job. I feel as if each working day is very long and boring.
Vol. 5, January 2013
Mean 4.42 4.37 4.62 4.44 4.54 4.44 4.46 4.61 4.67 4.49 4.51 4.39 4.09 4.19 4.28 4.37 4.186 4.395 4.209 4.326 4.093 3.605 2.697
Table 3: Organizational Commitment Statements I am willing to put in a great deal of effort beyond that normally expected in order to help this organization be successful. I talk up this organization to my friends as a great organization to work for. I feel very little loyalty to this organization. I would accept almost any type of job assignment in order to keep working for this organization. I find that my values and the organization‘s values are very similar. I am proud to tell others that I am part of this organization. I could just as well be working for a different organization as long as the type of work was similar. This organization really inspires the very best in me in the way of job performance. It would take very little change in my present circumstances to cause me to leave this organization. I am extremely glad that I chose this organization to work for over others I was considering at the time I joined. There‘s not too much to be gained by sticking with this organization indefinitely. Often, I find it easy to agree with this organization‘s policies on important matters relating to its employees. I really care about the fate of this organization. For me, this is the best of all possible organization for which to work. Deciding to work for this organization was not at all a mistake on my part.
Mean 4.791 4.605 3.93 3.977 4.326 4.465 4.256 4.349 4.163 4.349 3.628 3.884 3.581 3.884 3.442
Table 3 shows the evaluation of Organizational commitment about pre-determined parameters where in the total number of the respondents from hotels is 77. The scores are based on a five point Likert type scale where respondents were asked to ascertain their opinion towards organizational commitment. It was found in the table that the mean score highest with ‗I am willing to put in a great deal of effort beyond that normally expected in order to help this organization be successful‘ (Mean=4.791) and lowest with ‗Deciding to work for this organization was not at all a mistake on my part‘ (Mean=3.442).The mean score of commitment with other organizational commitment are:- ‗I am willing to put in a great deal of effort beyond that normally expected in order to help this organization be successful‘(Mean=4.791), ‗I talk up this organization to my friends as a great organization to work for‘ (Mean=4.605), ‗I feel very little loyalty to this organization‘ (Mean=3.93),‘I would accept almost any type of job assignment in order to keep working for this organization‘(Mean=3.977), ‗I find that 43
Indian Journal of Applied Hospitality and Tourism Research
my values and the organization‘s values are very similar‘ (Mean=4.326), ‗I am proud to tell others that I am a part of this organization‘ (Mean=4.465), ‗I could just as well be working for a different organization as long as the type of work was similar‘ (Mean=4.256), ‗This organization really inspires the very best in me in the way of job performance‘ (Mean=4.349), ‗It would take very little change in my present circumstances to cause me to leave this organization‘ (Mean=4.163), ‗I am extremely glad that I chose this organization to work for over others I was considering at the time I joined‘ (Mean=4.349), ‗There‘s not too much to be gained by sticking with this organization indefinitely‘ (Mean=3.628), ‗Often I find it easy to agree with this organization‘s polices on important matters relating to its employees‘ (Mean=3.884),‘I really cares about the fate of this organization‘ (Mean=3.581),‘For me this is the best of all possible organization for which to work‘(Mean=3.884), ‗Deciding to work for this organization \was not at all a mistake on my part‘ (Mean=3.442). Table 4: Significant Difference in Gender Profile on Organizational Commitment & Job Satisfaction. Source of Variance S.S df MS Fcal F.table Rows (gender) 3.6E-05 1 3.6 0.00326 161.45 Columns (Organization Commitment &Job Satisfaction) 0.0888 1 0.085 7.7867 161.45 Error 0.0110 1 0.011 Total 0.09691 3
In table 4, the calculated value of ‗Fo.o5‘ (0.00326) is less than the table value [For v1=1,v2=1,F0.05=161.45], thus the null hypothesis i.e.-e gender has an effect on job satisfaction and organizational commitment of frontline employees in hotel industry is accepted. Table 5: Significant difference of Age on Organizational Commitment and Job Satisfaction Source of Variance S.S df M.S Fcal. F table Rows 0.0019 1 0.0019 0.0703 161.45 Columns 0.1436 1 0.1436 5.2126 161.45 Error 0.0275 1 0.0275 Total 0.173 3
In table 5,it shows that the calculated value of ‗Fo.o5‘(0.0703) is less than the table value[For v1=1,v2=1,F0.05=161.45], thus the null hypothesis i.e.-e age has an effect on job satisfaction and organizational commitment of frontline employees in hotel industry is accepted. Table 6: Significant Difference in Educational Status on Organizational Commitment & Job Satisfaction. Source of Variance S.S df M.S F cal F table Rows(educational status) 0.271 3 0.0904 3.401 9.276 Columns(Job satisfaction & Organizational commitment) 0.212 1 0.212 7.984 10.128 Error 0.079 3 0.026 Total 0.563 7
In table 6, the calculated value of ‗Fo.o5‘ (3.401) is less than the table value [For v1=3,v2=3,F0.05=9.276], thus the null hypothesis i.e.-e educational status has an effect on job satisfaction and organizational commitment of frontline employees in hotel industry is accepted. Table 7: Significant difference of Hierarchical level on Organizational Commitment & Job Satisfaction Source of Variance S.S df M.S F cal F.table Rows(Hierarchical level) 0.034 2 0.017 43.405 19.000 Columns(Job satisfaction & Organizational commitment) 0.082 1 0.082 207.15 18.513 Error 0.0007 2 0.0004 Total 0.117 5
In table 7, the calculated value of ‗Fo.o5‘ (43.405) is more than the table value [For v1=2, v2=2,F0.05=9.00], thus the null hypothesis i.e.-e hierarchical level has an effect on job satisfaction and organizational commitment of frontline employees in hotel industry, is rejected which implies that there exists a difference in the hierarchical level in job satisfaction and organizational commitment. Table 8: Significant Difference of Monthly Income on Job Satisfaction and Organizational Commitment. Source of Variance S.S df M.S F.cal F.table Rows(Monthly income) 0.1608 2 0.0804 8.697 19.000 Columns(Job satisfaction and Organizational commitment) 0.137 1 0.137 14.825 18.513 Error 0.018 2 0.009 Total 0.316 5
In table 8, the calculated value of ‗Fo.o5‘ (8.697) is less than the table value [For v1=2,v2=1,F0.05=1.9], thus the null hypothesis i.e.-e monthly income of the frontline employees in the hotel industry has an ..... 44
Special Issue: Hotel Operations Management – Issues and Challenges
Vol. 5, January 2013
effect on the job satisfactions and organizational commitment of frontline employees in hotel industry, is accepted. Table 9: Significant Difference of Organizational Tenure on Job Satisfaction and Organizational Commitment.
Source of Variance Rows(Organizational tenure) Columns(Job satisfaction & organizational commitment) Error Total
S.S 0.112 0.662 0.553 1.327
df 3 1 3 7
M.S 0.0375 0.662 0.184
F.cal 0.2036 3.594
F.table 9.276 10.128
In table 9, the calculated value of ‗Fo.o5‘ (0.2036) is less than the table value [For v1=1,v2=1,F0.05=9.276], thus the null hypothesis i.e.-e organizational tenure has an effect on job satisfactions and organizational commitment of frontline employees in hotel industry is accepted. Table 10: Significant Difference of Marital Status on Job Satisfaction and Organizational Commitment. Source of Variance S.S df M.S F.cal F.table Rows(Marital Status) 2.25E-06 1 2.25E-06 0.0007 161.45 Columns(Job satisfaction & Organizational commitment) 0.046 1 0.046 14.937 161.45 Error 0.003 1 0.003 Total 0.0491 3
In table 10, the calculated value of ‗Fo.o5‘ (0.0007) is less than the table value [For v1=1,v2=1,F0.05=161.45], thus the null hypothesis i.e.-e marital status has an effect on job satisfaction and organizational commitment of frontline employees in hotel industry, is accepted.
Intercept X Variable
Table 11: Impact of Job Satisfaction on Organizational Commitment . Co-efficient Standard Error T-stat P-Value 2.779 0.577 4.812 2.053-05 0.297 0.134 2.207 0.0329
Organizational commitment= 2.779+0.297(Job satisfaction) The regression equation above shows that the impact of Job satisfaction on Organizational commitment is 29.7%,that is, a unit change in Job satisfaction will lead to 0.297 unit change in Organizational commitment in the frontline employees of the hotels under study.
Conclusion and Suggestions The present study examined the impact of frontline employee demographics on job satisfaction and organizational commitment, using data collected from the frontline employees of 5-A star hotels in Jammu. The study results demonstrate that demographics have positive impact on the job satisfaction of frontline employees in hotel industry. The study findings also indicate that frontline employees‘ demographics positively relate to their organizational commitment in this industry and Job satisfaction has also positively significant effect on Organizational commitment of the frontline employees in hotel industry. In addition, the empirical findings of this study showed that job satisfaction depicts significant positive relationships with frontline employee‘s organizational commitment. These results also suggest that the working environment, good professional relation with supervisors and job challenges and responsibility make the job more enjoyable and attractive. These results also suggest that frontline employees exerting great efforts in implementing job related tasks become more satisfied with their jobs and ultimately lead to more commitment towards their organization. As expected, the empirical findings showed that job satisfaction is a significant determinant of frontline employee‘s organizational commitment. (Babakus, Cravens, Johnston, & Moncrief, 1996). Thus it is clear from the above results that supervisors/ managers should establish and maintain good relationships with their frontline employees to increase the level of employees effort, which, in turn, results in increased job satisfaction and they are more committed towards their organization. Accordingly, frontline employees having good relationship with their supervisors and peers will be more satisfied with their jobs and will be more committed towards their organization and job. Thus achievements of objectives in the present study are as follows:Q1: To evaluate the effect of employee demographics under study on Job satisfaction and Organizational commitment.
45
Indian Journal of Applied Hospitality and Tourism Research
H1:- Demographics have positive effect on Job satisfaction of frontline employees in hotel industry. H2:- Frontline employee demographics positively affect their Organizational commitment in hotel industry.
The results point out that gender, age, educational status, monthly income, organizational tenure and marital status effect job satisfaction and organizational commitment of frontline employees in the hotel industry. But in case of Hierarchical level, this does not have any effect. Thus, it can be concluded that demographics such as gender, age, educational status, etc. do impact the job satisfaction and organizational commitment of the employees working in the hotel industry, but their level does not matter i.e.-e job satisfaction followed by organizational commitment of the employees in hotel industry is not affected by the levels of hierarchy. Q2: To examine the impact of job satisfaction on organizational commitment of the frontline employees in hotel industry. H3:- Job satisfaction has positively significant effect on organizational commitment of frontline employees in hotel industry.
The study shows that job satisfaction has a significant positive impact on organizational commitment. There is nearly 30% influence of job satisfaction on organizational commitment been calculated in the study, but it can be said that the rest 70% influence is due to the factors which are not known in the study. Therefore, the hypothesis i.e.-e Job satisfaction has significant positive effect on organizational commitment of the frontline employees in the hotels under study, is accepted.
Relevance/ Implications of the Study This study might prove useful for the Researchers who will find enough insight for further research regarding the role of demographics in organizational commitment and job satisfaction of the frontline employees in hotel industry. The study has direct relevance for academic programs in hotels for the organizational commitment issues. The present empirical study has provided several useful guidelines for Managerial action also like Managers should try to make each working day of the employees little interesting as it is seen that the employees actually feed that their each day is very long and boring. Finally managers should establish and maintain good relationships with their frontline employees to increase the level of employee effort, which in turn results in increased job satisfaction and organizational commitment, References Arvey, R.D. (1995).Job satisfaction. In N.Nicholson (Ed.) Encyclopedia dictionary of organizational behavior behind (pp.272-274).Cambridge, MA: Blackwell Publishers. Babakus, E., Cravens, D.W., Johnston, M., &Moncrieff, W.C. (1996).Examining the role of organizational variables in the salesperson job satisfaction model. Journal of Personal Selling & Sales Management, 16(3), 33-46. Bettencourt, L.A., & Brown, S.W. (2003). Role stressors and customer-oriented boundary-spanning behaviours in service organizations. Journal of the Academy of Marketing Science, 31(4), 394-408. Brown, S.P, & Peterson, R.A (1993).Antecedents and consequences of salesperson job satisfaction.Meta-analysis and assessment of causal effects. Journal of Marketing Research, 30, 63-77. Brown, S.P, & Peterson, R.A (1994).The effect of effort on sales performance and job satisfaction. Journal of Marketing, 58, 70-80. Churchill,G.A.,Jr.,Ford,N.M.,Hartley,S.W.,&Walker,O.C.,Jr(1985).The determinants of salesperson performance: A metaanalysis. Journal of Marketing Research, 22,103-118. George, S., &Weimerskirch, A. (1994).Total quality management Strategies and techniques proven at today‘s most successful companies. New York: Wiley. George, W.R. (1990).Internal marketing and organizational behavior: A partnership in developing customer-conscious employees at every level. Journal of Business Research, 20, 63-70. Gupta K.Shashi & Joshi Rosy, Human Resource Management,2008,P.no.(20.9-20.17) Rao Subba P.,Essential of HRM and Industrial relationships,2005,P.no.(480-482).,Velnampy T., ―Job attitude and Employees Performance of Public Sector Organization in Jaffna District, Srilanka‖.,GITAM Journal of Management, Vol,6,Issue-2,April-June 2008,P.no.(66-73). Hardik Shah and Hiral Shah, ―Job Satisfaction and Fatigue Study‖, SCMS-COCHIN. Journal management help.org/person-. Hartline, M.D., & Ferrell, O.C. (1996).The management of customer-contact service employees: An empirical investigation. Journal of Marketing, 60, 52-72. Herzberg.F, Mausner.B.& Snyderman, B.B. (1959).The Motivation of Works (2nd edition).New York: John Wiley and Sons. Hoppock.R. (1993).Occupational information. New York: McGraw-Hill
..... 46
Special Issue: Hotel Operations Management – Issues and Challenges
Vol. 5, January 2013
Hurley, R.F. (1998).Service disposition and personality: A review and classification scheme understanding where service disposition has an effect on customers. In T.E. Swartz, D.E.Bowen, &S.W.Brown (Eds.), Advances in service marketing and management, Vol.7 (pp.159-191). Karatepe, O.M., Uludag, O., Menevis, I., Hadzimehmedagic, L.,& Baddar.L.(2006).The effects of selected individual characterstics on frontline employee performance and job satisfaction. Journal of Tourism Management, 27, 547-560. Krishnan, B.C., Netemeyer, R.G., & Boles, J.S. (2002).Self-efficacy, competitiveness, and effort as antecedents of salesperson performance. Journal of Personal Selling & Sales Management, 22(4), 285-295. Kusluvan, S. (2003).Employee attitudes and behaviours and their roles for tourism and hospitality business. In S.Kusluvan (Ed.), Managing employee attitudes and behaviours in the tourism and hospitality (pp.25-50).New York: Nova Science Publishers. Lam, T., Lo, A., & Chan, J, (2002).New employees‘ turnover intentions and organizational commitment in the Hong Kong hotel industry. Journal of Hospitality and Tourism Research, 26(3), 217-234. Maslow, A.H. (1943).A theory of Human Motivation. Psychological Review, 50, p.370. Singh, J. (2000).Performance productivity and quality of frontline employees in service organizations. Journal of Marketing, 64, 15-34. Stahl, Michael J. (2004).Encyclopedia of Health Care Management. Sage Publications, Inc., p.311. Yoon, M.H., Beatty, S.E., & Suh, J. (2001).The effect of work climate on critical employee and customer outcomes: An employee level analysis. International Journal of Service Industry Management, 12(5), 500-521. Wikipedia. (2012).Job Satisfaction.www.wikipedia.com. Wikipedia. (2012).Organizational Commitment.www.wikipedia.com.
47
Indian Journal of Applied Hospitality and Tourism Research
Turnover in Indian Hotel Industry: A Study of Employees Opinions Abstract Tourism and Hospitality industry in India has tremendous growth potential Associated Chambers of Commerce and Industry of India (Assocham) (2012) also enforce it in its latest paper Title “Emerging Opportunities in Rising Sector”, in which, it expect that Healthcare and Hospitality sectors are likely to grow at 20-25% Per annum and expected to create 16, 00,000 new jobs in the year 2013. Accommodation sector is consider to be one of the major component of hospitality industry in which wide variety of hotels (From Five Star Deluxe to Budget, Heritage Hotels, Motels etc.) are available. According to Hospitality Valuation Services (HVS) (2011) survey the supply of new branded hotels in 2008-2009 was 94115 rooms, which rose in 2010-2011 to 102438 rooms. Thought the growth on the hotel industry is robust and rosy but at the same time the industry is also facing many challenges the employee turnover is also one of them. Federation of Hotel & Restaurant Associations of India (FHRAI) (2001) survey report clearly states the problem of high turnover in this sector. The present paper is an honest effort to identify various causes of high turnover in the Indian hotel industry focusing the capital New Delhi. The entire research revolves around three major objectives that are to investigate employees‟ opinion on various causes for the high employee turnover in hotel industry; to examine consequences of the high employee turnover in Indian hotel industry; to study different turnover reduction techniques and increase employee retention in the hotels. Keywords: Hotels, Employee turnover (ET), turnover, New Delhi
Introduction Hospitality industry is facing many Human Recourse (HR) related challenges these are broadly related to employee shortage, training and development, employee retention and turnover issues. Employee turnover is always a major problem of global hospitality industry. Employee Turnover is one of the major problems of Hotel Industry. Griffith University (2006) conducted a research on ―Labour Turnover and Cost in the Australian Accommodation Industry‖, which reveals that the managerial turnover in Australia is 39.19% and operational level turnover is 50.74% overall hotel Labour turnover is 48.64%. The study also suggests that the cost of turnover is 19.5% of total payroll cost of each hotel. Study conducted by MyHiringClub.com (2012) states that the hospitality sector in India has the highest employee turnover. The average employee turnover in Indian aviation and hospitality in fourth quarter of 2011-12 was 22 per cent across sector, a rate that has increased by 8 per cent from the year-ago period. Confederation of Indian industry (2012) conducted a research, in which some of the questions were asked to hotel CEO‘s of leading Indian hotel chains in which more than 80% of the respondents expressed high to very high employee turnover as a challenge. The challenge is more acute in the front office and food and beverage (F&B) sections. Employee turnover is one of the major problems in hotel industry, some scholar called it ―Turnover Culture‖. Turnover rate can be briefly described as how fast the employers recruit and lose employees (Chikwe, 2009). It is used to measure the effectiveness of recruitment (Mondy, 2010) and is sometimes considered as one of the indicators of organizational performance (Cho, Woods, Jang, & Erdem, 2006). Mondy (2010) clearly defined turnover rate as how many new recruitments were hired to replace resigned employees. By these definitions, turnover 'occurs' only when a replacement is successfully hired. Denvir and McMahon (1992) define turnover as ―the movement of people into and out of employment within an organization which can be voluntary or involuntary.‖ According to Walker, (1992) Employee turnover ―is a ratio of the number of workers leaving an organization in a specific period of time to the number of workers still working within an organization for any reason‖. Erdoğan (1992) explains employee turnover ―is the changes in the number of workers as a result of resignation, leave, discharge and recruitment. The purpose of the proposed research revolves around three major objectives that are to investigate employee‘s opinion on various causes for the high employee turnover in hotel industry; to examine consequences of the high employee turnover in Indian hotel industry; to study different turnover reduction techniques and increase employee retention in the hotels.
Review of Literature Turnover is considered to be a major problem of hospitality industry. Many researchers (Bluedorn, 1982; Kalliath and Beck, 2001; Kramer et al., 1995; Peters et al., 1981; Saks, 1996) have tried to answer the question of what determines people's intention to quit by investigating possible antecedents of employees‘ intentions to quit. American Hotel & Motel Association (AH&MA, 1998) estimates that in United States, employee turnover in the hotel industry ranges from 60% to more than 300% annually. This is also echoed by Chartered Institute of Personnel and Development, UK (2003) in their research finding that also reveals high employee turnover rate in the hospitality industry. The main reason for this is low pay packages and harsh conditions of work including long work hours as Dr. Surjeet Kumar and Parminder Chahal, Department of Tourism and Hotel Management, Kurukshetra University, India, Email:
[email protected];
[email protected] ..... 48
Special Issue: Hotel Operations Management – Issues and Challenges
Vol. 5, January 2013
result of which the hospitality industry suffers from a poor image (Goldsmith et al, 1997, Mullins, 2001). That‘s why the term ―turnover culture‖ in hospitality industry, is the acceptance of turnover as part of the working group norm (Iverson and Deery, 1997). Further, Boella (1996) contributing to the debate attributes that the cause of high turnover in the hospitality industry is the nature of the industry itself. Though Boella suggests that the hospitality industry is seasonal with limited career structures as well as issues on location, size, and the nature of individual managers, current research has shown that employee dissatisfaction in the industry is playing a critical role in motivating hospitality workers to change jobs but Boxall & Rasmussen (2001) argued that high levels of turnover exist because employees are not being motivated to remain at jobs. Firth et al (2004) in there finding also suggested that experience of job related stress (Stressors), lack of commitment in the organization and job dissatisfaction make employees to quit. Magner et al, (1996) suggested that employees feel comfortable when they are on the positions where they are in decisions making process. Costly et al, (1987) presented a different perspective in relation to management of hotels that a high labor turnover may mean poor personnel policies, poor recruitment policies, poor supervisory practices, poor grievance procedure or lack of motivation. Denvir and McMahon (1992) support the view that turnover is partly within the control of management. Henry Ongari (2007) has done an exhaustive research on literature on employee turnover. In which he tries to find out the major causes and their remedies to stop the employee‘s turnover. Liew Chai Hong & Sharan Kaur (2008) conducted a research in on relationship between organizational climate, employee personality and intention to leave. The finding suggest that, Management should form an positive organizational climate which includes well defined job responsibilities and policies with flexible structure, fair and equitable rewards system as well as a supportive and friendly works atmosphere. Organization must provide board skill training organize mentoring programs and succession planning. Organizations must also provide the chances of promotion to the employees in order to retain the employees. When it comes to turnover effects, Idson and Feester (1990) identified that large organizations can provide employees with better chances for advancement and higher wages and hence ensure organizational attachment. Some researchers (Hogan, (1992); Wasmuth and Davis, (1993); Borrows, (1990)) agree on that high turnover rates might have negative effects on the profitability of organizations of it is not managed properly. Samuel Irungu Kimungu & Paul Mwangi Maringa (2010) try to find out the impact of employees turnover on customer service and competitiveness of an establishment and how employees turnover affects the customer service delivery? According to this research there are some factors which affect the employee‘s turnover such as job satisfaction, unfavorable working conditions, and slow career advancement. High employee‘s turnover causes lower quality of service, reduced customer satisfaction, and making an establishment less competitive. This research also describe that many hotels lacks effective measures to counter employees turnover. When it comes to the remedies, Chen, Ying-Chang; Wang, Wen Cheng; Chu, Ying Chien (2010) in their research finding suggest that providing career advancement opportunities is critical for retention and a mentoring program can help decrease the employee turnover of the small and medium sized hotel. Hotel must adopt the high quality communication between the Hotel and employees. Pay and welfare also plays an important role in retaining the employees. Few researchers argued that there are benefits of labour turnover as it is a natural tool to downsize the workforce but losing a worker may be disruptive to both production and profits (Walsh, & Taylor, 2007; Cole, 1997).
Research Methodology The study is exploratory in nature, in all hundred employees of five 5 star hotels were contacted. All the five star hotels were located in central Delhi. 66 (66 percent) employees participated in the research, in which 26 (39.4 percent) were female and 40 (60.6 per cent) were male. The data was collected on structured questionnaire based on 5 point Likert scale. The data was collected in January 2012 to March 2012. The questionnaire has 51 variables, which are presented in table 1. Profile of Employees From Table 2, it is clear that majority of the respondent were female (60.6 percent) and were working in front office (24.2 %) followed by food production (21.2 %) and other ancillary (21.2 %) department. Further majority of respondent were working at junior or supervisor level (62.6 per cent).
49
Indian Journal of Applied Hospitality and Tourism Research
Table 1: Various Variables Related To Causes, Effects and Remedies of Turnover Causes of turnover Effect of turnover Remedies of turnover Low salaries and low motivation Monetary loss high salaries and high motivation Less Recognition of work Potential for poor service high recognition of work No rewards for good work No uniformity of service rewards for good work In balance in personal life due to Low perception of managerial balance in personal life high working hours effectiveness Lack of management commitment to Inability to expand good mgt commitment improve the quality of life Relationship with colleagues Loss in the quality of staff good relationship with colleague Unfriendly Promotion policy Wages kept down friendly promotion policy Company loyalty towards workers company loyalty Insecurity at workplace security at work place Work environment work environment Pride of ownership pride of honor ship No direction on what to do direction on what to do Management shows favoritism no favoritism Relocation of an employee to another no relocation hotel Health reasons health reasons management creates a polite Management creates a rigid structure structure Bad match between the employee's good match b/w the employees skills and the job skills and the job Substandard equipment, tools, or high std equipment and facilities facilities Change in leadership no change in leadership Unequal or substandard wage equal or high wage structures structures Change in company practices and no change in company practices policy and policies Lack of clear definition of clear definition of responsibilities responsibilities Sex Department
Designation
Table 2: Profile of respondent Male Female Front Office Housekeeping F & B Service F & B Production Others Junior employee Supervisor Middle manager Senior executive/ HOD
26 (39.4 %) 40 (60.6 %) 8 (24.2 %) 6 (18.2 %) 5 (15.2 %) 7 (21.2 %) 7 (21.2 %) 21 (31.3 %) 21 (31.3 %) 14 (20.9%) 11 (16.4 %)
Table 3 highlights job related information of employees. Which shows majority of employees (77.6 per cent) had worked for less than two years, 44.8 percent have worked less than a year in an organization & 91.3 per cent have worked one year on prohibition. Further, 47 percent were taking less than 2 lacs per annum of salary. Thought 80.4 percent were happy from the initial training provided in hotels. Nearly 30 percent employees have gone for a change and 51.5 percent were not happy with the present salary. This is a cause of concern for hotels. Table 3: Job Related Information Less than 6 months Job period in present 6 months - 1 year organization 1 year - 2 years 2 years – 3 years 3 years – 4 years 4 years – 5 years More than 5 years
..... 50
15 (22.4 %) 15 (22.4 %) 22 (32.8 %) 7 (10.4 %) 4 (6 %) 1 (1.5 %) 3 (4.5 %)
Special Issue: Hotel Operations Management – Issues and Challenges
Prohibition Period
Present Salary
Initial Training
Job Changed in Last 1 year
Are you happy with the present salary
Less than 6 month 6 month – 1 year 1 year – 2 year More than 1 year Less than 1 lacs per year 1 lacs – 2 lacs 2 lacs – 3 lacs 3 lacs – 4 lacs 4 lacs – 5 lacs More than 5 lacs Well Below Expectation Below Expectation Meet Expectation Above Expectation Well Above Expectation No Change Once Twice No Yes Missing Value (99)
Vol. 5, January 2013
39 (67.2 %) 14 (24.1 %) 3 (5.2 %) 2 (3.4 %) 13 (19.7 %) 18 (27.3 %) 14 (21.2 %) 14 (21.2 %) 5 (7.6 %) 2 (3 %) 2 (3 %) 11 (16.4 %) 27 (40.3 %) 16 (23.9 %) 11 (16.4 %) 41 (71.9 %) 14 (24.6 %) 2 (3.5 %) 35 (51.5 %) 32 (47.1 %) 1 (1.5 %)
Findings Employee’s Turnover-Reasons & Causes Based on secondary data, a number of reasons and causes for turnover were identified. The analysis is presented in table 4. Respondents were asked questions on 5 point likert scale. Factor analysis method is used to reduce these variables to limited number of factors. The analysis is done with the help of principal component analysis and varimax rotation matrix. 22 variables were identified based upon secondary researches for turnover. The output of principal component analysis shows Eigen value of seven factors are more than 1 explaining 77.71 % percent of total variance thus reducing 22 variables to underlying seven factors. These are: Factor 1- Motivation: four variables were loaded on this factor & explained 26.76% of total variance and highest loading on low salaries and low motivation (.819), less recognition of work (.781), no rewards for good work (.661) and management creates a rigid structure (.778). This is one of the most important which directly impact employee‘s performance and efficiency in hotels. Factor 2- Professionalism: this factor account 12.581 % of total variance and four variables were loaded on this. These are work environment (.851), pride of ownership (.686), no direction on what to do (.738) and bad match between the employee's skills and the job (.531). Professionalism is a multidimensional nature which involves altruism, high quality standards, and specialist skills. This lacks in human resource practices of Indian hotel industry. Factor 3- Quality life & security issues: two variables were loaded on this factor & explained 12.528 % of total variance and highest loading on lack of management commitment to improve the quality of life (.574) and insecurity at workplace (.675). The quality life plays a positive spillover effect from personal life to work and personal life has a more beneficial effect on work life than work life has on personal life. Factor 4- Work culture issues: four variables were loaded on this factor & explained 7.558 % of total variance and highest loading on in balance in personal life due to high working hours(.437), relationship with colleagues(.731), unfriendly promotion policy (.875) and substandard equipment, tools, or facilities (.452). Factor 5- Organizational policy issues: four variables were loaded on this factor & explained 7.558 % of total variance and highest loading on health reasons (.207), change in leadership (.492), change in company practices (.842) and policy and lack of clear definition of responsibilities (.749). Factor 6- Job security: two variables were loaded on this factor & explained 6.208 % of total variance and highest loading on company loyalty towards workers (.769) and management shows favoritism (.817). Factor 7- Transfer and salary issues: two variables were loaded on this factor & explained 5.192% of total variance and highest loading on relocation of an employee to another hotel (.519) and unequal or substandard wage structures (.325). Thus, all these seven causes play a very important role in employee‘s turnover 51
Indian Journal of Applied Hospitality and Tourism Research
Effect of Turnover Based on secondary data, a number of effects of turnover on organization were identified. The analysis is presented in table 5. Respondents were asked questions on 5 point scale on different variables of effects of turnover on organization. Factor analysis method is used to reduce these variables to limited number of factors. The analysis is done with the help of principal component analysis and varimax rotation matrix. 07 variables were identified based upon secondary researches for turnover. The output of principal component analysis shows Eigen value of two factors are more than 1 explaining 62.48% percent of total variance thus reducing 7 variables to underlying two factors. These are: Factor 1- Monetary Losses: four variables were loaded on this factor & explained 38.874 % of total variance and highest loading on monetary loss (.703), Potential for poor service (.936), No uniformity of service (.760) and Low perception of managerial effectiveness (.673). Monetary incentives are considered to be very important in order to keep them for permanent positions in hotels. Table 4: Rotated Component Matrix Component 1 2 3 Low salaries and low motivation .816 Less Recognition of work .781 No rewards for good work .661 Management creates a rigid structure .778 Work environment .851 Pride of ownership .686 No direction on what to do .738 Bad match between the employee's skills and the job .531 Lack of management commitment to improve the quality of life .574 Insecurity at workplace .675 In balance in personal life due to high working hours Relationship with colleagues Unfriendly Promotion policy Substandard equipment, tools, or facilities Health reasons Change in leadership Change in company practices and policy Lack of clear definition of responsibilities Company loyalty towards workers Management shows favoritism Relocation of an employee to another hotel Unequal or substandard wage structures Variables (Reasons & Causes)
4
5
6
.437 .731 .875 .452 .207 .492 .842 .749 .769 .817 .519 .325
Extraction Method: Principal Component analysis, Rotated Method: Varimax with Kaiser Normalization.
Factor 2- Organizational growth issues: three variables were loaded on this factor & explained 23.607 % of total variance and highest loading on inability to expand (.718), Loss in the quality of staff (.843) and wages kept down (.713). Thus, it can be concluded that important effect of turnover on organization are monetary losses and organizational growth issues. Table 5: Rotated Component Matrix Variables (effects of employee’s turnover) Component 1 Monetary loss .703 Potential for poor service .936 No uniformity of service .760 Low perception of managerial effectiveness .673 Inability to expand Loss in the quality of staff Wages kept down
2
.718 .843 .713
Extraction Method: Principal Component analysis, Rotated Method: Varimax with Kaiser Normalization.
Remedies to Reduce Turnover Based on secondary data, a number of remedies for turnover were identified. The analysis is presented in table 6. Respondents were asked questions on 5 point scale on different remedies to reduce turnover. Factor analysis method is used to reduce these variables to limited number of factors. The analysis is done with the help of principal component analysis and varimax rotation matrix. 22 variables were identified based upon secondary researches for turnover. The output of principal ..... 52
7
Special Issue: Hotel Operations Management – Issues and Challenges
Vol. 5, January 2013
component analysis shows Eigen value of seven factors are more than 1 explaining 81.23% percent of total variance thus reducing 22 variables to underlying seven factors. These are: Factor 1- Professional Work Environment: five variables were loaded on this factor & explained 28.357% of total variance and highest loading on no favoritism (.403), management creates a polite structure (.760), high standard equipment and facilities (.595), no change in leadership (.815) and no change in company practices and policies (.864) Factor 2- Salary Reforms: four variables were loaded on this factor & explained 17.406% of total variance and highest loading on high salaries and high motivation (.778), friendly promotion policy (.506), work environment (.685) and pride of honorship (.850) Factor 3- Reward and Recognitions: three variables were loaded on this factor & explained 10.314% of total variance and highest loading on high recognition of work (.795), rewards for good work (.891) and direction on what to do (.671). Factor 4- Planned Incentives & Security factors: four variables were loaded on this factor & explained 8.174% of total variance and highest loading on balance in personal life (.566), security at work place (.599), equal or high wage structures (.731) and clear definition of responsibilities (.725). Factor 5- Proper Match of Skills & Job: three variables were loaded on this factor & explained 6.186% of total variance and highest loading on good relationship with colleague (.842), company loyalty (.741) and good match between the employee‘s skills and the job (.656). Factor 6- Personalized Care: two variables were loaded on this factor & explained 5.617% of total variance and highest loading on good mgt commitment (.763) and health reasons (.702). Factor 7- Transfers: one variable were loaded on this factor & explained 5.181% of total variance and highest loading on no relocation (.902). Table 6: Rotated Component Matrix Variables (Remedies to reduce employee turnover) Component no favoritism management creates a polite structure high std equipment and facilities no change in leadership no change in company practices and policies high salaries and high motivation friendly promotion policy work environment pride of honorship high recognition of work rewards for good work direction on what to do balance in personal life security at work place equal or high wage structures clear definition of responsibilities good relationship with colleague company loyalty good match b/w the employees skills and the job good mgt commitment health reasons no relocation
1 .403 .760 .595 .815 .864
2
3
4
5
6
7
.778 .506 .685 .850 .795 .891 .671 .566 .599 .731 .725 .842 .741 .656 .763 .702 .902
Extraction Method: Principal Component Analysis, Rotated Method: Varimax With Kaiser Normalization.
Conclusion and Discussion Turnover is a big challenge for Indian hotel industry. From the above analysis it is clear that majority of employees (77.6 per cent) had worked for less than two years. 44.8 percent have worked less than a year in an organization. Further, 47 percent were getting less than 2 lacs per annum of salary. Nearly 30 percent is the employee‘s turnover and 51.5 percent were not happy with the present salary. This also reflects that it is going to be a big challenge for hotels to reduce turnover. The purpose of this study is to undertake an empirical approach to investigate three objectives these are to find out turnover causes, consequence and remedies to reduce turnover in hotel industry. The first objective of the research was to investigate what are the causes for the high employee turnover in the hotels from findings seven factors have been emerged these are motivation, professionalism, 53
Indian Journal of Applied Hospitality and Tourism Research
quality life & security issues, professional, personal & work environment issues, policy issues, job security and transfer and unequal salary issues. The second objective was to examine are what the consequences of the high employee turnover in hotels from findings two factors have been emerged these are monetary losses and organizational growth issues. The third objective was to study how the reduce turnover and increase employee retention in hotels from findings seven factors have been emerged these are professional work environment, salary issues, reward and recognitions, planned incentives & security factors, proper match of skills & job, personalized care and transfer factors. Finally, it is envisaged that this study will lead to increased awareness about employee‘s turnover (ET) problems in Indian hotel industry and motivate scholars on need for further research in this area with larger sample covering wide range of HR issues.
References Assocham (2012). ―Emerging Opportunities in Rising Sector‖, Assocham, Boxall & Rasmussen (2001). ― Labour turnover and retention in New Zealand: The causes and consequences of leaving and staying with employers,‖ Asia Pacific Journal of Human Resources. Borrows, (1990). "Employee turnover: implications for hotel managers", FIU Hosp. Rev. pp.24-31. Bluedorn AC (1982). "A unified model of turnover from organizations", Hum. Relat. 35: 135-153. C.I.I (2012). ―Hospitality Insight- from the Indian C.E.O‖s desk‖, retrieved from Prince Water Cooper. Chen, Y. C.; Wang, W. C.; Chu, Y. C. (2010) ― Structural Investigation of the Relationship between Working Satisfaction and Employee Turnover‖ from The Journal of Human Resource and Adult Learning Vol. 6, Num. 1, June 2010 Cho, Woods, Jang, & Erdem, (2006) Istambul hotels from 360 degree perspective: A Comprehensive view of the Istanbul accommodation industry. Cole, G.A. (1997) Personnel Management Letts, London 118-119. Davidson, I, (2006). ―Labour Turnover & Cost in the Australian Accommodation Industry‖, Griffith University. Denvir A, McMahon F (1992). ―Labour turnover in London hotels and the cost effectiveness of preventative measures", Int. J. Hosp. Manage. 11 (2) : 143-54. Erdoğan. H. (1992). ―Personel Devri, İş Tatmini İle İşten Ayrılma Düşüncesi Arasındaki İlişkiyi Ölçmeye Yönelik Bir Araştır ma‖, İstanbul Üniversitesi Sosyal Bilimler Enstitüsü, Yayınlanmamış Yüksek Lisans Tezi, İstanbul. FHRAI (2001), ―Indian Hotel Industry Survey 2001-2002‖, Annual report,FHRAI. Firth, L, David, J M., Kathleen, A M., Claude, L. (2007). How can managers reduce employee intention to quit?, J. manage. Psychol. 19 (2): 170-187. Goldsmith, A., Nickson, D., Sloan, D., Wood, R.C.1997 – Human Resource Management for Hospitality Services. Tourism and Hospitality Series. Thomson Press. Henry, O.(2007) A review of the literature on employee turnover, African Journal of Business Management pp. 049-054, June 2007. Hogan JJ (1992). "Turnover and what to do about it",The Cornell HRA Quarterly. 33 (1):40-45. HVS (2011), ―Hotels in India, Trends and Opportunities‖, HVS international. HVS (2011), ―Hotel Room Supply, capital investment and Manpower Requirement by 2021‖ HVS international. Idson TL, Feaster DJ (1990). "A selectivity model of employer-size wage differentials". J. Labor Econ. 8: 99-122. Iverson, R. D. & M. Deery (1997). "Turnover culture in the hospitality industry" Human Resource Management Journal 7(4): 71-82. Kalliath TJ,Beck A (2001). "Is the path to burnout and turnover paved by a lack of supervisory support: a structural equations test", NewZealand J. Psychol. 30: 72-78. Kramer MW, Callister RR, Turban DB (1995). "Information-receiving and information-giving during job transitions", West. J. Commun. (59):151-70. Liew Chai Hong & Sharan Kaur (2008) ―A Relationship between Organizational Climate, Employee Personality and Intention to Leave‖ International Review of Business Research Papers Vol. 4 No.3 June 2008 Pp.1-10 Magner, N., Welker, R and Johnson, G. (1996). The interactive effects of participation and outcome favorability in performance appraisal on turnover intentions and evaluations of supervisors. J. occupational org. psychol. 69: 135-143. My hiring.com, (2012), Hospitality sector as the highest attrition rate, retrieved from Economic Times on August, 19, 2012. Mondy, R.W. (2010). Human resources management (11th ed.). Upper Saddle River, NJ: Prentice Hall. Mullins, L. J. 2001. Hospitality Management and Organisational Behaviour. Fourth Edition. Longman. Peters L, Bhagat R, O'Connor EJ (1981). "An examination of the independent and joint contribution of organizational commitment and job satisfaction on employee intention to quit", Group Org. Studies, 6: 73-82. Saks AM (1996). "The relationship between the amount of helpfulness of entry training and work outcomes", Hum. Rel. 49: 429451. Samuel I. K. & Paul M. M. (2010) An Assessment of the Impact of Employee Turnover on Customer Service and Competitiveness of an Establishment, International Research Symposium in Service Management. Walker. J. W. (1992). Human Resource Planning, McGraw Hill Publishing Company,USA. Walsh.k.& Taylor.M.S, (2007). Developing in-house careers and retaining management talent: hospitality wants from their jobs. Cornell Hotel and Restaurant Administration Quarterly.48 (2).163-182. Wasmuth WJ, Davis SW (1983). "Managing employee turnover: why employees leave", The Cornell HRA Quarterly, pp. 11-18.
..... 54
Special Issue: Hotel Operations Management – Issues and Challenges
Vol. 5, January 2013
Lessons from Literature: How to Manage Staff Turnover in Hotels? Abstract The aim of this study is to review research and discusses the phenomenon of staff turnover generally, its impact and how it has been managed in the hotel industry specifically? As stated by Step Business Builders (2010) “... once businesses determined the future of the workforce, now the workforce determines the future of the business”. It might be beyond the scope of this study to capture all the literature on staff turnover hence the focus is on that in last 25 years, how the research has helped to understand this phenomenon? And what lessons the hotel industry could learn to manage this process? To make an effective analysis some information is drawn from the literature prior to 1990 with a multidisciplinary approach. In order to effectively meet the objectives of this study, a critical analysis is undertaken with regard to turnover culture in hospitality industry, factors and issues that impact staff turnover globally with specificity of the situation in New Zealand. The study notes that staff turnover is not just a management issue from a micro-environment perspective of a company, but it is also affected by macro-environmental factors outside the organization such as economic conditions. For example in New Zealand‟s domestic market and in the international market, since 2007 the staff turnover rates have slightly dropped due to the economic recession. Employees are not feeling confident in „actively‟ seeking a better job. Current study attempts to understand the turnover issues from both the industry and the personnel perspective and makes suggestions for future practice and research. Keywords Staff turnover, Hotels, Literature.
Introduction The aim of this study is to review research and discusses the phenomenon of staff turnover generally, its impact on and management in the hotel industry specifically. As stated by Step Business Builders (2010) ―... once businesses determined the future of the workforce, now the workforce determines the future of the business‖. It is beyond the scope of this study to capture all the literature on staff turnover hence the focus is on that in last 25 years, how the research has helped to understand this phenomenon? And what lesson/s hotel industry could learn to manage this process? To make an effective analysis some information is drawn from the literature prior to 1990 with a multidisciplinary approach. Staff turnover in hospitality industry has been well documented over the years (Riley, 1991; Wood, 1992). The issues surrounding the recruitment and retention of workers in hospitality have been linked to the advent of ‗replacement‘. Authors Denvir and McMahon (1992) defined staff turnover as ‗the movement of people into and out of employment within an organization‘ (p.143). Relatively staff turnover in the hospitality industry shows to be unacceptably high (Kennedy and Berger, 1994), averaging up to 200 or 300 per cent per annum (Woods, 1992; Tanke, 1990), although substantial variations exist between different establishments. Yang and Wan (2004) note that this issue has been examined within the hospitality-related literature for at-least past 10 years. Authors such as Birdir (2002); Stalcup and Pearson (2001); Choi, Woods and Murrmann (2000); Teare and O‘Hern (2000); Deery and Shaw (1999); Iverson and Deery (1997); Cho, Sumichrast and Olsen (1996); Ohlin and West (1993); Boles, Ross and Johnson (1995); Cantrell and Sarabahksh (1995) and Hogan (1992) have also examined this issue in various studies published in different academic journals. Studies have shown that staff high turnover rates in the hotel industry are not country specific, rather seems to be a worldwide phenomenon (Birdir, 2002). Authors such as Bonn and Forbringer (1992) and Iverson and Deery (1997) have stated that one of the most long-term issues in human resources within the tourist sector is the rapid staff turnover in the industry. Relative to other industries, turnover rates in the hospitality industry is extremely high as noted by Hartman & Yrie (1996); Hinkin & Tracey (2000) and Hom and Griffeth (1995). Leonard (1992) reports staff turnover levels exceed 60% and remain level even in poor economic times when overall job scarcity should make employees reluctant to leave. Right Management has noted that ―... during 2009, 42% of Australians who changed jobs took a pay cut to do so‖ (as cited by Step Business Builders, 2010). Therefore, even though despite that the majority of the worlds‘ economies are still recovering from the 2008-2009 economic recession, employees are ‗NOT‘ concerned with how much their employer is paying them (Step Business Builders, 2010). These employees are more concerned with other aspects of their workplace environment. These high staff turnover levels, can therefore, result in high personnel costs as there are high costs incurred in the recruiting and training of new employees (Hom & Griffeth, 1995). As stated by Step Business Builders (2010) ―... studies show, every time an employee resigns, it costs up to 50% of their annual salary to replace them!‖ As the hotel industry is a notably ‗people intensive‘ industry, the costs that are associated with staff turnover Dr. Asad Mohsin, Department of Tourism & Hospitality Management, University of Waikato Management School, New Zealand, E-mail:
[email protected]. and Bhupesh Kumar, Banarsidas Chandiwala Institute of Hotel Management & Catering Technology, New Delhi, India, Email:
[email protected]
55
Indian Journal of Applied Hospitality and Tourism Research
are more significant than in less labour-intensive industries (Hartman & Yrie, 1996, Iverson and Kuruvilla, S., 1995). The premature turnover of staff within the industry has been believed to be a waste of a hotel‘s sizeable investment in employee development and training (Beckert & Walsh, 1991; Hom & Griffeth, 1995). As noted by Step Business Builders (2010) ―... the businesses that don‘t change the way they train and develop staff... will continue to lose employees, lose customers and lose profits‖. Denvir and McMahon (1992) have argued that individual hotels experience different levels of labour turnover, thereby confirming the view that staff ―… turnover is partly within the control of management, and conflicts with the widespread impression that turnover is high and uniform throughout the industry‖, and hence on uncontrollable characteristic of the trade (p. 146). Several authors also note a trend of very few staff remaining in their job for longer than five years at a time (BTR, 1990 (as cited in Nankervis, 1990); Riley, 1991). This significantly contributes to the high replacement costs through high staff turnover levels. Eade (1993) states that people often leave an organisation for a wide variety of reasons that can be unrelated to management. Turnover Culture in the Hospitality Industry: As stated by Iverson and Deery (1997) ―... turnover culture is best characterised as the acceptance of turnover as part of the workgroup norm‖ (p. 71). Throughout the industry, there is the belief held by employees that the turnover culture is a normal part of the industry (Iverson & Deery, 1997). In a study conducted by Price (1994), the author found that the hotel industry tended to ―… live with high levels of labour turnover and rely on the external labour market to fill vacancies‖ (p. 47). This study also coincides with the statement made by Iverson and Deery (1997) that ―... the hospitality industry has been characterised in terms of high turnover rates, a part-time and casual workforce, and an absence of an internal labour market‖ due to low job security, lack of career progression, low wages and low skill levels (p. 71). The literature has so far identified factors that impact on turnover rates as orientation and socialisation processes, ad hoc recruitment and selection procedures, discrimination at the workplace, training and development opportunities, management styles, organisational commitment, competition and organisational culture, labour shortage, stress and burnout, the seasonal nature of the industry and job dissatisfaction (Kennedy & Berger, 1994; Woods, 1992; Bonn & Forbringer, 1992; Wagner, 1991; Antolik, 1993; Hogan, 1992; Hiemstra, 1990; Conrade, Woods & Ninemeier, 1994; Lee-Ross, 1993; Rowden, 1995; Denvir & McMahon, 1992; Debrah, 1994; Vallen, 1993; Hom & Griffeth, 1995, Price and Clark 2008).). Iverson and Deery (1997) introduce the ‗Causal Model of Employee Intent to Leave‘, see Appendix 1, in an attempt to address the issues raised by previous turnover models such as Mueller, Boyer, Price and Iverson (1994). The ‗Causal Model of Employee Intent to Leave‘, see Section 7.1, integrates structural, pre-entry, environmental, union and employee orientations, which were selected from the economic, psychological and sociological perspectives (Iverson & Deery, 1997). This model includes variables which are specific to the hospitality industry such as turnover culture, union loyalty and job stress in dealing with the public unlike the previously implemented models on employee intentions to leave their jobs (Iverson & Deery, 1997). Within the model there are structural variables which specifically relate to the work setting such as both organisational and job-related factors which have an indirect impact on intention to leave via job satisfaction (Hom and Griffeth, 1995; Iverson and Kuruvilla, 1995). By including such variables Iverson and Deery (1997) believe that they can devise a better explanation of the turnover process within the hospitality industry. While authors such as Martocchio (1994) have well-researched issues such as absenteeism as a determinant of absence culture, turnover culture, up until Iverson and Deery‘s 1997 study, was a relatively untouched subject of employee turnover within the hospitality industry. However, in 1986, Krackhardt and Porter conducted a study in the hospitality industry where they analysed the quitting behaviour of adolescent workers. This study focussed on the fast food sector and found that these adolescent workers were more likely to leave if they had peers that were also looking to quit their job. Therefore these authors, Krackhardt and Porter (1986), concluded from their study that many adolescent employees who enter into the fast food sector of the hospitality industry do so with the intention of working at that particular establishment for a minimal amount of time (as cited in Iverson & Deery, 1997). Therefore, employers within the hospitality industry should be actively seeking ways in which they can reduce the phenomena of staff turnover, investigate the factors that exacerbate staff turnover within the industry and address the issues that are associated with this phenomena. Factors That Impact Staff Turnover Hotel industry has the highest rate of staff turnover. There are many different factors that impact on the rate of employee turnover. According to Fallon and Rutherford (2010), ― ... hospitality employees ..... 56
Special Issue: Hotel Operations Management – Issues and Challenges
Vol. 5, January 2013
is one organization ranked these reasons as the most likely causes for high staff turnover, such as treatment by superiors, amount of work hours, job pressure, scheduling, training, fringe benefit packages, better opportunities elsewhere, and physical demands of the job‖ (p. 454). Hinkin and Tracey (2000) also point out the high rates of staff turnover is the consequence of the poor working environment and poor supervision. In order to decrease the total costs of the operation, most of the hotels pay less attention on employees real profits. In a study conducted by Williams et al. (2008), the research results of the hotel industry in New Zealand found that there are three pull factors caused the high staff turnover; 1. Age: The young age profile and part time employees are the important elements in hotel industry. This all caused the high rate of staff turnover. 2. Low Unemployment: Due to the hotel industry there is very low employment in New Zealand, and the tight labour market also affects staff turnover. 3. Remuneration: The low pay is the significant issue in hotel industry (Bull, 1992), which decreases employees job satisfaction directly. Generally, the problem of low pay will direct lead to people leaving an organization. The main problem is young age profile employees and low pay problem, they are always existing in hotel industry and are always a factor in the high labour turnover rates. As Ogbonna and Harris (2002) note, the problem of low pay is very significant in the housekeeping department, and housekeepers are always considered as ‗second class citizens‘ in a hotel. Walmaley (2004) also described that many hospitality jobs are seen to be low skilled, and the poor management influences a lack of clear career structure. According to Horner and Swarbrooke (2004) ―... many tourism organizations appear to find it difficult to attract and retain top class staff, particularly in the hotel sector‖ (p. 282), due to the following issues: 1. The perceptions of low pay 2. The reputation of some parts of the tourism industry, notably hospitality, for discrimination on the grounds of sex and races. 3. The long hours involved in many jobs. 4. The lack of career paths 5. The often poor working conditions (Horner and Swarbrooke, 2004, p. 282). In addition, Lashley (2000) describes the causes of staff turnover into two groups; avoidable and unavoidable staff turnover. Avoidable staff turnover occurs when employees are ―... dissatisfied with wages, relationship with management, lack of training, work place and stress, relationships with other staff, hours of work, and transport difficulties‖ (Lashley, 2000, p.115). Unavoidable staff turnover is due to ―... retirement, illness, death, marriage, pregnancy, leaving the area, and students‘ return to college or home‖ (Lashley, 2000, p.115). Most part time employees are college students and just want earn more money or gain related experience in a hotel, so there exists the conflict between their working time and study time. Issues of Staff Turnover The high staff turnover also leads to serious issues of low quality of customer service and greater costs for the hotels through recruitment and training expenditure (Horner & Swarbrooke, 2004). As the quality of service becomes low customer dissatisfaction is directly influenced. In my opinion, the front office employees are like the ‗face‖ of a hotel which relates to customer satisfaction, so the inexperienced staff will decrease the customer‘s satisfaction thereby decrease the occupancy rates indirectly. In addition, Powell and Wood (1999) state that an important problem is ‗brain drain‘. Brain drain occurs when the skills and qualifications gained in one hotel are easily transferable to other hotels. In the modern hotel industry, the senior and skilled employees are very familiar with the hotels operation and business secrets, so the competitive advantage will be decreased if they leave the previous hotel and seek employment in another hotel. Moreover, the high costs of staff turnover can be associated with negative impacts on a hotel. Hinkin and Tracey (2000) point out many managers do not understand how to deal with the impact of turnover on the bottom line, ―... for example, in Cascio, the average cost of replacing an hourly line employee was $1,500, while that amount jumped to $3,000 for a salaried staff member‖ (p.17). Lashley (2000) also divides the cost of staff turnover to direct costs and hidden costs. For example, the direct costs include advertising for replacements, interview, orientation, and training costs, and uniforms; the indirect costs include the management time spent recruiting, selecting, and training, lost staff expertise, decreased the quality of service, productivity, and customer satisfaction, and poor 57
Indian Journal of Applied Hospitality and Tourism Research
impact on remaining employees (Lashley, 2000). Therefore, the higher staff turnover lead to higher costs in a hotel. Normally, the costs of staff turnover can be divided into four types of costs including leaving costs, replacement costs, transition costs and indirect costs (Lashley, 2001). Firstly, leaving costs can as payroll and personnel costs. For instance, any payments made to the person who leaves the hotel such as redundancy payments and the cost of personnel time in administering the departure (Lashley, 2001). Secondly, replacement costs are relevant to the process of replacing that employee including the recruitment costs, interview time and employee selection and any agency fees the company may incur (Lashley, 2001). Thirdly, transition costs are training costs, both direct (e.g. courses) and indirect (e.g. supervisors spending time teaching the new employee), the costs of induction and the loss of productivity incurred while the new employee is learning new responsibility (Lashley, 2001). Lastly, indirect or hidden costs are associated with the loss of customer service and/or satisfaction as a result of labour turnover. From the four types of costs, staff turnover essentially comprises of direct and indirect costs to the hotel industry. In the case of direct costs, it is different from indirect costs because direct costs are easier to calculate the expenditure relating to replacement (Lashley, 2001). The training costs are normally considered as direct costs because the employers can know how much has been paid for training, while the value of skilled employees can often be ignored as a measure of the results. Employers tend to only see the monetary costs of training (Lashley, 2001). However, staff turnover is also intangible which also known as indirect or hidden costs. Indirect or hidden costs can be indicated as ‗soft issues‘ on which they are difficult to be calculated or to put an actual monetary cost on (Lashley, 2001). Indirect costs include everything relevant to the loss of customer service and/or satisfaction. For example, lost investment in training, loss of skills, reduced service quality, reduced productivity, increased wastage and costs, customer dissatisfaction, negative impact on remaining staff, opportunity cost of lost, management time (Lashley, 2001). Regarding both direct and indirect costs, employees should be considered as a key factor to the consistency of service quality which is a challenging task for any hotel to retain. This loss of quality can result in customer dissatisfaction and finally lead to loss of revenue and productivity. Hinkin and Tracey (2008) also point out that the loss of productivity from staff turnover can account for more than two-thirds of the total turnover cost. The costs that result from staff turnover, can contribute to the loss of a huge amount of revenue. Withiam (2007) describes that the total cost of turnover was about US$5,700 for replacing an operational staff, while nearly US$10,000 for replacing executive, managerial and supervisory staff. On average, replacing a non-management employee costs as much as 30% of the employee‘s annual salary, whereas replacing a management employee costs almost 50% of the manager‘s annual salary. Even though the replacement of management employees costs a lot, in fact non-management employees tend to quit their jobs more often than management employees due to a lack of stable roles and positions (Poulston, 2008). However, in order to minimise the costs of staff turnover, staff maintenance is a vital issue for hotels to firstly consider. If hotels are unable to retain skilled staff, it can eventually reduce the development of a hotels‘ competency and competitive advantage which in the long-term amounts to a greater amount and runs into hundreds of millions of dollars in both tangible and intangible costs (Kim 1998, Blomme et al., 2010). Based on the current issues of staff turnover in hotel industry, it is found that labour turnover not only leads to service quality decreasing, but also causes the hotel a loss in competitive advantage. Differences of Staff Turnover Worldwide According to Turner (2007), New Zealand‘s employers are battling with high levels of staff turnover, even though they are offering a generous pay rise to their current workforce, which is average 5.2% increase. Based on the latest Market Issues Survey from Mercer (2007), the rises in salary have not been distributed equally in different regions, but also in different working areas: Professions received a 5.3% pay rise, management 5.6%, but staff at lower levels got only 3.8% increase. The largest increases were in engineering 7.4% and marketing 8.7%. Employees in regional centers received 5.3% increased to their fixed packages, which is slightly more than people who work in Auckland who received a 4.9% increase and people from Wellington received a 4.5% increase. The employees from private sectors got a 6.3% pay rise which is larger than the public and government sector which received a 4.8% increase. (Mercer, 2007). ..... 58
Special Issue: Hotel Operations Management – Issues and Challenges
Vol. 5, January 2013
The outcomes based on the above figures show how unequally distributed the pay rates in New Zealand‘s different regions and sectors are. Employers found that the extra money paid to employees did not seem to stem the tide of voluntary turnover, which hit a record high of 18.5%. According to Shubkin (2007), the costs associated with staff turnover are huge and will continue to sap company‘s finances if employers fail to develop and regain employees. Business New Zealand Chief Executive O`Reilly stated in 2005 that the estimated cost of replacing a worker is 1.5 times that person‘s annual salary, apart from the costs of recruiting and induction of that employee. There is also a loss of productivity during the time that it takes the new employee get up to speed with the new job. In hospitality industry, according to Accor Hospitality New Zealand`s Director of Human Resources Graeme Ham (2007), the cost associated with employing frontline staff only is $3000 per employee, which includes the recruiting costs, induction, training time cost and getting replacement staff up to speed. In the year of 2007, Accor Hospitality turned over 900 employees across New Zealand. If we do simple calculations, we can easily understand how big these financial costs are in relation to the staff turnover issue each year. In addition the huge financial cost, high levels of staff turnover also makes it very hard to establish a consistent service, which is an essential factor in Accor service chain. According to Chris (2007), there are some guests, who come in every week, and like to be recognized by staff on first name basis. But you cannot really have that if there is a different porter or person on the front desk every second week. Martin (2007) points out that the labour market squeeze is getting worse although at the same time business confidence is increasing. Due to the recession, in 2006 the New Zealand was relatively shaky and due to this people not feel confident about changing jobs and voluntary turnover decreased. Now that the economic conditions started to improve again people are beginning to feel confident in looking for a better job. Another consequence for the high staff turnover rates is that organizations are paying more for less talented or skilled staff (Marketing Issues Survey, 2007). The survey also pointed out that the confidence in staff capability is low – only one in three employers believe their workforce meets some of their needs, and only 6% of employers feel that all their staff capability needs are met. According to the report published by People Count Third Sector (2010), there was a quite a significant drop in voluntary sector staff turnover in 2010, compared with the 2008-2009 period, even though the number is still higher than the average in UK. The study was carried out by HR Consultancy firm, Agenda Consulting, who interviewed 90 medium and large organizations by management and HR departments. The working areas which are experiencing a noticeable drop in staff turnover include the fundraising and retailing industries. The report stated that in the 2009-2010 financial years, there was 20% of staff who turned over their jobs, and this was also a slight decrease when compared with 21.3% in the previous year. Despite this fall, the turnover rate in voluntary sector still remains higher than the overall UK turnover rate of 13.5%. Based on Parry‘s (2010) explanation, the decrease in the voluntary staff turnover rates can be related to the current economic conditions. Because of the effects of the economic recession, organizations were reducing their staff numbers and avoiding hiring new staff unless necessary and there were also less job vacancies left for staff who had left their previous jobs. Also due to this, employees were not feeling confident in changing their job during this period. The report also pointed out existing variances in the different types of employment in the sector. As we stated above, the fundraising and retailing industries are two working areas which were experiencing the most significant decreases in staff turnover in the past year. According to the report, the average turnover for fundraising staff decreased from 24% to 19%. The retailing industry got fell even further from 25% to 18.4%. However, employers must pay particular attentions to the turnover rates for central-function employees, e.g. the staff working in administrative or human resources roles which increased by 1% to 18.4% during the same period. Overall, the National Council for Voluntary Organizations (2010) indicated that the turnover rate for staff leaving voluntarily dropped by 2% during the year. But the staff turnover because of redundancy increased slightly from 1.2% to 1.5%, which may be affected by the economic downturn. According to the Comprehensive Hudson Report (2007), Hong Kong has experienced higher levels of staff turnover than in any other market surveyed in Asia. Overall, there are more than 37% managers admitted that the turnover rate they have got in the last twelve months has exceeded 10%, while 10% of all the interviewed business managers stated that they have faced a turnover rate that has been more than 20%. Within those figures, Media/PR/Advertising has the highest level of staff turnover rates, with 46% managers from those three areas saying that they were facing more than 10% staff turnover rate. According to Manisha (2007), staff poaching, perceptions of limited career 59
Indian Journal of Applied Hospitality and Tourism Research
progression and dissatisfaction with salary and bonuses are the top three causes for high staff turnover in Hong Kong. And these top three factors are mentioned by 28%, 21% and 19% of respondents respectively. Differing from the employment situation in UK, the latest employment trends in Hong Kong is expecting that permanent employment has increased slightly in 2007 (Towards National Plan, 2007). Gina (2007) who is the Country Manager of Hudson also indicated that, as there is large number of companies that feel confident about the future, therefore, employment expectations have increased slightly from an already high level. But managers need to be aware that they have to boost salaries and bonuses substantially to attract the talent they need.
Current Study The main purpose of this study is to focus on that in last 25 years, how the research has helped to understand the phenomenon of staff turnover? And what lessons hotel industry could learn to manage this process? The main objectives of this study include: Analyse the literature on staff turnover. Assess the impacts of this research on industry practices. Examine what major factors play a significant role in staff turnover? Identify lessons learnt for future practice and research.
Results To achieve the objectives and to examine what lessons could be learnt from the past research with regard to staff turnover in hotels the results are classified as under: Staff turnover in the hotel/hospitality industry, and turnover culture in the industry. Factors that impact staff turnover and issues related to staff turnover. Differences in staff turnover trends worldwide, a comparison of the situation with New Zealand. What is Staff Turnover? As previously stated by Denvir and McMahon (1992), staff turnover has been defined as ―… the movement of people into and out of employment within an organisation‖ (p. 143). Therefore, this definition provided by Denvir and McMahon (1992) leads one to believe that this movement of staff ―... into and out of employment‖ can occur at any time and with regularity within organisations (p. 143). This previous statement is backed up by authors such as Kennedy and Berger, 1994; Woods, 1992 and Tanke, 1990 who have stated in their own articles that staff turnover especially within the hospitality industry has been noted to be unacceptably high, averaging up to 200% or 300% per annum, although variations exist between different establishments throughout the industry. Also, the Chandler Macleod Group state, as do several different studies, that ―... 73% of employees are ‗ACTIVELY LOOKING‘ for a new employer‖ (as cited by Step Business Builders, 2010). Therefore, the issue of staff turnover within any organisation should be actively investigated as to its causes and the reasons behind why employees are ‗ACTIVELY‘ seeking new employment opportunities. What Impacts Staff Turnover? There are a variety of factors that impact on staff turnover. A number of authors, such as Fallon and Rutherford, 2010; Hinkin and Tracey, 2000; Williams et al., 2008; Bull, 1992; Ogbonna and Harris, 2002; Walmaley, 2004; Horner and Swarbrooke, 2004 and Lashley, 2000, Choi (2006) have attempted to identify and discuss the impacts of staff turnover as a phenomenon. The authors, Fallon and Rutherford (2010) have identified issues such as employees‘ treatment by superiors, the amount of working hours expected, job pressures, scheduling working hours and personal life, training, lack fringe benefit packages, better opportunities elsewhere, and the physical demands of the job as the most likely factors to impact on staff turnover levels. Meanwhile, a study conducted by Williams et al. (2008) found that in New Zealand‘s hotel industry three factors that significantly impacted upon staff turnover were; age, low levels of unemployment and remuneration. In the hospitality industry, a major issue is that the employees within the industry are described as having low skill levels and there is a lack of career structure for those employees who are looking to succeed in the industry. Therefore, many businesses find it difficult to attract and retain employees due to the well-known issues existing within the industry as previously stated within this report. Global Examples of Staff Turnover When examining global examples of staff turnover, we can see some significant differences based on the staff turnover issues described above in three different markets; the UK, Hong Kong and New ..... 60
Special Issue: Hotel Operations Management – Issues and Challenges
Vol. 5, January 2013
Zealand markets. In the UK and New Zealand markets, the staff turnover situations are quite similar. In both countries, employees are avoiding leaving their jobs due to the economic recession. However, in Hong Kong, there is no evidence that staff turnover rates are decreasing, although people living in Hong Kong are willing to change their job if they are not satisfied with their career progression or salary in their current employment. The reasons that have contributed to these differences may come from the different local cultures; however, we did not find any evidence in the literature to support whether different cultures had an impact on the levels of staff turnover in different countries and regions. Although, when examining New Zealand‘s staff turnover issues, we have however learned that there are differences nationwide. The reasons for this are due to the local culture, population and economic development, and people‘s perceptions of their personal work/life balance. This personal work/life balance has been seen to be an influencing factor in how employees are affected by their working attitudes and their loyalty to their jobs. The Role of Staff Turnover on Business Profitability Staff turnover has been seen to have a significant impact on business profitability. Several authors note there is an emerging trend of very few staff remaining in their job for longer than five years at a time (BTR, 1990 (as cited in Nankervis, 1990); Riley, 1991). Also, this premature turnover of staff within the industry is a waste of a hotel‘s sizeable investment in employee development and training (Beckert & Walsh, 1991; Hom & Griffeth, 1995). Through these high staff turnover levels, this has a significant contribution to the high replacement costs incurred by many businesses. As previously stated in this report ―... every time an employee resigns, it costs up to 50% of their annual salary to replace them‖ (Step Business Builders, 2010). This is a significant amount of money that could have been invested into other areas of the business such as replacing stock, maintenance, refurbishments, marketing and other such activities. Hartman and Yrie (1996) note that, as the hotel industry is a notably ‗people intensive‘ industry, the costs associated with staff turnover are more significant than in less labour-intensive industries. Figure 1: Causal Model of Employee Intent to Leave.
(Iverson & Deery, 1997, p. 72). Staff Turnover in the Hotel Industry Staff turnover within both the hotel and hospitality industry has been an increasing issue for a number of years. A number of authors, such as Birdir (2002); Stalcup and Pearson (2001); Choi, Woods and Murrmann (2000); Teare and O‘Hern (2000); Deery and Shaw (1999); Iverson and Deery (1997); Cho, Sumichrast and Olsen (1996); Ohlin and West (1993); Boles, Ross and Johnson (1995); Cantrell 61
Indian Journal of Applied Hospitality and Tourism Research
and Sarabahksh (1995) and Hogan (1992), have attempted to examine this issue and provide some insight into why this issue still exists in both the hotel and hospitality industries. Birdir (2002) describes staff turnover within the hotel industry as one of the most pressing issues that must be focused on. As noted by the authors Hartman and Yrie (1996) and Hinkin and Tracey (2000), the turnover rates in the hospitality industry are extremely high relative to other industries. Overall the following figure provides contributing factors that impact intention of the employee to quit the current job. Based on the current results another version of model specific to hotel/hospitality industry is developed which is presented in Figure-2 below. Figure2: Factors that influence and lead to staff turnover in the hotel/hospitality industry
Age Personal (Marital) Status Dependants
Lack of Job Satisfaction
Working Conditions Issues with Management Level of Education
Loss of Organisation Commitment
Career Aspirations
Better Employment Opportunities
Thoughts of Moving On in Career/Job
Staff Turnover Occurs
The results of the study identify following key points: Issues and challenges that are involved in staff turnover levels have not changed over the last 20 years. Staff turnover is not limited to any one region or country; this is a worldwide phenomenon in the hotel/hospitality industry. Without significant changes worldwide within the hotel industry, government policies and regulations that surround the industry these issues will be a continuous challenge for the industry.
Discussion and Conclusions Redford (2005) has suggested five important steps that can help to reduce staff turnover and build a better workforce. Drawing from his study and other literature this study offers some insights addressing the issue of staff turnover and makes following suggestions as lessons learnt for future practice and research. Promoting a sense of permanence within the hotel/hospitality industry - This can be achieved by promoting a perception of the organisation as one which values long-term commitment from its employees. Management within organisations also need to address what their employees are looking for from their job. By offering employees advice on career development and highlighting how this job will cater to their needs. This in turn, will help employees feel like their personal goals are being achieved and are more likely to feel satisfied in their workplace. By allowing employees know that ..... 62
Special Issue: Hotel Operations Management – Issues and Challenges
Vol. 5, January 2013
you are interested in investing time and money in them provided they stick to their job. This will help both the organisation and the employee achieve mutual goals. Development of career opportunities within the organisation - By having variable career opportunities for all employees within the organisation, this can reduce the tendencies to move jobs on a regular basis. Employees who feel though they can positively progress within the organisation and achieve their personal goals are more likely to retain their jobs longer. Allowing multi-skilling between different departments, training and other incentive programmes available to employees they are more likely to be continually satisfied by their job. Provide new employees realistic job preview – The hotels should provide prospective employees a 'realistic job preview' at the recruitment stage in order to reduce the levels of staff resignation within the first six months of their contract (Incomes Data Services, 2008). All employees should be provided with a clear idea of their role including both the good and the bad points and the culture of the company as this can avoid later disappointment. Also, the employers should offer induction programmes to new employees by letting the manager expose new staff to the company‘s culture. To disclose everything in the first stage will build trust and ensure the right people are recruited for the right roles. Conduct regular performance and 360° appraisals – The success of an organisation depends on the people who are employed in the organisation and whether employees can improve their job performance over time. By regularly implementing such appraisals management and supervisors can get more of an idea where the employees are in terms of their job competence, satisfaction level and any issues that need to be addressed. Managers, who take weekly rounds of departments finding out the way employees function and whether anybody has a grievance, make them appear friendly and approachable. This can also break down the barriers between management, supervisors and frontline staff and allow communication to occur more freely between different levels within the organisation. Most hotels are currently finding that an effective way to enhance staff performance and to receive 360° feedback, are vital tools in achieving overall success of an organisation. The 360° appraisal process is often used for both employee appraisal and employee development (Maples, Harris & Greco, 2010). For example, when used for employee appraisal, it finds information collected from various sources to create a whole picture of staff performances, while it can also increase employees‘ perceptions of training needs when used it for employee development. However, the 360° appraisal process is mostly used for employee appraisal (Maples et al., 2010). It is obvious that staff should know their level of current performance and need to improve it but the different performance evaluation can affect different levels of improvement. Traditional performance reviews allowed all staff to receive feedback from only their supervisor and that the information received cannot form the whole picture of their performance, however, on the other hand the 360° appraisal process allows employees to be rated by their supervisors, co-workers and subordinates (Robertson, 2008; Gallagher, 2008). To start using this process, employers need to firstly to fill out a confidential survey about the person under review and the feedback should be related to the skills or behaviours needed to meet the hotels goals (Redford, 2005). By receiving feedback from all levels within the organisation, staff can understand themselves deeply in terms of what their weaknesses and strengths are which probably would have never been discovered. Also, the 360° appraisal allows staff to learn how other employees view their effectiveness which can in turn help employees to develop professionally as well. However, this tool can only bring benefits to the employees themselves and the organisation if employees are willing to be open for the feedback. If employees are not open minded to the feedback or are afraid of the responses they may get this can have a negative effect on these particular employees (Gallagher, 2008). Throughout the literature, many authors illustrate the benefits from using this technique. For example, Banu and Umamaheswari (2009) present the key benefits of 360° performance appraisal including; a. Increasing the understanding of the behaviour and attitudes of individuals from all angles — employee, manager, subordinate, peer, and customer to improve individually and enhance organisational effectiveness. b. Increase individual ownership for self-development and learning. c. To help identify strengths and areas in need of improvement in terms of job performance. In a study conducted by Sanwong (2008), the author established that employees have attitudes ranging from ‗positive‘ to ‗very positive‘ towards 360° appraisals. Also in another study, the authors, Atwater 63
Indian Journal of Applied Hospitality and Tourism Research
and Brett (2006) demonstrated that there is a positive correlation between 360° feedback and increases in job satisfaction. As noted by Sanwong (2008) the employee under review can receive and accept comments which can contribute to improving behaviour, raise confidence, and strengthen morale for their job performance, while the reviewers can feel empowered through offering their opinions (Gallagher, 2008). As this feedback comes from a number of sources, this can reduce bias (Tversky & Kahneman, 1974; as cited in Maples et al., 2010). In addition, this tool brings a chance to develop communication between employers and employees which will finally contribute to individual improvement and the overall success of the hotel (Sanwong, 2008). However, the 360° appraisal has a drawback to its use. The main drawback of this appraisal system is that some employees can feel worried if they have to give feedback to their supervisors because if the supervisors feel dissatisfied, this tool can, in turn, affect their status (Sanwong, 2008). In fact, employees need to feel valued and have their view count, so employers should give all staff regular appraisals which include feedback from all angles to give an accurate reflection of their performance. Also, such appraisals should provide the opportunity for staff to talk about their ambitions, not just goals the company expects them to have (Redford, 2005). After the appraisal process, training should be offered as needed to employees who require it. For example, special lectures or seminars can be arranged to encourage staff to be more aware about their job and to create self-confidence in the employees and the training should be suitable for employees‘ level of knowledge and skills (Robertson, 2008). If employees are ready for a new role, the employers can provide the support they need to achieve it (Redford, 2005). However, Robertson (2008) points out that the 360° appraisal should not be used once; instead it should be a part of ongoing development between employees and the organisations. In conclusion, the 360° performance appraisal system helps to identify training needs, the performance of employees and the determination of rewards/incentives and steps to promote communication from all angles (Banu & Umamaheswari, 2009). These long-term outcomes will enhance the retention, boost morale, and allow higher quality service (Robertson, 2008). Provide training, development and induction programmes for new and existing employees - All employers should provide a training program with development opportunities in order to keep staff motivated while helping to build a skilled workforce. Repeated training is also a good way to embed particular concepts into employees. Such initiatives as repeated training programmes help employees hone their skills and at the same time allow management to train employees in the correct manner. Hotels should maximise opportunities for individual employees to develop their skills and progress in their desired career paths (Incomes Data Services, 2008). Employees also enjoy prospect of career development through continuous training. It has been identified by authors such as Denvir and McMahon (1992) that organisations that invest more time and money into training and induction programmes retain more staff throughout all levels within the organisation. The training objectives should not focus just on the skills employees need to do their current job, but allow them to grow skill-sets in new areas too. All employees also need to be educated about the policies and working procedures of the hotel. By keeping these policies and working procedures transparent, fair and consistent employees will be more respectful to the rules and regulations of the organisation. This way, employees are more likely to see their future within the same organisation. The issues including staff development, employee satisfaction and staff retention has been related closely, thus the hotels should not ignore the importance of training (Watson, 2003). Benchmark benefits and pay - Salary will always be an important pull for new recruits and regular pay rises can be a key retention tool. Therefore, employers should improve career development and benchmark the full package or an attractive package that the organisation offers against its competitor‘s opportunities. In a study conducted by Dickinson and Perry (2002), these authors point out that salary can predict the retention of employees. However, low-salary positions in hospitality can be improved by creating additional benefits which can differentiate the hotel from its competitors. Currently, flexible packages are becoming popular by providing a variety of options for staff. By offering flexible packages, employees can switch the benefits they desire as they reach different stages and their needs change, especially for employees with families. Also, rewards such as extra holiday and bonuses should be benchmark. This can be given staff to deserving employees to reward good performance and loyalty. Conduct exit interviews and attitude surveys - The employers should conduct exit interviews to find out the root causes of staff turnover and conduct confidential attitude surveys to find out the reasons behind current employees intentions to leave. Exit interviews should be conducted a short ..... 64
Special Issue: Hotel Operations Management – Issues and Challenges
Vol. 5, January 2013
time after employees hand in their notice because employees often feel more comfortable identifying problems at this time. Confidential attitude surveys should be completed by current staff and include questions about their intentions to leave. Also, further insight can be gained by sending questionnaires to former employees about six months after their departure. By training the Human Resource Department in doing these interviews, the management of the organisation can then analyse and derive an inference from the answers to such questions. This can give insight into the needs of the employees and allow management to sort out any problem areas. By giving out questionnaires on a fairly regular basis to current employees, management will be able to determine what employees think about working in the organisation. This will also bring up issues identified by the employees that need immediate attention. Management must be prepared to address these issues immediately so that things don‘t go out of hand. Respect - Employees are less likely to leave their current job if they feel as though they are respected by other employees within the organisation. Respect plays a key role in job satisfaction by recognising job performance, honouring cultures, languages, traditions, and where appropriate the age of their employees, employers are creating a workplace where respect is paramount. Development of an internal labour market - By developing an internal labour market, hiring from within, this provides an organisation with a continuous supply of trained and qualified employees that are already familiar with the organisation and leads higher retention rates of employees at that particular organisation. Organise social occasions for employees - Form social groups within the organization, wherein your employees can interact. By doing activities such as arranging outings, or making a newsletter that carries information about and for the employees that is important to them management can make employees feel more included and valued within the organisation. Concluding Remarks Based on above literature analysis and review, it is identified that staff turnover is not just a management issue from micro-environment of a company, but also affected by macro-environmental factors from outside the organization such as economic conditions. In New Zealand‘s domestic market and in the international market, since 2007 the staff turnover rates have slightly dropped due to the economic recession. Employees are not feeling confident in ‗ACTIVELY‘ seeking a better job. Due to the recession, many companies are controlling the number of new staff being hired in order to help reduce costs. By studying the common phenomenon of staff turnover in the hotel industry, it can help us understand the turnover issues from both the industry side and the personal side. We have also devised a model, figure 2, in which we believe incorporates the factors that influence and lead to staff turnover occurring. The outcomes of this study will help the industry develop more efficient management strategies in order to reduce the high turnover rates. However the study might have limitations in terms of making suggestions by referring to previous research which may be subjective in nature.
References Antolik, C. (1993). Increasing discrimination increases turnover. Hotel and Motel Management, 208(15), 20. Atwater, L. E., & Brett, J. (2006). 360 degree feedback to leaders: Does it relate to changes in employee attitudes? Group and Organization Management, 31(5), 578-600. Banu, C. V., & Umamaheswari, P. (2009). A study on 360 degree performance appraisal systems in reliance life insurance, Udumalpet. The IUP Journal of Management Research, 7(7), 65-78. Birdir, K. (2002). General manager turnover root cause. Journal of Contemporary Hospitality Management, 14(1), 43-47. Beckert, J., & Walsh, K. (1991). Development plans replace performance reviews at Harvey Hotels. Cornell Hotel and Restaurant Administration Quarterly, 32(3), 72-80. Blomme, R. J., Van Rheede, A., & Tromp, D. M. (2010). The use of the psychological contract to explain turnover intentions in the hospitality industry: A research study on the impact of gender on the turnover intentions of highly educated employees‘. The International Journal of Human Resource Management, 21(1), 144-162. Boles, J. S., Ross, L. E., & Johnson, J. T. (1995). Reducing employee turnover through the use of pre-employment application demographics: An exploratory study. Hospitality Research Journal, 19(2), 19-30. Bonn, M. A., & Forbringer, L. R. (1992). Reducing turnover in the hospitality industry: An overview of recruitment, selection and retention. International Journal of Hospitality Management, 11(1), 47-63. Bull A. (1992). The Economics of Travel and Tourism. London, England: Pitman.
65
Indian Journal of Applied Hospitality and Tourism Research
Cantrell, N., & Sarabahksh, M. (1995). Correlations of non-institutional food service turnover. FIU Hospitality Review, 9(2), 52-59. Cho, W., Sumichrast, R. T., & Olsen, M. D. (1996). Expert system technology for hotels: Coming application. The Cornell Hotel and Restaurant Administration Quarterly, 37(1), 54-61. Choi, J-G., Woods, R. H., & Murrmann, S. K. (2000). International labour markets and the migration of labour forces as an alternative solution for labour shortages in the hospitality industry. International Journal of Contemporary Hospitality Industry, 12(1), 61-66. Choi, K. (2006). A structural relationship analysis of hotel employees‘ turnover intention. Asia Pacific Journal of Tourism Research, 11(4), 321-337. Chris, V. (2007). Staff performance evaluation and motivation. South Melbourne: Macmillan. Comprehensive Hudson Report. (2007). Staff Turnover is a Real Productive Issue. Wellington, New Zealand: The Ministry of Tourism. Conrade, G., Woods, R., & Ninemeier, J. (1994). Training in the US lodging industry: Perception and reality. Cornell Hotel and Restaurant Administration Quarterly, 35(5), 16-21. Debrah, Y. A. (1994). Management of operative staff in a labour-scarce economy: The views of human resource managers in the hotel industry in Singapore. Asia Pacific Journal of Human Resources, 32(1), 41-60. Deery, M. A., & Shaw, R. N. (1999). An investigation of the relationship between employee turnover and organisational culture. Journal of Hospitality and Tourism Research, 23(4), 387-400. Denvir, A., & McMahon, F. (1992). Labour turnover in London hotels and the cost effectiveness of preventative measure. International Journal of Hospitality Management, 11(2), 143-154. Dickinson, N. S., & Perry, R. E. (2002). Factors influencing the retention of specially educated public child welfare workers. Evaluation Research in Child Welfare, 15(3/4), 89−103. Eade, V. H. (1993). Human resource management in the hospitality industry. Arizona, AZ: Gorsuch Scarisbrick. Fallon, M. J., & Rutherford, D. G. (2010). Hotel Management and Operations. New Jersey: John Wiley & Sons, Inc. Gallagher, T. (2008). 360-degree performance reviews offer valuable perspectives. Financial Executive, 24(10), 61. Gina, K. (2007). Strategy for staff management in hospitality industry. Tourism Management, 14(2), 131-136. Ham, G. (2007). Increasing the return on staff investment. Accor Hospitality Report: Increasing The Return On Staff Investment. Retrieved from http://www.dol.govt.nz/services/PartnershipResourceCentre/projects/accor-hospitality.pdf Hartman, S. J., & Yrie, A. C. (1996). Can the hobo phenomenon help explain voluntary turnover? International Journal of Contemporary Hospitality Management, 8(4), 11-16. Hiemstra, S. J. (1990). Employee policies in the lodging industry. International Journal of Hospitality Management, 9(3), 207-221. Hinkin, T. R., & Tracey, J. B. (2000). The cost of turnover. The Cornell Hotel and Restaurant Administration Quarterly, 41(3), 14-21. Hogan, J. J. (1992). Turnover and what to do about it. Cornell Hotel and Restaurant Administration Quarterly, 33(1), 40-45. Hom, P. W., & Griffeth, R. W. (1995). Employee turnover. Ohio, OH: South Western Publishing. Horner, S., & Swarbrooke, J. (2004). International cases in tourism management. Oxford: Elsevier Butterworth-Heinemann. Incomes Data Services. (2008). Improving staff retention. London, England: IDS. Iverson, R. D., & Deery, M. (1997). Turnover culture in the hospitality industry. Human Resource Management Journal, 7(4), 71-82. Iverson, R. D., & Kuruvilla, S. (1995). Antecedents of union loyalty: The influence of individual dispositions and organizational context. Journal of Organizational Behaviour, 16 (6), 557-582. Kennedy, D. J., & Berger, F. (1994). Newcomer socialisation: Oriented to facts or feelings? Cornell Hotel and Restaurant Administration Quarterly, 35(6), 58-71. Kim, I. C. (1998). Effects of the job performance on the turnover intention of hotel employees in Korea. Journal of Tourism Sciences, 21(2), 142-156. Lashley, C. (2000). Hospitality retail management: A unit manager‟s guide. Oxford: Butterworth-Heinemann. Lashley, C. (2001). Costing staff turnover in hospitality service organisations. Journal of Services Research, 1(2), 3-24. Lee-Ross, D. (1993). Two styles of manager, two styles of worker. International Journal of Contemporary Hospitality Management, 5(4), 20-24. Manisha, H. (2007). Practical strategy for resolving staff conflict. Tourism Management, 9(2), 96-104. Maples, G., Harris, B., & Greco, A. M. (2010). Using a 360-degree appraisal approach to re-design advising programs. Contemporary Issues in Education Research, 3(1), 1-7. Marketing Issue Survey (2007). Management with the staff performance with the hospitality industry. Wellington, New Zealand: Ministry of Tourism. Martin, B. (2007). The impact of staff turnover on business operation. Cambridge, Harvard University Press. Martoccio, J. J. (1994). The effects of absence culture on individual absence. Human Relations, 47(3), 243-262. Mercer. (2007, November 17). The Staff Turnover Survey in New Zealand. Retrieved from New Zealand Immigration News.
..... 66
Special Issue: Hotel Operations Management – Issues and Challenges
Vol. 5, January 2013
Mueller, C. W., Boyer, E. M., Price, J. L., & Iverson, R. D. (1994). Employee attachment and non-coercive conditions of work the case of dental hygienists. Work and Occupations, 21(2), 179-212. Nankervis, A. R. (1990, August). Servants or service? Perspectives of the Australian Hotel Industry (Working Paper No. 73). Sydney, Australia: University of Western Sydney, School of Business. National Council for Voluntary Organizations (2010). Getting it right for staff performance. London, England: Office of National Tourism. Ogbonna, E., & Harris, L. (2002). Managing organisational culture: Insights from the hospitality industry. Journal of Human Resource Management, 12(1), 33-53. Ohlin, J. B., & West, J. J. (1993). An analysis of the effect of fringe benefit offering on the turnover of hourly housekeeping workers in the hotel industry. International Hospitality Management, 12(4), 323-336. Parry, B. (2010). Dictionary of Travel, Tourism and Hospitality (2nd ed.). Oxford: Butterworth-Heinemann. People Count Third Sector (2010). Current issues in tourism. London, England: Office of the Parliamentary Commissioner for the Tourism. Price, M. & Clark, M. (2008). Some fundamental truths about tourism. Journal of Sustainable Tourism, 1(1), 6-16.* Price, L. (1994). Poor personnel practice in the hotel and catering industry: Does it matter? Human Resource Management Journal, 4(4), 44-62. Poulston, J. (2008). Hospitality workplace problems and poor training: A close relationship. The International Journal of Contemporary Hospitality Management, 20(4), 412-427. Powell, S., & Wood, D. (1999). Is recruitment the millennium time bomb for the industry worldwide? International Journal of Contemporary Hospitality Management, 11(4), 138-139. Redford, K. (2005). Business brains get a heart. Caterer and Hotelkeeper,195(4392), 36-39. Riley, M. (1991). Human resource management: A guide to personnel practice in the hotel and catering industry. Oxford, England: Butterworth-Heinemann. Robertson, C. (2008). Employee development: Getting the information you need through a 360 degree feedback. Chemical Engineering, 115(4), 63-66. Ross, D. L. (1993). An investigation of ‗core job dimensions‘ amongst seasonal seaside hotel workers. International Journal of Hospitality Management, 12(2), 121-126. Rowden, R. W. (1995). The role of human resource development in successful small to mid-sized manufacturing businesses: A comparative case study. Human Resource Development Quarterly, 6(4), 355-373. Sanwong, K. (2008). The development of a 360-degree performance appraisal system: a university case study. International Journal of Management, 25(1), 16-22. Shubkin, M. (2007). The impact of staff turnover. Cambridge, England: Cambridge University Press. Stalcup, L. D., & Pearson, D. (2001). A model of the causes of management turnover in hotels. Journal of Hospitality and Tourism Research, 25(1), 17-30. Step Business Builders. (2010, August 16). http://www.youtube.com/watch?v=l-koQRHqT9c.
Facts
about
staff
turnover
[Video
file].
Retrieved
from
Tanke, M. L. (1990). Human resources management for the hospitality industry. New York, NY: Delmar. Teare, R., & O‘Hern, J. (2000). Challenges for service leaders: Setting the agenda for the virtual learning organisation. International Journal of Contemporary Hospitality Management, 12(2), 97-106. Turner, M. (2007). High Staff Turnover Hits New Zealand Employees. New Zealand Immigration News. Retrieved from http://news.emigratenz.org/2007/11/17/high-staff-turnover-hits-new-zealand-employers/ Vallen,G. K. (1993).Organisational Climate and Burnout, Cornell Hotel & Restaurant Administration Quarterly,34(1), 5459. Wagner, G. (1991). Strategies/employee selection makes Ritz tradition. Lodging Hospitality, 47(7), 30-43. Walmaley, A. (2004). Assessing staff turnover: A view from the English Riviera. International Journal of Tourism Research, 6(4), 275-287. Watson, S. (2003). How to use training as a retention tool. Retrieved from http://www.summitconsultants.co.uk/newsdetail.asp?fldNewsArticles_ID=109. Williams, D., Harris, C., & Parker, J. (2008). I love you - goodbye: Exit Interviews and Turnover in the New Zealand Hotel Industry. New Zealand Journal of Employment Relations, 33(3), 70-90. Withiam, G. (2007, January 8). Study examines unexpected costs of turnover. Hotel and Motel Management, 222(18). Wood, R. H (1992). Working in Hotels and Catering. New York, NY: Routledge. Woods, R. H. (1992). Managing hospitality human resources. Michigan, MI: Educational Institute of the American Hotel and Motel Association. Yang, J-T., Wan, C-S. (2004). Advancing organisational effectiveness and knowledge management implementation. Tourism Management, 25(5), 593-601.
67
Indian Journal of Applied Hospitality and Tourism Research
A study of factors moderating student’s selection of hospitality program in India Abstract In an effort to keep pace with increasing employment opportunities and demand for qualified and well-trained personnel, there has been an increase in the number of educational institutions offering hospitality management programmes in India. Investment in education in hospitality management courses will play a critical role in providing the human resources needed for this fast growing industry. The issue of study motivations has been the subject of a number of investigations that attempted to understand what motivates students to major in hospitality and tourism management (Bushell, Prosser, Faulkner, & Jafari, 2001; Kim, Guo, Wang, & Agrusa, 2007; O‟Mahony, McWilliams, & Whitelaw, 2001). Evaluating the popularity of hospitality programs in order to understand its current position in the field of education, this paper is an attempt to identify reasons why students in India want to get an entry into tertiary education field like hospitality management. It aims to investigate the factors moderating (motivating) selection of hospitality programmes and intended subsequent career with the industry. The broad areas chosen for the study are demographic factors including socio-economic background, external influence, field attractiveness, job opportunities, ease of study and academic achievement. With the sample size of 100 first year bachelor of hotel management students from a hotel management college, the study used a detailed questionnaire on the above factors. They were asked to rate their choice of the criterion on a fivepoint Likert scale (1=Strongly Disagree, 5=Strongly Agree) to rank these dimensions. Suitable statistical techniques were used to analyze the data collected from the respondents. Based on the findings of the study, suggestions were given to education providers to take students‟ study motivations into consideration in curriculum development. With student-oriented curricula, HM programmes can generate quality learning outcomes to increase student satisfaction and further interest in starting a career in the industry. Key words: Hospitality education, hospitality industry, career motivations, career selection
Introduction Tourism is an intensely competitive, focused and rapidly evolving business sector. It is found to be an important factor in the socio-economic development of a country, contributing in multiple ways and also strengthening the inter-connected processes. As regards to employment generation in 2011, the sectors‘ direct contribution worked out to be 5% and the total effects- direct and indirect togetherstood at 7.5% in the country‘s total employment pie (HVS, 2012). By 2021 the figures are expected to rise to 5.2% and 8.5% respectively and such prospects need to be taken as an important indicator for concerted policy interventions and programming in the tourism sector (IITTM- ICC Report, 2011). Therefore, investment in professional education in hospitality and tourism management plays a critical role in providing the human resources needed for the fast growing hospitality and tourism industry in India. Figure 1: Hotel room supply, capital investment, and manpower requirement by 2021 – India
(Source 2011: HVS International)
Owing to the increasing employment opportunities and demand for qualified and well-trained personnel, there has been an increase in the number of educational institutions offering hospitality management programs in India. Many opportunities currently exist to study hospitality at tertiary level, which range from vocationally oriented technical colleges and private institutions to government run IHM‘s accredited to AICTE. The most frequently cited reasons from students to obtain certain qualifications are generally for career purposes (O‘Mahony, 2001). The reasons may be multiple; based on interest, aptitude and abilities that emerge during their high school years. However, influences external to the students‘ environment may also be significant but not examined or measured clearly. Therefore, identifying the Shreelatha Rao and Vidya Patwardhan, Welcomgroup Graduate School of Hotel Administration, Manipal University, India. Email:
[email protected] &
[email protected]
..... 68
Special Issue: Hotel Operations Management – Issues and Challenges
Vol. 5, January 2013
reasons why students choose to study the Hotel Management undergraduate degree courses offered by different universities was seen as appropriate and timely. It was felt appropriate to solicit information from students about their background, knowledge of the industry, study motivations and influence of parents and peers. The aim of this study was to explore the issues involved in students' decisions to enrol in hospitality studies at Manipal University. The issues may be perceptual, personal or environmental; but they need to be identified in order to help the University to revise support mechanisms and improve the current status of hospitality education in general.
Literature Review Hospitality Education in India Education is at the core of successful and sustainable tourism development and has been identified as a ―critical element‖ (Lewis, 2005, p.5). The status of hotel management education in India is improving due to the increased job opportunities for hotel management graduates in many other sectors like call centers, airlines, banks, shopping malls, cruise ships, multiplexes etc. A large number of graduates are also able to find jobs abroad (FHRAI, 2005). Today hospitality education in India has evolved into a wide spectrum of programs at various levels offered by government-funded institutions, self-financed private institutions and other private enterprises. Figure 2: Hotel management education in India
Indian Hotel Management Education Number of Colleges 800-1000 Number of students passing out per year 15,000 Prominent University NCHMCT BHM, BHMCT, B.Sc., MBA, M.Sc., Diploma, Courses Offered Certificate (Source: Aspiring Minds’ National Employability Report Hotel Management Graduates: 2012)
As mentioned in figure 2, in addition to the colleges affiliated to NCHMCT, there are self-financed private colleges accredited to AICTE providing 4 year BHM degrees in India. Number of government owned as well as private universities in India, offering hospitality management programs have a tie up with international universities from USA, Australia, France, UK etc. Such fast growth of hospitality management programs has generated intense competition among these programs for better quality and increased quantity of students. A word of caution at this juncture relates to the quality of education provided by these institutions in general. As mentioned by Jauhari (2006,) an issue of mismatch exists between supply and demand of certain skills in the hospitality industry in India. The academic input focus should not only be on operational related aspects which are not sufficient for creating and building brands but also on building management competencies. In order to attract more students for hospitality related courses, these gaps need to be filled by having proper collaboration between the industry and academia along with suitable marketing techniques.
Students’ Study Motivations The issue of study motivations has been the subject of a number of investigations that attempted to understand what motivates students to pursue hospitality and tourism management courses (O‘Mahony, 2001). To be successful in a competitive education market, the education providers must take students‘ study motivations into consideration in curriculum development. This will enhance the quality of these courses in order to attract more students. With student-oriented curricula, Hospitality and Tourism Management (HTM) programmes can generate quality learning outcomes and student satisfaction (Lee et al., 2008). Many studies in the hospitality disciplines have reported on the reasons why students choose a particular college or university for their study. Chen (2009), in his study revealed that Chinese students choosing HTM as their major was related to intrinsic motives of interest in foreign culture, love of the field and recognition of the attractiveness of the hospitality and tourism industry. According to Bushell et al. (2001), high school graduates or university graduates are attracted to undergraduate or graduate degrees in an HTM program because the industry provides benefits through its contribution to cultural enrichment and economic growth, and provides challenging and exciting career opportunities for people with a variety of talents and interests. O‘Mahony et al. (2001) focused on three major motivational factors, which included the students‘ knowledge and interest in the hospitality industry, the influence of their parents, career counsellors, and peers; and their experiences as customers in the hospitality industry. According to Schmidt 69
Indian Journal of Applied Hospitality and Tourism Research
(2002), students‘ decision to major in HTM was affected by many factors, such as personal (e.g. particular individuals), demographic (e.g. gender, race, age), psychological (e.g. personality and lifestyle), and social factors (e.g. reference group). Conclusively, these studies show that students have an interest in studying HTM programs but their level of interest may vary with realistic field experience or information gained (Kim, 2007). To the authors‘ knowledge, however, limited research papers in Indian context were available for reference.
Methodology Measurement Development To assess the factors moderating students‘ selection of hospitality program, 21 statements were fixed through review of research on study motivations and reasons to opt for hospitality degree program (Lee, 2008; Kim, 2007; Bushell, 2001). Responses to these items were measured on a 5-point Likert type scale where 1 = ―Strongly Disagree‖, 3 = ―Neutral‖, and 5= ―Strongly Agree‖. In addition, questions related to respondents‘ demographic information, such as age and gender, were included in the questionnaire in order to examine whether there was a difference in students‘ perceptions on choosing this course of study based on these factors. Data Collection Students pursuing hotel management degree from Manipal University were chosen for the study. The questionnaire was distributed to 195 students who were in their first and second year Bachelor of Hotel Management program. 106 fully completed questionnaires were obtained which gave a response rate of 54%. Among the respondents, 77% were male students and only 23% were female students. This suggested that the hospitality stream is preferred as a career option by male rather than female students. The demographic profile of the respondents is summarized in the ‗data analysis‘ section below. Data Analysis A quantitative approach was adopted for the study to test the motivational factors of students affecting the selection of Hotel/ Hospitality Management as the career option in their undergraduate level. Table 1: Distribution of the respondents (Total respondents 106) Gender of the Male 82 (77%) Student Female 24 (23%) Who influenced to Own Choice 90 (85%) select the Program? Parents/ relatives 11 (10%) Career counsellors 2 (2%) Others 3 (3%) Knowledge about Little 28 (26%) the industry Moderate 72 (68%) Large 6 (6%) Expectation from Yes 33 (31%) family No 73(69%) Hailing from a Yes 27(26%) hoteliers‘ family No 79(74%) Easy admission Yes 12 (11%) criteria No 94 (89%)
On a question as to who influenced them to choose the program, 85% of them said that opting for this program was their ―Own Choice‖ and only 15% said that ―Parents/ relatives‖, ―Career Counsellors‖ and ―Others‖ had an influence on their decision. This is reiterated by the fact that 74% of the students had ―Moderate‖ to ―Large‖ extent on the knowledge about the hospitality industry. Only 31% of the respondents said that the expectation of their family members were one of the reasons for them to choose hospitality stream. Similarly a meagre 11% said that an easy admission criterion was the reason for them to choose this stream. Going through these figures, we can say that majority of the students had consciously chosen hospitality stream as their prime career option. On questions pertaining to the reasons why they had chosen the hospitality stream as their field, (Table 2)―Practical oriented than theory oriented‖ had the maximum arithmetic mean of 4.43, followed by ―Growth in this industry is encouraging‖ with 4.42, ―Industrial Training is interesting‖ with 4.31 as their mean. ―Easier to get good grades‖ had the lowest mean of 3.53 which stressed the fact that hospitality stream was chosen as a career option and not because it was relatively simpler as compared to Engineering or Medicine. Scale reliability analysis was done to measure the existence of internal consistency of the scale employed. Cronbach‘s Alpha computed to 0.897, which indicates a high level of internal consistency for the scale used in this survey. An examination of the correlation ..... 70
Special Issue: Hotel Operations Management – Issues and Challenges
Vol. 5, January 2013
matrix indicated that a considerable number of correlations exceeded 0.3 and hence the matrix was found to be suitable for factoring. Table 2: Motivational factors for studying Hospitality Program Factor Communality Mean Standard loading N= 106 deviation Factor 1:Self Development (Eigen value= 7.104, variance= 16.02%, Reliability Coefficient= 0.829) Q12. Growth is encouraging 0.813 0.705 4.42 .79 Q13. Employment percentage is high 0.786 0.690 4.10 .83 Q9. Helps to develop my full potential 0.647 0.634 4.30 .83 Q17. Personal growth opportunities are high 0.639 0.581 4.19 .83 Q8. Helps me to meet my personal goals 0.465 0.525 4.15 .80 Factor 2:Field attractiveness, (Eigen value= 1.574, variance= 14.20%, Reliability Coefficient= 0.806) Q5. Monitory rewards are attractive 0.722 0.585 3.62 .99 Q6. Opportunities to travel abroad 0.676 0.555 4.18 .88 Q7. My aptitude and skills match 0.614 0.513 4.08 .77 Q11. Jobs are attractive 0.601 0.703 3.97 .97 Q2. Like the glamour 0.517 0.454 4.03 1.06 Q16. Will provide right kind of lifestyle 0.510 0.513 4.00 .88 Q14. Variety of job opportunities 0.441 0.456 4.21 .77 Factor 3:Self Perception, (Eigen value= 1.427, variance= 12.71%, Reliability Coefficient= 0.783) Q3. Like to serve people 0.769 0.661 4.11 .93 Q1. Passionate about this industry 0.706 0.657 4.24 .89 Q4. Wanted to work in this industry 0.650 0.598 3.75 1.18 Q21. Industrial training is interesting 0.602 0.679 4.31 .91 Factor 4:Ease of Study, (Eigen value= 1.344, variance= 9.65%, Reliability Coefficient= 0.652) Q19. Easier to get good grades 0.810 0.728 3.53 1.0 Q20. Hospitality subjects are easy to understand 0.796 0.710 3.75 1.00 Q15. Practical oriented than theory oriented 0.499 0.429 4.43 .77 Factor 5:Pedagogic Achievement, (Eigen value= 1.180, variance= 7.55%, Reliability Coefficient= 0.494) Q18. Opportunities to become an entrepreneur 0.767 0.685 4.10 .93 Q10. Like to go for higher studies 0.713 0.567 3.92 1.03 Variables
Principle Component factor analysis followed by VARIMAX rotation was employed to analyse the 21variables pertaining to the motivational factors. Variables based on Eigen values greater than 1 and factor loading greater than 0.4 were used for analysis. Results, as shown in Table 2suggested that 5 factors with 21 variables were abstracted for interpretation of the scale. They explained 60% of the overall variance with Kaiser- Meyer- Olkin (KMO) measure of sampling adequacy of 0.819, which was higher than the recommended index of 0.60 and the Bartlett‘s Test of Sphericity was 874.139 (p < 0.05). Also the anti-image correlation matrix revealed that all our measures of sampling adequacy were well above the acceptable level of 0.50. Factor loadings were used to assign a name to each factor.Table2 shows that Factor 1 comprised of 5 items relating to ―Self Development‖. ―Growth is encouraging‖ and ―Employment percentage is high‖ were examples of higher factor loadings for this factor. Factor 2 comprised of 7 items relating to ―Field Attractiveness‖. ―Monitory rewards are high‖ had the highest factor loading in this factor. Factor 3 comprised of 4 items relating to ―Self Perception‖. ―I like to serve people‖, ―I am Passionate about this industry‖ had higher factor loading here. Factor 4 ―Ease of Study‖ had 3 items and ―Easier to get good grades‖ and ―Hospitality subjects are easy to understand and study‖ had higher factor loadings. Factor 5 ―Pedagogic Achievement‖ had only 2 items, ―Opportunities to become an entrepreneur‖ and ―Like to go for higher studies‖ and both had factor loadings more than 0.7. Table 3: Comparison of motivation of female and male students Male (N = 82 Female (N= 24 t value students) mean value students) mean value Factor 1: Self Development 4.30 3.98 2.245 Factor 2: Field Attractiveness 4.11 3.67 3.211 Factor 3: Self Perception 4.16 3.89 1.592 Factor 4: Ease of study 3.93 3.83 .560 Factor 5: Pedagogic Achievement 4.08 3.79 1.565 Note: *p value < 0.05 Motivational Factors
P value .027* .002* .114 .577 .121
71
Indian Journal of Applied Hospitality and Tourism Research
Further an independent sample t- test (table3) was conducted to find whether there was any significant difference among male and female students with regard to the motivations to choose the hospitality program. Arithmetic mean of the items within the 5 factors was taken for this study. The test revealed that there was a significant difference between female and male students with respect to the two factors viz. ―Self Development‖ (p = .027) and ―Field Attractiveness‖ (p = .002) at 5% level of significance. Whereas the test result showed no significant difference with respect to gender for the other three factors viz. ―Self-perception‖, ―Ease of Study‖ and ―Pedagogic Achievement‖. Table 4: Motivations for studying Hospitality Program Mean Mean(Male) Mean(female) (N= 106) (N= 82 ) (N= 24 ) Q1. Passionate about this industry 4.24 4.34 3.88 Q2. Like the glamour 4.03 4.13 3.67 Q3. Like to serve people 4.11 4.15 4.00 Q4. Wanted to work in this industry 3.75 3.82 3.50 Q5. Monitory rewards are attractive 3.62 3.73 3.25 Q6. Opportunities to travel abroad 4.18 4.30 3.75 Q7. My aptitude & skills match 4.08 4.18 3.71 Q8. Helps me to meet my personal goals 4.15 4.22 3.92 Q9. Helps to develop my full potential 4.30 4.38 4.04 Q10. Like to go for higher studies 3.92 3.98 3.75 Q12. Growth is encouraging 4.42 4.45 4.29 Q13. Employment percentage is high 4.10 4.18 3.83 Q14. Variety of job opportunities 4.21 4.29 3.92 Q15.Practical oriented than theory oriented 4.43 4.45 4.38 Q11. Jobs are attractive 3.97 4.04 3.75 Q16. Will provide right kind of lifestyle 4.00 4.10 3.67 Q17. Personal growth opportunities are high 4.19 4.29 3.83 Q18. Opportunities to become entrepreneur 4.10 4.18 3.83 Q19. Easier to get good grades 3.53 3.57 3.38 Q20.Hospitality subjects are easy to 3.75 3.76 3.75 understand Q21. Industrial training is interesting 4.31 4.35 4.17 Note:* p value < 0.05 Motivation Items
tvalue 2.305 1.934 .677 1.160 2.132 2.799 2.757 1.640 1.764 .943 .868 1.841 2.155 .426 1.276 2.136 2.442 1.641 .855
P value .023* .056 .500 .249 .035* .006* .007* .104 .081 .348 .387 .068 .034* .671 .205 .035* .016* .104 .394
.026
.97
.886
.378
An independent sample t- test done on all the 21 items pertaining to motivation by the students, revealed that motivation items like ―Passionate about this industry‖, ―Monitory rewards are attractive‖, ―Opportunities to travel abroad‖, ―My aptitude & skills match‖, ―Variety of job opportunities‖, ―Will provide right kind of lifestyle‖, ―Personal growth opportunities are high‖ were not perceived by male and female students equally. For the above items, the p value was significant at 5% level of significance as shown in table 4. The limitation of the study was the inability to approach more samples. Moreover, female students approached were approximately only a fourth of the male students which might have affected the values obtained in the study. It might also be due to the fact that hospitality industry was seen as a career option by male rather than females. Due to constraints of time, only the college under Manipal University was taken as the frame of this study. It offers 4 years Bachelor of Hotel Management degree and is the pioneer to have started Bachelor‘s degree in Hotel Management in India. It is recognised consistently as one of the leading hotel management institutes in the region. Hence the result of this study could be considered as a representative figure for the rest of the colleges offering such programs in India.
Suggestions and Conclusion The students perceived that hotel/ hospitality management course is more practical oriented than theory oriented and had the highest mean of 4.43 on a 5 point scale. The colleges should ensure that a lot of stress is given to practical subjects in the curriculum so that they are employable at the end of the course. Many entrepreneurial activities which bring out managerial abilities of the students like conducting food festivals, starting an Entrepreneur Development Cell in the college, making Out-door catering a part of the curriculum etc. should be incorporated into the system. Similarly, the motivation items ―Helps to develop my full potential‖, ―Personal growth opportunities are high‖ also had a high mean value. The academic fraternity should think of introducing specialisation in different areas of the hospitality stream, so that students can opt for the area of their choice viz. F&B Production, F&B Service etc. By this they would be better equipped and it would be easier for them to ..... 72
Special Issue: Hotel Operations Management – Issues and Challenges
Vol. 5, January 2013
realise their ambition. The hotels can in turn think of reducing the duration of the training once the student is absorbed into the organisation. The study revealed that students have a rosy picture of Industrial Training/ Internship as most of them have said that they find ―Industrial Training interesting‖ from whatever information they have gathered. It is seen that the mean for this is as high as 4.32. Hotel Concerns should try not to treat the students as cheap labour and treat them with dignity. Many a times it is found that, after the completion of Industrial training/ internship, the students decide not to enter the hotel industry due to the experience they have had, and in turn settle for other avenues. From the independent sample t – test it was found that there exists a significant difference (p< 0.05) among male and female students in the first two factors which pertains to Self Development and Field Attractiveness. This suggests that though an equal opportunity is provided to both male and female employees in the industry, the students do not perceive so. Employers/ Hospitality providers should try to bridge this gap and make the attributes under these two factors equally popular. A first step towards this could be during the 6 months internship program that the students undergo. Test conducted on all the 21 items revealed that on 7 of the motivational items there was significant difference (p < 0.05) in the perception as far as male and female students are concerned. Though the students have mentioned that they have chosen this field out of their choice, hotel industry personnel should try as much as possible to erase the wrong notion from their minds that they would not be treated equal. All possible efforts should be taken to make this industry popular among female students also. Moreover, from the study it is obvious that hospitality stream is popular among male students than female students as only a 24% of the respondents were females. Hence there is a need for the hospitality industry to be projected as a women friendly one and the society/ parents also should come out of the mind- set that this industry is not suitable for the fairer sex. The colleges, on the other hand, can think of awarding scholarships to meritorious female students to attract them into the stream. Through this study an attempt was made to provide some feasible solutions to bridge the gap between students‘ perceptions and what they are actually offered by the educational institutions. As a further research, the study could be taken up for colleges under other state run universities to see whether such significant difference really exists and also the reason for students to choose a particular college offering these programs. References AICTE Approval Process Handbook 2013 – 2014, accessed from www.aicte-india.org Aspiring minds: employability quantified (2012). Accessed from www.aspiringminds.in Bushell, R. et al. (2001). Tourism research in Australia. Journal of Travel Research, 39(3), 323-326. Chen, W. (2009). Hospitality and Tourism Management Education: An analysis of Chinese undergraduate students‘ motives and institution choice criteria.Accessed from www.grad.au.edu/downloads/.../schedule%20defense%202-08.pdf. Express Hotelier &Caterer, (2005). Status of Management Education in India: A study conducted by FHRAI: Accessed from http://www.expresshospitality.com/20050905/spotlight01.shtml ICRA (2012). www.icra.in
ICRA quarterly review, march 2012 (An Associate of Moody's Investors Service). Accessed from
IITTM – ICC Report (2011). Travel and Tourism http://www.iittm.org/doc/IITTM_ITC_Report-2011-rev..pdf
Industry
in
India:
Looking
East.
Accessed
from
Jauhari, V. (2006). Competencies for a career in the hospitality industry: an Indian Perspective. International Journal of Contemporary Hospitality Management, 18(2), 123-134. Kim, S., et al. (2007). The study motivations and study preferences of student groups from Asian nations majoring in Hospitality and Tourism management programs, Journal of Tourism Management, 28(2), 140-151. Lewis, A. (2005). Rationalizing a Tourism Curriculum for Sustainable Tourism Development in Small Island States: A Stakeholder Perspective. Journal of Hospitality, Leisure, Sport and Tourism Education, 4(2), 4-15. Lee, M., et al. (2008). Perceptions of hospitality and tourism students towards study motivations and preferences: a study of Hong Kong students. Journal of Hospitality, Leisure, sport & Tourism Education, 7 (2), 45-58. Lee, M. ( 2010 ). Why Students Choose a Hospitality and Tourism Program: A Pilot Study of U.S. Undergraduate Students. Journal of Hospitality and Tourism Research, 22(3), 20-26. O‘Mahony, G., et al. (2001). Why Students Choose to Enrol in a Hospitality Degree Course: AnAustralian Case Study. Cornell Hotel& Restaurant Administration Quarterly, 42(92), 92-96. Schmidt, R. (2002). A student‘s initial perception of value when selecting a college: An application of value added. Quality Assurance in Education, 10(1), 37-39.
73