Dec 11, 1996 - at x = .262, where the potential vorticity gradient, ^, is nearly zero. Thus the asymmetry of the Munk boundary layer appears to play a role in the ...
MIT/WHOI 97-10
Massachusetts Institute of Technology Woods Hole Oceanographic Institution
>**Vkfav + rtV»
(2.28a)
4(^ v) = i>SkV + ytkip
(2.28b)
and the square of the geometric mean of a variable is l1>l2k+k = Mk+i40
(2.28c)
The potential enstrophy of the continuous system is defined, £ = hq2, and the following equation can be derived from the discretization 2.25a-2.25c with AH = w* = 0,
d dt
(q2ry) + Sx (lq \l TTy) + 8y (lq fy V*") = 0.
(2.29)
Thus an approximate form of the potential enstrophy is conserved. Details of the numerical model time-stepping and grid-stretching can be found in Appendix A.
2.5.2
Numerical Boundary Condition
The boundary conditions for the continuous system consist of no normal flow through the solid boundaries, and no slip or free slip at the basin walls. However, the discretization, Equations 2.25a - 2.25c, requires the specification of the potential vorticity at all grid points on the boundary as well as-within the domain, and therefore an additional boundary condition is required to step forward the model. Although the no flow, no/free slip conditions determine the absolute vorticity on the boundary, they do not determine the layer height. This must be determined separately, but it is desired to be consistent with the continuous system. Consider the zonal momentum equation, Du
,
,dh
„o
where -^ represents the material derivative. Setting u = 0 as is true at meridional boundaries and rearranging terms leaves dh
1 /
A
d2u\
,
,
The meridional velocity is determined by the no/free slip condition, but the curvature of the zonal velocity is not. I choose the simplest, though somewhat arbitrary, boundary condition that sets the gradient of the curvature to zero, namely
d3 dx3 41
0
(2.32)
at the meridional boundaries, and similarly in v at the zonal boundaries. A second boundary condition that may be viable would be to step forward the height equation at the boundary, Dh — + hV • u = -WW
(2.33)
Although I have not implemented this form for the boundary condition, I can assess one measure of consistency between the chosen condition with the one that is exactly consistent with the continuous system. If the two conditions were inconsistent, then the model would not conserve mass. This represents an integrated, rather than local check, but I have compared mass starting an integration and mass after 3000 time units, and found the two to match exactly.
2.5.3
Parallel Programming
Although the model is general and has run on various serial platforms, it has been optimized for use on a massively parallel computer, the Thinking Machine CM-5, that runs at MIT as part of an ARPA supercomputer initiative, project SCOUT (contract #MDA972-92-J-1032).
This particular machine has 128 nodes, each with a single
SPARC microprocessor, 4 specialized vector units and 32 MB of memory. The routine has also run on a 32 node machine at NCAR. Massively Parallel computers such as the CM-5 consist of several processing units with distributed memory. The whole system is interconnected by a high-speed communications network. Each processing unit can operate independently, but total processing power does not increase linearly with the number of processing elements. The speed of operations depends on the efficiency with which information is supplied to each processor. As a result, different types of communications are divided by efficiency into a hierarchy operations with varying desirability. Even with a high-speed network, passing information between distant nodes is considerably slower than accessing nearest neighbor information, which in turn is slower than reading local memory units. 42
Thus the optimization of the CMS consists of coding the routine such that it minimizes all inter-processor communications. The shallow water model is well-suited to parallel computation because it is inherently local. Each processor represents a grid element, and the time stepping of each variable depends only on local information or local derivatives which are nearest neighbor operations. Some effort is required to insure that the layout of the many variables are aligned properly so that local information is indeed stored locally. When the number of grid elements exceeds the number of processing units, the CM5 compiler creates virtual units that automatically optimize local information transfers.
43
44
Chapter 3 Linear to Nonlinear Cross-equatorial Flow 3.1
Introduction
The numerical experiments comprising this study and using different model parameters are summarized in Table 3.1. The experiments primarily consider upwelling to be uniform following Equation 2.14 with a few runs devoted to the case with upwelling localized at high latitudes as in Equation 2.15. The linear run is checked against the analytic solution, and then comparisons are made with more strongly forced experiments. Higher Reynolds numbers are achieved both by increasing the forcing and keeping dissipation constant and by maintaining forcing and reducing the frictional boundary layer width. An upper limit on the forcing is that which produces horizontal velocities approaching the gravity wave speed. Model runs in which this bound is exceeded fail when the variable h vanishes in the vicinity of the equator where the rotational constraint is weak, and thickness advection can be large due to nonlinear steepening. Some comparison is made between the runs using higher forcing values and those using weaker dissipation.
45
Run Ul U2 U2.A U3 U4 U5.X U5.Y U6 U7 U8 U9 UFS N2 UBar
So .01 .04 .032 .1 .01 .3 .3 .2 .2 .1 .05 .2 .1
io-4
AH .001 .001 .001 .001 .0002 .001 .001 .0005 .00029 .0002 .00005 .0005 .00067 IO"6
H0 f>M 2 0.1 2 0.1 1 0.1 2 0.1 1 0.058 2 0.1 2 0.1 2 0.079 2 0.065 1 0.05 1 0.037 1 0.1 1 0.087 1 0.01
Si 0.022 0.045 0.056 0.07 0.032 0.12 0.12 0.1 0.1 0.1 0.07 0.1 0.07 0.014
Re1 0.011 0.089 0.18 0.35 0.16 1.84 1.84 2.0 3.5 5.0 7.07 1.0 0.52 2.82
Re2 5 20 32 50 50 150 150 200 350 500 1000 200 75 100
Comments
Lx = 15 Ly = 30
Sxmin = 0.0054 Free Slip
Table 3.1: Table of numerical runs for uniform upwelling configuration. All experiments use no slip boundaries except for that noted. Ho refers to the initial undisturbed depth of the layer.
3.2
Spin-up of the Equatorial Ocean
Before examining the steady-state solution it is useful to consider the spin-up of the system from a state of rest. The evolution of the flow in this type of equatorial ocean has been well-documented by Kawase (1987).
That work used linear momentum
dissipation rather than the Laplacian form used here, but this difference is minor in the limit of weak flows. Linear wave dynamics describe this evolution well. Illustrated in Figure 3.1 is a series of instantaneous portraits of the height and velocity fields at three times after t = 0, when the forcing is initiated.
The run
is frictional and forced weakly, with S0 = 0.01, AH = 10~3, and H = 1.
Fluid
entering into the source region in the north-west corner of the basin forms a small mound which begins geostrophic adjustment within a rotation period. An anti-cyclonic gyre surrounding the source forms along with a Kelvin wave that travels southward along the western boundary.
In its wake follows the fluid entering at the source.
Upon reaching the equator, this wave couples into an eastward propagating equatorial 46
Kelvin wave. Although the mass source is located in the northern hemisphere, the development of the wave field is nearly symmetric about the equator soon after the signal reaches the equator. At the eastern boundary, the disturbance splits into two oppositely directed Kelvin waves travelling along that boundary. Finally, anomalies at the eastern boundary accompanying the passage of each Kelvin wave excite Rossby waves which transmit this information westward across the interior. By establishing a steady resupply of fluid from the western boundary current, the passage of the Rossby wave train arrests the continued drainage of the interior that results from the upwelling in that region. Although a spectrum of Rossby waves is generated by the Kelvin wave at the eastern boundary, in practice it is soon after the passage of the fastest mode that the interior reaches an approximately steady state. At the western boundary, a steady current forms, consistent with the frictional parameterization. In the present study, there forms a southward flowing Munk boundary current with a weak off-boundary counterflow. The final state of the system includes an interior flow that is consistent with the linear theory of Stommel and Arons (1960a). With uniform upwelling, the interior flow is weakly poleward and eastward. There is no equatorial signal. Fluid entering the source-region merely follows the western boundary to the latitude where it breaks from the coast and migrates slowly into the interior, ultimately to be upwelled out of the basin. In the separate case of a localized, southern hemisphere sink, there is no interior flow in the final state. Two intense high-latitude gyres remain, one anti-cyclonic for inflow, and one cyclonic for outflow, connected by the boundary current. The development of this flow occurs in two phases, the initial Kelvin wave propagation around the basin boundary, and the subsequent Rossby waves which return information across the interior.
The group velocities for these waves indicate the
time-scale for spin-up.
47
Figure 3.1: Time sequence of height contours and velocities for a case of linear spinup. The mean height is 1, with contours every 0.002. The initial spinup is marked by the passage of a Kelvin wave along the western boundary, the equator, and the eastern boundary. The Kelvin waves, which move at the gravity wave group speed of
4 = vS^ff,
(3.1)
travel about the basin a distance L = Ly + Lx. Thus the time scale for the boundaryfield is -.A"
(3.2a) = 30
(3.2b)
for the standard run of this study. Figure 3.1c shows a snapshot at this time for a weakly forced run. The Rossby wave time scale is estimated from the dispersion relation U) =
ßk
k2 + P + § 48
(3-3)
The fastest westward-propagating mode is that for which horizontal wavenumbers, k and /, are zero (i.e., long waves). In this case, the group velocity is given by
cf = -%■
(3.4a)
2
c
= -1 y2
(3.4b)
in the scaling of this model. The time scale for Rossby waves, which is strongly latitude dependent, is considerably longer than for Kelvin waves. With a maximum latitude of 10 deformation radii, the time scale for adjustment of the interior is approximately TR
=
%
(3.5a)
°9
=
1000
Thus the time-scale for Rossby wave propagation is significantly longer than that for the Kelvin waves and determines the required time for the linear system to reach steady-state. One measure of the degree to which the system has reached equilibrium is to compare height fields. Figure 3.2 shows the difference in height field between times 1000 and 1200 for the linear run, Ul. In this case the weak upwelling over the interior is tu* = 5 x 10~5. Thus w*At — 10-2. The variation in height fields, with a magnitude of 10-6, has some structure associated with the slow high latitude Rossby waves and very weak equatorial waves, but the system is very near to a steady state. The spin-up of a strongly forced run is not considerably different from the case described above. A series of plots presented in Figure 3.3 show the sequence. The initial descent of the Kelvin wave along the western boundary is similar, and it couples into an equatorial mode, just as in the linear case. However, the group velocity comprises both the gravity wave speed and current advection (Philander (1990)). Furthermore, the coupling is somewhat more complicated. There exists an inertial overshoot of the Kelvin wave (Springer and Kawase (1993)), and associated with that cross-equatorial flow is an instability. As a result, a time dependent region in the vicinity of the western
49
>- o-
Figure 3.2: Difference in height of the linear model run Ul between time t = 1000 and t = 1200 (xlO ). Small structure at high latitudes shows that the system has not reached steady state, but is near.
50
boundary and equator remains behind, even after the Kelvin wave has passed. The subsequent behavior of the system is similar, with the time-scale to reach a now quasisteady state largely determined by that of the Rossby waves in the interior. Figure 3.4 shows the difference between mean height fields at time t = 1100 and t = 3000 for run U7. Fields are averaged over 100 time units to remove highest frequency fluctuations. In this case, w*At = 1, and the average height differences of the interior are a fraction of this amount. Only near the dynamically active western boundary does the height difference appear. In this region, low frequency fluctuations remain and intense features shift slightly in the domain over long time periods. In addition, this region is strongly dominated by advective processes which have a much shorter time-scale than the basin waves. As in the linear case the system has reached a quasi-steady state. All time-averaging in the measurements in this study begin at time t = 1000 except run U9 (which begins at t = 700) in which the zonal basin dimension is only 5 and therefore the spin-up is faster. A check of the sensitivity to this value for the very nonlinear run (U8) shows very minor quantitative differences in averaged quantities that begin at time t — 2000. The time dependence is transmitted throughout the interior, again via equatorial and boundary Kelvin waves, and Rossby waves, but the height variations are small compared to the larger anomaly of the initial pulse. That the effect of nonlinearity is not more strongly felt in the interior is a testament to the degree to which linear physics describe fields away from the western boundary current and the equator.
3.3
Linear Solution and Numerical Experiment
The linear solution, which can be determined from a combination of Stommel and Arons (1960a) theory with a Munk (1950) boundary layer, provides a useful baseline to compare the more complicated nonlinear flow. theories using the no slip boundary condition only.
51
This section reviews these two
t=20
8
*JI:
-
6
-
4
': "
[ i>
[ »«>. ji/\...
Z"Z "j —.„,
LiL
"JP::.
Pr^v T...:::::.:
::.:::::
•'
-4
-
-6
-
-8
-
Figure 3.3: Time sequence of height contours and velocities for a case of a nonlinear spinup. The undisturbed height is 1, with contours every 0.1. The same sequence as in the linear case is noted, with the addition of remaining variability at the intersection of the western boundary with the equator. The Reynolds number for this run is 1000.
52
7
8
9
10
Figure 3.4: Difference in 100 time unit averaged height fields of the nonlinear model run U7 between time t = 1100 and t = 3000 (xlO). Some structure remains at the western boundary where low frequency motions shift large features, but the system has reached a quasi-steady state.
53
Assuming weak, steady currents and small layer height variations the equatorial /3-plane shallow-water equations reduce to -ßyv = ßyu = Vu
=
-gl-^-
(3.5a)
-g^ + Au—
(3.5b)
-^,
(3.5c)
where h = H + t], and 77 demarcate tubes of constant vorticity flux. Regions of large gradients in \£ (i.e., with compressed contours) represent regions of intense vorticity transport, and conversely, weak gradients correspond to weak flux of J. In Figure 4.3, the strong equatorward flux of vorticity is visible near the western boundary. The trend of some vorticity streamlines turning toward the western bound-
78
\'
/ >
f
1 ^
A
A
1
1
y=y0
< /
x = x
-Ma?- , 80
(4.14c)
Now the total advective meridional vorticity flux across a line of latitude is iNorth
=
fxB ( dv\ Jo [y + fa)vdx
= yVNorth+
Jo
7;irdxZ ox
= yVNorth + ^(v2(xE)-v2(0))
(4.15a) (415b) (4.15c)
If the boundary conditions are no-slip, this reduces to the same vorticity flux as in the linear case. The net meridional vorticity flux is again given by the integrated velocity advecting planetary vorticity across the line of latitude. As in the purely linear case, the equator is a boundary across which no vorticity can be advected. However, one feature distinguishes this weakly nonlinear case from the purely linear one. When the dynamics are linear, there is zero meridional vorticity flux at all longitudes on the equator. With the addition of weak nonlinearity, Equation 4.14b, there can be cross-equatorial flux of J at all longitudes, but the net flux, when integrated across the domain, must be zero. Consider the net cross-equatorial flux of vorticity between any two longitudes, Xi and X2'iEtuator = v\x2,0) - v2(xu0).
(4.16)
Between any longitudes of identical meridional velocity, there is no net flux. Thus when the eastern and western boundaries are used, there is no integrated flux, and similar sub-domains lie between all locations of flow reversal. The streamfunction of J for a weakly nonlinear, but steady numerical experiment, run U2 is shown in Figure 4.4. In this example, the streamlines do cross the equator near the intense center of the western boundary current, but return both to the west and to the east northward such that the integrated flux is zero.
Fully Nonlinear Adding further complexity by allowing nonlinearity to enter the dynamics in the zonal momentum equation and through time dependence renders the problem analytically 81
Figure 4.4:
Streamfunction of J for run U2, Re = 20.
intractable. However, it is possible to rely on the numerical calculations in this limit. Using the full formulation for the J-vectors as in Equation 4.4a, the stream function for the high Reynolds number run U8 is shown in Figure 4.5 for the sub-domain of the system bounded by latitudes y = ±5 and longitudes, x = 0 and x = 2. The immediately striking result is that the streamfunction diagram appears remarkably similar to that in the weakly nonlinear run.
Although the system has
changed quite dramatically from the linear limit (compare again Figures 3.7 and 3.10), the dynamical picture given simply by the net vorticity flux streamfunction, \I>, is not dramatically different. Vorticity flux streamlines enter the sub-domain through the northern boundary. Some veer westward to the western boundary, and others diverge to the east and northward around the mean eddies that reside in these regions. Vorticity transported along these paths eventually work its way around to the weak interior flow and out of the domain across latitude y — 5 (not shown). Some streamlines again propagate across the equator, with one extenting quite far. However, the vorticity flux associated 82
Figure 4.5:
Streamfunction of J for run U8, Re = 500.
with this one stream tube is quite small, and even this returns northward to intersect the western boundary very near to the equator. Thus even in the highly nonlinear case examined, vorticity fluxes southward across the equator, but the integrated flux is quite small. A calculation of this integrated flux gives iEquator = 0.002, less than a percent of the meridional vorticity flux found at latitude y = 5. Although the linear and nonlinear runs appear very similar using this diagnostic, an important distinction exists and can be illustrated by decomposing J into its individual components as in Equation (4.5). Figure 4.6 shows the contributions to J by each of the three different components for this run as vector plots. Note that the vector plots are not to the same scale, but can be used to infer locations where different processes are active. The magnitudes of the different components are given on the axes. In Figure 4.6a, the mean advection of mean absolute vorticity shows a strong influx near the poleward boundary of the sub-domain. Figure 4.6c shows the flux due to friction. Over most of the domain, the mean frictional flux is zero. However, there is a region immediately adjacent to the western boundary where this flux is 83
a) Mean
0.5 1 1.5 x IJxlmax= 0.14
b) Eddy
OS 1 1.5 x Uxlmax= 0.094
c) Frictconal
0.5 1 1.5 x (Jxlmax= 0.069
Figure 4.6: J-vector components, Jmn, Jed, and Jfric, for run U8, Re = 500. Note that the quivers are not to same scale, but the maximum of each vector component are given on the axes. The extreme aspect ratio causes zonal arrows to have quite small heads (particularly noticeable in the frictional plot).
84
significant. It is difficult to see this in the figure due to the large aspect ratio of the plot which shrinks the heads of zonal arrows and its proximity to the western boundary. Careful examination reveals that particularly in the northern hemisphere, though also in the southern hemisphere, there is a strong westward flux of vorticity through the western boundary. These two components are qualitatively similar to those of the linear and weakly nonlinear dynamics (not shown). However, Figure 4.6b shows the contribution by the eddy field, obviously not present in the previous experiments since those integrations reached steady-state solutions. The eddy field produces a diverging vorticity flux north of the equator. Some vorticity is transferred eastward, where it merges again with the interior flow there. But a stronger component contributes to the equatorward and westward vorticity transport, fluxing vorticity from the central portion of the boundary current southward and westward, where it can be removed by friction. Since the quiver plots are not to the same scale and the aspect ratio of the axes is extreme, a better reflection of the relative strengths of the different components is given by the divergences of the individual components of J. Shown in Figure 4.7 is the divergence of the three vector fields shown in Figure 4.6 in a still narrower sub-domain near to the western boundary. A positive divergence is lightly shaded and negative values are darkened. The divergence of the different components shows the intensity of J-vector components in the vicinity of the equator and western boundary region. At the northern portion of the sub-domain, the convergence of mean J-flux is balanced by a frictional divergence, whereas near the equator, mean and frictional fields balance a large eddy-flux convergence. Slightly further from the boundary region is a strong eddy divergence, balanced only by the effect of the mean field. Although one effect of the eddy-field is illustrated by the J-vector diagram of the previous section, additional calculations further demonstrate its role by focussing on the contribution of the eddy-field to the net westward flux. Since excess vorticity entering the sub-domain through the northern zonal boundary must be exported out
85
a) Mean
b) Eddy
c) Frictional
■ 0.5
i^ .1 r^^äSS&Ss*
i^^slJiäw
C\l
1 o|
I°
X CO
X CO
E
E
üü
H
-1
-0-5
is]
1i
I mm
-4
-4 -1.5
0
0.5 x, min(divJ)= -1.3
1
0
0.5 x, min(divJ)= -2.3
1
0
0.5 1 x, min(divJ)=-0.067
Figure 4.7: The divergences of J-vector components, Jmn, Jed, and Jfric, for run U8, Re = 500. Shading is identical in all three plots and maxima are given on the axes. Pure white corresponds to values less than -1.5.
86
to the west, it is interesting to inquire which processes are important at which stages of this migration. Integral measurements are determined by decomposing Equation 4.6 into its four components: f
A
3 -n
=
Jr
fVn fx' / Jwestdy + / Jnorthdx Jy, Jx-u, \
Jeastdy - /
Jy, —
J,outhdx
(4.16b)
Jxw
Iwest + Inorth + hast + I south-
(4.16c)
where small letters donote boundaries of a variable subdomain as opposed to the full basin boundaries. Integral quantities are calculated along the boundaries xw = e, xe = 3, y, = —5, yn = 5, where e is a small distance from the western boundary1. The different components for run U8 gives (rounded to hundredths) Ptfc *nort
=
-0.40
Iviest
—
0.43
Isouth
=
-0.03
Last
=
0.00 .
Noting that these values sum to zero gives some measure of the consistency of the model in accurately carrying vorticity. As expected, the flux through the eastern and southern boundaries of the subdomain is small compared to the northern and western ones. If the subdomain is extended to the eastern boundary there is a slight increase in the frictional vorticity flux there but it is O(10-3), consistent with expectations of no eastern boundary current. It is also possible to decompose each geographic / component into its mean, eddy and frictional elements and observe the integrated vorticity budget in a sub-domain. Table 4.1 displays the different components for this run. As expected the flux through x
As discussed in Appendix A.4, J-vectors are calculated on /i-points of the model and are therefore staggered resting just off the boundary
87
Iw IN IE
Is Table 4.1:
•*tot
''mean
"eddy
" fric
.43 -.40 0 -.03
0 -.40 -.01 -.03
.01 0 .01 0
.42 0 0 0
Vorticity budget for the box [0 3 -5 5] for run U8.
the north is almost entirely due to the mean advection of mean absolute vorticity. And the flux at the western boundary is due almost entirely to friction. Although there appears a small eddy flux at the western boundary, this reflects the small distance, x = e, at which the measurement is made. At x = 0 the entire vorticity flux must result entirely from friction since the mean and eddy flux at a solid boundary is exactly zero. Though useful, this calculation only gives information for a single domain and is not globally illuminating. By scanning the western edge of this sub-domain from the western boundary eastward, it is possible to explore the different components as a function of longitude. A scan of the integrated westward flux, Iwest(x) for northern and southern hemispheres of this run is shown in Figure 4.8.
In solid is the total westward flux of
vorticity, dashed is that due to friction. The effect of the mean field is the dotted curve and the dot-dashed is the westward flux due to the eddies. The heavy solid line shows the residual of the sum of the different integrated components around the whole sub-domain, T. In both figures, this residual is quite close to zero for all longitudes, consistent with Equation 4.6. In both hemsipheres, there exists a very intense westward flux due to friction at the western boundary. However, the frictional boundary layer is narrow compared to the width of the boundary current itself (compare 8*M = 0.044 to 8i = 0.1) in this high Reynolds number run. With a large portion of the full boundary layer passing outside the region where friction can act, the system adjusts by creating an eddy field, to the east of the frictional boundary layer, to transport
88
vorticity from the interior of the boundary current to the frictional sublayer. This role is illustrated by the strong hump in the dot-dashed curve at x = 0.1. Interestingly, in the northern hemisphere where the vorticity constraint in the linear and weakly nonlinear systems is most compelling, the mean field acts in fact to advect vorticity away from the boundary. The eddy and frictional components must compensate not only for the narrowing of the frictional sublayer, but also for this competing effect of the mean field. In the southern hemisphere, the mean field flux has a different sign due to the change in the sign of the Coriolis parameter, but the effect of the eddy field is still quite apparent in the narrow region immediately adjacent to the frictional sublayer. To examine the role of the eddies in transporting vorticity meridionally, the integrated flux of vorticity between x = 0 and x = 3 as a function of latitude is shown in Figure 4.9. There is a large meridional vorticity flux at high latitudes due almost entirely to the mean field, but this flux decays steadily with latitude and is virtually zero at the equator. A small residual remains due to the eddy flux. This figure demonstrates that in the mean, zonally integrated sense, a system constrained to transport fluid across the equator successfully changes the sign of the vorticity of the fluid in the boundary current, even with a very small magnitude of dissipation. By the time the fluid reaches the equator, the large anomalous absolute vorticity of the boundary current is largely reduced to a small, equatorial value. The broader effect of varying the Reynolds number can be determined by examining the ratio of the peak of the dashed curve to the maximum of the integrated frictional flux in Figure 4.8. One difficulty in defining this index is that it depends on the choice of the maximum latitude, yn, for integration. The frictional flux extends all along the western boundary, whereas the maximum westward eddy flux is greatest within a few deformation radii of the equator (see, for example, the lightly shaded regions in Figure 4.7). Interestingly, the extent of the region of enhanced eddy flux is similar for a range of Reynolds numbers, and lies between the equator and a latitude between
89
a) Northern hemisphere (mean(..), eddy(-.), fric(—), total(-), residual(heavy-))
0
0.1
0.2
1.4
1.5
1.4
1.5
b) Southern hemisphere
Figure 4.8: Iwcst(x) for run U8, Re = 500. The dotted line is due to the mean flux, the dashed corresponds to friction, dot-dashed to eddy, and the solid is due to the sum of all components. The heavy solid line is the sum of net fluxes around a box bounded by the longitude x at the west, and the lines, xe — 2, yn = 5, and ys = —5.
90
(mean(..), eddy(-.), fric(—), total(-), residual(heavy-)) 0.6
i
0.5
-
0.4
-
'
)
'
1
1——i—
1
1
-
^ 0.3 X X> w
-
3 0.2 -
e
(0
0.1 0
-
-0.1 -02
•
1
>
-4
-3
-2
r
-1
0 y
,
,
1
2
3
4
5
Figure 4.9: — IN(X) for run U8, Re = 500. Lines are as in Figure 4.8. The large meridional flux of vorticity at latitude y = 5 decreases to nearly zero at y = 0. Note that the integral in this calculation extends across the basin.
y = 3 and y = 4 for this model configuration. For each Reynolds number, I estimate the maximum latitude for integration as that location where the integral of the westward eddy flux has reached 98% of its value at y = 5, which is assumed to be close to its maximum value, and define the index, E
\jed [ w
IfT
(4.14)
to represent an integrated and normalized measure of the strength of the eddy field in transporting vorticity to the boundary. This index is calculated from numerical experiments and plotted in Figure 4.10 as a function of Reynolds numbers. At low Re, the integrated eddy flux is quite small. The star corresponding to Re = 32 (run U2.A) has an index, E = 0.003, and indicates that the critical Reynolds number for instability to occur is slightly less than this value. As the Reynolds number increases, the integrated effect of the eddies increases also, showing the growing role of the eddies in transporting vorticity westward. Included in this plot are two runs at Re = 150 which examined variation in basin dimension. Results from both run U5.X (with (Lx,Ly = (15,20)) and run U5.Y (with (Lx,Ly) — (10,30)) show remarkably good agreement with one another and in the trend of this integral calculation. 91
1.2r
0.8-
UJ0.6
0.4
0.2
10'
10 Re
10J
Figure 4.10: Index E, defined by Equation 4.14, showing the ratio of maximum integrated westward eddy flux of vorticity to the integrated dissipative flux as a function of Reynolds number. Integration is extended from the equator to the latitude where the westward eddy flux reaches 98% of its maximum value. The circle corresponds to a run with non-uniform upwelling (UFS) Runs U2 A U4, U5.X, U5.Y, U6, U7, U8, U9, and N2 are included.
The figure suggests that the integrated eddy flux increases approximately exponentially from zero at a critical value of Rec ~ 30 to a value of more than 1 at Re = 500. This critical value is determined empirically, but is not drastically different from other calculations using, for example, a nonuniform upwelling distribution. The approximate exponential growth of the normalized flux is not predicted by a theory.
4.1.3
Balances from the Time-Mean Vorticity Equation
The vorticity balance of the linear system is obvious from the conditions of linearity. Specifically, planetary vorticity advection is balanced by vorticity diffusion. As the system becomes more nonlinear, the boundary layer structure is not obvious, but can be diagnosed from the model. This section examines the structure of the boundary layer as a function of latitude in the high Reynolds number runs.
92
The time-averaged vorticity equation (4.1) is written again, u - VC + v + (C + y) V • u = AHV2C
(4.15)
where the different terms correspond to relative vorticity advection (RVA), planetary vorticity advection (PVA), stretching (STR), and friction (FRIC). The eddy terms have not been separated from the different components of vorticity as the purpose of this section is to determine the time-mean structure of the western boundary current. The numerical diagnosis of these terms according to the discretization of the model is discussed in Appendix A.3. For very large Reynolds number, the inertial boundary layer scale, Si = yU, is larger than the Munk scale. In this case the system divides into multiple regions with different balances presiding. The different components of the time-averaged vorticity equation for a subdomain of run U7 near the western boundary are shaded and contoured in Figure 4.11. Frictional dissipation (Figure 4.lid) occurs entirely in the intense frictional boundary layer that resides immediately adjacent to the western boundary.
Its magnitude and, to some extent, zonal scale decrease with latitude.
The planetary vorticity advection ((Figure 4.11b) is proportional to v and therefore reveals the zonal width of the full boundary layer. The boundary current in this nonlinear run is relatively narrow in the northern portion of the sub-domain, but widens considerably near the equator. In addition, the magnitude of the planetary vorticity advection decreases substantially by this latitude. The relative vorticity advection ((Figure 4.11a) is characterized by an intense layer adjacent to the western boundary but with an oppositely signed, weaker contribution to its east. The effect of stretching is found in Figure 4.11c and is surprisingly small in all regions of this sub-domain. Of course, the contribution of stretching to the vorticity balance is significant in the interior (roughly 2 to 3 deformation radii from x = 0) and away from the equator, where stretching balances planetary vorticity advection. To better understand the balances from this plan view, the zonal profiles of the different components at 4 latitudes are shown in Figure 4.12. The upper panel shows 93
the different components at y = 5 and reveals a split of the boundary current into two dynamical regimes. The inner layer shows a three-way balance of friction (dotted), relative vorticity advection (solid), and planetary vorticity advection (dashed). There is also an outer layer that is primarily an inertial balance of RVA and PVA. As the latitude decreases, the inner layer narrows considerably, the outer layer widens, and the effect of planetary vorticity advection in the inner layer decreases. This balance remains valid far south of the equator as well. From the input parameters it is possible to estimate the expected scales of the boundary layers.
For run U7, the Munk scale is 8M = 0.0667, the inertial scale,
assuming a Stommel and Arons interior flow as in Equation 2.19, is 0.1. However the three-way balance of Figure 4.12a suggests a scaling of the system such that &i = f>M- Thus in this northern portion of the subdomain, there exists a slightly narrower inertial current than expected from Equation 2.19. Moving further south in the basin, the two-way balance of RVA and FRIC suggests an inertio-frictional balance in the inner layer: SM=\1^-5M.
(4.16)
Using 6*M = 0.03 taken approximately from the figure, Equation 4.16 suggests 8i ~ 0.3. This value compares sensibly with the scale of the outer boundary layer in Figures 4.12b, c, and d, using the zero crossing of the planetary advection (double-dashed) curve at x = 0.6 as a reference location. Again this balance differs from that suggested by linear theory. The vorticity balance suggests a widening of the inertial layer with decreasing latitude. As the parcels approach the equator, they are swept out into the interior by the eddy that resides there in the mean. The effect of this eddy is observed in the widening of the scale of the PVA term in Figure 4.12b, c, and d, and by the very rough scaling presented above.
94
a) Relative vorticity advection
b) Planetary vorticity advection
c) Vorticity stretching
d) Vorticity dissipation
>- 0
Figure 4.11: Plan view of the vorticity components in a subdomain for run U7 (Re = 350). Shades are every 0.1 with light values being positive, dark negative. In addition contours are placed at values of ±0.4 and ±0.2 to highlight the largest values.
95
Vorticity Components, RVA (-), PVA (—), STR (-.), FRC (:), RES (-)
~~i
r
i
r
-\
r
1 o 0.5
s. ° 2-0.5 -1 -1.5 0
_i
0.1
i_
0.2
0.3
0.4
0.5 x
0.6
-i
r
0.7 1
0.8
0.9
r
__ 1 to" oi 0.5
X-0.5 ^ -1 -1.5
-I
0
0.1
0.2
0.3
0.4
0.5
0.6
0.7
0.8
L.
0.9
1
Figure 4.12: Zonal profiles of the different components of the vorticity equation, shown in Figure 4.11 at 4 different latitudes, (a) y = 5, (b) 2.5, (c) 0, and (d) -2.5.
96
4.2
Localized Upwelling
A critical aspect of cross-equatorial flow is the determination of the actual crossequatorial mass-flux. In this work, it is specified through the upwelling distribution, w*. The results presented thus far concern a very specific system in which the upwelling distribution is constant, and therefore may be considered a potential weakness of this study. Indeed, although Stommel and Arons (1960a) considered a general form for the upwelling and directly examined both uniform and non-uniform distributions in their paper, the work is frequently referred to as pertaining to uniform upwelling only. In an effort to demonstrate that the results presented here are robust to different upwelling distributions, I conduct an additional experiment that considers the most diametrically opposed forcing, a localized w* (Equation 2.15). In this configuration, all the fluid entering in the northern hemisphere is destined to exit the basin through a sink entirely in the southern hemisphere. Thus all of the fluid entering the system is constrained to cross the equator. One limitation of this configuration is that the volume flux of fluid out of the sink must not be so large that the layer depth vanishes. Although this is not a problem at low Reynolds number, it can be significant as the volume of fluid transported through the system increases. As a result, the sink has a larger cross-sectional area than the source (10 x 10 versus 5 X 10 deformation radii), and w* is positive for all latitudes south of y = -5. A plot showing the upwelling distribution is presented in Figure 4.13. The system evolves much as the system with distributed upwelling. There is an initial creation of a mound of fluid in the forcing region with subsequent Kelvin and Rossby waves setting up the interior circulation. Unlike the previous runs, the interior circulation is now absent, but there remains after the spin-up a residual western boundary current that carries fluid from source region to sink. As in the uniform upwelling case, the system becomes unstable at higher Reynolds number, and eddies develop in the vicinity of the equator. In Figure 4.14 is shown the instantaneous velocity and height calculations from a Re = 75 run. The accompanying 97
Figure 4.13: The upwelling distribution in the basin for run N2. The source is located in the northern hemisphere and the sink in the southern, with zero vertical mass flux in between.
potential vorticity field is presented in Figure 4.15. Eddies form immediately north of the equator, propagate steadily to the south, and dissipate vorticity along their path. In the mean, the boundary current widens at the equator (Figure 4.16). As before, this feature is associated with a recirculation, though displaced somewhat south of its location in the uniform upwelling case. Again, this recirculation is not indicative of trapped fluid, but rather of a location of enhanced eddy activity. The vorticity flux streamfunction, *, defined by Equation 4.13 takes a similar form as in the uniform upwelling case (Figure 4.17). Consistent with the requirement that all of the fluid passing through the system must cross the equator and therefore change its vorticity, most of the vorticity entering the subdomain of the basin through the northern boundary exits through the west (a small portion is fluxed back to the north in the counter-current that resides just east of the western boundary current). Calculating the index E for this run (integrating only to y = 1.75 where the integrated eddy flux is nearly constant) gives a value of E = 0.33, which is slightly lower, but
98
>
> 0
Figure 4.16:
The time-mean velocity and height fields between t — 1000 and t — 3000 of run N2.
101
Figure 4.17: The vorticity flux streamfunction for run N2. Unlike the uniform upwelling runs, most of the vorticity entering the subdomain of the basin at y = 5 leaves through the western boundary.
reasonably consistent with the behavior in Figure 4.10 and shown as the circle in that plot. The details of the localized upwelling run are somewhat different from those of the previous runs. However, the basic mechanism is identical. The ratio of inertial to frictional boundary current increases with the Reynolds number.
At a critical
number, approximately Re = 30, the system goes unstable, and the eddies provide the mechanism for the necessary lateral flux of vorticity to enable the conversion necessary for cross-equatorial flow. The upwelling specifies the mass that must flux across the equator. This section shows that regardless of the distribution of upwelling, there exists a sufficient eddy flux to allow that transport.
102
4.3
Free-slip Boundary Conditions
Although float data in the equatorial Atlantic ocean indicate that the velocity parallel to the coast becomes small at the coast itself (Figure 1.3), I now consider the sensitivity of the results to this quantity by analyzing how the circulation changes with a different boundary condition. Specifically, I examine the the effect of a freeslip boundary. As can be expected from other studies (e.g., Marshall (1981) or the discussion in Ierley (1990)), this change alters the general circulation, the boundary layer structure, and the eddy fluxes from those using the no-slip condition. This section demonstrates that although some features do change with boundary conditions, the physical mechanism of eddy flux transport remains essential to the dynamics of nonlinear cross-equatorial flow. Before considering the fully nonlinear case, it is instructive to revisit the steady, weakly nonlinear discussion of Section 4.1.2. The fundamental dynamical change to the system due to the new boundary condition is apparent in the integrated meridional vorticity flux (Equation 4.15c). With free-slip boundary conditions, the constraint that v2(x) vanish at the western boundary no longer applies, and the net meridional vorticity flux can be considerable, even at the equator. In turn, the relaxation of this constraint allows the system a greater meridional span over which to remove vorticity from the basin, and therefore the local westward vorticity flux is reduced from the no-slip system. Consider the Re = 200 run UFS whose upwelling is uniform, but the free slip condition is applied. Mean velocity and height fields are shown in Figure 4.18. The mid-latitude interior presents the familiar Stommel and Arons (1960a) eastward and poleward flow. Near the western boundary rests an intense southward flow on and immediately adjacent to the boundary, with an intense counterflow just to its east. The mean recirculation that had been present in the vicinity of the equator in the no-slip runs now rests quite far south in the southern hemisphere and is considerably elongated meridionally, compressed zonally. 103
>>
0
Figure 4.18: (fie = 200).
The time-averaged velocity field and height contours for the free-slip run UFS
104
Figure 4.19:
The vorticity flux streamfunction for a sub-domain of run UFS.
The vorticity flux streamfunction, $, shows a large southward vorticity flux at the northern end of the subdomain, as before (Figure 4.19). However, now the streamlines pass smoothly across y = 0, eventually turning westward out of the basin, but extending south beyond the equator several deformation radii. Two integrated flux measurements are presented in Figure 4.20. In the upper panel is the net meridional vorticity flux, considerable at the northern edge of the domain and decreasing with latitude. This quantity vanishes at y — —6. In the lower panel is the net westward flux between y = — 6 and y — 5. Near to the boundary the total westward flux is primarily due to friction. To be sure, there is a small contribution to the westward flux in a turbulent boundary layer, visible by the small hump in the dot-dashed curve near x = 0.1. This flux is strongest between latitudes y = — 4 and y = — 7, far south of the equator. Relaxing the constraint of no cross-equatorial meridional flux allows friction to dominate the boundary layer physics except in the vicinity of y = — 6 where the zonally integrated vorticity flux is zero. The significant role that friction plays in the boundary layer dynamics is also found 105
a) Westward flux (mean(..), eddy(-.), fric(—), total(-), residual(heavy-))
-0.4l
0
0.1
0.2
0.4
0.6
0.8
1.2
1.4
1.5
b) Southward flux
Figure 4.20: The integrated westward and northward vorticity fluxes for run UFS. The dashed curve corresponds to the frictional flux, the dotted to mean advection, the dot-dashed to the eddy flux, and the light solid curve is their sum. a) The integral extends from y = -6 to y = 5, and the heavy solid curve is the sum of net fluxes through a sub-domain bounded by these latitudes, the longitude in the figure, and x = 2. b) The integral extends zonally across the basin, and the sub-domain extends meridionally from the latitude in the figure to y = 5.
106
in the boundary layer structure. Shown in Figure 4.21 are the different components of the vorticity equation near the western boundary at 4 latitudes. In the northern portion of the basin at y = 5, the boundary layer consists of two layers, an inner viscous sublayer of the inertio-frictional scale {8*M = 0.06) and an outer inertial layer. The meridional flow decays eastward from the western boundary and changes sign near x — 0.35. Near the equator, the full boundary layer width has decreased and the meridional velocity changes sign near x = 0.2, and the inner inertial layer has been subsumed into a wider frictional layer. This frictional balance extends south of the equator, and is shown for example at y = —2.5. Far south of the equator at y = —6, the boundary layer remains narrow, but the balance is more of a three term balance, both in the inner and outer portions of the southward flowing current. It is at this latitude that the structure of the boundary current most resembles the near equatorial balances of the no-slip case. Although the transfer of vorticity to the boundary is largely achieved by the frictional boundary layer, eddies do become significant far south of the equator, and also in the interior. This interior process is represented in the strong peaks of integrated eddy flux in Figure 4.20b, eastward at x = 0.35 and westward at x = 0.9. Both functions of the eddy field are further highlighted in Figure 4.22 which shows the components of the J-vectors due to the eddy field. Immediately adjacent to the boundary, the eddy field flux is negligible, except in a small region near the southern portion of the domain. Furthermore, the interior flux is easily visible in the strong convergence of vorticity near x = 0.6. This convergence demarcates the eddy flux transfering vorticity to the northward-flowing counter-current from the western boundary current. Both the boundary current and the counter-current cross contours of mean potential vorticity. Associated with this crossing is a necessary vorticity flux divergence, predominantly due to the eddy field. Thus as in the no-slip case, eddies move vorticity to the boundary (in a small region in the southern hemisphere), and they are also responsible for the interior transfer from meridional flow to meridional flow and drive
107
Vorticity Components, RVA (-), PVA (—), STR (-.), FRC (:), RES (-) ~i
r
"i
I
r
,
1
0.7
0.8
r
_ 0.5 to ii
To
0
ST 0.5
-2S-0.5 -i
-1 0
0.1
i_
0.2
1
-i
0.3 T
0.4
0.5 x
i_
0.6
0.9
1
r
i
II
« ° S
-0.5 0
0.1
0.2
0.3
-I
L
0.4
0.5
-1
1
1
0.6
0.7
0.8
l_
0.9
Figure 4.21: Different components of the vorticity equation at 4 latitudes in run UFS- fa) v = 5 (b) y = 0, (c) y = -2.5, and (d) y = -6. ' V ' '
108
II i^—
"'««
Figure 4.22:
Eddy flux vectors for run UFS.
the recirculation. It is clear from observations such as Figure 1.3 that the free slip boundary condition does not reflect nature; however, setting v = 0 exactly on the boundary may also be inadequate, given the coarse resolution of even this model. It is important to draw from the above example the fact that although some features of the circulation have changed, fundamental aspects are similar. No longer constrained to flux vorticity out of the basin prior to reaching the equator, the system can maintain a frictional boundary layer over a meridionally extended portion of the basin, without invoking the eddy field. However, ultimately, the system confronts a similar constraint as in the no-slip case. At some latitude, the advective vorticity flux of the steady system must vanish. This special latitude is given by y
Jo
1 2 « dx = ^ (0)
which must be internally determined by the system.
(4.17) In the above example, this
equality is satisfied at approximately y = —5.1. It is this constraint which the steady 109
system (factional by definition) can not accomodate, and therefore requires the eddy field in this region to aid in the vorticity transfer. The boundary condition simply determines that latitude where the net meridional flux of vorticity must approximately vanish. For no-slip, it resides at the equator. For free-slip and strongly forced, it can be some distance south. Naturally, an intermediate boundary condition will produce an intermediate critical latitude, and the growth of an eddy flux at that location.
4.4
Barotropic Limit
One surprising result above is that the stretching term in the mean vorticity equation of Section 4.1.3 appears inconsequential in the dynamical balance of the western boundary current (refer again to Figure 4.12). The stretching term is an essential element of the shallow-water system, the critical feature that distinguishes it from purely barotropic models of the ocean. It is also the stretching that distinguishes the equator in the shallow-water model from all other latitudes. This fact can be seen from the inviscid quasi-geostrophic vorticity equation in which the stretching term is absent. (t + u-V( + v = 0.
(4.18)
Without / in the governing equation, the QG system considers only variations in /, not its absolute value. Returning to the vorticity calculations, the stretching term appears to be unimportant, but can not be neglected or the dynamics would behave quite differently. A demonstration of this fact is found by examining the barotropic limit of the model, in which the boundary layer is small compared to the deformation radius. Figure 4.23 shows the instantaneous height and velocity field for model run UBar (Re = 100) at t = 500(ßLD)-1. Note that a quasi-steady state is achieved more quickly in this run because of the fast barotropic Rossby waves that return westward across the basin. The figure is dominated by long basin modes propagating westward
110
in both hemispheres. However, in the vicinity of the western boundary current are again eddy features.
However, unlike the baroclinic case, the variability develops
immediately south of the forcing region, and extends steadily along the boundary at least beyond y — —0.2. Thus when the boundary current is small compared to the deformation radius, the system is basically barotropic, and the model can not distinguish any unique equatorial physics. In the more baroclinic runs described earlier in the chapter, the equator clearly does play a role.
Surprisingly, from the time-mean calculations, thickness
advection appears to be small in the mean vorticity balance of the western boundary current. Of course, stretching is important to the interior mid-latitude balance, but this reflects the linear effect of the forcing, and not the maintenence of the height field fundamental to the shallow-water model. It is possible that the the system recognizes the equator through the time-dependent stretching term, =r|£ which vanishes in the time mean. Indeed it is found in Chapter 5 that this term is essential to the development of eddies preferentially in the vicinity of the equator. In the time-dependent model, this form of stretching could contribute to the vorticity balance at high latitudes, where / is large, and the system is most baroclinic. Near the equator, / is weak, and the effect of relative vorticity advection may be more dominant. However, cursory examination of instantaneous fields in the strongly nonlinear, Re = 500 run, shows little correlation between the time evolution of vorticity and this stretching term. It is important to remember that the Kelvin waves, so vital in the development of the circulation, require the presence of stretching term. From the strong variability that exists in the equatorial zone in Figure 3.10, it appears that these waves, and therefore the stretching term, may also play an important role contributing to the quasi-steady state as well, though I have not analyzed this aspect of the model. It remains an interesting question how exactly the change in sign of the Coriolis parameter influences the dynamics of the vorticity balance.
Ill
>.
o~
-0.2 -
-0.4
-0.8
Figure 4.23: Instantaneous height contours and velocity quivers for the barotropic model run UBar (Re = 100) at t = 500. Notice that the variability in the western boundary current forms just south of the intense forcing region in the northwestern corner.
112
4.5
Summary
Model integrations of Chapter 3 provide a qualitative description of the behavior of fluid in cross-equatorial flow under a range of conditions. The distribution of upwelling sets the volume flux of fluid that must cross the equator, and the system responds by creating an eddy field as the ratio of the volume flux of fluid to the viscosity increases. The formalism of the J-vector analysis introduced in this chapter reveals and quantifies the dynamical role of the eddy field that appears in the numerical experiments. The eddies serve to transfer vorticity between inertial and frictional portions of the boundary current, enabling the potential vorticity transformation that permits the flow. The strength of the turbulent boundary layer increases with the Reynolds number perhaps without bound and at least to Re = 1000. The behavior of the system is quite robust to different upwelling configurations, and though the circulation changes considerably using free-slip boundary conditions, the eddy field again plays a dynamical role in its vorticity budget. In the vicinity of the equator, the structure of the no-slip uniform upwelling boundary current is divided into two portions, an outer inertial boundary layer, and an inner layer obeying an inertioviscous balance. The analysis above reflects its Eulerian perspective. It states how vorticity moves in the frame of reference of the basin. Speculating on the Lagrangian behavior of individual fluid parcels provides an alternative description of cross-equatorial flow. In strongly nonlinear flow, a parcel travels southward within the western boundary current, its vorticity is partially conserved, only weakly modified through a dissipative process. Near the equator, this parcel is swept into an intense cyclonic structure and immersed in a sea of eddies having both positive and negative senses of circulation. As the eddy sweeps past these eddies, and importantly, also past the boundary, it inevitably passes through narrow zones of intense velocity shear, where the vorticity is transferred, from parcel to parcel, and ultimately, from parcel to boundary. The path of any given parcel is extremely complicated and difficult to model, and the trajectories 113
of neighboring parcels diverge rapidly once they enter the turbulent region. Once the parcel has transferred all of its anomalous vorticity, it can merge smoothly with a relatively weak interior flow, either in the northern or southern hemisphere, where the dynamics are more linear.
114
Chapter 5 The Tropically Enhanced Instability of the Western Boundary Current 5.1
Introduction
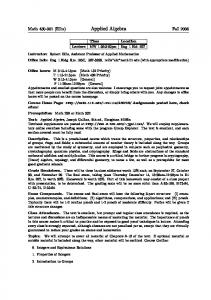
Central to the discussion of cross-equatorial flow in the deep ocean is the development of the eddy field that arises as the system becomes increasingly nonlinear. Associated with these eddies is the necessary transfer of vorticity between different parts of the boundary current, which allows fluid parcels to modify their potential vorticity along their meridional journey. The existence of these eddies and their dynamical role are now well-established by the preceding experiments, but their cause is not explained. The goal of this chapter is to analyze the instability of the tropical western boundary current and explain the mechanism responsible for the eddy generation. Strong eddy activity in the tropical oceans is not purely a numerical artifact but is also found in nature. As mentioned in the Introduction to the thesis, many observations indicate that the equatorial oceans are highly time-dependent regions. Although observations are insufficient to determine whether the region near the western bound-
115
:2.\
,22E
800m L00PERS
^.28B
5N
60W
55W
50W
45W
40W
Figure 5.1: A collection of «looper" float trajectories at 800 meters in the Atlantic. Notice the development of eddy structures just north of the equator. This figure is reproduced from Richards on and Schmitz (1993). ary in the tropics is in nature more eddy rich than at mid-latitudes, SOFAR float measurements in the Atlantic (Richardson and Schmitz (1993)) present a particularly compelling example that suggests this possibility. Shown in Figure 5.1, is a set of "looper" trajectories at 800 meters depth revealing the northward propagation of eddies along the boundary in this region and, potentially, their generation as well. Close examination of the eddy formation process in the numerical model reveals that the phenomenon is dependent on both the Reynolds number of the flow and also on latitude. The eddies begin to develop for nonlinear flows with Re > Rec, where the Reynolds number is defined by global basin parameters according to Equation 2.23. In addition, the features form preferentially near the equator in the no-slip case. This behavior is illustrated by the series of numerical experiments shown in Figure 5.2. In all three cases, the source is located at the northern end of the domain and the sink in the southern, and the basin has dimension, Lx = 3 and Ly = 20 though the figures show only a fraction of this region to concentrate on the unforced central region. The system is spun up from rest to a steady or quasi-steady state. In Figure 5.2a, a western
116
boundary current carries fluid laminarly from the source region across the equator to the sink region. Thus the flow is stable at this Reynolds number (Re = 25). In Figure 5.2b, the Re = 50 and the western boundary current is unstable, and eddies develop. The coincidence between their formation and the equator is striking and unmistakable. Finally, Figure 5.2c presents a run at Re = 50 that does not cross the equator. Its central latitude is at y = 10, and the flow is stable. It is the combination of a high Reynolds number and a constraint to cross the equator that stimulate the observed eddy field. Thinking generally about the stability of a viscous shallow-water tropical system suggests three mechanisms that could be important. The most obvious candidate is horizontal shear instability, which has an extensive history dating back at least to Rayleigh (1880) (see discussion in Drazin and Reid (1981)) In this process, the velocity profile of the mean field is unstable to small disturbances. A sufficient condition for the flow to be stable is the absence of a potential vorticity extrememum in the flow profile anywhere in the domain. As a result, this process is sometimes referred to as an inflection point instability. Shear instability does not rely on the presence of friction. To the contrary, viscosity that is present in the system acts as a stabilizing force which can completely suppress an instability if sufficiently strong. The second possibility is viscous instability. This mechanism has been suggested in studies of the mid-latitude western boundary current by Ierley and Young (1991) and Cessi et al. (1993). The physics of this instability is fundamentally the same as above. However, the basic flow (usually) has no potential vorticity extremum in the domain and is therefore stable to perturbations in the absence of friction. Without viscous forces, the Reynolds stresses (u'v1) vanish owing to a precise phase relationship between the different velocity components. As a result the disturbance can not extract momentum from the mean flow. With the addition of viscosity, this phase relationship is broken in a critical layer residing in the high shear zone adjacent to the boundary, enabling the Reynolds stresses to transfer momentum to the perturbation. An example
117
a) Re=25, Tropical
b) Re=50, Tropical
c ) Re=50, Mid-latitude 14 Tj
ft|:::/:::
:■■:::
13 f !'•::( %' tj ■ ■"
fj'J
12 H !'•* >*:;;:
m' 11 -Jrj f 4'
,
fr ,,,
I*:,,,: ii1.,,,.
-
li*,,.. Ii*. ji' ,,
=-io m ii *
ii*';;:
fli*',,.
fi'",t,
w',,, 9 4f fi'' ii*-llt ,,. ii*",,. w*',,. ii*',,. [i*',,. h',,, 8fl v:.,,.:
.{ ..,...;
-
-
4 ......
4' .....
I'.].... 4l 7 Jff v v
_
4 4 4 4 .
6 AL
:+:•/...,.:::::::: 0.5 x
Figure 5.2: Velocity and height fields in subdomain of basin with source in the north and sink in the south at t=1000 (ßLo)-1: (a) Re = 25 and central latitude is the equator; (b) as in (a) but with Re = 50; (c) as in (b) but with central latitude at y = 10.
118
of viscous instability is the plane Pouseille flow which has a parabolic profile. With no inflection point, the flow is stable to shear instability, but in real flows at very high Reynolds numbers (Re=5780 (Kundu (1990)), the system undergoes a transition to time-dependent motion. A third possibility is that the flow is inertially unstable, a process more directly related to the rotation of the system than horizontal shear instability. A familiar example is of Taylor-Couette flow in which two concentric cylinders with fluid between them rotate differentially. It can be shown (e.g., Kundu (1990)), that when the square of the circulation of fluid decreases with radius, the system becomes unstable and horizontal rolls develop to transfer momentum laterally. Since this process depends on the centrifugal acceleration of the fluid parcels, it is also called centrifugal instability. In geophysical contexts in which the Coriolis parameter arises, the necessary condition for instability in a highly idealized flow is that
fq < 0.
(5.1)
When the potential vorticity, q, of the flow is of the opposite sign as the Coriolis parameter, as happens in inertial cross-equatorial flow, the system becomes unstable. The theory applies to inviscid, parallel flow. In a real fluid, friction damps the disturbance as in shear instability. In nature, other instabilities are possible, such as baroclinic or Kelvin-Helmholtz instability. However, these depend on the vertical velocity shear, and therefore are absent in a shallow-water model.
Furthermore, baroclinic instability is not likely
for mean flows with horizontal scale small with respect to the deformation radius (Pedlosky (1987a)) as is true for the western boundary current at the equator. As a result, I focus only on the three mechanisms above. Determining the physics that drives the equatorial instability is not a pedantic quest. Its importance rests in the generality of the eddy formation process and the dynamical significance attributed to the eddy field in the previous chapter. If eddies develop only as a result of the details of the frictional parameterization, as suggested 119
by the possibility of a viscous instability, then their role in transporting vorticity to the western boundary current is also quite fragile, potentially just an artifact of the particular model chosen. On the other hand, if the western boundary current is found to be unstable to the more robust shear instability, then the conclusions drawn previously are more general and are likely to apply to the ocean and to any model that produces a physically realistic western boundary current. It is in fact difficult to state absolutely which process is fundamentally responsible if, as is the case, all the elements for each instability are present. However, I will show that the likely process at work is classical shear instability of the western boundary current that is triggered preferentially at the equator because the maximum in the deformation radius occurs at that latitude.
5.2
Formulation of the Problem
The stability of the tropical western boundary current is assessed using the standard techniques of linear stability analysis, as found for example in Pedlosky (1987a) or Drazin and Reid (1981) along with several approximations. In particular, the western boundary current is idealized to be purely meridional and latitude-independent and the effect of the gradient in the planetary vorticity is neglected in the perturbation. The shallow-water equations in dimensional form are recast =
-hx + AHV2u + E
(5.2a)
vt + u-Vv + fu =
-hy + AHV2v + T
(5.2b)
-w*
(5.2c)
ut + u-Vu-fv
At + u-VÄ + ÄV-u
=
where additional body force terms E(x,y) and T(x,y), whose utilility will become evident below, are included in the momentum equations. The dependent variables are decomposed into time-mean and perturbation quantities, u(x,y,t) = ü(x,y) + u'(x,y,t) 120
(5.3a)
v(x,y,t) =
v(x,y) + v'(x,y,t)
(5.3b)
h(x,y,t)
h{x,y) + h'(x,y,t).
(5.3c)
=
For the predominantly meridional shear flow of a western boundary current, the basic state is idealized to be parallel flow that is only a function of longitude: u = 0;
v = v(x);
h = h(x).
(5.4)
Substituting Equations 5.4 and 5.3a - 5.3c into the set 5.2a - 5.2c yields a new set of equations in terms of both the mean and perturbation quantities. Since, linear stability theory models the initial development of infinitesimal disturbances to a basic state, the equations may be examined at different orders of the amplitude of the disturbance. To leading order, only terms independent of the prime variables remain, fv
=
-g'hx+E
(5.5a)
0
=
AHvxx + T.
(5.5b)
Equations 5.5a and 5.5b are in essence a redefinition of the basic state. Body force terms, E and T, remain in the equations at this order, and they represent the artificial but necessary forces to balance the idealized mean flow and maintain a purely meridional, latitude-independent basic state. Their functional form depends exactly on the chosen form for the mean flow used. For example, for a desired basic state velocity profile, v°(x) and h (x),
S(x,y) = mn^+g't T = -AaSL.
(5.6a) (5.6b)
Alternatively,
^ = /3v°. ay
(5-7)
Thus the forcing, H, satisfies a vorticity balance and maintains the desired meridional velocity field, and T balances any viscous dissipation of that flow. The vertical mass 121
flux, w+, is absent in the equations, reflecting the fact that a local vertical mass flux can not drive a steady, latitude-independent basic flow. Moving to the next order retains terms linear in the perturbations u't + vu'y-fv' + h'x-AHV2u' = 0
(5.8a)
v't + vxu' + vv'y + fu' + h'y~-AHV2v' = 0
(5.8b)
h't + hxu' + vh'y + h(u'x + v'y)
(5.8c)
= 0.
The time evolution of the disturbance is determined by this set of equations in which the perturbation variables are coupled both to one another and to the basic state. The artificial body forces, E and T, that drive the mean flow are absent in the perturbation equations. Thus their inclusion in the original physics has no effect on the instability of the system except in so far as establishing the mean field. The coupled set of partial differential equations, 5.8a-5.8c, can be analytically simplified by making a stringent assumption.
With the exception of the Coriolis
parameter, / = f(y), all of the coefficients of the dependent variables are functions of longitude only and not of latitude or time. // a local /-plane approximation is made and the Coriolis parameter is assumed to have a constant value, /0, then a modal decomposition of the dependent variables is possible in y and t. Let (t,',*')
=
(V(x),H(x))eil^
u' = UU(x)ea^-'*\
(5.9a) (5.9b)
where I is the meridional wavenumber of the disturbance and c represents its phase speed. The wavenumber-weighting of the zonal amplitude function in Equation 5.9b merely simplifies the ultimate form of the mathematical problem and represents no fundamental difference between the different components. The method outlined here is similar to that of Ni (1996) who considered a zonal flow in a multi-layer, inviscid shallow-water model. The /-plane approximation that allows this decomposition is a significant limitation of the present analysis as the variation of the Coriolis parameter is usually 122
essential in tropical dynamical studies. A full treatment of the problem must include both the meridional variation of / and the non-zonal nature of the basic flow. However, the full analysis is beyond the scope of this work, and as will be shown below, the simplification to a local /-plane calculation provides surprisingly good agreement with numerical results and does so in a desirably simple and understandable framework. Using relations 5.9a and 5.9b, the system 5.8a-5.8c reduces to
-l2(v-c)U-UAH(Uxx-l2U)-fV + Hx = 0
(5.10a)
(f + v^U + iv-^V+^AH^-l^+H = 0
(5.10b)
(hxU + hUxx)+hV + (v-c)H = 0.
(5.10c)
Equations 5.10a-5.10c can be re-written in the matrix form (5.11)
Atp = ctp where L
v + UAH(££i-l)
P
f+Vx
V+ilAH(££r-l)
LAP dx
(5.12)
hx + h-d*and
u j,=
V
(5.13)
H is the state vector. Equation 5.11 is a standard eigenvalue problem in which there exists a corresponding eigenvector, if}1, for each eigenvalue, c*. From the modal representation of the perturbation amplitudes, stable modes have phase speeds either real or complex with negative imaginary component. Any eigenmode that has a positive imaginary component grows exponentially in time, at least until the perturbations reach finite amplitude. Equation 5.11 gives the stability properties for meridional shear flow, of infinite zonal extent. To apply this formulation to the realistic shear flow of a western boundary current requires a finite domain, x =
[0,XE],
123
where the distance to the eastern
boundary of the basin, x#, is expected to be large compared to the scale of the shear flow itself. Boundary conditions at the solid meridional boundaries are no flux and no slip, U =
0
(5.14a)
V =
0.
(5.14b)
The full linear stability analysis even for this somewhat idealized flow as expressed by the matrix, A, reveals a complicated dependence of the state vector on the basic state and on the latitude, through the magnitude of the Coriolis parameter. It is not immediately clear how the stability of the system will change with latitude or with the mean flow itself. To gain further insight from the equations directly requires additional simplifications that are discussed in the next section.
5.3
Inviscid Shear Instability
Although Equation 5.11 can be discretized and analyzed as written for a variety of mean fields, it is useful to further reduce the problem first so as to isolate the different instability mechanisms. Setting the viscosity coefficient, AH, to zero eliminates viscous instability from the system. The matrix, A then reduces to v
L p
l d I2 dx
f + vx
V
1
h
V
(5.15)
and the order of the system is reduced. The new eigenvalue problem is defined by, A = ctf>.
(5.16)
Only two boundary conditions are needed, and the obvious choice is that of no normal flow, Equation 5.14a. The no-slip condition, Equation 5.14b seems unphysical if the disturbance can not detect any dissipation. Thus friction is required to establish the mean flow profile, but its effect on the perturbation is neglected. 124
The stability criterion for inviscid zonal flows on the /3-plane in the shallow-water system has been examined by Ripa (1983). The case with ß = 0 corresponds to the present system. Stability is insured if (i) [a - v(x)] $- > 0 ax
(5.17)
[a - v(x)}2 < g'h(x)
(5.18)
and (ii),
for all x and any a. For the standard Munk boundary current as well as inertio-viscous profiles, condition 5.17 is generally violated assuming a in the range of the velocity. The following section briefly describes the numerics involved in the solution of the eigenvalue problem. Section 5.3.2 determines and examines the stability of 5.16 using the inviscid formulation, A, and shows that the Munk boundary layer is in fact unstable to small perturbations, and that the shear instability growth rate is largest near the equator. Section 5.3.3 makes two additional approximations that allow a still simpler mathematical and physical interpretation of the phenomenon that more clearly illustrates the tropical enhancement of the instability.
5.3.1
Numerics
All eigenvalue equations analyzed are discretized on a stretched grid in x with staggered variables in a manner similar to that described in Section A.2 for the timedependent model, except that for this western boundary problem, the stretching function is a simple exponential: x(i) = d (e" - l)
(5.19)
d = -p-, 3
(5.20)
where e — 1
N is the number of grid points, and s gives the degree of stretching.
A value of
s = 3 was chosen to adequately enhance the resolution in the rapidly varying western
125
boundary region without introducing excessive deformation of the grid. The results are slightly dependent on the number of grid points. All calculations were determined using a value of at least N = 100, though even N = 32 appears adequate to reveal the general behavior of the instability. Generally, the matrix, A, is determined numerically, given the basic state and the latitude, and the eigenvalues, c, and eigenvectors, ip, are determined using the eigenvalue solver, eig.m, which calls industry standard EISPACK routines, and is included in the basic distribution of Matlab. Checking the solutions using a different solver sptarn.m, which applies a different algorithm to find selected eigenvalues produces virtually indistinguishable results. The numerical method for solution was checked against and agreed well with the asymptotic stability analysis of Lipps (1963) for a wall-free Bickley jet.
5.3.2
Instability of the Munk Boundary Layer
It is desirable to examine first a simple basic flow in which the fields are truly latitudeindependent. Any asymmetry that develops in the instability characteristics can then be attributed to the shallow-water system and not to changes in the potential vorticity structure of the basic state. I will examine later in Section 5.3.4 the instability of a more realistic, latitude-dependent flow field. The analytic solution to the Munk boundary layer provides a convenient basic velocity profile to begin the investigation: v(x) = Dsm I — J e «*■
(5.21)
where D
2So
\/3V
; indicate growing and decaying modes, respectively, and the symmetry about /c,- = 0 indicates that for each growing mode there exists a corresponding decaying mode. This feature is to be expected from the form of the matrix 5.15 in which all elements are purely real. The state vector, z/>, can be replaced by its complex conjugate, and the equation remains the same. Thus there is a symmetry between eigenvalues and their complex conjugates, and therefore also between growth and decay rates. Notice that this feature changes with the inclusion of friction, as in matrix, A, Equation 5.12. In Figure 5.4a a few sets of unstable modes can be traced as a function of wavenumber. In particular, one pair of modes has the largest amplitude for all /, and they peak at a value of approximately I = 3.25. This series and the additional sets of modes that appear within its envelope are the sets of modes that I consider to result from shear instability, and they are quite insensitive to the exact discretization and grid resolution. Notice that at high wavenumber there exist an increasing number of unstable modes of small amplitude. These are more fragile modes that depend more closely on the discretization of the system. While all unstable modes grow, it is the one with the largest growth rate that dominates the instability. Therefore these numerically sensitive modes can be neglected when considering also the more unstable shear modes. Furthermore, their amplitude tends to decrease with increasing resolution. Within the approximations of the analysis, Figure 5.4a indicates that the Munk layer is unstable to inviscid, growing perturbations. The phase speed of the fastest growing mode is shown as a function of wavenumber in Figure 5.4b The value varies between a value of i = 0.058 and 0.0584 are used to aid the eye. A growth rate maximum [wi]max = 0.0584 resides clearly in the immediate vicinity of the 131
Munk layer: a) Growth rate ' 001
0
0.5
1
1.5
Figure 5.6: As functions of meridional wayenumber and latitude, the a) growth rate and b) phase speed of the fastest growing mode for the Munk boundary layer in Figure 5.3. The dot-dashed curves in (a) mark wt- = 0.058 and 0.0584.
equator, at a wavenumber I = 3.2 and at a latitude of y = -0.5. However, this growth rate maximum is not located at y = 0. Since the basic state is independent of y, it appears that the shallow-water system is aware of the direction of the flow through the absolute vorticity, / + vx, in matrix, A. The phase speed of the fastest growing mode is contoured in Figure 5.6b also as a function of wavenumber and latitude. For a given wavenumber, the phase speed of the most unstable disturbance decreases with latitude.
The significance of this
structure along with a more physical interpretation of the equatorial enhancement of the instability is further explored in the context of a still simpler model in the next section.
132
5.3.3
Geostrophic Perturbations
The previous section shows that the Munk boundary layer is unstable to inviscid perturbations, and that the instability is greatest near the equator. However, the complicated form of matrix, A, prevents a direct explanation for the tropical enhancement. Two assumptions that follow examples of Stern (1961) and Lipps (1963) significantly simplify the system. First, the mean flow is assumed only weakly nonlinear so that vx < /
(5.26)
This approximation is clearly invalid very close to the equator, where / = 0, but the flow can be specified to be arbitrarily weak so that relationship 5.26 holds for all other latitudes. Second, the perturbations must be geostrophically balanced, -/*>' = fu'
=
-g'h'x
(5.27a)
-g'h'y.
(5.27b)
This relation assumes that the Rossby number of the perturbation is small, which is valid again arbitrarily close to the equator for truly infinitesimal motion. It also assumes the time rate of change of the perturbation be small relative to the Coriolis term, -7 < 1.
(5.28)
Since the growth rate of a disturbance in linear theory scales with the velocity, this relation can again be satisfied arbitrarily close to the equator for sufficiently weak flows. The geostrophic approximation couples the different fields of the disturbance such that a single equation results, expressed in terms of a single variable. Adopting the above approximations and scaling the horizontal dimensions by the length scale, L, yields for the height anomaly, H, (v - c) [Hxx - (l2 + F)H]- (VXX -FV)H = 0, 133
(5.29)
where F .
-fc
(5.30a)
X
L .2
(£)
(5.30b)
is the rotational Froude number. At the boundaries, the height of the disturbance is set to zero: H = 0.
(5.31)
Equation 5.29 describes the initial development of the instability for weak mean flows until the Rossby number of the disturbance, ^, becomes order 1. For F = 0, Equation 5.29 reduces to the familiar Rayleigh equation or the equation for standard barotropic instability. The additional terms proportional to F reflect the influence of the horizontal divergence in the velocity field that is included in the shallow-water model. Separating the amplitude, H, and the phase speed, c, into real and imaginary parts and integrating over the domain gives the usual necessary criterion for the development of an instability, F* G\H\2 , * / ,_ ,2dx = °> Jo \v — c\
(5.32) v '
G = vxx - Fv
(5.33)
where
is the mass-weighted potential vorticity gradient. Equation 5.32 shows that for growing modes to exist (i.e., if Q > 0), there must be a location within the domain where G changes sign. The solution to Equation 5.29 subject to boundary conditions 5.31 gives remarkably similar results to that of the full system. The contour plot of growth rate as a function of wavenumber and latitude is shown in Figure 5.7a. Solid contours are uniform, every hundredth, and the dot-dashed contours correspond to values, o>; = 0.058 and 0.0584 as in Figure 5.6a. The maximum of 0.0588 is located at a wavenumber of / = 3.26 134
Munk layer, Geostrophic perturbations: a) Growth rate 11.02
Figure 5.7: As functions of meridional wavenumber and latitude, the a) growth rate and b) phase speed for the fastest growing mode as in Figure 5.6, but assuming geostrophic perturbations as in Equation 5.29. The wavenumber corresponding to the growth rate maximum as a function of latitude is shown as the dashed curve in both plots. The dotted curve is the wavenumber, Jm, defined in Equation 5.36 as a function of latitude.
and y = 0. Note that there is no asymmetry in this modified instability problem as Equation 5.29 can not distinguish between the northern and southern hemispheres if the basic state is longitude independent. The effect of the horizontal divergence of the velocity field can now be interpreted in Equation 5.29 more simply than through the full shallow-water system. Introducing the effective wavenumber, K such that 2
K
= I2 + F,
(5.34)
Equation 5.29 becomes Hxx — K H
G v
-H = 0.
(5.35)
Consider first the case where G and v are independent of latitude. In this case, Equation 5.35 has exactly the form of the Rayleigh equation in terms of the effective wavenumber, K. A generic growth rate curve for an unstable mean flow is shown in 135
KC 1
/N
Figure 5.8:
Generic growth rate curve for a wavenumber,
K.
Figure 5.8. The growth rate has a maximum at a value of /cm which is independent of latitude. As the Coriolis parameter increases with latitude, the deformation radius LD decreases, and therefore F increases. The actual meridional wavenumber associated with /cm is lm = y/i^ - F,
. (5.36)
which decreases rapidly with latitude. However, the actual growth rate depends on I and not «, so the true growth rate maximum does not follow a relation like equation 5.36, but rather a more modest decrease with latitude. Both lm and the actual growth rate maximum, lM, are shown in Figure 5.7 as functions of latitude. This trend can be expressed alternatively.
For a fixed actual wavenumber, l0,
increasing F with latitude shifts K to a larger value. If l0 < lm, this effect can induce larger growth rates at that wavenumber, initially. However, this increase ends once /cm is reached. Further increases in latitude reduce the growth rate of the instability until ultimately the high wavenumber cutoff, KU is passed, and the flow becomes stable. Next examine the effect of divergence through the last term on the left hand side of 5.35. From the stability criterion, Equation 5.32, it is clear that if G is of one sign then Ci = 0. If the flow has an inflection point and F is small, then this requirement is satisfied. However, if the flow is of one sign, as for example with a fully inertial 136
boundary current, then at some critical latitude, F(yc)v > vxx for all x, and the flow is stable. In this case, the effect of divergence is also stabilizing. For flows that vanish at least once in the domain, such as the Munk boundary layer, the flow can satisfy the necessary criterion for instability at all latitudes, but the flow may become stable at high latitudes according to the previous argument. Thus the flow becomes more stable as the ratio of the length scale of the mean flow to the deformation radius increases. A physical interpretation is obtained by considering the instability as the result of interacting vorticity anomalies. Any curvature in the velocity profile acts as a vorticity gradient upon which Rossby waves propagate. The phase speed of a wave in a meridional mean flow is given in terms of the deformation radius by
c=v
fL—s
p
(5.37)
+(£)
where the effective vorticity gradient is
ß = -vxx.
(5.38)
A schematic of the western boundary current is presented in Figure 5.9, in which it is clear that the vorticity gradients change sign on either side of the inflection point, P. Relative to the velocity, vp, of the mean flow at P, waves travel southward to its east and northward to its west, but are advected by the relative mean flow. Therefore it is possible to have waves that are stationary with respect to vp. These phaselocked modes interact, advecting anomalous vorticity and encouraging the growth of neighboring disturbances. As the deformation radius increases, the phase speed of a given wave increases. To maintain stationarity with respect to the mean flow, the wavenumber must decrease. However, decreasing I increases the separation between anomalies, and they interact less strongly. Actual growth is determined by the balance of phase-locking and mutual reinforcement. If only stationarity were important, the wavenumber, IM, associated 137
A
-»
N