ARCHITECTURE-CONSCIOUS. DATABASE SYSTEMS by. Anastassia Ailamaki.
A dissertation submitted in partial fulfillment of the requirements for the degree ...
ARCHITECTURE-CONSCIOUS DATABASE SYSTEMS by Anastassia Ailamaki
A dissertation submitted in partial fulfillment of the requirements for the degree of
Doctor of Philosophy (Computer Sciences)
at the UNIVERSITY OF WISCONSIN — MADISON 2000
© Copyright by Anastassia Ailamaki 2000 All Rights Reserved
i
TABLE OF CONTENTS Abstract . . . . . . . . . . . . . . . . . . . . . . . . . . . . . . . . . . . . . . . . . . . . . . . . . . . . . . . . . . . . . . . . . . v
Acknowledgments . . . . . . . . . . . . . . . . . . . . . . . . . . . . . . . . . . . . . . . . . . . . . . . . . . . . . . . viii
Chapter 1 . . . . . . . . . . . . . . . . . . . . . . . . . . . . . . . . . . . . . . . . . . . . . . . . . . . . . . . . . . . . . . . . . . . 1 1.1
A Model for Commercial Database Execution Time . . . . . . . . . . . . . . . . . . . . . . . . . . . . . . . . . 4
1.2
PAX: A Cache-Conscious Data Page Layout . . . . . . . . . . . . . . . . . . . . . . . . . . . . . . . . . . . . . . . 6
1.3
Porting Shore on Four Systems: Where Is My Dream Machine? . . . . . . . . . . . . . . . . . . . . . . . . 8
1.4
A Note on Methodology: Measurement Vs. Simulation . . . . . . . . . . . . . . . . . . . . . . . . . . . . . . 10
1.5
Thesis Organization 11
Chapter 2 . . . . . . . . . . . . . . . . . . . . . . . . . . . . . . . . . . . . . . . . . . . . . . . . . . . . . . . . . . . . . . . . . . 12 2.1
Previous work . . . . . . . . . . . . . . . . . . . . . . . . . . . . . . . . . . . . . . . . . . . . . . . . . . . . . . . . . . . . . . 13
2.2
Query Execution on Modern Processors . . . . . . . . . . . . . . . . . . . . . . . . . . . . . . . . . . . . . . . . . . 14
2.3
2.2.1
Query Execution Time: A Processor Model . . . . . . . . . . . . . . . . . . . . . . . . . . . . . . . . 14
2.2.2
Significance of the stall components . . . . . . . . . . . . . . . . . . . . . . . . . . . . . . . . . . . . . . 17
2.2.3
Database workload . . . . . . . . . . . . . . . . . . . . . . . . . . . . . . . . . . . . . . . . . . . . . . . . . . . . 18
Experimental Setup . . . . . . . . . . . . . . . . . . . . . . . . . . . . . . . . . . . . . . . . . . . . . . . . . . . . . . . . . . 20 2.3.1
The hardware platform . . . . . . . . . . . . . . . . . . . . . . . . . . . . . . . . . . . . . . . . . . . . . . . . . 20
2.3.2
The software . . . . . . . . . . . . . . . . . . . . . . . . . . . . . . . . . . . . . . . . . . . . . . . . . . . . . . . . . 21
2.3.3
Measurement tools and methodology . . . . . . . . . . . . . . . . . . . . . . . . . . . . . . . . . . . . . 22
ii
2.4
2.5
Results . . . . . . . . . . . . . . . . . . . . . . . . . . . . . . . . . . . . . . . . . . . . . . . . . . . . . . . . . . . . . . . . . . . . 24 2.4.1
Execution time breakdown . . . . . . . . . . . . . . . . . . . . . . . . . . . . . . . . . . . . . . . . . . . . . . 24
2.4.2
Memory stalls . . . . . . . . . . . . . . . . . . . . . . . . . . . . . . . . . . . . . . . . . . . . . . . . . . . . . . . . 26
2.4.3
Second-level cache data stalls . . . . . . . . . . . . . . . . . . . . . . . . . . . . . . . . . . . . . . . . . . . 28
2.4.4
First-level cache instruction stalls . . . . . . . . . . . . . . . . . . . . . . . . . . . . . . . . . . . . . . . . 29
2.4.5
Branch mispredictions . . . . . . . . . . . . . . . . . . . . . . . . . . . . . . . . . . . . . . . . . . . . . . . . . 31
2.4.6
Resource stalls . . . . . . . . . . . . . . . . . . . . . . . . . . . . . . . . . . . . . . . . . . . . . . . . . . . . . . . 32
2.4.7
Comparison with DSS and OLTP . . . . . . . . . . . . . . . . . . . . . . . . . . . . . . . . . . . . . . . . 34
Summary . . . . . . . . . . . . . . . . . . . . . . . . . . . . . . . . . . . . . . . . . . . . . . . . . . . . . . . . . . . . . . . . . . 35
Chapter 3 . . . . . . . . . . . . . . . . . . . . . . . . . . . . . . . . . . . . . . . . . . . . . . . . . . . . . . . . . . . . . . . . . . 36 3.1
3.2
3.3
3.4
Previous work on data placement techniques . . . . . . . . . . . . . . . . . . . . . . . . . . . . . . . . . . . . . . 37 3.1.1
The N-ary Storage Model . . . . . . . . . . . . . . . . . . . . . . . . . . . . . . . . . . . . . . . . . . . . . . . 38
3.1.2
The Decomposition Storage Model . . . . . . . . . . . . . . . . . . . . . . . . . . . . . . . . . . . . . . . 40
Partition Attributes Across . . . . . . . . . . . . . . . . . . . . . . . . . . . . . . . . . . . . . . . . . . . . . . . . . . . . 41 3.2.1
Overview . . . . . . . . . . . . . . . . . . . . . . . . . . . . . . . . . . . . . . . . . . . . . . . . . . . . . . . . . . . 42
3.2.2
Design . . . . . . . . . . . . . . . . . . . . . . . . . . . . . . . . . . . . . . . . . . . . . . . . . . . . . . . . . . . . . 42
3.2.3
Storage requirements . . . . . . . . . . . . . . . . . . . . . . . . . . . . . . . . . . . . . . . . . . . . . . . . . . 45
3.2.4
Implementation . . . . . . . . . . . . . . . . . . . . . . . . . . . . . . . . . . . . . . . . . . . . . . . . . . . . . . 46
Analysis of cache performance . . . . . . . . . . . . . . . . . . . . . . . . . . . . . . . . . . . . . . . . . . . . . . . . . 48 3.3.1
Experimental setup and methodology . . . . . . . . . . . . . . . . . . . . . . . . . . . . . . . . . . . . . 48
3.3.2
Results and Analysis . . . . . . . . . . . . . . . . . . . . . . . . . . . . . . . . . . . . . . . . . . . . . . . . . . 50
Evaluation Using DSS Workloads . . . . . . . . . . . . . . . . . . . . . . . . . . . . . . . . . . . . . . . . . . . . . . 54 3.4.1
Experimental Setup and methodology . . . . . . . . . . . . . . . . . . . . . . . . . . . . . . . . . . . . . 54
iii
3.5
3.4.2
Insertions . . . . . . . . . . . . . . . . . . . . . . . . . . . . . . . . . . . . . . . . . . . . . . . . . . . . . . . . . . . 56
3.4.3
Queries . . . . . . . . . . . . . . . . . . . . . . . . . . . . . . . . . . . . . . . . . . . . . . . . . . . . . . . . . . . . . 57
Summary . . . . . . . . . . . . . . . . . . . . . . . . . . . . . . . . . . . . . . . . . . . . . . . . . . . . . . . . . . . . . . . . . . 59
Chapter 4 . . . . . . . . . . . . . . . . . . . . . . . . . . . . . . . . . . . . . . . . . . . . . . . . . . . . . . . . . . . . . . . . . . 61 4.1
4.2
4.3
4.4
Hardware platform overview . . . . . . . . . . . . . . . . . . . . . . . . . . . . . . . . . . . . . . . . . . . . . . . . . . 63 4.1.1
Processor Architecture and Execution Engine Design . . . . . . . . . . . . . . . . . . . . . . . . . 63
4.1.2
Memory Hierarchy . . . . . . . . . . . . . . . . . . . . . . . . . . . . . . . . . . . . . . . . . . . . . . . . . . . . 67
Experimental Setup and Methodology . . . . . . . . . . . . . . . . . . . . . . . . . . . . . . . . . . . . . . . . . . . 70 4.2.1
Workload . . . . . . . . . . . . . . . . . . . . . . . . . . . . . . . . . . . . . . . . . . . . . . . . . . . . . . . . . . . 70
4.2.2
Compilation . . . . . . . . . . . . . . . . . . . . . . . . . . . . . . . . . . . . . . . . . . . . . . . . . . . . . . . . . 71
4.2.3
Measurement Method . . . . . . . . . . . . . . . . . . . . . . . . . . . . . . . . . . . . . . . . . . . . . . . . . . 71
Workload Behavior on Individual Machines . . . . . . . . . . . . . . . . . . . . . . . . . . . . . . . . . . . . . . 73 4.3.1
Sun UltraSparc . . . . . . . . . . . . . . . . . . . . . . . . . . . . . . . . . . . . . . . . . . . . . . . . . . . . . . . 74
4.3.2
Intel Pentium II Xeon . . . . . . . . . . . . . . . . . . . . . . . . . . . . . . . . . . . . . . . . . . . . . . . . . . 76
4.3.3
Compaq Alpha 21164 . . . . . . . . . . . . . . . . . . . . . . . . . . . . . . . . . . . . . . . . . . . . . . . . . 77
Comparison Across Systems . . . . . . . . . . . . . . . . . . . . . . . . . . . . . . . . . . . . . . . . . . . . . . . . . . . 81 4.4.1
SPEC Performance . . . . . . . . . . . . . . . . . . . . . . . . . . . . . . . . . . . . . . . . . . . . . . . . . . . . 81
4.4.2
Database Workload Instruction Stream . . . . . . . . . . . . . . . . . . . . . . . . . . . . . . . . . . . . 83
4.4.3
Execution Time Breakdown . . . . . . . . . . . . . . . . . . . . . . . . . . . . . . . . . . . . . . . . . . . . . 85
4.4.4
Cache Performance . . . . . . . . . . . . . . . . . . . . . . . . . . . . . . . . . . . . . . . . . . . . . . . . . . . 87
4.4.5
4.4.4.1
Data . . . . . . . . . . . . . . . . . . . . . . . . . . . . . . . . . . . . . . . . . . . . . . . . . . . . . . . 88
4.4.4.2
Instructions . . . . . . . . . . . . . . . . . . . . . . . . . . . . . . . . . . . . . . . . . . . . . . . . . . 90
Branch Mispredictions . . . . . . . . . . . . . . . . . . . . . . . . . . . . . . . . . . . . . . . . . . . . . . . . . 92
iv
4.5
Putting It All Together: Comparison Between NSM and PAX . . . . . . . . . . . . . . . . . . . . . . . . 93
4.6
Summary . . . . . . . . . . . . . . . . . . . . . . . . . . . . . . . . . . . . . . . . . . . . . . . . . . . . . . . . . . . . . . . . . . 95
Chapter 5 . . . . . . . . . . . . . . . . . . . . . . . . . . . . . . . . . . . . . . . . . . . . . . . . . . . . . . . . . . . . . . . . . . 97
Bibliography . . . . . . . . . . . . . . . . . . . . . . . . . . . . . . . . . . . . . . . . . . . . . . . . . . . . . . . . . . . . 100
APPENDIX A: PAX algorithms . . . . . . . . . . . . . . . . . . . . . . . . . . . . . . . . . . . . . . . . . . . . . . . . 105
APPENDIX B: SQL Code of TPC-H Queries . . . . . . . . . . . . . . . . . . . . . . . . . . . . . . . . . . . . . 106
v
ABSTRACT Database management systems (DBMSs) are currently used as the supporting back-end for a large number of internet applications, and the dominant commercial software running on high-end enterprise servers. Modern database servers rely on powerful processors that are able to execute instructions in parallel and out of the program’s logical order, and of performing computations at tremendously high speeds. Although during the past two decades database performance research has primarily focused on optimizing I/O performance, today’s database applications are becoming increasingly computation and memory intensive. Recent studies show that the hardware behavior of database workloads is suboptimal when compared to scientific workloads, and the results indicate that further analysis is required to identify the real performance bottlenecks.
My thesis is that we can understand the bottlenecks of the interaction between the database system and the hardware by studying (a) the behavior of more than one commercial DBMS on the same hardware platform, and (b) the behavior of the same DBMS on different hardware platforms. The former is important in order to identify general trends that hold true across database systems and to determine what problems we must work on to make database systems run faster. The latter is important in order to compare competing processor and memory system design philosophies, and to determine which of the architectural design parameters are most crucial to database performance.
The primary contributions of this dissertation are (a) to introduce a novel approach towards identifying performance bottlenecks in database workloads by studying their hardware behavior, (b) to improve database performance by redesigning data placement in an architecture-conscious fashion, and (c) to identify the hardware design details that most influence database performance. The first part of this thesis introduces an execution model for database workloads, and studies the execution time breakdown of four com-
vi
mercial DBMSs on the same hardware platform. The model breaks elapsed execution time into two components: the time during which the processor performs useful computation and the time during which the processor is stalled. The results show that (a) on the average, half the execution time is spent in stalls (implying database designers can improve DBMS performance significantly by attacking stalls), (b) 90% of the memory stalls are due to second-level cache misses when accessing data, and first-level cache misses when accessing instructions, and (c) about 20% of the stalls are caused by subtle implementation details (implying that there is no “silver bullet” for mitigating stalls). In addition, using simple queries rather than full decision-support workloads provides a methodological advantage, because results are simpler to analyze and yet are substantially similar to the results obtained using full benchmarks.
One of the most significant conclusions from the first part of this thesis is that data accesses to the second-level cache are a major bottleneck on a processor with a two-level cache hierarchy. The traditional page layout scheme in database management systems is the N-ary Storage Model (NSM, a.k.a., slotted pages), and is used by all of today’s commercial database systems. NSM, however, exhibits suboptimal cache behavior. The second part of this thesis introduces and evaluates Partition Attributes Across (PAX), a new layout for data records. For a given relation R, PAX stores the same data on each page as NSM. Within each page, however, PAX groups all the values of a particular attribute together on a minipage. Therefore, when applying a predicate to an attribute, the cache performance of PAX is significantly better than NSM' s. At the same time, all parts of the record are in a single page, so the reconstruction cost is minimal (because PAX performs “vertical partitioning within the page”). When compared to NSM, PAX incurs 50-75% fewer second-level cache misses due to data accesses, and executes TPC-H queries in 11%-40% less time than NSM.
The analysis across four commercial database systems from the first part of this thesis indicates that design decisions in both the processor’s execution engine and the memory subsystem significantly affect
vii
database performance. The third part of this thesis studies the impact of processor design on the performance of database workloads on a variety of hardware platforms. From the study comes evidence that (a) an out-of-order processor would overlap stalls more aggressively, especially if combined with an execution engine that can execute more than one load/store operations per processor cycle, (b) a high-accuracy branch-prediction mechanism is critical to eliminate stall time due to branch mispredictions that, as shown in the first part, increase the instruction cache misses as well and (c) a high-associativity, non-inclusive cache hierarchy with large data blocks will exploit spatial locality of data provided by placement techniques like PAX.
viii
ACKNOWLEDGEMENTS Mom, Dad, Niko, Artemh, and Christo, this thesis is dedicated to you. I would never have made it without your love, support, chocolate, stuffed animals, and letters. I would like to express my gratitude to all the people who contributed in making my 4.5 years in UWMadison a fun time, full of invaluable experiences. First of all, thanks to Yannis Ioannidis for convincing me to come to Madison for my Ph.D., for teaching me how to analyze everything with patience, and for supporting my carreer and life choices with continuous encouragement and advice. Thanks to my advisor David DeWitt, for encouraging me to discover on my own the research direction I want to follow, for guiding me through the interview process, and for encouraging me to work hard and complete my dissertation. Thanks to the wonderful Wisconsin database group for being my friends and colleagues and for supporting each other through all the hard paper and project deadlines. Special thanks to Ashraf Aboulnaga for the feedback, comments, and help with graph patterns. Thanks to my co-advisor Mark Hill, for always finding time to advise and guide me, and for teaching me how to maximize the results of my efforts, and how to be strategic in pursuing my carreer goals. Thanks to the computer architecture people in Wisconsin, for welcoming me into their group and for the wonderful time during the beer outings at the terrace. Thanks to Miron Livny for his suggestions on how to design high-confidence experiments Thanks to Jim Gray for introducing me the industrial world, for being my mentor, for supporting my work, and for reassuring me that everything will be just fine every time we talked on the phone. Thanks to Don Slutz for being a wonderful mentor and friend, and for being in touch during the difficult times. Thanks to all the Microsoft Researcch and SQL Server group for an educating and fun summer of ‘99. Thanks to Bruce Lindsay for giving me his pearls of wisdom about the details of DB2, and to Laura Haas for encouraging me to make the right decisions. Thanks to Gary Valentin for being so responsive with my questions about DB2 benchmarking. Thanks to all the people at IBM Almaden and the Toronto lab for hosting my talks and for their interest in my work.
ix
Thanks to Kim Keeton and Anne-Marie Maynard for being the first authors in the two papers that inspired my research. In particular, thanks to Kim for sending me her thesis, answering all my questions, and being a great colleague and friend. Thanks to Renée Miller for being so supportive and for her hospitality and friendship during my visit to Toronto. Thanks to Bolo (Josef Burger) for making the Alpha release possible, and thanks to Glenn Ammons for the run-pic code. Thanks to Seckin Unlu and Andy Glew for answering all my questions and for helping me decipher the Pentium counters. Also thanks to my dear friend Nikos Hardavellas for helping me understand the Alpha processor cache hierarchy. Thanks to Michael Koster, Bill Gray, Philip Mucci and the PAPI group for their significant help in the last chapter of my thesis. Thanks to Christos Faloutsos for applying his data mining techniques on my data. Thanks to NCR for funding this research through a graduate student fellowship, Intel for donating one of the computers, and the department, and the Computer Science Department Lab people for being so responsive in the heavy hardware and software demands of this work. Thanks to my dearest friends Alkis Polyzotis and Leonidas Galanis for taking loving care of me every time I needed them for the past three years. Thanks to Stratis Viglas and Marios Skounakis who, along with Leonidas and Alkis, made me smile every day during the difficult last three months. And, thanks to my wonderful partner, Babak Falsafi, for always being there for me.
1
Chapter 1
Introduction "Databases are the bricks of cyberspace." Jim Gray
Database management systems (DBMSs) are currently used as the supporting back-end for a large number of internet applications, such as e-commerce, banking systems, and digital libraries. Database applications, as projected by the Dataquest server market studies [53], today are the dominant commercial software running on high-end enterprise servers. A recent survey [56] performed on a variety of organizations (manufacturing, government, health care, education, etc.), showed that 48% of the servers were used to run database applications.
During the past two decades, database performance research has primarily focused on optimizing I/O performance. The results from this research are being used inside all modern commercial database management systems. In order to hide I/O latencies, today’s storage servers (the DBMS modules responsible for communication with the disks) employ techniques such as coalescing write requests, grouping read requests, and aggressive prefetching. In addition, query processing algorithms such as hash-join and merge-sort employ special schemes that exploit the available amount of memory as much as possible and minimize the disk accesses.
2 On the other hand, database applications are becoming increasingly computation and memory intensive. A VAX 11/780 [20] in 1980 typically had 1MB of main memory, which was too small to hold a client application’s working set. Therefore, the performance bottleneck was the communication between the memory and the disk. The memory in a typical medium to high-end server today is onthe order of gigabytes, and is projected to grow to a terabyte in the next decade. Due to the memory size increase, in the past ten years, much of the data in an application’s working set has migrated into memory, and the performance bottleneck has shifted from the I/O to the communication between the processor and the memory. Even when the critical mass of data for the application resides on the disk, the I/O overlaps successfully with computation; therefore, a needed data page is often found in main memory [8][46]. The decision-support systems database vendors ship today are mostly computation and memory-bound [36].
Modern database servers rely on powerful processors, which are able of executing instructions in parallel and out of the program’s logical order and of performing computations at tremendously high speeds; almost in accordance with Moore’s Law [40], processor speed doubles every two years. On the other hand, memory latency does not follow the same curve [28]. In 1980, the time to fetch a datum from memory was comparable to the time to execute one instruction. Due to the increase in memory size and in processor speed, the memory access times in processor cycles are by three orders of magnitude higher than the average number of cycles a processor needs to execute an instruction. Therefore, the penalty associated with bringing one datum from memory is equivalent to hundreds of lost instruction opportunities (because the processor has become faster, and the memory has become relatively slower).
Research in computer architecture has traditionally used much simpler programs than DBMSs (e.g., SPEC, LINPACK), in order to evaluate new designs and implementations. Nevertheless, one would hope that database applications would fully exploit the architectural innovations, especially since the performance bottleneck has shifted away from the I/O subsystem. Unfortunately, recent studies [33][38][37] on
3 several commercial DBMSs have shown that the hardware behavior of database workloads is suboptimal when compared to scientific workloads, and the results indicate that further analysis is required to identify the real performance bottlenecks.
Ideally, one could analyze database behavior by acquiring the source code of a representative database system, running it with a representative workload on a representative computer, and use an accurate model of the processor and memory system to perform precise measurements and discover the performance bottlenecks. Unfortunately, commercial database systems differ in design and implementation, their source code is not public, and their behavior varies depending on the workload. Similarly, there is no “representative” processor and memory subsystem, and the accurate hardware models are vendor proprietary information. Finally, there are two ways to monitor the behavior: simulation and measurement (explained further in Section 1.4). Simulation does not represent a real system, and measurement methods are not always straightforward.
My thesis is that — despite the above restrictions — we can understand the bottlenecks of the interaction between the database system and the hardware by studying
•
the behavior of more than one commercial DBMS on the same hardware platform, and
•
the behavior of the same DBMS on different hardware platforms.
The former is important in order to identify general trends that hold true across database systems and to determine what problems we must work on to make database systems run faster. The latter is important in order to compare competing processor and memory system design philosophies, and to determine which of the architectural design parameters are most crucial to database performance.
4 The primary contributions of this dissertation are (a) to introduce a novel approach towards identifying performance bottlenecks in database workloads by studying their hardware behavior, (b) to improve database performance by redesigning data placement in an architecture-conscious fashion, and (c) to identify the hardware design details that most influence database performance.
The rest of this section motivates and describes the contributions of this thesis. Section 1.1 describes the model we used to analyze the hardware behavior of commercial database systems on a modern processor, and outlines the major results. Section 1.2 outlines a novel, cache-conscious data page layout for storing relations on the disk. Section 1.3 briefly presents the motivation and major insights drawn from analyzing the behavior of a prototype database system on multiple processors. Section 1.4 discusses the measurement vs. simulation trade-off and justifies our choice to use the processor performance counters to conduct all the experiments presented in this thesis. Finally, Section 1.5 describes the overall thesis organization.
1.1 A Model for Commercial Database Execution Time The first part of this thesis introduces an execution model for database workloads, and uses it to generate and study the execution time breakdown of four commercial DBMSs (whose names are withheld to meet licence restrictions) on the same hardware platform (a 6400 PII Xeon/MT Workstation running Windows NT v4.0). The model is based on the observation that the elapsed time from query submission until the DBMS returns results consists of two components: the time that the processor performs useful computation and the time that the processor is stalled because it is waiting for an event to occur. Assuming there is no I/ O involved, the stall time is further divided into three components:
•
Memory-related stall time, during which the processor is waiting for data or instructions to arrive from the memory subsystem.
5 •
Branch misprediction stall time that is due to branch misprediction related penalties.
•
Stall time due to data dependencies and unavailability of execution resources.
We apply this model on a workload that consists of range selections and joins running on a memory resident database. We chose a workload composed of simple queries, because (a) they isolate basic query processing functions (such as sequential scans, indexed scans, and joins) that are used during processing of more complex queries, and (b) when executing such queries, we expect minimal variation in the algorithms invoked across different DBMSs. Therefore, the workload is ideal to isolate basic operations and identify common trends across the DBMSs.
The conclusion is that, even when executing simple queries, almost half of the execution time is spent in stalls. Analysis of the stall time components provides more insight about the operation of the cache as the record size and the selectivity are varied. The nature of the workload helped to partially overcome the lack of access to the DBMS source code, because database operations are more predictable when running simple queries than when using complex benchmarks. The results show that:
•
On the average, half the execution time is spent in stalls (implying database designers can improve DBMS performance significantly by attacking stalls).
•
In all cases, 90% of the memory stalls are due to second-level cache misses when accessing data, and first-level cache misses when accessing instructions.
•
About 20% of the stalls are caused by subtle implementation details (e.g., branch mispredictions), implying that there is no “silver bullet” for mitigating stalls.
6 In addition, we conclude that using simple queries rather than full decision-support workloads provides a methodological advantage, because results are simpler to analyze and yet are substantially similar to the results obtained using full benchmarks. To verify this, we implemented and ran a decision-support benchmark on three of the four systems, and the results are similar to those obtained using simpler queries.
1.2 PAX: A Cache-Conscious Data Page Layout One of the most significant conclusions from the first part of this thesis is that data accesses to the second-level cache are a major database performance bottleneck when executing on a processor with a twolevel cache hierarchy. The reason is that a miss to the second-level cache always results in a request to main memory, and the time needed to fetch data from main memory is one to two orders of magnitude higher than the time needed to access in-cache data. However, the processor must fetch data from main memory upon a cache miss, i.e., if it fails to find the data in the cache; therefore, the use of the cache should be maximized.
Spatial data locality is an important factor when dealing with cache performance [28]. Cache-conscious data layout increases spatial data locality and effectively reduces cache misses. Upon a request for an item, a cache will transfer a fixed-length aligned block (or line) from main memory. Depending on the cache design, the length of the cache block typically varies from 16 to 128 bytes. However, the application may only need a small fraction of the data in the block. Loading the cache with useless data (a) wastes bandwidth and (b) pollutes the cache with useless data, while possibly forcing replacement of other data that may be needed in the future.
The traditional page layout scheme in database management systems is the N-ary Storage Model (NSM, a.k.a., slotted pages). NSM stores records contiguously starting from the beginning of each disk page, and
7 uses an offset (slot) table at the end of a page to find where each record starts [47]. However, most query operators access only part of the record, i.e., a fraction of each NSM page brought into the buffer pool is really used. To minimize unnecessary I/O, the decomposition storage model (DSM) [15] partitions an nattribute relation vertically into n sub-relations, each of which is only used when the attribute is needed. Although DSM saves I/O and increases main memory utilization, it is not the dominant page layout scheme, mainly because in order to reconstruct a record, one must perform expensive joins on the participating sub-relations. All of today’s commercial database systems still use the traditional NSM algorithm for data placement [36][52][61].
NSM exhibits suboptimal cache behavior. For instance, if the record size is greater than the cache block size, it is likely that a sequential scan for a certain attribute will miss the cache and access main memory once for every record in the relation. On today’s processors, each cache miss is equivalent to hundreds of lost instruction opportunities. In addition, each ‘read’ will bring into the cache several useless values along with the one requested. The challenge is to improve NSM’s cache behavior, without compromising its advantages over DSM.
The second part of this thesis introduces and evaluates Partition Attributes Across (PAX), a new layout for data records that injects into NSM a cache performance improvement at the page level. For a given relation R, PAX stores the same data on each page as NSM (or more, because PAX incurs less storage penalty). The difference is that within each page, PAX groups all the values of a particular attribute together on a minipage. Therefore, when applying a predicate to an attribute, the cache performance of PAX is significantly better than NSM' s. At the same time, all parts of the record are in a single page, so the reconstruction cost is minimal (because PAX performs “vertical partitioning within the page”).
8 We evaluated PAX against NSM and DSM using (a) predicate selection queries on numeric data and (b) a variety of decision-support queries on top of the Shore storage manager [10]. Query parameters varied include selectivity, projectivity, number of predicates, distance between the projected attribute and the attribute in the predicate, and degree of the relation. The results show that, when compared to NSM, PAX (a) incurs 50-75% fewer second-level cache misses due to data accesses, (b) executes queries in 17%-25% less elapsed time, and (c) executes TPC-H queries involving I/O in 11%-40% less time than NSM. When compared to DSM, PAX (a) exhibits better cache performance, (b) executes queries consistently faster because it incurs no record reconstruction cost, and (c) exhibits stable execution time as selectivity, projectivity, and the number of attributes in predicate vary, where the execution time of DSM increases linearly to these parameters.
In addition to these improvements, PAX has several other advantages as well. Research [22] has shown that compression algorithms work better with vertically partitioned relations and on a per-page basis. In addition, PAX is orthogonal to other storage decisions such as affinity graph based partitioning [16]. Furthermore, it is transparent to the rest of the database system. The storage manager can decide to use PAX or not when storing a relation, based solely on the number of attributes. As a disadvantage, PAX requires more complicated memory and space manipulation algorithms for record insertion, deletion, and update.
1.3 Porting Shore on Four Systems: Where Is My Dream Machine? Although today’s processors follow the same sequence of logical operations when executing a program, there are internal implementation details that critically affect the processor’s performance. Different hardware platforms exhibit variations in the internal design and implementation of the execution engine and the memory subsystem (microarchitecture) as well as in the instruction set implemented inside the processor
9 for interaction with the software (architecture). The third part of this thesis studies the impact of processor design on the performance of database workloads on a variety of hardware platforms, using range selection and decision-support queries on top of the Shore storage manager.
The analysis across four commercial database systems from the first part of this thesis indicates that design decisions in both the processor’s execution engine and the memory subsystem significantly affect performance when running database queries. For this study, we had access to four platforms that exhibit different designs in both areas:
•
The Sun UltraSparc-II and UltraSparc-IIi execute instructions in logical program order, and feature a two-level cache hierarchy in which all first-level cache contents are guaranteed to be included into the second-level cache as well (i.e., it maintains “inclusion” for both instructions and data). The two processors belong to the same basic RISC architecture and microarchitecture, but their memory subsystems exhibit interesting design variations that are exposed when executing the same workload.
•
The Intel Pentium II Xeon processor is the same as the one used in the previous two parts of this thesis. It is a CISC, out-of-order processor with an aggressive branch prediction mechanism, and a two-level cache hierarchy that does not maintain inclusion.
•
The Compaq Alpha 21164 is a RISC processor with an in-order execution engine and a three-level cache hierarchy that maintains inclusion only for data.
The results from the study indicate that several processor and memory system characteristics are likely to significantly improve performance. In particular, (a) an out-of-order processor would overlap stalls more aggressively, especially if combined with an execution engine that can execute more than one load/store operation per processor cycle, (b) a high-accuracy branch-prediction mechanism is critical to eliminate
10 stall time due to branch mispredictions that, as shown in the first part, increase the instruction cache misses as well and (c) a high-associativity, non-inclusive cache hierarchy with large data blocks will exploit spatial locality of data provided by placement techniques like PAX.
1.4 A Note on Methodology: Measurement Vs. Simulation As computer systems become increasingly complex, it becomes important to fully evaluate them with a broad variety of workloads. To evaluate computer architectures and characterize workloads, researchers have traditionally employed simulation techniques. Simulation offers an arbitrary level of detail, and one can tweak virtually any parameter in order to study the implications of alternative architectural designs. Simulation, however, cannot effectively characterize database workloads on modern platforms for two reasons:
1. Recent architectural designs are too complex to simulate reliably, especially when their execution engines are out-of-order. In addition, detailed processor models are typically withheld by the companies as proprietary information. Consequently, the few simulators publicly available model a hypothetical architecture that does not exactly correspond to any of the existing platforms.
2. In the best case, executing a program on a simulator typically takes at least three orders of magnitude longer than executing the same program on the real machine. Increasing the number of processors, executing in out-of-order mode, and running workloads that stress the system resources further increases the simulation time. Database systems have long initialization times and the workloads heavily use the system’s resources (e.g., CPU, memory, disks). Previous research results on database workloads running on simulated machines rely on scaled-down datasets, or on parts of workload exe-
11 cution, or both. Typically queries run through several phases of execution, while may not be captured when simulating a fraction of the instruction trace or a scaled-down workload [32].
Despite these problems, researchers still use simulation techniques to evaluate alternative architectures, because simulation is the only way to study the effect of varying one architectural parameter while keeping the rest of the configuration unchanged. The best way, on the other hand, to characterize a workload without modifying any architectural parameters is to take measurements on the real platform.
Modern processors include hardware performance counters, which are counting registers that placed on strategic positions on the hardware execution path. A counter that is associated with a certain event type (for example, a first-level cache miss) counts occurrences of that event type. Counters are being used extensively by performance groups for evaluation of new architectural designs, and recently there has been public-domain software available to access the counter values. The insights drawn in this thesis are based on experiments that employ the hardware counters available on all the processors we studied.
1.5 Thesis Organization Chapter 2 presents the model for evaluating database workload by studying the hardware behavior on a modern processor platform, and discusses the behavior of four commercial database management systems when running a set of basic queries. Chapter 3 discusses PAX, a new data placement technique that optimizes memory accesses and improves query performance. Chapter 4 evaluates database software behavior on top of various microarchitectural designs across four different systems using a decision-support workload on top of a prototype database system, and elaborates on the impact of the different designs on database performance. Finally, Chapter 5 concludes the thesis with a summary of results.
12
Chapter 2
DBMSs On A Modern Processor: Where Does Time Go? Recent high-performance processors employ sophisticated techniques to overlap and simultaneously execute multiple computation and memory operations. Intuitively, these techniques should help database applications, which are becoming increasingly compute and memory bound. Unfortunately, recent studies report that faster processors do not improve database system performance to the same extent as scientific workloads. Recent work on database systems focusing on minimizing memory latencies, such as cacheconscious algorithms for sorting and data placement, is one step toward addressing this problem. However, to best design high performance DBMSs we must carefully evaluate and understand the processor and memory behavior of commercial DBMSs on today’s hardware platforms.
In this chapter we answer the question “Where does time go when a database system is executed on a modern computer platform?” We examine four commercial DBMSs running on an Intel Xeon and NT 4.0. We introduce a framework for analyzing query execution time on a DBMS running on a server with a modern processor and memory architecture. To focus on processor and memory interactions and exclude effects from the I/O subsystem, we use a memory resident database. Using simple queries we find that database developers should (a) optimize data placement for the second level of data cache, and not the first, (b) optimize instruction placement to reduce first-level instruction cache stalls, but (c) not expect the over-
13 all execution time to decrease significantly without addressing stalls related to subtle implementation issues (e.g., branch prediction).
The rest of this chapter is organized as follows: Section 2.1 presents a summary of recent database workload characterization studies and an overview of the cache performance improvements proposed. Section 2.2 describes the vendor-independent part of this study: an analytic framework for characterizing the breakdown of the execution time and the database workload. Section 2.3 describes the experimental setup, Section 2.4 presents our results, and finally, Section 2.5 concludes.
2.1 Previous work Much of the related research has focused on improving the query execution time, mainly by minimizing the stalls due to memory hierarchy when executing an isolated task. There are a variety of algorithms for fast sorting techniques [5][35][45] that propose optimal data placement into memory and sorting algorithms that minimize cache misses and overlap memory-related delays. In addition, several cache-conscious techniques such as blocking, data partitioning, loop fusion, and data clustering were evaluated [35]] and found to improve join and aggregate queries. Each of these studies is targeted to a specific task and concentrate on ways to make it faster.
The first hardware evaluation of a relational DBMS running an on-line transaction processing (OLTP) workload [57] concentrated on multiprocessor system issues, such as assigning processes to different processors to avoid bandwidth bottlenecks. Contrasting scientific and commercial workloads [38] using TPCA and TPC-C on another relational DBMS showed that commercial workloads exhibit large instruction footprints with distinctive branch behavior, typically not found in scientific workloads, and that they bene-
14 fit more from large first-level caches. Another study [49] showed that, although I/O can be a major bottleneck, the processor is stalled 50% of the time due to cache misses when running OLTP workloads.
In the past two years, several interesting studies evaluated database workloads, mostly on multiprocessor platforms. Most of these studies evaluate OLTP workloads [19][37][33], a few evaluate decision support (DSS) workloads [58]] and there are some studies that use both [6][48]. All of the studies agree that the DBMS behavior depends upon the nature of the workload (DSS or OLTP), that DSS workloads benefit more from out-of-order processors with increased instruction-level parallelism than OLTP, and that memory stalls are a major bottleneck. Although the list of references presented here is not exhaustive, it is representative of the work done in evaluating database workloads. Each of these studies presents results from a single DBMS running a TPC benchmark on a single platform, which makes contrasting the DBMSs and identifying common characteristics difficult.
2.2 Query Execution on Modern Processors In this section, we describe a framework that describes how major hardware components determine execution time. The framework analyzes the hardware behavior of the DBMS from the moment it receives a query until the moment it returns the results. Then, we describe a workload that allows us to focus on the basic operations of the DBMSs in order to identify the hardware components that cause execution bottlenecks.
2.2.1 Query Execution Time: A Processor Model
To determine where the time goes during execution of a query, we must understand how a processor works. The pipeline is the basic module that receives an instruction, executes it and stores its results into
15 memory. The pipeline works in a number of sequential stages, each of which involves a number of functional components. An operation at one stage can overlap with operations at other stages.
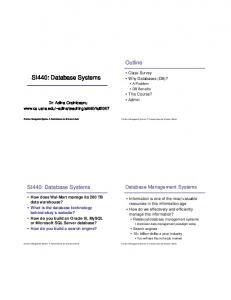
Figure 2.1 shows a simplified diagram of the major pipeline stages of a processor similar to the Pentium II [19][31]. First, the FETCH/DECODE unit reads the user program instructions from the instruction cache (L1 I-cache), decodes them and puts them into an instruction pool. The DISPATCH/EXECUTE unit schedules execution of the instructions in the pool subject to data dependencies and resource availability, and temporarily stores their results. Finally, the RETIRE unit knows how and when to commit (retire) the temporary results into the data cache (L1 D-cache).
In some cases, an operation may not be able to complete immediately and delay (“stall”) the pipeline. The processor tries to cover the stall time by doing useful work, using the following techniques:
•
Non-blocking caches: Caches do not block when servicing requests. For example, if a read request to one of the first-level caches fails (misses), the request is forwarded to the second-level cache (L2 cache), which is usually unified (used for both data and instructions). If the request misses in L2 as well, it is forwarded to main memory. During the time the retrieval is pending, the caches at both levels can process other requests.
•
Out-of-order execution: If instruction X stalls, another instruction Y that follows X in the program can execute before X, provided that Y’s input operands do not depend on X’s results. The dispatch/execute unit contains multiple functional units to perform out-of-order execution of instructions.
•
Speculative execution with branch prediction: Instead of waiting until a branch instruction’s predicate is resolved, an algorithm “guesses” the predicate and fetches the appropriate instruction stream. If the guess is correct, the execution continues normally; if it is wrong, the pipeline is flushed, the retire unit
16
INSTRUCTION POOL
FETCH DECODE UNIT
DISPATCH EXECUTE UNIT
RETIRE UNIT TC+TB+TR
L1 I-CACHE
L1 D-CACHE L2 CACHE
TM
FIGURE 2.1. Simplified block diagram of processor operation. deletes the wrong results and the fetch/decode unit fetches the correct instruction stream. Branch mispredictions incur both computation overhead (time spent in computing the wrong instructions), and stall time.
Even with these techniques, the stalls cannot be fully overlapped with useful computation. Thus, the time to execute a query (TQ) includes a useful computation time (TC), a stall time because of memory stalls (TM), a branch misprediction overhead (TB), and resource-related stalls (TR). The latter are due to execution resources not being available, such as functional units, buffer space in the instruction pool, or registers. As discussed above, some of the stall time can be overlapped (TOVL). Thus, the following equation holds:
TQ = TC + TM + TB + TR - TOVL Table 2.1 shows the time breakdown into smaller components. The DTLB and ITLB (Data or Instruction Translation Lookaside Buffer) are page table caches used for translation of data and instruction virtual addresses into physical ones. The next section briefly discusses the importance of each stall type and how
17 easily it can be overlapped using the aforementioned techniques. A detailed discussion on hiding stall times can be found elsewhere [19].
TABLE 2.1: Execution time components Component Name
Component Description
TC
computation time
TM
stall time related to memory hierarchy
TL1D
stall time due to L1 D-cache misses (with hit in L2)
TL1I
stall time due to L1 I-cache misses (with hit in L2)
TL2
TL2D TL2I
stall time due to L2 data misses stall time due to L2 instruction misses
TDTLB
stall time due to DTLB misses
TITLB
stall time due to ITLB misses
TB
branch misprediction penalty
TR
resource stall time
TFU
stall time due to functional unit unavailability
TDEP
stall time due to dependencies among instructions
TMISC
stall time due to platform-specific characteristics
2.2.2 Significance of the stall components
Previous work has focused on improving DBMS performance by reducing TM, the memory hierarchy stall component. In order to be able to use the experimental results effectively, it is important to determine the contribution each of the different types of stalls makes to the overall execution time. Although out-oforder and speculative execution help hide some of the stalls, there are some stalls that are difficult to overlap, and thus are the most critical for performance.
It is possible to overlap TL1D if the number of L1 D-cache misses is not too high. Then the processor can fetch and execute other instructions until the data is available from the second-level cache. The more L1 D-
18 cache misses that occur, the more instructions the processor must execute to hide the stalls. Stalls related to L2 cache data misses can overlap with each other, when there are sufficient parallel requests to main memory. TDTLB can be overlapped with useful computation as well, but a DTLB miss penalty depends on the page table implementation for each processor. Processors successfully use sophisticated techniques to overlap data stalls with useful computation.
Instruction-related cache stalls, on the other hand, are difficult to hide because they cause a serial bottleneck to the pipeline. If there are no instructions available, the processor must wait. Branch mispredictions also create serial bottlenecks; the processor again must wait until the correct instruction stream is fetched into the pipeline. The Xeon processor exploits spatial locality in the instruction stream with special instruction-prefetching hardware. Instruction prefetching effectively reduces the number of I-cache stalls, but occasionally it can increase the branch misprediction penalty.
Although related to instruction execution, TR (the resource stall time) is easier to overlap than TITLB and instruction cache misses. The processor can hide TDEP depending on the degree of instruction-level parallelism of the program, and can overlap TFU with instructions that use functional units with less contention.
2.2.3 Database workload
The workload used in this study consists of single-table range selections and two table equijoins over a memory resident database, running a single command stream. Such a workload eliminates dynamic and random parameters, such as concurrency control among multiple transactions, and isolates basic operations, such as sequential access and index selection. In addition, it allows examination of the processor and memory behavior without I/O interference. Thus, it is possible to explain the behavior of the system with reasonable assumptions and identify common trends across different DBMSs.
19 The database contains one basic table, R, defined as follows:
create table R(a1 integer not null, a2 integernot null, a3integernot null, ) In this definition, stands for a list of integers that is not used by any of the queries. The relation is populated with 1.2 million 100-byte records. The values of the field a2 are uniformly distributed between 1 and 40,000. The experiments run three basic queries on R:
1. Sequential range selection:
select avg(a3) from R where a2 < Hi and a2 > Lo
(1)
The purpose of this query is to study the behavior of the DBMS when it executes a sequential scan, and examine the effects of record size and query selectivity. Hi and Lo define the interval of the qualification attribute, a2. The reason for using an aggregate, as opposed to just selecting the rows, was twofold. First, it makes the DBMS return a minimal number of rows, so that the measurements are not affected by client/server communication overhead. Storing the results into a temporary relation would affect the measurements because of the extra insertion operations. Second, the average aggregate is a common operation in the TPC-D benchmark. The selectivity used was varied from 0% to 100%. Unless otherwise indicated, the query selectivity used is 10%.
2. Indexed range selection: The range selection (1) was resubmitted after constructing a non-clustered index on R.a2. The same variations on selectivity were used.
20 3. Sequential join: To examine the behavior when executing an equijoin with no indexes, the database schema was augmented by one more relation, S, defined the same way as R. The field a1 is a primary key in S. The query is as follows:
select avg(R.a3) from R, S where R.a2 = S.a1
(2)
There are 40,000 100-byte records in S, each of which joins with 30 records in R.
2.3 Experimental Setup We used a 6400 PII Xeon/MT Workstation to conduct all of the experiments. We use the hardware counters of the Pentium II Xeon processor to run the experiments at full speed, to avoid any approximations that simulation would impose, and to conduct a comparative evaluation of the four DBMSs. This section describes the platform-specific hardware and software details, and presents the experimental methodology.
2.3.1 The hardware platform
The system contains one Pentium II Xeon processor running at 400 MHz, with 512 MB of main memory connected to the processor chip through a 100 MHz system bus. The Pentium II is a powerful server processor with an out-of-order engine and speculative instruction execution [18]. The X86 instruction set is composed by CISC instructions, and they are translated into a stream of micro-operations (µops) each at the decode phase of the pipeline.
21 TABLE 2.2: Pentium II Xeon cache characteristics Characteristic Cache size
L1 (split)
L2 (Unified)
16KB Data 16KB Instruction
512KB
32 bytes
32 bytes
Associativity
4-way
4-way
Miss Penalty
4 cycles (w/ L2 hit)
Main memory latency
Yes
Yes
4
4
L1-D: Write-back L1-I: Read-only
Write-back
Cache line size
Non-blocking Misses outstanding Write Policy
There are two levels of non-blocking cache in the system. There are separate first-level caches for instructions and data, whereas at the second level the cache is unified. The cache characteristics are summarized in Table 2.2.
2.3.2 The software
Experiments were conducted on four commercial DBMSs, the names of which cannot be disclosed here due to legal restrictions. Instead, we will refer to them as System A, System B, System C, and System D. They were installed on Windows NT 4.0 Service Pack 4.
The DBMSs were configured the same way in order to achieve as much consistency as possible. The buffer pool size was large enough to fit the datasets for all the queries. We used the NT performance-monitoring tool to ensure that there was no significant I/O activity during query execution, because the objective is to measure pure processor and memory performance. In addition, we wanted to avoid measuring the I/O subsystem of the OS. To define the schema and execute the queries, the exact same commands and datasets were used for all the DBMSs, with no vendor-specific SQL extensions.
22 2.3.3 Measurement tools and methodology
The Pentium II processor provides two counters for event measurement [31]. We used emon, a tool provided by Intel, to control these counters. Emon can set the counters to zero, assign event codes to them and read their values either after a pre-specified amount of time, or after a program has completed execution. For example, the following command measures the number of retired instructions during execution of the program prog.exe, at the user and the kernel level:
emon –C ( INST_RETIRED:USER, INST_RETIRED:SUP ) prog.exe
Emon was used to measure 74 event types for the results presented in this report. We measured each event type in both user and kernel mode.
Before taking measurements for a query, the main memory and caches were warmed up with multiple runs of this query. In order to distribute and minimize the effects of the client/server startup overhead, the unit of execution consisted of 10 different queries on the same database, with the same selectivity. Each time emon executed one such unit, it measured a pair of events. In order to increase the confidence intervals, the experiments were repeated several times and the final sets of numbers exhibit a standard deviation of less than 5 percent. Finally, using a set of formulae1, these numbers were transformed into meaningful performance metrics.
Using the counters, we measured each of the stall times described in Section 3.1 by measuring each of their individual components separately. The application of the framework to the experimental setup suffers the following caveats: 1.
Seckin Unlu and Andy Glew provided us with invaluable help in figuring out the correct formulae, and Kim Keeton shared with us the ones used in [33].
23 TABLE 2.3: Method of measuring each of the stall time components Stall time component
Estimated minimum based on µops retired
TL1D
L1 D-cache stalls
#misses * 4 cycles
TL1I
L1 I-cache stalls
actual stall time
TL2D
L2 data stalls
#misses * measured memory latency
TL2I
L2 instruction stalls
#misses * measured memory latency
TDTLB
DTLB stalls
Not measured
TITLB
ITLB stalls
#misses * 32 cycles
branch misprediction penalty
# branch mispredictions retired * 17 cycles
TFU
functional unit stalls
actual stall time
TDEP
dependency stalls
actual stall time
TILD
Instruction-length decoder stalls
actual stall time
overlap time
Not measured
TL2
TB TR
Measurement method
computation time
TC TM
Description
TOVL
•
We were not able to measure TDTLB, because the event code is not available.
•
The Pentium II event codes allow measuring the number of occurrences for each event type (e.g., number of L1 instruction cache misses) during query execution. In addition, we can measure the actual stall time due to certain event types (after any overlaps). For the rest, we multiplied the number of occurrences by an estimated penalty [21][59]. Table 2.3 shows a detailed list of stall time components and the way they were measured. Measurements of the memory subsystem strongly indicate that the workload is latency-bound, rather than bandwidth-bound (it rarely uses more than a third of the available memory bandwidth). In addition, past experience [21][59] with database applications has shown little queuing of requests in memory. Consequently, we expect the results that use penalty approximations to be fairly accurate.
•
No contention conditions were taken into account.
24 TMISC from Table 2.1 (stall time due to platform-specific characteristics) has been replaced with TILD (instruction-length decoder stalls) in Table 2.3. Instruction-length decoding is one stage in the process of translating X86 instructions into µops.
2.4 Results We executed the workload described in Section 3 on four commercial database management systems. In this section, we first present an overview of the execution time breakdown and discuss some general trends. Then, we focus on each of the important stall time components and analyze it further to determine the implications from its behavior. Finally, we compare the time breakdown of our microbenchmarks against a TPC-D and a TPC-C workload. Since almost all of the experiments executed in user mode more than 85% of the time, all of the measurements shown in this section reflect user mode execution, unless stated otherwise.
2.4.1 Execution time breakdown
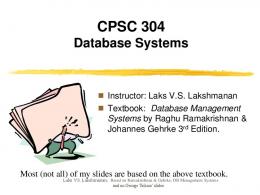
Figure 2.2 shows three graphs, each summarizing the average execution time breakdown for one of the queries. Each bar shows the contribution of the four components (TC, TM, TB, and TR) as a percentage of the total query execution time. The middle graph showing the indexed range selection only includes systems B, C and D, because System A did not use the index to execute this query. Although the workload is much simpler than TPC benchmarks [18], the computation time is usually less than half the execution time; thus, the processor spends most of the time stalled. Similar results have been presented for OLTP [22][49] and DSS [48] workloads, although none of the studies measured more than one DBMS. The high processor stall time indicates the importance of further analyzing the query execution time. Even as pro-
25 10% Indexed Range Sel.
10% Sequential Range Sel. query execution time (%)
Join
100%
100%
80%
80%
80%
60%
60%
60%
40%
40%
40%
20%
20%
20%
0%
0%
0%
100%
A
B
C
D
DBMS Computation
Memory stalls
B
C DBMS
D
Branch Mispredictions
A
B
C
D
DBMS Resource stalls
FIGURE 2.2. Query execution time breakdown into the four time components. cessor clocks become faster, stall times are not expected to become much smaller because memory access times do not decrease as fast. Thus, the computation component will become an even smaller fraction of the overall execution time.
The memory stall time contribution varies more across different queries and less across different database systems. For example, Figure 2.2 shows that when System B executes the sequential range selection, it spends 20% of the time in memory stalls. When the same system executes the indexed range selection, the memory stall time contribution becomes 50%. Although the indexed range selection accesses fewer records, its memory stall component is larger than in the sequential selection, probably because the index traversal has less spatial locality than the sequential scan. The variation in TM’s contribution across DBMSs suggests different levels of platform-specific optimizations. However, as discussed in Section 5.2, analysis of the memory behavior yields that 90% of TM is due to L1 I-cache and L2 data misses in all of the systems measured. Thus, despite the variation, there is common ground for research on improving memory stalls without necessarily having to analyze all of the DBMSs in detail.
26 Minimizing memory stalls has been a major focus of database research on performance improvement. Although in most cases the memory stall time (TM) accounts for most of the overall stall time, the other two components are always significant. Even if the memory stall time is entirely hidden, the bottleneck will eventually shift to the other stalls. In systems B, C, and D, branch misprediction stalls account for 1020% of the execution time, and the resource stall time contribution ranges from 15-30%. System A exhibits the smallest TM and TB of all the DBMSs in most queries; however, it has the highest percentage of resource stalls (20-40% of the execution time). This indicates that optimizing for two kinds of stalls may shift the bottleneck to the third kind. Research on improving DBMS performance should focus on minimizing all three kinds of stalls to effectively decrease the execution time.
2.4.2 Memory stalls
In order to optimize performance, a major target of database research has been to minimize the stall time due to memory hierarchy and disk I/O latencies [5][58][45][51]. Several techniques for cache-conscious data placement have been proposed [12] to reduce cache misses and miss penalties. Although these techniques are successful within the context in which they were proposed, a closer look at the execution time breakdown shows that there is significant room for improvement. This section discusses the significance of the memory stall components to the query execution time, according to the framework discussed in Section 3.2.
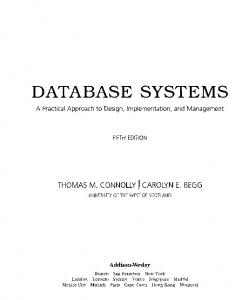
Figure 2.3 shows the breakdown of TM into the following stall time components: TL1D (L1 D-cache miss stalls), TL1I (L1 I-cache miss stalls), TL2D (L2 cache data miss stalls), TL2I (L2 cache instruction miss stalls), and TITLB (ITLB miss stalls) for each of the four DBMSs. There is one graph for each type of query. Each graph shows the memory stall time breakdown for the four systems. The selectivity for range selections shown is set to 10% and the record size is kept constant at 100 bytes.
27 10% Indexed Range Sel.
10% Sequential Range Sel. memory stall time (%)
Join
100%
100%
80%
80%
80%
60%
60%
60%
40%
40%
40%
20%
20%
20%
0%
0%
0%
100%
A
B
C
D
DBMS L1 Data stalls
L2 Data stalls
B
C DBMS
D
L1 Instruction stalls
A
B
C
D
DBMS L2 Instruction stalls
FIGURE 2.3. Contributions of the five memory components to the memory stall time (TM).
From Figure 2.3, it is clear that L1 D-cache stall time is insignificant. In reality its contribution is even lower, because our measurements for the L1 D-cache stalls do not take into account the overlap factor, i.e., they are upper bounds. An L1 D-cache miss that hits on the L2 cache incurs low latency, which can usually be overlapped with other computation. Throughout the experiments, the L1 D-cache miss rate (number of misses divided by the number of memory references) usually is around 2%, and never exceeds 4%. A study on Postgres95 [58] running TPC-D also reports low L1 D-cache miss rates. Further analysis indicates that during query execution the DBMS accesses private data structures more often than it accesses data in the relations. This often-accessed portion of data fits into the L1 D-cache, and the only misses are due to less often accessed data. The L1 D-cache is not a bottleneck for any of the commercial DBMSs we evaluated.
The stall time caused by L2 cache instruction misses (TL2I) and ITLB misses (TITLB) is also insignificant in all the experiments. TL2I contributes little to the overall execution time because the second-level cache misses are two to three orders of magnitude less than the first-level instruction cache misses. The low TITLB indicates that the systems use few instruction pages, and the ITLB is enough to store the translations for their addresses.
28 The rest of this section discusses the two major memory-related stall components, TL2D and TL1I.
2.4.3 Second-level cache data stalls
For all of the queries run across the four systems, TL2D (the time spent on L2 data stalls) is one of the most significant components of the execution time. In three out of four DBMSs, the L2 cache data miss rate (number of data misses in L2 divided by number of data accesses in L2) is typically between 40% and 90%, therefore much higher than the L1 D-cache miss rate. The only exception is System B, which exhibits optimized data access performance at the second cache level as well. In the case of the sequential range query, System B exhibits far fewer L2 data misses per record than all the other systems (B has an L2 data miss rate of only 2%), consequently its TL2D is insignificant. The stall time due to L2 cache data misses directly relates to the position of the accessed data in the records and the record size. As the record size increases, TL2D increases as well for all four systems (results are not shown graphically due to space restrictions). The two fields involved in the query, a2 and a3, are always in the beginning of each record, and records are stored sequentially. For larger record sizes, the fields a2 and a3 of two subsequent records are located further apart and the spatial locality of data in L2 decreases.
Second-level cache misses are much more expensive than the L1 D-cache misses, because the data has to be fetched from main memory. Generally, a memory latency of 60-70 cycles was observed. As discussed in Section 3.2, multiple L2 cache misses can overlap with each other. Since we measure an upper bound of TL2D (number of misses times the main memory latency), this overlap is hard to estimate. However, the real TL2D cannot be significantly lower than our estimation because memory latency, rather than bandwidth, bind the workload (most of the time the overall execution uses less than one third of the available
29 memory bandwidth). As the gap between memory and processor speed increases, one expects data access to the L2 cache to become a major bottleneck for latency-bound workloads. The size of today’s L2 caches has increased to 8 MB, and continues to increase, but larger caches usually incur longer latencies. The Pentium II Xeon on which the experiments were conducted can have an L2 cache up to 2 MB [18] (although the experiments were conducted with a 512-KB L2 cache).
2.4.4 First-level cache instruction stalls
Stall time due to misses at the first-level instruc-
nent for three out of four DBMSs. The results in this study reflect the real I-cache stall time, with no approximations. Although the Xeon uses stream buffers for instruction prefetching, L1 I-misses are still a bottleneck, despite previous results [6] that
Instructions retired/record
tion cache (TL1I) is a major memory stall compo-
16000
12000
SRS IRS SJ
8000
4000
0 A
B
DBMS
C
D
show improvement of TL1I when using stream buff- FIGURE 2.4. Number of instructions retired per record for all four DBMSs. SRS: sequential selection ers on a shared memory multiprocessor. As (instructions/number of records in R), IRS: indexed selection (instructions/number of selected records), explained in Section 3.2, TL1I is difficult to overlap, SJ: join (instructions/number of records in R). because L1 I-cache misses cause a serial bottleneck to the pipeline. The only case where TL1I is insignificant (5%) is when System A executes the sequential range query. For that query, System A retires the lowest number of instructions per record of the four systems tested, as shown in Figure 2.4. For the other systems TL1I accounts for between 4% and 40% of the total execution time, depending on the type of the query and the DBMS. For all DBMSs, the average contribution of TL1I to the execution time is 20%.
30 There are some techniques to reduce the I-cache stall time [19] and use the L1 I-cache more effectively. Unfortunately, the first-level cache size is not expected to increase at the same rate as the second-level cache size, because large L1 caches are not as fast and may slow down the processor clock. Some new processors use a larger (64-KB) L1 I-cache that is accessed through multiple pipeline stages, but the trade-off between size and latency still exists. Consequently, the DBMSs must improve spatial locality in the instruction stream. Possible techniques include storing together frequently accessed instructions while pushing instructions that are not used that often, like error-handling routines, to different locations.
An additional, somewhat surprising, observation was that increasing data record size increases L1 Icache misses (and, of course, L1 D-cache misses). It is natural that larger data records would cause both more L1 and L2 data misses. Since the L2 cache is unified, the interference from more L2 data misses could cause more L2 instruction misses. But how do larger data records cause more L1 instruction misses? On certain machines, an explanation would be inclusion (i.e., an L1 cache may only contain blocks present in an L2 cache). Inclusion is often enforced by making L2 cache replacements force L1 cache replacements. Thus, increased L2 interference could lead to more L1 instruction misses. The Xeon processor, however, does not enforce inclusion. Another possible explanation is interference of the NT operating system [59]. NT interrupts the processor periodically for context switching, and upon each interrupt the contents of L1 I-cache are replaced with operating system code. As the DBMS resumes execution, it fetches its instructions back into the L1 I-cache. As the record size varies between 20 and 200 bytes, the execution time per record increases by a factor of 2.5 to 4, depending on the DBMS. Therefore, larger records incur more operating system interrupts and this could explain increased L1 I-cache misses. Finally, a third explanation is that larger records incur more frequent page boundary crossings. Upon each crossing the DBMS executes buffer pool management instructions. However, more experiments are needed to test these hypotheses.
31 25%
% of query execution time
branch misprediction rates
20%
20%
SRS IRS SJ
15%
10%
5%
0%
Branch mispred. stalls L1 I-cache stalls 15%
10%
5%
0% A
B
C DBMS
D
0%
1%
5% 10% selectivity
50%
100%
FIGURE 2.5. Left: Branch misprediction rates. SRS: sequential selection, IRS: indexed selection, SJ: join. Right: System D running a sequential selection. TB and TL1I both increase as a function of an increase in the selectivity.
2.4.5 Branch mispredictions
As was explained in Section 3.2, branch mispredictions have serious performance implications, because (a) they cause a serial bottleneck in the pipeline and (b) they cause instruction cache misses, which in turn incur additional stalls. Branch instructions account for 20% of the total instructions retired in all of the experiments.
Even with our simple workload, three out of the four DBMSs tested suffer significantly from branch misprediction stalls. Branch mispredictions depend upon how accurately the branch prediction algorithm predicts the instruction stream. The branch misprediction rate (number of mispredictions divided by the number of retired branch instructions) does not vary significantly with record size or selectivity in any of the systems. The average rates for all the systems are shown in the left graph of Figure 2.5.
32 The branch prediction algorithm uses a small buffer, called the Branch Target Buffer (BTB) to store the targets of the last branches executed. A hit in this buffer activates a branch prediction algorithm, which decides which will be the target of the branch based on previous history [60]. On a BTB miss, the prediction is static (backward branch is taken, forward is not taken). In all the experiments the BTB misses 40% of the time on the average (this corroborates previous results for TPC workloads [23]). Consequently, the sophisticated hardware that implements the branch prediction algorithm is only used half of the time. In addition, as the BTB miss rate increases, the branch misprediction rate increases as well. It was shown [29] that a larger BTB (up to 16K entries) improves the BTB miss rate for OLTP workloads.
As mentioned in Section 3.2, branch misprediction stalls are tightly connected to instruction stalls. For the Xeon this connection is tighter, because it uses instruction prefetching. In all of the experiments, TL1I follows the behavior of TB as a function of variations in the selectivity or record size. The right graph of Figure 2.5 illustrates this for System D running range selection queries with various selectivities. Processors should be able to efficiently execute even unoptimized instruction streams, so a different prediction mechanism could reduce branch misprediction stalls caused by database workloads.
2.4.6 Resource stalls
Resource-related stall time is the time during which the processor must wait for a resource to become available. Such resources include functional units in the execution stage, registers for handling dependencies between instructions, and other platform-dependent resources. The contribution of resource stalls to the overall execution time is fairly stable across the DBMSs. In all cases, resource stalls are dominated by dependency and/or functional unit stalls.
33 Stalls Related to Dependencies
20%
25%
SRS IRS SJ
% of query execution time
% of query execution time
25%
Stalls Related to Functional Units
15% 10% 5% 0%
SRS IRS SJ
20% 15% 10% 5% 0%
A
B
C
D
A
B
DBMS
C
D
DBMS
FIGURE 2.6. TDEP and TFU contributions to the overall execution time for four DBMSs. SRS: sequential selection, IRS: indexed selection, SJ: join. System A did not use the index in the IRS, therefore this query is excluded from system A’s results.
Figure 2.6 shows the contributions of TDEP and TFU for all systems and queries. Except for System A when executing range selection queries, dependency stalls are the most important resource stalls. Dependency stalls are caused by low instruction-level parallelism opportunity in the instruction pool, i.e., an instruction depends on the results of multiple other instructions that have not yet completed execution. The processor must wait for the dependencies to be resolved in order to continue. Functional unit availability stalls are caused by bursts of instructions that create contention in the execution unit. Memory references account for at least half of the instructions retired, so it is possible that one of the resources causing these stalls is a memory buffer. Resource stalls are an artifact of the lowest-level details of the hardware. The compiler can produce code that avoids resource contention and exploits instruction-level parallelism. This is difficult with the X86 instruction set, because each CISC instruction is internally translated into simpler instructions (µops). Thus, there is no easy way for the compiler to see the correlation across multiple X86 instructions and optimize the instruction stream at the processor execution level.
34 2.4.7 Comparison with DSS and OLTP
out of four of the commercial DBMSs, namely A, B, and D. The workload includes the 17
clock cycles / instruction
We executed a TPC-D workload against three
1 0% Sequential R . Sel.
100-MB TPC-D
2 1.8 1.6 1.4 1.2 1 0.8 0.6 0.4 0.2 0
TPC-D selection queries and a 100-MB data-
2 1.8 1.6 1.4 1.2 1 0.8 0.6 0.4 0.2 0 A
base. The results shown represent averages
B D BMS
D
A
Computation Branch mispredictions
from all the TPC-D queries for each system.
B DBMS
D
Memory stalls Resource stalls
FIGURE 2.7. Clocks-per-instruction (CPI) breakdown for A, B, and D running sequential range selection (left) and TPC-D queries (right). Figure 2.7 shows that the clock-per-instruc10% Sequential R. Sel.
tion query (left) is similar to the breakdown of TPC-D queries (right). The clock-per-instruction (CPI) rate is also similar between the two workloads, ranging between 1.2 and 1.8. A
100% Cache-related stall time
tion breakdown for the sequential range selec-
100%
80%
80%
60%
60%
40%
40%
20%
20%
0%
0% A
closer look into the memory breakdown (Figure 2.8) shows that first-level instruction stalls
100-MB TPC-D
B DBMS
D
L1 Data stalls L1 Instruction stalls
A
B DBMS
D
L2 Data stalls L2 Instruction stalls
dominate the TPC-D workload, indicating that FIGURE 2.8. Breakdown of cache-related stall time for A, B, and D, running the sequential range selection (left) complicated decision-support queries will ben- and TPC-D queries (right). efit much from instruction cache optimizations.
TPC-C workloads exhibit different behavior than decision-support workloads, both in terms of clocksper-instruction rates and execution time breakdown. We executed a 10-user, 1-warehouse TPC-C workload against all four DBMSs. CPI rates for TPC-C workloads range from 2.5 to 4.5, and 60%-80% of the time is spent in memory-related stalls. Resource stalls are significantly higher for TPC-C than for the other two
35 workloads. The TPC-C memory stalls breakdown shows dominance of the L2 data and instruction stalls, which indicates that the size and architectural characteristics of the second-level cache are even more crucial for OLTP workloads.
2.5 Summary Despite the performance optimizations found in today’s database systems, they are not able to take full advantage of many recent improvements in processor technology. All studies that have evaluated database workloads use complex TPC benchmarks and consider a single DBMS on a single platform. The variation of platforms and DBMSs and the complexity of the workloads make it difficult to thoroughly understand the hardware behavior from the point of view of the database.
Based on a simple query execution time framework, we analyzed the behavior of four commercial DBMSs running simple selection and join queries on a modern processor and memory architecture. The results from our experiments suggest that database developers should pay more attention to the data layout at the second level data cache, rather than the first, because L2 data stalls are a major component of the query execution time, whereas L1 D-cache stalls are insignificant. In addition, first-level instruction cache misses often dominate memory stalls, thus there should be more focus on optimizing the critical paths for the instruction cache. Performance improvements should address all of the stall components in order to effectively increase the percentage of execution time spent in useful computation. Using simple queries rather than full TPC workloads provides a methodological advantage, because the results are much simpler to analyze. We found that TPC-D execution time breakdown is similar to the breakdown of the simpler query, while TPC-C workloads incur more second-level cache and resource stalls.
36
Chapter 3
Weaving Relations For Cache Performance One of the major conclusions from the previous chapter is that, when using a two-level cache hierarchy, data misses at the second cache level are a major performance bottleneck, because the stall time penalty of a memory access is equivalent to the execution of hundreds of arithmetic operations. Cache performance is strongly dependent on the data layout inside disk pages. Relational database systems have traditionally stored records sequentially on disk pages using the N-ary storage model (NSM) (a.k.a., slotted pages). In order to minimize the expected disk I/O for queries that use a fraction of the record, the Decomposition Storage Model (DSM) (a.k.a., vertical partitioning) partitions the relation into multiple, single-attribute sub-relations. Commercial database management systems, however, still use NSM because DSM incurs high record reconstruction costs. Recently, DBMS designers have become concerned with organizing data to minimize cache misses, since modern applications such as decision-support and spatial applications are bound by the CPU and memory rather than by I/O. On today’s processor platforms, a cache miss is as expensive as hundreds of arithmetic operations. NSM, however, often incurs one cache miss per value accessed when executing queries that use a fraction of the record. In addition, NSM wastes cache space and bandwidth. This chapter proposes a new model for organizing data called PAX (Partition Attributes Across), which improves data cache performance.
PAX exhibits better cache performance than NSM by “vertically” partitioning each attribute' s values together into minipages, so that the i-th minipage stores the values of the i-th attribute for all the records on the page. Since PAX only affects layout inside the pages, it incurs no storage penalty and does not affect I/
37 O behavior. Furthermore, DBMSs can use PAX orthogonally to NSM or other page-level storage decision, and transparently to the higher components of the database system. We evaluate PAX against NSM and DSM using selection queries with variable parameters on top of the Shore storage manager. Across all of our experiments, (a) PAX exhibits better cache and memory bandwidth utilization than NSM, saving 75% of NSM’s stall time due to data cache accesses, (b) range selection queries on memory-resident relations execute in 17-25% less elapsed time with PAX than with NSM, and (c) TPC-H2 queries involving I/O execute in 11-42% less time with PAX than with NSM.
Section 3.1 presents an overview of the related work, and discusses the strengths and weaknesses of the traditional n-ary storage model (NSM) and decomposition storage model (DSM). Section 3.2 explains the design of PAX in detail, and analyzes its storage requirements. Section 3.3 analyzes the effects of PAX on cache performance on a simple numeric workload. Section 3.4 demonstrates PAX efficiency on TPC-H decision-support workloads. Finally, Section 3.4.1 concludes with a summary of the advantages and disadvantages of PAX and discusses possible improvements.
3.1 Previous work on data placement techniques Research in computer architecture, compilers, and database systems has focused on optimizing secondary storage data placement for cache performance. A compiler-directed approach for cache-conscious data placement profiles a program and applies heuristic algorithms to find a placement solution that optimizes cache utilization [9]. Clustering, compression, and coloring are the techniques that can be applied manually by programmers to improve cache performance of pointer-based data structures [13]. For database
2.
TPC-H is the decision-support benchmark suite that replaced TPC-D in 1999.
38 management systems, attribute clustering is proposed as being beneficial both for compression [22] and for improving the performance of relational query processing [51].
The most popular data placement model in relational database systems is the N-ary storage model (NSM) [47]. NSM maximizes intra-record spatial locality by storing records sequentially in slotted disk pages. An alternative is the Decomposition Storage Model (DSM) [15] that partitions each relation with n attributes in n separate relations. All commercial database systems that we are aware of use NSM, as DSM incurs a high record reconstruction cost when evaluating multi-attribute queries. A recent study demonstrates that DSM can improve cache performance of main-memory database systems, assuming that the record reconstruction cost is low [7]. The remainder of this section describes the advantages and disadvantages of NSM and DSM, and briefly outlines their variants.
3.1.1 The N-ary Storage Model
Traditionally, the records of a relation are stored in slotted disk pages [47] obeying an n-ary storage model (NSM). NSM stores records sequentially on data pages. Figure 3.1 depicts an example relation R (left) and the corresponding NSM page after having inserted four records (middle). Each record has a record header (RH) that contains a null bitmap, offsets to the variable-length values, and other implementation-specific information [36][52][61]. Each new record is typically inserted into the first available free space starting at the beginning of the page, and a pointer (offset) to the beginning of the new record is stored in the next available slot from the end of the page. The offsets to records are necessary because records may be of variable length. The nth record in a page is accessed by following the nth pointer from the end of the page.
39
RELATION R RID
SSN
Name
Age
1
0962
Jane
30
2
7658
John
45
3
3859
Jim
20
4
5523
Susan
52
5
9743
Leon
43
6
0618
Dan
37
NSM PAGE PAGE HEADER
Jane
CACHE
RH1 0962
30 RH2 7658
John
45 RH3 3589 Jim 20 RH4 5523 Susan 52
Jane 45 Jim
30 RH
block 1
RH3 3589
block 2
20 RH4
block 3
5523 Susan 52
block 4
FIGURE 3.1. N-ary storage model and its cache behavior. Records in R (left) are stored contiguously into disk pages (middle), with offsets to their starts stored in slots at the end of the page. while scanning age, NSM typically incurs one cache miss per record and brings useless data into the cache (right).
NSM, however, exhibits poor cache utilization when the query involves a fraction of each record. Consider the following query:
select name from R where age < 40; To evaluate the predicate, the query processor uses a scan operator [23] that retrieves the value of the attribute age from each record in the relation. Assuming that the NSM page in the middle of Figure 3.1 is already in main memory and that the cache block size is smaller than the record size, the scan operator will incur one cache miss per record. If age is a 4-byte integer, it is smaller than the typical cache block size (32-128 bytes). Therefore, along with the needed value, each cache miss will bring into the cache the other values stored next to age (shown on the right in Figure 3.1), wasting memory bandwidth and potentially useful cache space to store data that the query will never use.
40 R1 RID
PAGE HEADER 1 0962
SSN
2 7658 3 3859 4 5523
1
0962
2
7658
3
3859
RID
4
5523
1
Jane
5
9743
2
John
6
0618
3
Jim
....
R2
sub-relation R1
Name
PAGE HEADER 1 Jane
R3
2 John 3 Jim 4 Susan
....
RID Age
4
Susan
1
30
5
Leon
2
45
PAGE HEADER 1 30 2
6
Dan
3
20
45 3 20 4 52
4
52
5
43
6
37
....
sub-relation R2
sub-relation R3
FIGURE 3.2. Decomposition storage model. The relation is partitioned vertically into one thin relation per attribute. Each sub-relation is then stored in the traditional fashion.
3.1.2 The Decomposition Storage Model
Vertical partitioning is the process of striping a relation into sub-relations, each containing the values of a subset of the initial relation’s attributes. Vertical partitioning was initially proposed in order to reduce I/ O-related costs [43]. The fully decomposed form of vertical partitioning (one attribute per stripe) is called the decomposition storage model (DSM) [15]. DSM partitions an n-attribute relation vertically into n subrelations, as shown in Figure 3.2. Each sub-relation contains two attributes, a logical record id (surrogate) and an attribute value (essentially, it is a clustered index on the attribute). Sub-relations are stored as regular relations in slotted pages, enabling each attribute to be scanned independently.
DSM offers a higher degree of spatial locality when sequentially accessing the values of one attribute. During a single-attribute scan, DSM exhibits high I/O and cache performance. However, when evaluating a multi-attribute query, the database system must join the participating sub-relations on the surrogate in order to reconstruct the partitioned records. The time spent joining sub-relations increases with the number
41 NSM PAGE PAGE HEADER
Jane
RH1 0962
30 RH2 7658 John
CACHE
PAX PAGE PAGE HEADER
0962 7658
3859 5523
30 52 45 20
block 1
45 RH3 3589 Jim 20 RH4 5523 Susan 52 Jane John Jim
Susan
.... 30 52 45 20
FIGURE 3.3. Partition Attributes Across (PAX) stores the same data in each page as NSM, only records are partitioned vertically into minipages inside each page. The mapping of information onto the cache blocks when scanning R for attribute age is now much more efficient, as the cache space is fully utilized. of attributes in the result relation. In addition, DSM incurs a significant space overhead because the record id of each record needs be replicated.
An alternative algorithm [16] partitions each relation based on an attribute affinity graph, which connects pairs of attributes based on how often they appear together in queries. The attributes are grouped in fragments, and each fragment is stored as a separate relation to maximize I/O performance and minimize record reconstruction cost. When the set of attributes in a query is a subset of the attributes in the fragment, there is a significant gain in I/O performance [2]. The performance of affinity-based vertical partitioning depends heavily on whether queries involve attributes within the same fragment.
3.2 Partition Attributes Across In this section, we introduce a new strategy for placing records on a page, called PAX (Partition Attributes Across). PAX (a) improves NSM’s cache behavior by improving spatial locality without a space penalty, (b) does not incur significant record reconstruction costs, and (c) is orthogonal to other design
42 decisions, because it only affects the layout of data stored on a single page (e.g., one may decide to store one relation using NSM and another using PAX, or first use affinity-based vertical partitioning, and then use PAX for storing the ‘thick’ sub-relations). This section presents the detailed design of PAX.
3.2.1 Overview
The motivation behind PAX is to keep the attribute values of each record on the same page as in NSM, while using a cache-friendly algorithm for placing them inside the page. PAX vertically partitions the records within each page, storing together the values of each attribute in minipages. Figure 3.3 depicts an NSM page and the corresponding PAX page, with the records of the former stored in the latter in a columnmajor fashion. When using PAX, each record resides on the same page as it would reside if NSM were used; however, each value in the record is stored on a separate part of the page. PAX increases the interrecord spatial locality (because it groups values of the same attribute that belong to different records) with minimal impact on the intra-record spatial locality. Although PAX employs in-page vertical partitioning, it does not incur significant record reconstruction costs, because it does not need a costly join to correlate the attribute values of a particular record.
3.2.2 Design
In order to store a relation with degree n (i.e., with n attributes), PAX partitions each page into n minipages. It then stores values of the first attribute in the first minipage, values of the second attribute in the second minipage, and so on. At the beginning of each page there is a page header that contains offsets to the beginning of each minipage. The record header information is distributed across the minipages. The structure of each minipage is determined as follows:
43 # attributes free space # records attr. sizes
pid
...
0962
3 2 4
v
4
f
7658
} page header
} } }
F-minipage
presence bits 1 1
Jane
John v-offsets
V-minipage
..
30 45 presence bits 1 1
F-minipage
FIGURE 3.4. Example of a PAX page. In addition to the traditional information (page id, number of records in the page, field sizes, free space, etc.) the page header maintains offsets to the beginning of each minipage. F-minipages keep fixed-length values, and maintain a bitmap to indicate whether or not each value is present. Variable-length values are stored in V-minipages, and there is an offset to the end of each value.
•
Fixed-length attribute values are stored in F-minipages. At the end of each F-minipage there is a presence bit vector with one entry per record that denotes null values for nullable attributes.
•
Variable-length attribute values are stored in V-minipages. V-minipages are slotted, with pointers to the end of each value. Null values are denoted by null pointers.
Each newly allocated page contains a page header and a number of minipages equal to the degree of the relation. The page header contains the number of attributes, the attribute sizes (for fixed length attributes), offsets to the beginning of the minipages, the current number of records on the page and the total space still available. Figure 3.4 depicts an example PAX page in which two records have been inserted. There are two F-minipages, one for the SSN and one for the age attribute. The name attribute is a variable-length string,
44 therefore it is stored in a V-minipage. At the end of each V-minipage there are offsets to the end of each variable-length value.
INSERTING, UPDATING, AND DELETING RECORDS. The algorithm to bulk load records from a data file starts by allocating each minipage on the page based on attribute value size. In the case of variable-length attributes, it uses a user hint as an indication of the average value size. PAX inserts records by copying each value into the appropriate minipage. When variable-length values are present, page reorganizations may be needed by moving minipage boundaries to accommodate records. If a record fits in the page but its individual attribute values do not, the algorithm recalculates minipage sizes based on the average value sizes in the page so far and the new record size, and reorganizes the page structure by moving minipage boundaries appropriately to accommodate new records. When the page is full, it allocates a new page with the initial minipage sizes equal to the ones in the previously populated page (so the initial hints are quickly readjusted to the true per-page average value sizes).
Like insertions, updates and deletions of fixed-length records are straightforward. On updates, page reorganizations may be needed when variable-length values are present as described above (e.g., when updating a value with one of greater size). On deletions, no page boundaries need be moved; the algorithm periodically reorganizes the values within each minipage to reduce fragmentation.
ACCESSING THE RECORDS. Records on a page are accessed either sequentially or in random order (e.g., through a non-clustered index). In order to sequentially access a subset of attributes, the algorithm sequentially accesses the values in the appropriate minipages. Appendix A outlines the part of the sequential scan algorithm that reads all values of a fixed-length attribute f or a variable-length attribute v from a newly accessed page, and the part of the indexed scan that reads a value of an attribute a, given the record id.
45 3.2.3 Storage requirements
In this section, we compare the storage requirements of PAX with NSM and DSM in terms of storage requirements and demonstrate that PAX does not require more space than either NSM or DSM. For simplicity, we do not take into account in the calculations any control information about the attribute size variability, null bitmaps, and page header information (the storage requirements for this information typically vary across database systems, but are common across all three schemes). Instead, the calculations only take into account the storage needed by the data in the relation and the offsets or surrogates needed for variablelength records and for random record access.
NSM stores the attributes of each record contiguously. Therefore, it requires one offset (slot) per record and one additional offset for each variable-length attribute in each record. Consider a relation R with cardinality N, degree n, f fixed-length attributes, and v variable-length attributes ( n = f + v ) . With NSM, each record occupies the following amount of space:
S ( NSM ) = f ⋅ F + v ⋅ ( V + o ) + o where o is the offset (slot) size, and F, V are the average sizes of the fixed and variable-length attributes per record, respectively. Records in a DSM sub-relation are composed by a logical id (surrogate) of size s, and the attribute value, and are stored in slotted pages. The storage per record using DSM is
S ( DSM ) = f ⋅ ( F + o + s ) + v ⋅ ( V + o + s )
PAX stores one offset for each variable-length value, plus one offset for each of the n minipages. The amount of space PAX requires to store each record is
P S ( PAX ) = f ⋅ F + v ⋅ ( V + o ) + n ⋅ ---- ⋅ o N
46 where P is the number of pages occupied by the relation. As long as the record size is smaller than the page size by a factor greater than n (which is usually the case), PAX incurs less storage penalty than NSM. Using these equations, when loading TPC-H relations into 8K pages, PAX requires 3-4% less space than NSM. In main-memory database systems like Monet [7], DSM can also be implemented using virtual memory pointers as surrogates, and without offset slots for fixed sized attributes, giving S ( DSM ) = S ( PAX ) .
3.2.4 Implementation
NSM, PAX, and DSM were implemented in the Shore storage manager [10]. Shore provides all the features of a modern storage manager, namely B-trees and R-trees, ARIES-style recovery, hierarchical locking (record, page, file), and clock-hand buffer management with hints. Normally Shore stores records as contiguous byte sequences, therefore the finest granularity for accessing information is the record.
We implemented NSM, DSM and PAX as alternative data layouts. To implement NSM, we added attribute-level knowledge on top of the existing Shore file manager (as explained later in this section). DSM was implemented on top of Shore, by decomposing the initial relation into n Shore files that are stored in slotted pages using NSM. Each sub-relation includes two columns, one with a logical record id and one with the attribute value. During query processing, accessing the correct attribute in a record is the responsibility of the layer that runs on top of the storage manager. Finally, PAX was implemented as an alternative data page organization in Shore (about 2,500 lines of code).
RECORD IMPLEMENTATION. Shore implements records as contiguous byte sequences, and adds a 12-byte tag in front of each record. The tag keeps Shore-specific information such as serial number, record type, header length, and record length. In addition, it uses 4-byte slots at the end of the page (two bytes for the
47
VARIABLE-LENGTH VALUES
SHORE TAG FIXED-LENGTH VALUES
}
} 12 bytes
n bytes
2-byte value offsets
v bytes
FIGURE 3.5. An example NSM record. The data for fixed-length columns is stored first, followed by a 2byte offset array and the variable-length data.
offset and another two for the amount of space allocated for each record). This adds up to a 16-byte overhead per record.
Figure 3.5 illustrates how NSM records were implemented. The fixed-length attribute values are stored first, followed by an array of offsets and a mini-heap containing the variable-length attribute values. In our current implementation, TPC-H tables stored using PAX need 8% less space than when stored using NSM. 3-4% of this benefit is due to the fact that PAX does not need a slot table at the end of a page. The rest is Shore-specific overhead resulting from the 12-byte Shore record tag. Commercial database management systems store a header in front of each record, that keeps information such as the NULL bitmap, space allocated for the record, true record size, fixed part size, and other flags. The record header’s size varies with the number and type of columns in the table. For the TPC-H table Lineitem, the record header would be about 8 bytes. Therefore, the Shore tag adds a space overhead of 4 bytes per record. Due to this overhead, NSM takes 4% more storage than it would if the Shore tag were replaced by common NSM header information.
SCAN OPERATOR. A scan operator that supports sargable predicates [50] was implemented on top of Shore. When running a query using NSM, one scan operator is invoked that reads each record and extracts the attributes involved in the predicate from it. PAX invokes one scan operator for each attribute involved in the query. Each operator sequentially reads values from the corresponding minipage. The projected attribute values for qualifying records are retrieved from the corresponding minipages using computed off-
48 sets. With DSM, as many operators as there are attributes in the predicate are invoked, each on a sub-relation. The algorithm makes a list of the qualifying record ids, and retrieves the projected attribute values from the corresponding sub-relations through a B-tree index on record id. JOIN OPERATOR. The adaptive dynamic hash join algorithm [42], which is also used in DB2 [36], was imple-
mented on top of Shore. The algorithm partitions the left table into main-memory hash tables on the join attribute. When all available main memory has been consumed, all buckets but one are stored on the disk. Then it partitions the right table into hash tables in a similar fashion, probing dynamically the main-memory portion of the left table with the right join attribute values. Using only those attributes required by the query, it then builds hash tables with the resulting sub-records. The join operator receives its input from two scan operators, each reading one relation. The output can be filtered through a function that is passed as a parameter to the operator.
3.3 Analysis of cache performance To evaluate PAX performance and compare it to NSM and DSM, it is necessary to first understand cache behavior and its implications for all three schemes. First, we ran plain range selection queries on a memory-resident relation that consists of fixed-length numeric attributes. Then, we used realistic decision-support workloads to obtain results on more complicated queries. This section analyzes the cache performance and execution time when running the simple queries, and discusses the limitations of all three schemes.
3.3.1 Experimental setup and methodology
The experiments were conducted on a Dell 6400 PII Xeon/MT system running Windows NT 4.0. This computer features a Pentium II Xeon processor running at 400MHz, 512MB of main memory, and a
49 100MHz system bus. The processor has a split first-level (L1) cache (16KB instruction and 16KB data) and a unified 512 KB second-level (L2) cache. Caches at both levels are non-blocking (they can service new requests while earlier ones are still pending) with 32-byte cache blocks.3 We obtained experimental results using the Xeon’s hardware performance counters and the methodology described in previous work [1].
The workload consists of one relation and variations of the following range selection query:
select ap from R where aq > Lo and aq < Hi
(1)
where ap, aq are attributes in R. This query is sufficient to examine the net effect of each data layout when
accessing records sequentially or randomly (given their record id). Unless otherwise stated, R contains eight 8-byte numeric attributes, and is populated with 1.2 million records. For predictability and easy correctness verification of experimental results, we chose the attribute size so that exactly four values fit in the 32-byte cache line, and record sizes so that record boundaries coincide with cache line boundaries. We varied the projectivity, the number of attributes in the selection predicate, their relative position, and the number of attributes in the record. The distribution and data skew of values of the attribute(s) that appear in the predicate are the same as in the l_partkey attribute of the Lineitem table in the TPC decision-support benchmarks [24].
PAX is intended to optimize data cache behavior, and does not affect I/O performance in any way. In workloads where I/O latency dominates execution time, the performance of PAX eventually converges to the performance of NSM. PAX is designed to improve data cache performance once the data page is avail-
3.
Cache blocks are expected to be even larger in future processors. Larger blocks hold more values, therefore the spatial locality PAX offers will result in even higher cache space and bandwidth utilization. Results on systems with larger cache blocks are shown in Section 4.5.
50 NSM/PAX/DSM Elapsed Time
NSM/PAX Elapsed Time
25
NSM DSM
20
PAX
6 elapsed time (seconds)
elapsed time (seconds)
30
15 10 5 0
5 4 3 2 NSM 1
PAX
0 1%
5%
10%
20%
selectivity
50% 100%
1%
5%
10%
20%
50% 100%
selectivity
FIGURE 3.6. Elapsed time comparison when running a predicate selection query with NSM, DSM and PAX (left) and between NSM and PAX (right), as a function of the selectivity. The graph on the right is an expansion on the y-axis of the graph on the left able from the disk, and is orthogonal to any additional optimizations to improve I/O performance. In the rest of this section, we study the effects of PAX when running queries mainly on main-memory resident relations.
3.3.2 Results and Analysis
Figure 3.6 shows the elapsed time when using NSM, DSM, or PAX to run query (1), as the selectivity is varied from 1% to 100%. The graph on the left compares all three page layouts and shows that, while the performance of the NSM and PAX schemes are insensitive to selectivity changes, the performance of DSM deteriorates rapidly as the selectivity increases. When the selectivity is low (1%), DSM reads data almost exclusively from the sub-relation that contains the attribute in the predicate. However, as more records qualify, DSM has to access the sub-relation that contains the projected attribute (ap) more frequently, and suffers from both data cache misses (because it loses the advantage of spatial locality) and poor instruction cache performance (because the sequential scan code is interleaved with the code to access the page of the projected value based on the record id). On the contrary, NSM and PAX maintain stable performance,
51 NSM L1 Data Penalty
140
L2 Data penalty
120
clock cycles per record
clock cycles per record
140
PAX 160
100 80 60 40 20 0
L1 Data Penalty L2 Data penalty
1600
120 100 80 60 40 20
5%
10% 20% 50% 100% selectivity
Misc Mem Com p
1400 1200 1000 800 600 400 200 0
0 1%
CPU time 1800
clock cycles per record
160
1%
5%
10% 20% 50% 100% selectivity
NSM
PAX
Page Layout
FIGURE 3.7. Cache miss penalty per record processed due to data misses at the second and first level cache for NSM (left) and PAX(center) as a function of the selectivity. For selectivity 1%, the graph on the right shows CPU time breakdown in clock cycles per record processed into useful computation (Comp), stall time due to memory delays (Mem) and stall time due to other reasons (Misc). because all the attributes of each record reside on the same page, eliminating the need for an expensive join operation to reconstruct the record.
The graph on the right side of Figure 2.6 is an expansion on the y-axis of the graph on the left, and shows that PAX is 25% faster than NSM. As the predicate is applied to aq, NSM suffers one cache miss for each record. Since PAX groups attribute values together on a page, it incurs a miss every n records, where n is the cache block size divided by the attribute size. In our experiments, PAX takes a miss every four records (32 bytes per cache block divided by 8 bytes per attribute). Consequently, PAX incurs 75% fewer data misses in the second-level cache than NSM.
Figure 3.7 demonstrates that PAX exhibits better cache behavior than NSM. The graphs on the left and center show the processor stall time4 per record due to data misses at both cache levels for NSM and PAX, respectively. Due to the higher spatial locality, PAX reduces the data-related penalty at both cache levels. The L1 data cache penalty does not affect the overall execution time significantly, because the penalty 4.
Processing time is 100% during all of the experiments, therefore processor cycles are directly analogous to elapsed time.
52 associated with one L1 data cache miss is small (10 processor cycles). Each L2 cache miss, however, costs 70-80 cycles. PAX reduces the overall L2 cache data miss penalty by 70%. Therefore, as shown in the graph on the right of Figure 3.7, the overall processor stall time is 75% less when using PAX, because it does not need to wait as long for data to arrive from main memory. The memory-related penalty contributes 22% to the execution time when using NSM, and only 10% when using PAX.
Although PAX and NSM have comparable instruction footprints, the rightmost graph of Figure 3.7 shows that PAX incurs less computation time. This is a side effect of reducing memory-related stalls. Modern processors can retire5 multiple instructions per cycle; the Xeon processor can retire up to three. When there are memory-related delays, the processor cannot operate at its maximum capacity and retires less than three instructions per cycle. With NSM, only 30% of the total cycles retire three instructions, with 60% retiring either zero or one instruction. As reported by previous studies [1][33], database systems suffer high data dependencies and the majority of their computation cycles commit significantly fewer instructions than the actual capacity of the processor. PAX partially alleviates this problem by reducing the stall time, and the queries execute faster because they exploit better the processor’s superscalar ability.
As the number of attributes involved in the query increases, the elapsed execution times of NSM and PAX converge. In the left graph of Figure 3.8, the projectivity of the query is varied from 1 to 7 attributes, and the predicate is applied to the eighth attribute. In the experiments shown, PAX is faster even when the result relation includes all the attributes. The reason is that the selectivity is maintained at 50%, and PAX exploits full spatial locality on the predicate values, whereas NSM brings into the cache useless information 50% of the time. Likewise, the rightmost graph of Figure 3.8 displays the elapsed time as the number of attributes in the selection predicate is varied from 1 to 7, with the projection on the eighth attribute. PAX 5.
To execute a program, a processor reads (issues) a group of instructions, executes them, and commits (retires) their results by writing them onto memory (registers, cache). This procedure is pipelined, so in a given cycle the processor is capable of simultaneously issuing i instructions, executing x instructions (that were issued in previous cycles) and committing c instructions (that were issued and executed in previous cycles). For the Xeon processor, i = 3, x = 5, and c = 3.
53 NSM/PAX Elapsed Tim e 5.5
5
5 time (seconds)
time (seconds)
NSM/PAX Elapsed Tim e 5.5
4.5 4 3.5
NSM
4.5
4 3.5
NSM
PAX 3
PAX 3
1
2
3
4
5
projectivity
6
7
1
2
3 4 5 6 num ber of predicates
7
FIGURE 3.8. Elapsed time comparison when running a predicate selection query with NSM and PAX as a function of the projectivity (left) and the number of attributes involved in the predicate (right). Selectivity is 50%. is again faster for locality reasons. In these experiments, DSM’s performance is about a factor of 9 slower than NSM and PAX. As the number of attributes involved in the query increases, DSM must join the corresponding number of sub-relations.
Using PAX to improve the inter-record spatial locality in a page and reduce the number of data cache misses is meaningful as long as the ratio of the record size to the page size is low enough that a large number of records fit on the page (which is a reasonable assumption in most workloads). All of the above measurements were taken with R consisting of eight, 8-byte attributes. For this relation, PAX divides the page into 8 minipages, one for each attribute. In an 8K page, this results in about 125 records in each 8-KByte page. Therefore, in a system with 32-byte cache block, PAX incurs about four times fewer data cache misses than NSM when scanning records to apply a predicate to an attribute. As the number of attributes in a record increases, fewer records fit on one page. With 64 8-byte values per record, the number of records per page is reduced to 15.
54 Figure 2.4 shows the elapsed time PAX and NSM
Elapsed time per record 6
need to process each record, as a function of the number of attributes in the record. To keep the relation mainmemory resident, doubling the record size implies halving R’s cardinality; therefore, we divided execution time by the cardinality of R. The graph illustrates that,
time (microseconds)
5 4 3 2 NSM
1
PAX
while PAX still suffers fewer misses than NSM, the exe-
0 2
cution time is dominated by factors such as the buffer
4
8
16
32
64
number of attributes
FIGURE 3.9. Sensitivity of PAX to the number manager overhead associated with getting the next page of attributes, compared to NSM. The elapsed time to process a record converges for the two in the relation after completing the scan of the current schemes as the number of attributes increases, because fewer records fit on each page. page. Therefore, as the degree of the relation increases, the time PAX needs to process a record converges to that of NSM.
3.4 Evaluation Using DSS Workloads This section compares PAX and NSM when running a TPC-H decision-support workload. Decision-support applications are typically memory and computation intensive [36]. The relations are not generally main-memory resident, and the queries execute projections, selections, aggregates, and joins. The results show that PAX outperforms NSM on all TPC-H queries in this workload.
3.4.1 Experimental Setup and methodology
The experiments were conducted on the system described in Section 3.3.1. The workload consists of the TPC-H database and a variety of queries. The database and the TPC-H queries were generated using the
55 dbgen and qgen software distributed by the TPC. The database includes attributes of type integer, floating point, date, fixed-length string, and variable-length string. We ran experiments with insertions, range selections, and four TPC-H queries:
Insertions. When populating tables from data files, NSM performs one memory-to-memory copy per record inserted, and stores records sequentially. PAX inserts records by performing as many copy operations as the number of values in the tuple, as explained in Section 3.2.2. DSM creates and populates as many relations as the number of attributes. We compare the elapsed time to store a full TPC-H dataset when using each of the three schemes and for variable database sizes.
Range selections. This query group consists of queries similar to those presented in Section 3.3.1 but without the aggregate function. Instead, the projected attribute value(s) were written to an output relation. To stress the system to the maximum possible extent, the range selections are on Lineitem, the largest table in the database. Lineitem contains 16 attributes having a variety of types, including three variable-length attributes. There are no indexes on any of the tables, as most implementations of TPC-H in commercial systems include mostly clustered indices, which have a similar access behavior to sequential scan [2]. As in Section 3.3, we varied the projectivity and the number of attributes involved in the predicate.
TPC-H queries. Four TPC-H queries, Q1, Q6, Q12, and Q14, were implemented on top of Shore. The rest of this section shortly describes the queries and discusses their implementation. The SQL implementation is presented in Appendix B.
Query #1 is a range selection with one predicate and computes eight aggregates on six attributes of the Lineitem table. The implementation pushes the predicates into Shore, computes the aggregates on the qualifying records, groups and orders the results.
56 Query #6 is a range selection with four predicates on three attributes, and computes a sum aggregate on Lineitem. The implementation is similar to Query #1.
Query #12 is an equijoin between Orders and Lineitem with five additional predicates on six attributes, and computes two conditional aggregates on Lineitem.
Query #14 is an equijoin between Part and Lineitem with two additional predicates, and computes the product of two aggregates (one conditional) on Lineitem.
Queries 12 and 14 use the adaptive dynamic hash join operator described in Section 3.2.4. The experiments presented in this section use a 128-MB buffer pool and a 64-MB hash join heap. With large TPC-H datasets the queries involve I/O, because the resulting database sizes used are larger than the memory available and the equijoins store hash table buckets on the disk.
3.4.2 Insertions
Figure 3.10 compares the elapsed time required to load a 100-MB, 200-MB, and 500-MB TPC-H database with each of the three storage organizations. DSM load times are much higher than those of NSM and PAX, because DSM creates one relation per attribute and stores one NSM-like record per value, along with the value’s record id. As Section 3.3.2 demonstrated, DSM never outperforms either of the other two schemes when executing queries that involve multiple attributes. Therefore, the rest of Section 3.4 will focus on comparing NSM and PAX.
Depending on the database size, PAX incurs a 2-26% performance penalty compared to NSM. Although the two schemes copy the same total amount of data to the page, PAX must perform additional page reorganizations. Occasionally, when the relation involves variable-length attributes, the algorithm that allo-
57 cates minipage space in a new PAX page over- or underestimates the expected minipage size. As a consequence, a record that would fit in an NSM page does not fit into the corresponding PAX page unless the current minipage boundaries are moved. In similar cases, PAX needs additional page reorganizations to move minipage boundaries and accommodate new records.
The bulk load algorithm for PAX estimates initial
Elapsed Load Times
time (seconds)
1000
3350
minipage sizes on a page to be equal to the average
900
NSM PAX
800
DSM
attribute value sizes on the previously populated page.
700
With the TPC-H database, this technique allows PAX
600 500
to use about 80% of the page without any reorganiza-
400 300
tion. However, our greedy algorithm attempts to fill
200
each page until no more records can be accommo-
100 0 100 MB
200 MB
500 MB
database size
FIGURE 3.10. Elapsed times to load a 100-MB, 200-MB and 500-MB TPC-H dataset using NSM, PAX, and DSM page organizations.
dated. On average, each page suffers an average of 2.5 reorganizations, half of which only occur in order to accommodate one last record on the current page before allocating the next one. The recalculations that
compute the appropriate minipage sizes and the cost of shifting the minipage boundaries involve additional memory copy operations and cause slower load times for PAX than for NSM.
3.4.3 Queries
In Section 3.3 we explained why PAX’s effect on performance is reduced as the projectivity increases and the query accesses a larger portion of the record. As shown in Figure 3.8 in Section 3.3.2, PAX is more beneficial than NSM when running range selections, especially when the query uses only a fraction of the record. The leftmost bar group (labeled ‘RS’) in Figure 3.11 shows that the average speedup obtained by
58 all range selection queries when using a 100-MB, a 200-MB, and a 500-MB dataset is 12%, 11%, and 9%, respectively.
Figure 3.11 also depicts PAX/NSM speedups when running four TPC-H queries against a 100, 200, and 500-MB TPC-H database. PAX outperforms NSM throughout all these experiments. The speedups obtained, however, are not constant across the experiments due to a combination of differing amounts of I/ O and interactions between the hardware and the algorithms being used.
Queries 1 and 6 are essentially range queries that
PAX/NSM speedup (PII/NT) 45%
PAX/NSM speedup (%)
40% 35%
access roughly one third of each record in Lineitem
100 MB 200 MB 500 MB
and calculate aggregates, as shown in Appendix B. The
30%
difference between these TPC-H queries and the plain
25%
range selections (RS) discussed in the previous para-
20%
graph is that TPC-H queries exploit further the spatial
15% 10%
locality, because they access projected data multiple
5%
times in order to calculate aggregate values. Therefore,
0% RS
Q1
Q6 query
Q12
Q14
FIGURE 3.11. PAX/NSM speedup. Speedup is
PAX improvement is higher due to the increased cache utilization and varies from 9% (in the 500-MB data-
shown for a 100-MB, 200-MB, and 500-MB base) to 28% (in the smaller databases). TPC-H dataset when running range selections (RS) and four TPC-H queries (Q1, Q6, Q12, and Q14). Queries 12 and 14 are more complicated and involve two joined tables, as well as range predicates. The join is performed by the adaptive dynamic hash join algorithm, as was explained in Section 3.2.4. Although both the NSM and the PAX implementation of the hash-join algorithm only copy the useful portion of the records, PAX still outperforms NSM because (a) with PAX, the useful attribute values are naturally isolated, and (b) the PAX buckets are stored on disk
59 using the PAX format, maintaining the locality advantage as they are accessed for the second phase of the join. PAX executes query 12 in 27-42% less time than NSM. Since query 14 accesses fewer attributes and requires less computation than query 12, PAX outperforms NSM by only 6-24% when running this query.
3.5 Summary The performance of today’s decision-support systems is strongly affected by the increasing processormemory speed gap. Previous research has shown that database systems do not exploit the capabilities of today’s microprocessors to the extent that other workloads do [33]. A major performance bottleneck for database workloads is the memory hierarchy, and especially data accesses on the second-level cache [1]. The data cache performance is directly related to how the contents of the disk pages map to cache memories, i.e., to the disk page data layout. The traditional N-ary storage model (NSM) stores records contiguously on slotted disk pages. However, NSM' s poor spatial locality has a negative impact on L2 data cache performance. Alternatively, the decomposition storage model (DSM) partitions relations vertically, creating one sub-relation per attribute. DSM exhibits better cache locality, but incurs a high record reconstruction cost. For this reason, most commercial DBMSs use NSM to store relations on the disk.
This chapter introduces PAX (Partition Attributes Across), a new layout for data records on pages that combines the advantages of NSM and DSM. For a given relation, PAX stores the same data on each page as NSM. The difference is that within each page, PAX groups values for the same attribute together in minipages, combining high data cache performance with minimal record reconstruction cost at no extra storage overhead.
Using PAX to arrange data on disk pages is beneficial when compared to both NSM and DSM:
60 •
When compared to NSM, PAX incurs 50-75% fewer L2 cache misses due to data accesses, and simple queries on main-memory tables execute in 17-25% less elapsed time. TPC-H queries, that perform extended calculations on the data retrieved and require I/O, exhibit a 10-42% PAX/NSM speedup.
•
When compared to DSM, PAX cache performance is better and queries execute consistently faster because PAX does not require a join to reconstruct the records. As a consequence, the execution time of PAX remains relatively stable as query parameters vary, whereas the execution time of DSM increases linearly to these parameters.
PAX incurs no storage penalty when compared with either NSM or DSM. PAX reorganizes the records within each page, therefore can be used orthogonally to other storage schemes (such as NSM or affinitybased vertical partitioning) and transparently to the rest of the DBMS. Finally, compression algorithms (a) operate more efficiently on vertically partitioned data, because of type uniformity and (b) achieve higher compression rates on a per-page basis, because the value domain is smaller. PAX combines these two characteristics, and favors page-level compression schemes.
61
Chapter 4
Walking Four Machines By The Shore In the previous chapters, we studied the performance of various DBMSs on a modern computer platform. Conceptually, all of today’s processors follow the same sequence of logical operations when executing a program. However, there are internal implementation details that critically affect the processor’s performance. For instance, while most modern platforms employ techniques to exploit parallelism in computation and memory accesses, the extent of parallelism extracted varies both within and across compute vendor products. To accurately identify the impact of variation in processor and memory subsystem design on DBMS performance, this chapter examines the behavior of a prototype database management system on three different internal design philosophies.
Today’s hardware platform performance is strongly determined by design decisions in the system’s architecture and microarchitecture. The processor’s architecture determines the characteristics of the software interface, i.e., the instruction set. The processor’s microarchitecture determines program execution characteristics such as the structure of the processor pipeline, the issue width, the speculation mechanisms and policies, and the order of instruction execution. The processors we are considering exhibit different designs in all of the above aspects.
The system’s microarchitecture also includes the memory subsystem design. The memory subsystem is typically composed of multiple cache levels, in order to hide memory access delays. Still, due to the memory-processor speed gap, the design details of the memory hierarchy are critical to the performance. Comparing memory performance across a variety of platforms is interesting, because memory system designs
62 differ in the number of cache levels, the cache location (on-chip or off-chip), the cache sizes, the associativity, the cache block size, and the inclusion policy amongst the various cache levels.
In this chapter, we use a prototype database management system built on top of the Shore storage manager [17] in order to compare database workload behavior across three modern computer design philosophies:
•
Sun UltraSparc: We experimented with two systems, one featuring the UltraSparc-II (US-II) [54] processor and another featuring the UltraSparc-IIi (US-IIi) [55] processor. Both processors feature an inorder execution engine. Their basic architecture and microarchitecture is similar, but the memory subsystem design variations are clearly exposed when executing the same workload. The US-II runs Solaris 2.6, whereas the US-IIi runs Solaris 2.7. In this chapter, we use the term “UltraSparc” to refer to common design elements between the US-II and the US-IIi.
•
Intel P6: The Dell system we used to conduct the experiments features a Pentium II Xeon [31] processor, which is a representative example of an out-of-order CISC processor. The operating system running on the platform is Linux 2.2. In the rest of this chapter, we refer to this processor as “the Xeon.”
•
Alpha 21164: Although it is an in-order machine, the A21164 [14] is the only machine in this set that features a three-level cache hierarchy between the processor and the main memory. The system runs OSF1, a 64-bit Unix-based operating system. In the rest of this chapter, we refer to this processor as “the Alpha.”
The purpose of this study is not to compare processor speed, but rather to evaluate different design decisions and trade-offs in the execution engine and memory subsystem, and determine the impact on the performance of database workloads. All processors studied are one generation old and have different release
63 dates and core clock speeds (see Table 4.1). We chose the UltraSparc-II-based systems because there was no UltraSparc-III available, the Xeon was selected for compatibility with earlier results in this thesis, and finally, the A21164 is the most recent Alpha processor with cache-related countable events.
Section 4.1 is an overview of the four systems, emphasizing the trade-offs involved in their design. Section 4.2 describes the setup and methodology used in the experiments. Section 4.3 discusses interesting results on individual systems. Section 4.4 presents insights drawn from comparing database behavior on all four systems. Section 4.5 discusses the performance of PAX (the record partitioning technique presented in Chapter 3), and Section 4.6 concludes.
4.1 Hardware platform overview This chapter examines four systems that belong to different design philosophies. Tables 4.1 and 4.2 summarize the major differences among the systems’ processors and memory hierarchies, respectively. The data presented in the table are gathered from various sources, such as the Microprocessor Report articles [18][25][26][27] and vendor manuals [31][14][54][55]. The cache and memory hit latencies were measured using the Larry McVoy benchmark suite (widely known as lmbench) [39]. The rest of this section discusses the trade-offs involved with the most important variations in the instruction set and execution engine of the processor, and in the design and implementation of the memory hierarchy.
4.1.1 Processor Architecture and Execution Engine Design
Table 4.1 summarizes the processor characteristics and operating systems of the four computers studied in this chapter. The systems differ in the processor type, speed, issue width, instruction set, and execution
64 engine philosophy. This section discusses these differences and explains the trade-offs that affect the behavior of database workloads.
TABLE 4.1: Processor characteristics, operating systems, and compiler Sun UltraSparc
Dell 6400 PII Xeon/MT
Module / Characteristic Sun Ultra 60
Sun Ultra 10
AlphaServer 4100 5/533
Processor type
UltraSparc II
UltraSparc IIi
Pentium II Xeon
Alpha 21164A
core clock speed
296 MHz
300 MHz
400MHz
532 MHz
released in
1997
1997
1998
1996
issue width
4
4
3
4
instruction set
RISC
RISC
CISC
RISC
Out of order?
no
no
yes
no
Operating System
SunSolaris 2.6
Sun Solaris 2.7
Linux 2.2
DEC OSF/1
Compiler / optimization level
gcc v2.95.2 / O2
gcc v2.95.2 / O2
gcc v2.95.2 / O2
gcc v2.95.2
The primary objective of processor designers is to improve performance, i.e., maximize the amount of work that the processor can do in a given period of time. To increase performance, we can either have the processor execute instructions in less time, or make each instruction it executes do more work. In basic instruction set design philosophy, this trade-off is reflected in the two main labels given to instruction sets. CISC stands for “complex instruction set computer” and is the name given to processors that use a large number of complicated instructions in order to do more work with each one. RISC stands for “reduced instruction set computer” and is the generic name given to processors that use simple instructions in order to do less work with each instruction but execute them much faster. RISC processors (like the Alpha and the UltraSparc) have much simpler and faster fetch/decode hardware, because their instruction set is small and each instruction has the same format and size. As a CISC processor, the Xeon features a more elaborate fetch/decode unit that reads a stream of variable-length, variable-format instructions from the L1
65 instruction cache. The decoder translates each instruction into a stream of one or more simpler instructions (µops) that is sent to the instruction pool.
When executing a program, all processors studied in this chapter follow a common routine: they fetch (issue) a number of instructions from the instruction cache, they decode each one of them, they read the operands, they execute the instruction, they write the result. This routine is implemented in a pipelined fashion that parallelizes disjoint stages. All processors are superscalar, i.e., they can issue multiple instructions per cycle (the Alpha and the UltraSparc can issue four and the Xeon three (µops)). In a given cycle, all processors can simultaneously execute two or less integer instructions, plus two or less floating point instructions, plus up to one load/store instruction. Unfortunately, database workloads typically consist of more than 30% load/store instructions that exhibit high data dependencies, and cannot fully exploit the issue and execution width of the processors.
In order to preserve data integrity and program correctness, the Alpha and UltraSparc processors execute instructions in logical program order (thus they are labeled “in-order” processors). The major advantage of in-order execution is that the hardware is kept simple and straightforward. The disadvantage is that when an instruction takes a long time to execute (e.g., a load miss waits for data to arrive from memory) subsequent instructions cannot be executed, even if they are not using the stalled instruction’s results; the processor must stop and wait as well. Any type of stall, instruction or data-related, is on the critical execution path of an in-order processor, and computation typically accounts for a large fraction of the execution time.
On the other hand, the Xeon uses an aggressive execution engine that is capable of executing instructions out of logical order, as long as there are no data dependencies and consistency is maintained (thus, the Xeon is labeled an “out-of-order” processor). Out-of-order pipelines are typically deeper than in-order pipelines, and exploit instruction-level parallelism (ILP) opportunity in the instruction stream by looking
66 several instructions ahead of the current program counter. For instance, if an instruction is stalled waiting for data to arrive from memory and subsequent instructions are independent of the stalled instruction’s results, the processor will proceed in executing the subsequent instructions. At the end of the pipeline, there is a retirement buffer that commits the instructions’ results in program order.
Out-of-order processors exploit non-blocking cache technology, and can usually overlap most of the first-level data cache stalls. When running on out-of-order processors, and the instruction stream exhibits low data dependencies, computation accounts for a relatively small fraction of the execution time, and instruction-related stalls are much more exposed than on in-order processors. Unfortunately, database instruction streams exhibit high data dependencies and low ILP opportunity, and do not fully exploit the out-of-order execution capability. Therefore, both computation and data and instruction-related stalls are high when running database workloads on an out-of-order processor.
Instruction-related stalls occur due to instruction cache misses and due to branch mispredictions. In order to hide the overhead associated with evaluating the branch condition, all processors predict branch targets, and evaluate the conditions as they fetch instructions from the predicted target into the pipeline. When a misprediction occurs, the pipeline stops, its current contents are deleted, and the processor starts fetching the correct instruction stream. Branch prediction accuracy is extremely important on the Xeon because, in its deep pipeline, mispredictions are more expensive (cause more stalls) than they are in these in-order processors. The typical branch misprediction penalty is 5 cycles for UltraSparc and the Alpha, and 15 cycles for the Xeon. In order to minimize mispredictions, the Xeon features a state-of-the-art predictor with over 98% prediction accuracy. As discussed further in Section 4.4.5, branch predictors in the Alpha and UltraSparc processors are simple and not as accurate as the one in the Xeon.
67 4.1.2 Memory Hierarchy
Table 4.2 compares the memory system design parameters of the four systems studied in this chapter. Several of the trade-offs involved in cache design are crucial to database system performance, because database workload behavior depends heavily on memory performance. In this section, we discuss the most critical of these trade-offs.
The ideal memory is large, fast, and inexpensive; however, in practice, as any two of these qualities improve, the third deteriorates. The popular memory support design for today’s processors is a multi-level memory hierarchy. As we move away from the processor and towards the main memory, the cache becomes larger and slower, and the cache “level” increases. Caches on the processor’s chip are faster, but their capacity is limited. In each of the processors studied in this chapter there are two first-level (L1) caches (one for data and one for instructions) which can typically be accessed in one to two processor cycles. The UltraSparc and the Xeon have an off-chip second-level (L2) unified cache. The Alpha has an on-chip second-level cache and an off-chip unified third-level (L3) cache.
Apart from the size and location, cache design also involves deciding the cache’s associativity and block size. The associativity denotes the number of alternative cache blocks that can serve as place-holders for a certain memory address. Programs incur three types of cache misses when running on a uniprocessor system: compulsory (that occur because the processor has never seen the data before), capacity (that would not occur if the cache were larger) and conflict (that would not occur if the associativity were higher) [30]. Larger caches fit more data and reduce memory traffic but are slower; high associativity reduces conflicts but requires more complicated access hardware, because the processor must search multiple blocks to determine a cache hit or miss.
68 TABLE 4.2: Memory system characteristics Sun UltraSparc Module / Characteristic Sun Ultra 60
Sun Ultra 10
Dell 6400 PII Xeon/MT
AlphaServer 4100 5/533
L1 Data Cache size
16 KB
16 KB
16 KB
8 KB
associativity
direct-mapped
direct-mapped
2-way
direct-mapped
block/subblock size (B)
32/16
32/16
32/32
32/32
writes
through
through
back
through
inclusion by L2
yes
yes
no
yes
size
16 KB
16 KB
16 KB
8 KB
associativity
2-way
2-way
4-way
direct-mapped
block/subblock size (B)
32/32
32/32
32/32
32/16
inclusion by L2
yes
yes
no
no
size
2MB
512KB
512 KB
96 KB
associativity
direct-mapped
direct-mapped
4-way
3-way
block/subblock size (B)
64/64
64/64
32/32
64/32
hit latency cycles (ns)
10 (34)
13 (44)
16 (40)
8 (15)
writes
back
back
back
back
inclusion by L3
N/A
N/A
N/A
yes
size
N/A
N/A
N/A
4MB
associativity
N/A
N/A
N/A
direct-mapped
block/subblock size (B)
N/A
N/A
N/A
64/64
hit latency cycles (ns)
N/A
N/A
N/A
40 (75)
writes
N/A
N/A
N/A
back
size
256 MB
256 MB
512 MB
8 GB
hit latency cycles (ns)
81 (275)
72 (241)
58 (146)
131 (252)
L1 Instruction Cache
L2 Unified Cache
L3 Unified Cache
Main memory
69 In the systems that we studied, the cache block size varies from 32 to 64 bytes. Smaller blocks minimize unnecessary traffic in the cache, whereas larger blocks waste cache bandwidth for useless data. On the other hand, cache blocks are indexed by a memory tag array, that contains one entry per block. Smaller blocks require a larger tag array, whereas larger blocks minimize the tag array size. To resolve this tradeoff, several designers choose a large block size and divide each block into two sub-blocks. Each sub-block is loaded and stored as a separate cache block, but two sub-blocks that belong to the same block can only may only store information from adjacent main memory addresses. For instance, loading an integer value in the UltraSparc’s L1 data cache will result in loading 16 bytes of data. Looking for a value in the cache involves searching the tag array to determine which 32-byte block the data resides in, and then access the correct subblock that contains the value. The UltraSparc’s L1 data cache and the Alpha’s L1 instruction and L2 cache use sub-blocks, which means that they need two load instructions to fill a cache block. As discussed later in this chapter, the major problem with subblocking is that it reduces the positive impact of the spatial data locality.
In order to minimize the memory traffic incurred by multiprocessor cache-coherence protocols, the UltraSparc guarantees that the contents of the first-level caches be a proper subset of the contents of the second-level cache at all times (cache inclusion). This way, when an datum does not exist in the L2 cache, the coherence protocol does not also have to search the L1 caches. When an L2 cache block is evicted in order to be replaced by another cache block, inclusion is enforced examining the L1 cache for the block and invalidating it there as well (if it is found). The disadvantage of this scheme is that, when the L2 cache has low capacity and associativity, inclusion may result in data and instructions in a program loop “stepping on each other’s toes” in the L2 cache, i.e., constantly replacing each other and forcing replacements and re-loads of the same data and instructions at the first-level caches. The Alpha maintains data inclusion for data caches, whereas the UltraSparc observes inclusion for both data and instructions. Therefore, the
70 Alpha does not evict an L1 instruction cache block when that block is replaced in the L2 cache. Finally, the Xeon processor does not observe inclusion in either the data or the instruction cache.
A cache feature often met in today’s microarchitecture is the ability to service a cache read request before the previous one is completed. Caches that exhibit this feature are referred to as “non-blocking”, require more sophisticated control hardware, and are mostly useful to out-of-order processors. The Xeon’s caches are non-blocking, whereas both the Alpha and the UltraSparc block on read requests. Write requests are typically non-blocking in all caches, even in in-order processors, in order to enable write optimizations. When a subsequent request needs to read data that is scheduled to be, but isn’t yet written by a previous instruction, the pipeline is stalled until the write completes.
4.2 Experimental Setup and Methodology
4.2.1 Workload
The workload consists of a range selection and four TPC-H queries, described in Section 3.4.1. The range selection query scans the TPC-H table lineitem with variable projectivity (1-15), selectivity (2%100%), and number of attributes involved in the condition (1-10). Most graphs present average measurements across all range query experiments under the label ‘RS’. TPC-H queries Q1, Q6, Q12, and Q14 are shown in Appendix B. In order to evaluate cache performance, we ran the queries against a 100-MB TPCH dataset, that fits in main memory.
71 4.2.2 Compilation
In order to perform a fair performance comparison across machines, we attempted to compile the workload using the same compiler, gcc v2.95.2, with the same compilation flags. First, we attempted to use all optimization flags; however, the version of the compiler for the Tru64 on the Alpha platform has severe bugs when the optimization flag -O2 is used. To maintain fairness across the systems, this flag was initially omitted in all the platforms. However, as shown in Sections 4.3.1 and 4.3.2, omitting -O2 incurs severe performance penalty on the UltraSparc and Xeon platforms. In order for the results presented to be as realistic as possible, we included the optimization flag in the experiments measured on the UltraSparc and on the Xeon, and redefined the fairness requirement as “the same compiler and version with the highest possible degree of optimization per platform.”
4.2.3 Measurement Method
The insights drawn in this chapter are based on experiments that employ the hardware counters available on most of today’s processors. Fortunately, all processors studied in this chapter have hardware performance counters, and there is software that can be used to measure countable events. However, in most cases, reporting meaningful statistics from the counter values is not a straightforward task, because:
1. The sets of measurable event types differ significantly across processors. For example, one can measure the number of branch mispredictions on the Xeon, but the UltraSparc will only offer a semi-accurate measurement of stall time due to branch mispredictions. Therefore, to compare the branch misprediction rate and the misprediction penalty, one needs to apply “magic” fudge factors on the reported values and estimate the desired quantities.
72 2. Counter values reported are often inaccurate, for two reasons. First, not all processor vendors have invested the same effort in accurately designing the counters and making the measurements available to the user-level software. Second, execution inside the processor follows several alternative paths, and intercepting all the paths at the appropriate points to measure certain event types is not always possible. Therefore, the occurrence counts for these events are either overestimated or underestimated. A related problem is measuring stall time: a cycle during which a processor is stalled may be attributed to a number of reasons (memory, misprediction, functional unit unavailability, data dependency, etc.). In several cases it is not clear which pipeline stage or memory system component is really responsible.
3. The methods each software package uses to export counter values differ across processors and packages. There are two software package categories: The first consists of relatively simple programs that simply set the counter to zero, assigns event type codes to them, and reads the values after a specified amount of time or after a program has completed execution. The second category includes software that samples each event type in time intervals and reports the results from the sampling.
We tested several different (proprietary or public-domain) software packages for each platform. To evaluate each software package, we used microbenchmarks that exhibit predictable event count results. An example of such microbenchmarks are programs that walk through a large integer array and incur predictable number of cache misses at all cache levels. The software we chose for each platform combines the best we found in terms of correctness, robustness, repetitiveness of results, and support from its makers.
On the Solaris/UltraSparc platform, we used a slightly modified version of the interprocedural instrumentation library written by Glenn Ammons and used in previous work [3]. The interface is a simple counting tool that sets the two UltraSparc counting registers to zero, assigns two event types to them, and reports two counter values per program execution.
73 On the Linux/Xeon platform, we used the Performance Data Standard and API (PAPI) [41], a publicdomain library that offers access to counters on numerous hardware platforms, hiding the platform-dependent details behind a common programming interface. We used PAPI to obtain exact counter values for two event types per program execution, because the Xeon has two hardware counters.
On the OSF1/Alpha platform, we used a sampling tool from Compaq, called “DIGITAL Continuous Profiling Infrastructure” (DCPI) [4]. DCPI is a set of tools to sample the performance counters during program execution, gather data in a database and generate summary reports. In order to gather data, the DCPI daemon is started with a set of event types to sample as parameters. The Alpha 21164 has three counters, one of which can only count processor cycles, while the other two can count other event types. To maximize accuracy, we sampled one pair of event types per execution, and extracted useful information from the DCPI reports using our own scripts.
Finally, the values collected on each platform were used as input to a set of formulae in order to obtain performance statistics.
4.3 Workload Behavior on Individual Machines As described in the previous section, each processor has a different set of countable event types and different performance counter implementations. Consequently, the set of available measurements differs across machines. In addition, the UltraSparc and the Xeon execute optimized code, that exhibits different behavior than the unoptimized version. This section discusses behavior that was observed on each machine individually.
74 4.3.1 Sun UltraSparc
There are two major observations from execut-
Sun UltraSparc-II i / breakdown 1
First, the optimized code executes 30-66% fewer instructions than the unoptimized code, resulting in less time spent in the pipeline and in data and instruction-related stalls. Figure 4.1 depicts the effect on the execution time breakdown for the
normalized clock cycles
ing our workload on the UltraSparc platforms.
0.8 0.6 0.4 0.2 0 n/o o
US-IIi (the US-II exhibits similar behavior). On
RS Pipeline
n/o o
n/o o
n/o o
n/o o
Q1
Q6
Q12
Q14
D-stalls
the horizontal axis RS shows the average for
FIGURE 4.1. Normalized execution breakdown comrange selection queries, whereas Q1-Q14 corre- parison between the unoptimized UltraSparc-IIi executable (n/o) and the one optimized with -O2 (o). spond to the TPC-H queries. Pipeline denotes time spent in the pipeline (computation and functional unit-related delays), D-stalls include delays due to data cache misses and data dependencies, and I-stalls include delays due to instruction cache misses and branch mispredictions. The optimized executable runs in less than half the time spent by the unoptimized one, therefore for the rest of this chapter we consider results from the optimized executable.
Second, when cache inclusion is maintained, the L2 cache size significantly affects performance during sequential scans. We compared our workload’s behavior between the US-II and the US-IIi [44], which is the low-end, highly integrated derivative of the US-II. Cache configuration is common between the two platforms, except for two characteristics [25]:
1. The US-II has a 128-bit interface from the L2 to the L1 caches, whereas the US-IIi has a 64-bit interface. This means that the US-II can fill its L1 cache with half as many accesses as the US-IIi.
75 2. The L2 cache of the US-II is 2MB, i.e., four times as large as that of the US-IIi.
The L1 interface bandwidth should not directly affect performance, because this workload is bound by latency, rather than bandwidth [1]. The bandwidth limitation, however, increases the total time needed to fill one cache block. The cache size difference should not be important when executing sequential scans, because we only access the table data once. We measured the same executable was measured on both systems, and the same number of data and instruction references to the first-level caches was observed. Therefore, the L1 cache behavior should not vary significantly between the US-II and the US-IIi.
Figure 4.2 shows that the above conjecture is false.
UltraSparc II/IIi Cache Comparison 1
During execution of the range selection queries, the
machines, and the US-II executes 37% faster than the US-IIi. The US-IIi misses at the L1 data and instruc-
0.8 normalized unit
L1 cache behavior varies significantly across the two
0.6 0.4
tion cache twice as often as the US-II. This behavior
0.2
is due to the enforcement of the inclusion principle
0
between the two cache levels. The US-II instruction
Elapsed L1D L1I L2D L2I tim e m isses m isses m isses m isses
UltraSparc-IIi
accesses on the L2 cache almost never miss, because the L2 cache is large enough for the instruction footprint (2MB). However, the US-IIi L2 instruction miss
UltraSparc-II
FIGURE 4.2. Comparison of normalized cache performance between an US-II and and US-IIi. The results shown are averages across all range selection queries.
rate is 2.6%, because instructions conflict with data on the second-level cache. When a block of data needs to be replaced by a block of instructions on the L2 cache, the data is also invalidated on the L1 data cache due to the use of inclusion. The scan operator’s execution is entirely based on a loop, therefore the invalidated data include local loop variables that are likely to be re-fetched from main memory during the next loop iteration. In addition, when a block of data replaces a block of instructions in the L2, the instructions
76 are evicted from the L1 instruction cache. Again, loop instructions are being fetched multiple times, hence the increased instruction miss rates at both cache levels.
4.3.2 Intel Pentium II Xeon
Similarly to the UltraSparc, the Xeon executes
Intel PII Xeon / breakdown 1
mized executable than when running the unoptimized one. Figure 4.3 shows the direct effect of the instruction count on the computation and the instruction-related stall time. Pipeline denotes time
spent in the pipeline (computation), D-stalls include delays due to data cache misses and data dependen-
normalized clock cycles
30-60% fewer instructions when running the opti-
0.8 0.6 0.4 0.2 0 n/o o RS
n/o o Q1
Pipeline
n/o o Q6 D-stalls
n/o o Q12
n/o o Q14 I-stalls
cies, and I-stalls include delays due to instruction
FIGURE 4.3. Normalized execution breakdown comparison between the unoptimized i686 executcache misses, branch mispredictions, and ITLB able (n/o) and the one optimized with -O2 (o). misses. Data-related stalls are not reduced at all with optimization, because most of the memory accesses the -O2 flag eliminates hit on the L1 data cache and a few hit on the L2 cache. The latter incur no penalty, because the out-of-order engine overlaps the L2/ L1 transfer latency involved with computation. Finally, the elapsed execution time for the optimized code is less than half the execution time for the unoptimized code.
In Chapter 2, we presented an analysis across four commercial database management systems running on the Xeon processor under the NT operating system. Figure 4.4 shows why our prototype database system based on the Shore Storage Manager is a viable sequential scan analysis testbed both under NT and under Linux. The leftmost graph of Figure 4.4 shows the elapsed time breakdown when running range
77 Elapsed time breakdown
Memory stall time breakdown
80%
80%
Memory stalls (%)
100%
Elapsed time (%)
100%
60% 40% 20% 0%
60% 40% 20% 0%
A
B
C
D
Commercial DBMS Pipeline
Memory
Br. Misp
NT
Linux
A
Shore Depend
B
C
D
Commercial DBMS L1 Data
L2 Data
L1 Instr
NT
Linux
Shore L2 Instr
FIGURE 4.4. Comparison of elapsed time (left) and memory stall time (right) breakdowns across four commercial database systems (A, B, C, and D) and Shore (on NT and Linux) running a range selection query using sequential scan with 10% selectivity.The striped part labeled Memory on the left is analyzed into individual cache stalls due to data and instructions on the right. selections on four commercial DBMSs and Shore on top of NT 4.0, and on Shore on top of Linux 2.2. The rightmost graph shows the cache-related stall time breakdown into components due to first and secondlevel cache data and instruction misses. The experiments with Shore corroborate previous results: (a) the execution time spent in useful computation is at most 50%, (b) the memory, branch misprediction, and dependency/resource related stall time is significant, and (c) the memory-related bottlenecks are the firstlevel instruction cache and data misses on the second-level cache. The conclusion is that Shore and commercial database systems exhibit similar behavior, and that, when Shore executed sequential scans, bottlenecks are common across operating systems.
4.3.3 Compaq Alpha 21164
As discussed in Section 4.2.3, we were not able to optimize the Alpha executable to the same extent as the UltraSparc and the Xeon executables are, therefore we are unable to demonstrate the relative perfor-
78 mance of an optimized versus an unoptimized executable on this processor. On the other hand, on the Alpha we are able to study stall time in more detail than on the other processors, and gain insight on the significance of each stall time component. This section discusses the Alpha stall time by breaking it into dynamic and static stalls.
Dynamic stalls are mainly due to cache and TLB misses, and branch mispredictions. Dynamic stalls cannot be predicted simply by looking at the instruction stream, account for about half the execution time, and are further analyzed in Section 4.4. Static stalls are delays that the processor would suffer even if there were no dynamic stalls. For example, a load from memory takes two cycles, assuming an L1 data cache hit, whereas additional stall cycles due to a cache miss are considered dynamic. DCPI, the sampling tool used to access the Alpha performance counters, produces an execution time breakdown into computation, dynamic stalls, and static stalls. If an instruction is stalled for multiple reasons, the static stall cycles are attributed to the last reason preventing instruction issue. Thus, shorter stalls are hidden by longer ones.
The leftmost graph of Figure 4.5 shows the CPI breakdown for the Alpha when executing the range selection and the four TPC-H queries into computation, dynamic stalls, and static stalls. Computation time includes mostly useful computation (17-29%), plus 1-2% due to nop’s (instructions often inserted deliberately by the compiler to improve pipeline execution). About 11-20% of the time is due to static stalls (striped part of bars). In the rightmost graph of Figure 4.5, static stalls are further analyzed into five components:
•
Slotting stall cycles are due to static resource conflicts among the instructions within the same “window” that the processor considers for issue in any given cycle. The Alpha pipeline exhibits an elaborate pre-issue logic which, although in-order, is not met inside the UltraSparc processors, although both microarchitectures are in-order. The pre-issue logic is implemented by a slotting mechanism that
79 CPI breakdown
Static stall time breakdown 100% Static stall time (%)
Clock cycles / instr. (%)
100% 80% 60% 40% 20% 0%
80% 60% 40% 20% 0%
RS
Q1
Q6
Q12
Q14
RS
Q1
Query Computation
Dynamic Stalls
Q6
Q12
Q14
Query Static Stalls
Slotting
Ra dep
Rb dep
Rc dep
FU
FIGURE 4.5. CPT (left) and static stall time (right) breakdown when executing a range selection (RS), and four TPC-H queries (Q1-Q14).On the left, pipeline denotes computation time, and dynamic stalls includes unpredictable delays due to cache misses and branch mispredictions. The static stalls component includes predictable stalls and is analyzed in the graph on the right into delays due to unbalanced use of resources in the instruction slot (slotting), register dependencies (Ra/Rb/Rc), and functional unit conflicts (FU). pre-evaluates the incoming instruction stream and swaps instructions around so that they are headed for pipelines capable of executing them. This mechanism ensures optimal mapping of the instructions to the appropriate pipelines, but also incurs additional delays in high-dependency instruction streams.
•
Ra/Rb/Rc dependency stall cycles are due to register dependencies on previous instructions. Instructions operate on two operands stored in registers Ra and Rb and store the result in Rc. Each component involves the corresponding register of the stalled instruction.
•
FU dependency stall cycles are due to competition for function units and other internal units in the processor (e.g. integer/floating point units, but not memory buffers).
The rightmost graph in Figure 4.5 shows three interesting facts.
80 1. Stalled instructions usually wait for the registers holding the operands to become available; the result register is never a problem. This suggests that previous load instructions are not expected to complete on time for the operands to be ready to use. Additionally, one of the major advantages of out-of-order processors is that they hide Rc-type dependencies, using a technique called register renaming [28]. However, the lack of Rc-type dependencies in the database workload questions the usefulness of this feature.
2. There is virtually no competition for functional units in the issue or the execution stage, because the database instruction stream is bound by memory operations.
3. The processor’s capability to execute up to 5
A21164 Cycle Issue Breakdown
database workload instruction mix, because only
80%
one load/store instruction is allowed per cycle. The slotting function determines which instructions will
clock cycles (%)
instructions per cycle cannot be exploited by the
100%
60% 40%
be sent forward to attempt to issue, obeying the
20%
instruction mix restrictions. Therefore, slotting
0% RS
delays cause the processor to issue fewer instructions than the maximum issue width. The stall time
Q1
Q6
Q12
Q14
query pipeline dry
0-issue
1-issue
2-issue
FIGURE 4.6. Breakdown of Alpha execution due to slotting accounts for 30-40% of the static cycles in terms of instruction issue for the range selection (RS) and four TPC-H queries. During stalls. Moreover, as shown in Figure 4.6, over half pipeline dry cycles, there are no instructions to issue; during 0-issue cycles there are instrucof the time no instructions are issued; 30-40% of the tions, but none can be issued, due to conflicts. time there are no instructions to issue (pipeline is dry), whereas over 10% of the time none of the available instructions can issue (0-issue). Although the Alpha is capable of issuing up to 4 instructions per cycle, our experiments exploit the full width. On
81 the average, 55% of instructions issue in single-issue cycles, 45% issue in dual-issue cycles, and there are no triple or quad-issue cycles. Similar behavior was observed with the Xeon processor [1].
4.4 Comparison Across Systems As was explained in Sections 4.1 and 4.2, the machines under consideration have little in common in terms of system design, measureable events, and measuring software. Not all types of stall time components can be measured reliably on all machines. Whenever finer detail is needed than the measurement granularity available, we use estimated data to show trends (and we note that the data presented are estimated).
This section compares workload behavior across four systems. First, we briefly discuss a popular performance metric (SPEC) and the reasons it is not indicative of database performance. Then, we compare the instruction stream behavior and execution time breakdowns of the database workload across the machines, and elaborate on data and instruction cache performance. Finally, we discuss the impact of branch prediction accuracy on system’s performance.
4.4.1 SPEC Performance
For several years, processor design evaluation and architectural decisions have been largely based on the SPEC [63] CPU benchmark performance. The SPEC CPU benchmark is composed by an integer suite (CINT95) and a floating point suite (CFP95). Table 4.3 lists the SPEC benchmark results for the three processors under consideration. Each number reported in Table 4.3 is the result of dividing the average execution time of all the benchmarks in the suite on the measured system by the execution time on a common
82 reference machine (higher is better). The column labeled “Result” reports results when executing optimized code, whereas the baseline performance is the execution rate without optimization.
The database workload performs mostly integer computations, therefore the CINT95 results are a better database performance indication that the CFP95. Three important observations can be made by looking at the SPEC result table. First, when comparing integer performance, at 300 MHZ the UltraSparc is by far the slowest processor. Second, although the Xeon speed is only 400 MHz and the Alpha provides a powerful 533 MHz, the Xeon manages to climb close to the Alpha performance level on the CINT95 benchmark. On the other hand, it is almost as slow as the US-IIi when executing the floating-point benchmark. The SPEC
TABLE 4.3: SPEC results for each of three processors Vendor
System (Processor) Sun
Intel
Compaq/Digital
Benchmark
Result
Baseline
Ultra 60 296MHz (UltraSparc-II)
CINT95
13.2
10.5
CFP95
18.4
17.1
Ultra 10 300MHz (UltraSparc-IIi)
CINT95
12.1
9.57
CFP95
12.9
12.0
Intel MS440GX (Pentium II Xeon)
CINT95
16.3
16.3
CFP95
13.2
12.0
AlphaServer 4100 5/533 (Alpha 21164)
CINT95
16.9
16.8
CFP95
21.9
20.4
floating-point benchmarks are mainly bound by main memory bandwidth, and the US-II’s memory bandwidth is more than both the US-IIi’s and the Xeon’s. Third, the optimized code runs 20% faster on the Sun than the unoptimized code, but optimization flags don’t make a difference in the other two systems as far as integer benchmark performance is concerned. However, experiments with a database system have shown that optimization improves performance by up to 67% on both the US-IIi and the Xeon processors
83 (see sections 4.3.1 and 4.3.2). The conclusion is that SPEC benchmarks are an indication of the performance differences across computer platforms, but are not representative of database performance.
4.4.2 Database Workload Instruction Stream
To determine how well the processor copes with the instruction stream., researchers often use the clockper-instruction rate (or CPI). CPI represents the average number of clock cycles the processor takes to execute one instruction. In this chapter, however, CPI cannot be used as a metric to compare performance, because we are studying machines with fundamental architectural differences (RISC vs. CISC). We only use normalized CPI measurements in this section, in order to study the behavior across queries and compare the variation of inter-query measurements across systems.
The processors studied in this chapter can issue three (Xeon) or four (Alpha and UltraSparc) instructions each clock cycle. The set of issued instructions may contain up to one load/store, up to two integer, and up to two floating-point instructions. Therefore, they should reach peak performance with instruction streams composed by roughly 20% load/store instructions, that hit in the first-level data cache (for in-order processors) or hit in the second level cache and exhibit low data dependencies (for out-of-order processors that can overlap most of the first-level data cache stalls). The database instruction stream on the UltraSparc and the Alpha consists of 30-35% load/store instructions. On the Xeon processor, the CISC load/store instructions account for more than 60%, and, presumably, the percentage drops to the same level as the other two platforms as the instructions are decoded into µops. In addition, the database instruction stream exhibits high data dependencies, and occasionally perform aggressive computation. From the queries in our workload, the plain sequential scan queries (RS in the graphs) scans a table and performs minimal computation, while TPC-H Q1 and Q6 scan the same table and perform more computation (but Q1’s selectivity is close to 100% whereas Q6’s selectivity is 2%, therefore Q1 performs more computation than Q6). TPC-H Q12
84 and Q14 scan two tables each and apply an order of magnitude more pressure on the memory system and the execution engine because they build and parse hash tables (Q14 is more data-demanding than Q6).
Figure 4.7 shows the normalized CPI rate for the US-
Normalized CPI Rate 2.5
II, the US-IIi, the Xeon, and the Alpha. The CPI rate for RS is set to one, and the CPI rates for the rest of
clock cycles / ins
2
the queries are shown relative to RS. The difference 1.5
in CPI rates across queries indicates that, due to the 1
memory-intensive instruction mix, queries with a
0.5
higher demand for data apply more pressure on the memory subsystem. For instance, Q14 is the most
0 US-IIi
RS
Q1
US-II PII Xeon A21164 query Q6
Q12
Q14
data and instruction-intensive query, the per-instruction stall time incurred by this query is higher, there-
FIGURE 4.7. Normalized (relative to RS=1) clock- fore the average number of cycles spent to execute an per-instruction (CPI) rate when running a range selection (RS) and four TPC-H queries on an US- instruction increases. IIi, an US-II, a Xeon and an Alpha. Increased memory stalls are more exposed on an out-of-order processor than on in-order processors. The pipelines inside the UltraSparc and the Alpha are in-order, and stops on every stall; Xeon’s out-of-order only stops when there are no other instructions to execute due to data dependencies. Therefore, the Xeon’s CPI exhibits little variation when executing the three first queries, but as the pressure for data and instructions increases the impact on CPI is much higher than it is on the other two systems. Between the two inorder UltraSparc systems, the US-II CPI rate varies the least across queries, because its L2 cache is four times larger than the US-IIi’s L2 cache. Finally, the Alpha combines a high-frequency, in-order execution engine with a deep memory hierarchy (three cache levels). Nevertheless, CPI variation between selections
85 PII Xeon CPT breakdown
US-II CPT breakdown
cycles per record (%)
A21164 CPT breakdown
100%
100%
80%
80%
80%
60%
60%
60%
40%
40%
40%
20%
20%
20%
0%
0%
0%
100%
RS
Q1
Q6
Q12 Q14
Query Data stalls
Instruction stalls
RS
Q1
Q6 Q12 Q14 Query
Branch Mispredictions
RS
Q1
Q6
Q12 Q14
Query Computation/other stalls
FIGURE 4.8. Clock-per-tuple (CPT) breakdowns when executing a range selection (RS), and four TPC-H queries (Q1-Q14) on the US-II (left), the Xeon (center) and the Alpha (right). Data and instruction stalls are due to data and instruction cache misses at all cache levels, respectively, while Branch Mispredictions denotes branch mispredistion related delays. The top-most part of the bars includes computation and other stalls. and joins is higher on the Alpha than on the UltraSparc because (a) its L2 cache is too small (96K) to sustain the misses from L1 and (b) its L3 cache, although large (4MB), has high access time (40 cycles).
4.4.3 Execution Time Breakdown
In order to compare the execution time breakdown across systems, we use the clock-per-tuple (CPT) rate instead. The CPT rate represents the average number of clock cycles needed to process one record when executing a query, and is given by the fraction of the total number of cycles the query takes to execute divided by the total number of records processed by the query. For the queries RS, Q1, and Q6, the denominator is the cardinality of the lineitem relation, while for Q12 it is the sum of the cardinalities of lineitem and orders and for Q14 it is the sum of the cardinalities of lineitem and part.
Figure 4.8 presents a high-level CPT breakdown when executing our workload on the US-II (left), the Xeon (center), and the Alpha (right). The two lower parts of the bars represent stall time due to misses at
86 TABLE 4.4: UltraSparc-II CPT Breakdown Component
RS
Q1
Q6
Q12
Q14
Data-related stalls
461
418
305
4,692
6,686
Instruction-related stalls
307
87
123
447
296
Branch misprediction stalls
330
198
180
1746
414
Computation & other stalls
1,635
1,308
1,003
8,638
8,616
Total
2,734
2,010
1,611
15,522
17,012
TABLE 4.5: Pentium II Xeon CPT Breakdown Component
RS
Q1
Q6
Q12
Q14
Data-related stalls
308
639
291
8,550
15,893
Instruction-related stalls
883
519
561
1,116
662
Branch misprediction stalls
269
153
60
300
88
Computation & other stalls
1,481
1,118
952
4,821
8,800
Total
2,941
2,428
1,864
14,787
25,442
TABLE 4.6: Alpha 21164 CPT Breakdown Component
RS
Q1
Q6
Q12
Q14
Data-related stalls
938
867
655
7,769
15,789
Instruction-related stalls
3,291
3,187
2,939
5,713
4,290
Branch misprediction stalls
111
119
93
130
91
Computation & other stalls
5,044
6,168
4,517
12,129
10,492
Total
9,383
10,341
8,204
25,742
30,662
all cache levels during data and instruction accesses, respectively, while the third part represents stall time due to branch mispredictions. The top part includes stall time due to other reasons (resource availability, data dependencies, and others) and time spent in useful computation. Due to the high variation across queries (for example, CPT is typically 7-10 times higher for Q14 than it is for RS) we present the trends in
87 US-IIi Cache miss stalls
Cache stall CPT (%)
US-II Cache miss stalls
PII Xeon Cache miss stalls
100%
100%
80%
80%
80%
60%
60%
60%
40%
40%
40%
20%
20%
20%
0%
0%
100%
0% RS
Q1
Q6 Q12 Q14
RS
Query L1 Data stalls
L2 Data stalls
Q1
Q6 Q12 Q14 Query L1 Instruction stalls
RS
Q1
Q6
Q12 Q14
Query L2 Instruction stalls
FIGURE 4.9. Breakdowns of stall time related to cache misses for a range selection (RS), and four TPC-H queries (Q1-Q14) on the US-IIi (left), the US-II (center) and the Xeon (right). Stall time is broken into penalty from data and instruction misses on the first and second-level caches. 100% stacked columns, and show the percentage each value contributes to the total CPT. The absolute CPT numbers are shown in Tables 4.4, 4.5, and 4.6. In most cases, the Alpha numbers are 2-5 times higher than on the other machines; this is natural since the executable on the Alpha is unoptimized
The main observations from Figure 4.8 are that (a) the total memory and branch misprediction stalls account for 35-68% of the execution time (corroborating previous results [1]) and (b) data accesses are the major memory bottleneck, especially for the join queries Q12 and Q14. The rest of this section discusses the trends across the three computer microarchitectures and the different queries in the workload in terms of overall performance, cache performance, and branch mispredictions.
4.4.4 Cache Performance
As shown in Figure 4.8, cache-related delays typically account for 30-65% of the overall execution time. Figure 4.9 shows the cache-related stall CPT breakdown for the two UltraSparc processors and the Xeon. The graphs present the stall cycles per instruction due to first or second-level cache misses, for data (bot-
88 tom two parts of the bars) and instructions (top two parts of the bars). Unfortunately, there is no reliable way to accurately measure the stall time due to individual cache levels on the Alpha. The estimated stall breakdown for the Alpha is shown in Figure 4.10.
In Chapter 2, we measured four commercial database systems
Xeon processor. We concluded that, for these experiments, (a) the first-level data and second-level instruction cache misses are responsible for a small percentage of the execution time, and (b) the memory bottlenecks are data accesses the second-level
Cache stall CPT (%)
running sequential or indexed scans and sort-merge joins on a
A21164 Cache miss stalls 100% 80% 60% 40% 20% 0% RS
cache first-level instruction accesses (i.e., the first-level instruction cache and fetch unit). This section analyzes data and
L1-Dat
Q1
Q6 Q12 Q14 Query
L2-Dat
FIGURE 4.10. Estimated memory stall instruction cache behavior when running sequential scans, as time breakdown on the Alpha into time due to data and instruction-related well as hash-join queries, and compares results from four sys- cache misses. tems.
4.4.4.1 DATA
The conclusions from earlier experiments about the relatively low impact of first-level data cache misses are corroborated when running queries RS, Q1, and Q6 on the UltraSparc and on the Xeon. However, the L1 data cache becomes increasingly important when executing hash join queries. On all processors, running TPC-H queries Q12 and Q14 incurs an order of magnitude higher first-level data cache miss rates. Profile analysis on the workload shows that 70% of the first-level data misses are spent in two functions, the one that inserts a record to the hash table and the probing function that looks for a match in the hash table. These two functions are the source of almost all the stall time due to L1 data cache misses. The hash
89 L1 Data Cache Misses / Projectivity
L1 D Misses / Selectivity
180 140
# misses / record
# misses / record
160 120 100 80 60 40
200 180 160 140 120 100 80 60 40 20 0
20 0 1
2
3
4 5
6
2%
7 8 9 10 11 12 13 14 15 projectivity
UltraSparc-II
UltraSparc-IIi
PII Xeon
10% 20% 50% 100% selectivity A21164
FIGURE 4.11. First-level data cache misses per record when executing a range selection (RS, average) and four TPC-H queries on an US-II, an US-IIi, a Xeon and an Alpha as a function of the projectivity (left) and the selectivity (right). table creation and probing increase the data footprint of the query during the join operation, and the firstlevel data cache is not large enough to store the entire hash table.
There are four reasons why a processor will incur first-level data cache misses: limited cache capacity, low associativity, small cache blocks, and inclusion between cache levels. Figure 4.11 shows that, during sequential scans, the Xeon incurs far fewer misses than the other systems, because it combines a 16-KB, 2way associative, 32-byte block first-level data cache and it is not inclusive. The UltraSparc uses 32-byte blocks as well, but each block is divided into two 16-byte sub-blocks that are loaded and stored individually. However, sub-blocking prevents the UltraSparc cache from fully exploiting spatial data locality. For instance, in order to load two record values that are less than 32 bytes and more than 16 bytes apart, it incurs two cache misses whereas the Xeon will incur only one.
90 In addition, processors that maintain inclusion between the first and second cache levels exhibit more first-level cache stalls. In Section 4.3.1, we compared cache behavior between the US-IIi and the US-II and explained how the data and instructions “step on each other’s toes” in the small and direct-mapped L2 cache of the US-IIi. The comparison between the US-II and the US-IIi showed that a large L2 cache can improve L1 performance, whereas the comparison between the Xeon and the UltraSparc shows that, when the inclusion principle is enforced on direct-mapped data caches, the number of data misses increases. The L2 cache block is 64 bytes; when an L2 data block is replaced by another, inclusion will result in the eviction of four sub-blocks in the L1 data cache. It is possible that a subset of the evicted blocks contained data needed in the next loop iteration, which will reload the same data from main memory. Finally, the Xeon’s first-level data cache is 2-way set associative. Therefore, it incurs fewer conflict misses than the UltraSparc’s direct-mapped L1 cache.
The Alpha maintains data inclusion across all three cache levels. Both the L1 and L2 caches have limited capacity (96K L2 and 8K L1) and are direct-mapped. As a consequence, 15% of the memory-related stalls on the Alpha are estimated to be due to L1 misses. Figure 4.11 shows that, when executing range selections with variable projectivity (left) and selectivity (right), the Alpha is practically thrashing on the first-level cache, and the number of misses incurred per record is three to fifty times higher than the other processors.
4.4.4.2 INSTRUCTIONS
A non-inclusive, moderately sized L2 cache with high associativity is enough to sustain the instruction footprint and avoid conflicts between data and instructions, minimizing the stall time due to second-level instruction misses. An example is the Xeon, that has a 512-KB L2 cache with 4-way associativity. The second-level instruction misses do not incur a significant stall time on this processor (shown in the rightmost graph in Figure 4.9). In contrast, the Alpha features a fast but tiny (96 KB) on-chip L2 cache, and the L2
91 instruction stalls account for 15-46% of the overall memory stall time (shown in Figure 4.10). The US-IIi has a 512-KB L2 cache, but it is direct-mapped, resulting in increased conflict misses between data and instructions when compared with the Xeon. Consequently, the percentage of stall time due to second-level instruction misses (shown in the leftmost graph in Figure 4.9) is higher on that processor. The US-II (middle graph in Figure 4.9) has a direct-mapped L2 cache as well, but it is four times larger (2MB), therefore the second-level instruction stall time is insignificant.
The instruction behavior across all machines is consistent with our earlier observations. Access to the first-level instruction cache is the dominant reason for memory stalls during queries RS, Q1, and Q6 on all platforms. L1 instruction stalls account for 40-85% of the memory stall time, for two reasons. First, Xeon is a CISC processor, and instructions need more complex hardware in order to be fetched and decoded than RISC instructions. The Xeon length decoder and fetch hardware introduces delays that are included in the L1 instruction stalls shown in the graph. Second, L1 instruction misses are expensive and incur significant delays. The RISC processors, although they do not incur fetch-related delays, they still exhibit high instruction stalls due to L1 instruction cache misses. Nevertheless, when executing hash join queries, the data stalls eventually dominate execution, because the out-of-order engine is not capable of hiding any of the L2 data stalls. An interesting example is the US-II, that completely minimizes instruction-related stalls when executing the hash joins, because the instruction footprint fits in its generous 2-MB L2 cache.
The US-II cache stall CPT breakdown looks similar to the Xeon when running the three first queries. Its bottleneck is exclusively at the first cache level for both data and instructions when running the join queries, because the L2 cache is sufficiently large to sustain both the data and instruction footprint.
92 4.4.5 Branch Mispredictions
The instruction fetch/decode unit in the Xeon processor uses a highly optimized branch prediction algorithm to predict the direction of the instruction stream through multiple levels of branches, procedure calls, and returns. The algorithm used is an extension of Yeh’s algorithm [60], which typically exhibits an accuracy of about 98%. The reason for such a sophisticated branch prediction algorithm is that within the instruction window there may be numerous branches, procedure calls, and returns, that must be correctly predicted for the execution unit to do useful work. In addition, the misprediction penalty is much higher than in the other processors (15 cycles), because the Xeon has a deeper pipeline [31].
On the other hand, both the UltraSparc and the Alpha record the outcome of the branch instructions in a 2-bit history state. The Alpha provides 2-bit history information for each instruction location in the instruction cache, whereas the UltraSparc provided it for every two instructions. This information is used as the prediction for the next execution of the branch instruction. The branch predictors used in these processors have a typical accuracy of about 87% (measured on SPECInt workloads).
Table 4.7 shows the branch frequency and misprediction rate on the Xeon and on the Alpha (we found no reliable way to accurately measure these quantities on the UltraSparc systems). The Alpha executable exhibits far lower branch frequency, because it is unoptimized (optimized executables include 20-25% branch instructions). The impact of the sophisticated prediction mechanism on the Xeon’s performance is obvious from the low branch misprediction rate; the prediction logic in the Alpha predicts the wrong way five to six times more often than the Xeon. On the other hand, mispredictions on the Xeon are three times more expensive than on the Alpha. Therefore, when compared to the Xeon, branches on the Alpha are rare and mispredictions are cheap. As shown in Figure 4.8, stalls related to branch mispredictions do not account for a significant fraction of the Alpha’s CPT.
93 The UltraSparc’s branch predictor is similar to the one inside the Alpha, and mispredictions incur the same misprediction penalty. However, the UltraSparc executable is optimized, and branch frequency is expected to be 20-25%. Therefore, as shown in the leftmost graph in Figure 4.8, misprediction stall time on the US-II accounts for 7-13% of the execution time, whereas on the Xeon it only accounts for 2-7% of the execution time.
TABLE 4.7: Branch behavior Characteristic
P II Xeon
Alpha 21164
Branch frequency RS, Q1, Q6
18%
7%
Q12, Q14
22%
9%
RS, Q1, Q6
3.5%
15%
Q12, Q14
1%
6%
Branch penalty (cycles)
15
5
Branch misprediction rate
4.5 Putting It All Together: Comparison Between NSM and PAX In Chapter 3 we introduced a novel data page layout, called Partition Attributes Across (PAX). We presented results from running our workload with PAX on the Xeon processor on top of the Windows NT 4.0 operating system, and demonstrated that PAX is beneficial for all types of queries in the workload. This section compares PAX across the various platforms.
Use of PAX instead of NSM improves the spatial data locality during sequential scan, especially when the query accesses a fraction of the record in order to evaluate a condition. Therefore, the larger the cache block size, the less often an algorithm that uses PAX will incur cache misses. In other words, the data miss rate improvement from using PAX (defined as the number of data misses divided by the number of data
94 PAX savings on L2 data miss rates
PAX / NSM speedup 45% 40%
100%
35%
80%
speedup (%)
L2D miss rate improv. (%)
120%
60% 40%
25% 20% 15% 10%
20%
5%
0%
0% RS
US-IIi
30%
US-II
Q1
Q6 query PII Xeon
Q12
Q14
A21164
RS
US-IIi
US-II
Q1
Q6 query PII Xeon
Q12
Q14
A21164
FIGURE 4.12. PAX improvement over NSM on L2 data miss rate (left) and elapsed execution time (right) when running the range selection queries (RS), the TPC-H queries on four platforms. accesses) is expected to increase as a function of the block size. The cache with the highest miss penalties is L2 in the case of the UltraSparc and the Xeon, and L3 in the case of the Alpha. As shown in Table 4.2, the Xeon’s L2 cache block size is 32 bytes, whereas the UltraSparc’s L2 and the Alpha’s L3 cache block size is 64 bytes. Therefore, we expect that PAX improvement on L2 (L3) data miss rates on the UltraSparc (Alpha) will be higher than on the Xeon. As shown in the leftmost graph of Figure 4.12, in almost all cases the above conjecture is true. When using NSM, Q12 exhibits an unusually low miss rate for the Xeon (9% versus 88% for Q1 and Q6 and 45% for Q14) and that is almost completely eliminated when using PAX.
The rightmost graph in Figure 4.12 shows the relative improvement in elapsed execution time when using PAX across the four platforms. The improvement is low (3-15%) for the range selection that performs sequential scan and hardly uses the data read from the relation. Q1 and Q6 make heavier usage of the data extracted during the sequential scan in order to compute aggregates, group, and sort. Therefore, PAX improvements are higher (8-40%) for these queries as well as for the more complex join queries. The
95 results corroborate the conclusions from the previous chapter that (a) PAX is a promising cache-conscious data placement technique that minimizes data stall time, and (b) reducing data-related stalls significantly improves query execution time.
4.6 Summary This chapter compares the behavior of a database workload across four computer platforms, that belong to different computer design philosophies. The processors have been designed based on non-commercial benchmarks, and their features were developed towards optimizing performance for these applications. Database systems, however, impose different requirements. Results from experiments conducted on a variety of processors indicate that:
•
Although other computation is still significant, the memory/processor speed gap makes memory access the major bottleneck. In order to reduce stall time when executing database workloads, execution engines must overlap memory stalls more aggressively. Tolerating multiple load/store instructions per cycle would help, because over 30% of the instructions access data in caches and in memory.
•
Data and instruction cache inclusion is not beneficial for database workloads, because the query operators are based on loops and performance deteriorates with data and instruction invalidations. If inclusion is necessary (e.g., for cache coherence protocol performance on multiprocessor systems), then (a) the L2 cache needs to be large enough to sustain the instruction footprint and (b) the instruction cache should not be inclusive (which is easier, because there are no writes on the instruction cache).
96 •
Large cache blocks apparently are a good choice for the L2 cache, and in combination with PAX successfully exploit spatial locality. On the other hand, subblocking reduces the advantage from spacial data locality.
•
Due to the increased instruction stalls, database workloads impose the need for an accurate branch prediction mechanism even when running on in-order processors.
•
The hash-join algorithm needs to be optimized for first-level data cache accesses.
Assuming no significant change in hardware implementation cost, database systems would perform well on a processor that can execute multiple load/store instructions per cycle, and features a state-of-the-art branch predictor and an out-of-order execution engine to overlap memory access penalties. Database workloads may exhibit high data dependencies in their instruction stream, but memory-related stalls can often be overlapped if the caches do not block and the instructions are issued out-of-order.
97
Chapter 5
Conclusions “An anecdote: in a recent database benchmark studying TPC-C, both 200-MHz Pentium Pro and 400-MHz 21164 Alpha systems were measured at 4.2-4.5 CPU cycles per instruction retired. In other words, three out of every four CPU cycles retired zero instructions; most were spent waiting for memory.” Richard Sites, “It’s the Memory, Stupid!”, Microprocessor Report 8/5/1996
Recent architectural studies indicate that, while scientific applications more fully exploit the architectural advances inside modern computer platforms, database workloads exhibit suboptimal performance. This observation is counter-intuitive, given that (a) processor’s speed doubles every year, (b) there are significant advances in the memory subsystem design, and (c) database applications become increasingly compute and memory intensive. This dissertation presents a methodology for analyzing database workloads on modern hardware platforms by studying their hardware behavior, and uses the results from the analysis to propose a new software design that improves database system performance. The primary contributions are (a) to introduce a novel approach towards identifying performance bottlenecks in database workloads by studying their hardware behavior, (b) to improve database performance by redesigning data placement in an architecture-conscious fashion, and (c) to identify the hardware design details that most influence database performance.
In the first part, we propose a framework for studying the interaction between the database software and the hardware and, based on this model, we produce the execution time breakdown when running basic selection and join queries on four commercial database systems. The experimental results indicate that the
98 processor spends approximately half of the execution time waiting for the memory subsystem to respond. Therefore, database developers should redesign the data layout to improve utilization of the second level data cache, because L2 data stalls are a major component of the query execution time. On the other hand, first-level instruction cache misses often dominate memory stalls, thus there should be more focus on optimizing the critical paths for the instruction cache.
The other stall time components, which are due to hardware implementation details, account for a significant portion of the execution time and are exposed when the memory-related stalls are eliminated. Such bottlenecks are mostly addressable by the compiler and the hardware, and less by the database management system software. Finally, we gain more insight from the results of this analysis if we use basic selection and join queries, rather than full TPC workloads. In the commercial systems examined, TPC-D execution time breakdown is similar to the breakdown of the basic queries, while TPC-C workloads incur more second-level cache and resource stalls.
In order to address the stall time related to data misses in the cache hierarchy, we designed a new layout for data records on pages, which is called PAX (Partition Attributes Across). PAX optimizes spatial locality by storing values inside each disk page on a per-attribute basis. PAX improves dramatically the cache and memory bandwidth utilization, by reducing the cache misses and without incurring a high record reconstruction cost. When compared to the traditional data page layout (slotted pages), PAX executes decision-support queries in 10%-47% less elapsed time. PAX does not affect the I/O behavior of the traditional scheme, because it reorganizes the records within each NSM page. Our implementation of PAX also requires less storage than slotted pages, because it only uses one offset for each variable-length value.
Finally, this dissertation presents the insight gained by comparing database workload behavior across four computer platforms that belong to different hardware design philosophies. The design diversity across
99 the platforms was a valuable tool in order to determine which design decisions are beneficial for database workloads and which hurt their performance. From this study we conclude that processor features such as out-of-order execution and state-of-the-art speculation mechanisms will be best used by database systems when combined with an execution engine capable of executing more than one load/store instructions per cycle. Cache inclusion is not recommended, especially for instructions; in addition, generous cache block sizes are better than subblocking because they fully exploit spacial data locality. Finally, the use of PAX significantly improves performance across all of the platforms considered in this study.
100
BIBLIOGRAPHY [1]
A. Ailamaki, D. J. DeWitt, M. D. Hill, and D. A. Wood. DBMSs on a modern processor: Where does time go?. In proceedings of the 25th International Conference on Very Large Data Bases (VLDB), pp. 54-65, Edinburgh, UK, September 1999.
[2]
A. Ailamaki and D. Slutz. Processor Performance of Selection Queries, Microsoft Research Technical Report MSR-TR-99-94, August 1999
[3]
Glenn Ammons. run-pic software for access to UltraSparc counters. Computer Sciences Department, University of Wisconsin-Madison (
[email protected]). Personal communication, September 2000.
[4]
J. M. Anderson, L. M. Berc, J. Dean, S. Ghemawat, M. R. Henzinger, S. A. Leung, R. L. Sites, M. T. Vandevoorde, C. A. Waldspurger, and W. E. Weihl. Continuous Profiling: Where Have All the Cycles Gone? In Proceedings of the 16th ACM Symposium on Operating Systems Principles (SOSP), pp. 1-14, October 1997.
[5]
A. C. Arpaci-Dusseau, R. H. Arpaci-Dusseau, D. E. Culler, J. M. Hellerstein, and D. A. Patterson. High-performance sorting on networks of workstations. In Proceedings of 1997 ACM SIGMOD Conference, May 1997.
[6]
L.A. Barroso, K. Gharachorloo, and E.D. Bugnion. Memory system characterization of commercial workloads. In Proceedings of the 25th Annual International Symposium on Computer Architecture, pages 3-14, June 1998.
[7]
P. Boncz, S. Manegold, and M. Kersten. Database Architecture Optimized for the New Bottleneck: Memory Access. In proceedings of the 25th International Conference on Very Large Data Bases (VLDB), pp. 266-277, Edinburgh, UK, September 1999.
[8]
T. Brinkhoff, H.-P. Kriegel, R. Schneider, and B. Seeger. Multi-Step Processing of Spatial Joins. In proceedings of the ACM SIGMOD International Conference on Management of Data, pp. 197--208, Minneapolis, MN, May 1994.
[9]
B. Calder, C. Krintz, S. John, and T. Austin. Cache-Conscious Data-Placement. In proceedings of the 8th International Conference on Architectural Support for Programming Languages and Operating Systems (ASPLOS VIII), pages 139-149, October 1998.
[10] M. Carey, D. J. DeWitt, M. Franklin, N. Hall, M. McAuliffe, J. Naughton, D. Schuh, M. Solomon, C. Tan, O. Tsatalos, S. White, and M. Zwilling, Shoring Up Persistent Applications. In proceedings of the ACM SIGMOD International Conference on Management of Data, Minneapolis, MN, May 1994. [11] Alan Charlesworth. STARFIRE: Extending the SMP Envelope. IEEE Micro, Vol. 18, No. 1, pp. 39-49, January 1998.
101 [12] T. M. Chilimbi, M. D. Hill, and J. R. Larus. Cache-conscious structure layout. In Proceedings of Programming Languages Design and Implementation ’99 (PLDI), May 1999. [13] T. M. Chilimbi, J. R. Larus and M. D. Hill. Making Pointer-Based Data Structures Cache Conscious. IEEE Computer, December 2000. [14] Compaq Corporation. 21164 Alpha Microprocessor Reference Manual. Online Compaq reference library at http://www.support.compaq.com/alpha-tools/documentation/current/chip-docs.html. Document Number EC-QP99C-TE, December 1998. [15] G. P. Copeland and S. F. Khoshafian. A Decomposition Storage Model. In proceedings of the ACM SIGMOD International Conference on Management of Data, pp. 268-279, May 1985. [16] D. W. Cornell and P. S. Yu. An Effective Approach to Vertical Partitioning for Physical Design of Relational Databases. In IEEE Transactions on Software engineering, 16(2), February 1990. [17] D.J. DeWitt, N. Kabra, J. Luo, J. Patel, and J. Yu. Client-Server Paradise. In Proceedings of the 20th VLDB International Conference, Santiago, Chile, September 1994. [18] K. Diefendorff. Xeon Replaces PentiumPro. In The Microprocessor Report 12(9), July 1998 [19] R. J. Eickemeyer, R. E. Johnson, S. R. Kunkel, M. S. Squillante, and S. Liu. Evaluation of multithreaded uniprocessors for commercial application environments. In Proceedings of the 23rd Annual International Symposium on Computer Architecture, May 1996. [20] J. S. Emer and and D. W. Clark. A Characterization of Processor Performance on the Vax 11/780. In Proceedings of the 11th International Symposium on Computer Architecture, pp. 301--310, June 1984. [21] A. Glew. Personal communication, September 1998. [22] J. Goldstein, R. Ramakrishnan, and U. Shaft. Compressing Relations and Indexes. In proceedings of IEEE International Conference on Data Engineering, 1998. [23] G. Graefe. Iterators, Schedulers, and Distributed-memory Parallelism. In software, Practice and Experience, 26(4), pp. 427-452, April 1996. [24] Jim Gray. The benchmark handbook for transaction-processing systems. Morgan-Kaufmann Publishers, Inc., 2nd edition, 1993. [25] L. Gwennap. Sun Spins Low-Cost UltraSparc. Microprocessor Report, Vol. 10, No. 13, October 1996. [26] L. Gwennap. Digital Leads the Pack with 21164. Microprocessor Report, Vol 8, No. 12, September 1994. [27] L. Gwennap. Digital’s 21194 Reaches 500 MHz. Microprocessor Report, Vol. 10, No. 9, July 1996.
102 [28] J. L. Hennessy and D. A. Patterson. Computer Architecture: A Quantitative Approach. Morgan Kaufman Publishers, Inc., 199 6, 2ond edition. [29] R. B. Hilgendorf and G. J. Heim. Evaluating branch prediction methods for an S390 processor using traces from commercial application workloads. Presented at CAECW’98, in conjunction with HPCA-4, February 1998. [30] M. D. Hill and A. J. Smith. Evaluating Associativity in CPU Caches. IEEE Transactions on Computers, Vol C-38, No. 12, pp. 1612-1630, December 1989. [31] Intel Corporation. Pentium® II processor developer's manual. Intel Corporation, Order number 243502-001, October 1997. [32] K. Keeton. Computer Architecture Support For Database Applications. Ph.D. Thesis, University of California, Berkeley, 1999. [33] K. Keeton, D. A. Patterson, Y. Q. He, R. C. Raphael, and W. E. Baker. Performance characterization of a quad Pentium pro SMP using OLTP workloads. In Proceedings of the 25th International Symposium on Computer Architecture, pages 15-26, Barcelona, Spain, June 1998. [34] K. Keeton. Personal communication, December 1998. [35] P. Å. Larson, and G. Graefe. Memory management during run generation in external sorting. In Proceedings of the 1998 ACM SIGMOD Conference, June 1998. [36] Bruce Lindsay. Personal Communication, February / July 2000. [37] J. L. Lo, L. A. Barroso, S. J. Eggers, K. Gharachorloo, H. M. Levy, and S. S. Parekh. An analysis of database workload performance on simultaneous multithreaded processors. In Proceedings of the 25th Annual International Symposium on Computer Architecture, pages 39-50, June 1998. [38] A. M. G. Maynard, C. M. Donelly, and B. R. Olszewski. Contrasting characteristics and cache performance of technical and multi-user commercial workloads. In Proceedings of the 6th International Conference on Architectural Support for Programming Languages and Operating Systems, San Jose, California, October 1994. [39] L. Mc Voy and C. Staelin. lmbench: Portable Tools for Performance Analysis. In Proceedings of the USENIX Annual Technical Conference, San Diego, CA, January 1996. [40] G.E. Moore. Cramming more components onto integrated circuits. Electronics, pp. 114-117, April 1965. [41] P. J. Mucci, S. Browne, C. Deane, and G. Ho. PAPI: A Portable Interface to Hardware Performance Counters. In Proceedings of the Department of Defense HPCMP Users Group Conference, Monterey, CA, June 7-10, 1999.
103 [42] M. Nakayama, M. Kitsuregawa, and M. Takagi: Hash-Partitioned Join Method Using Dynamic Destaging Strategy. In Proceedings of the 14th VLDB International Conference, September 1988. [43] S. Navathe, S. Ceri, G. Wiederhold, and J. Dou. Vertical partitioning algorithms for database design. ACM Transactions on Database Systems, 9(4), pp/ 680-710, December 1984. [44] K.B. Normoyie, M.A. Csoppenszky, A. Tzeng, T.P. Johnson, C.D.Furman, and J. Mostoufi. UltraSparc-IIi: Expanding the Boundaries of a System on a Chip. IEEE Micro, Vol. 18, No. 2, March/April 1998. [45] C. Nyberg, T. Barklay, Z. Cvetatonic, J. Gray, and D. Lomet. Alphasort: A RISC Machine Sort. In Proceedings of 1994 ACM SIGMOD Conference, May 1994. [46] J. M. Patel and D. J. DeWitt. Partition Based Spatial-Merge Join. In proceedings of the ACM SIGMOD International Conference on Management of Data, pp. 259-270, Montreal, Canada, June 1996. [47] R. Ramakrishnan and J. Gehrke. Database Management Systems. WCB/McGraw-Hill, 2nd edition, 2000. [48] P. Ranganathan, K. Gharachorloo, S. Adve, and L. Barroso. Performance of database workloads on shared-memory systems with out-of-order processors. In Proceedings of the 8th International Conference on Architectural Support for Programming Languages and Operating Systems, San Jose, California, October 1998. [49] M. Rosenblum, E. Bugnion, S. A. Herrod, E. Witchel, and A. Gupta. The impact of architectural trends on operating system performance. In Proceedings of the 15th ACM Symposium on Operating System Principles, pages 285-298, December 1995. [50] P. G. Selinger, M. M. Astrahan, D. D. Chamberlain, R.A. Lorie, and T. G. Price. Access Path Selection In A Relational Database Management System. In Proceedings of the ACM SIGMOD Conference on Management of Data, 1979. [51] A. Shatdal, C. Kant, and J. Naughton. Cache Conscious Algorithms for Relational Query Processing. In proceedings of the 20th International Conference on Very Large Data Bases (VLDB), pp. 510512, September 1994. [52] R. Soukup and K. Delaney. Inside SQL Server 7.0. Microsoft Press, 1999. [53] P. Stenstrom, E. Hagersten, D.J. Lilja, M. Martonosi, and M. Venugopal. Trends in Shared Memory Multiprocessing. IEEE Computer, pp. 44--50, December 1997. [54] Sun Microelectronics. UltraSparcTM Reference Manual. Online Sun reference library at http:// www.sun.com/microelectronics/manuals/ultrasparc/802-7220-02.pdf, July 1997.
104 [55] Sun Microelectronics. The UltraSparc-IIi Processor. Technology white paper, Online Sun reference library at http://www.sun.com/microelectronics/whitepapers/UltraSPARC-IIi. Document number WPR-0029-01, January 1998. [56] TechWise Research, Inc. Are Proprietary RISC Servers More Expensive Than Their Unix Alternatives?. White Paper, available from http://www5.compaq.com/alphaserver/download/riscunix.pdf, May 1999. [57] S. S. Thakkar and M. Sweiger. Performance of an OLTP Application on Symmetry Multiprocessor System. In Proceedings of the International Symposium on Computer Architecture, 1990. [58] P. Trancoso, J.L. Larriba-Pey, Z. Zhang, and J. Torellas. The memory performance of DSS commercial workloads in shared-memory multiprocessors. In Proceedings of the HPCA conference, 1997. [59] S. Unlu. Personal communication, September 1998. [60] T. Yeh and Y. Patt. Two-level adaptive training branch prediction. In Proceedings of IEEE Micro-24, pages 51-61, November 1991. [61] http://technet.oracle.com/docs/products/oracle8i/doc_index.htm [62] http://www.ncr.com/sorters/software/teradata_or.asp [63] http://www.spec.org
105
APPENDIX A:
PAX ALGORITHMS
Get the next value of a fixed-length attribute fscan.next() { if (NOT nullable(a) OR is_set(f, presence_bit)) {// non-null value field_ptr = position; // set field value pointer position = position + field_size;// advance position for next field } else field_ptr = NULL; // null value }
Get the next value of a variable-length attribute vscan.next() { attribute_size = value_offset(v) - value_offset(v-1);// set variable attribute size if (attribute_size > 0) { // non-null value attribute_ptr = position; // set attribute value pointer position = position + attribute_size;// advance position for next attribute } else attribute_ptr = NULL; // null value }
Get the value of an attribute based on record id field.get_value(a, idx) { locate_page(idx); // locate page of record minipage_start = page + page_header.offset (a);// find start of minipage if (is_fixed_size(a)) { if (NOT nullable (a)) // non-nullable field_ptr = minipage_start + idx*sizeof(a);// locate value else if (is_set(a, presence_bit))// nullable but not null field_ptr = minipage_start + #non_null_values_before_idx * field_size; else field_ptr = NULL; // null value } else { // variable size value field_size = value_offset(a) != value_offset(a-1); if (field_size > 0 ) // non-null value field_ptr = minipage_start + value_offset(a-1);// variable size value else field_ptr = NULL; // field value is null } }
106
APPENDIX B:
SQL CODE OF TPC-H QUERIES
TPC-H Query #1: select l_returnflag, l_linestatus, sum(l_quantity) as sum_qty, sum(l_extendedprice) as sum_base_price, sum(l_extendedprice * (1 - l_discount)) as sum_disc_price, sum(l_extendedprice * (1 - l_discount) * (1 + l_tax)) as sum_charge, avg(l_quantity) as avg_qty, avg(l_extendedprice) as avg_price, avg(l_discount) as avg_disc, count(*) as count_order from lineitem where l_shipdate = “1997-01-01” and l_shipdate < “1997-01-01” + 1 year and l_discount between 0.05 - 0.01 and 0.05 + 0.01 and l_quantity < 24
TPC-H Query #12: select l_shipmode, sum (case when o_orderpriority = “1-URGENT” or o_orderpriority = “2-HIGH” then 1 else 0 end) as high_line_count, sum (case
107 when o_orderpriority “1-URGENT” and o_orderpriority “2-HIGH” then 1 else 0 end) as low_line_count from orders, lineitem where o_orderkey = l_orderkey and l_shipmode in (“SHIP”, “RAIL”) and l_commitdate < l_receiptdate and l_shipdate < l_commitdate and l_receiptdate >= “1994-01-01” and l_receiptdate < “1994-01-01” + 1 year group by l_shipmode order by l_shipmode
TPC-H Query #14: select 100.00 * sum (case when p_type like “PROMO%” then l_extendedprice * (1 - l_discount) else 0 end) / sum(l_extendedprice * (1 - l_discount)) as promo_revenue from lineitem, part where l_partkey = p_partkey and l_shipdate >= “1997-09-01” and l_shipdate < “1997-09-01” + 1 month