Arctic Ocean Microbial Community Structure before and after the 2007 Record Sea Ice Minimum Andre´ M. Comeau1*, William K. W. Li2, Jean-E´ric Tremblay1, Eddy C. Carmack3, Connie Lovejoy1* 1 Que´bec-Oce´an, De´partement de Biologie, and Institut de Biologie Inte´grative et des Syste`mes (IBIS), Universite´ Laval, Que´bec, Que´bec, Canada, 2 Fisheries and Oceans Canada, Bedford Institute of Oceanography, Dartmouth, Nova Scotia, Canada, 3 Fisheries and Oceans Canada, Institute of Ocean Sciences, Sidney, British Columbia, Canada
Abstract Increasing global temperatures are having a profound impact in the Arctic, including the dramatic loss of multiyear sea ice in 2007 that has continued to the present. The majority of life in the Arctic is microbial and the consequences of climatemediated changes on microbial marine food webs, which are responsible for biogeochemical cycling and support higher trophic levels, are unknown. We examined microbial communities over time by using high-throughput sequencing of microbial DNA collected between 2003 and 2010 from the subsurface chlorophyll maximum (SCM) layer of the Beaufort Sea (Canadian Arctic). We found that overall this layer has freshened and concentrations of nitrate, the limiting nutrient for photosynthetic production in Arctic seas, have decreased. We compared microbial communities from before and after the record September 2007 sea ice minimum and detected significant differences in communities from all three domains of life. In particular, there were significant changes in species composition of Eukarya, with ciliates becoming more common and heterotrophic marine stramenopiles (MASTs) accounting for a smaller proportion of sequences retrieved after 2007. Within the Archaea, Marine Group I Thaumarchaeota, which earlier represented up to 60% of the Archaea sequences in this layer, have declined to ,10%. Bacterial communities overall were less diverse after 2007, with a significant decrease of the Bacteroidetes. These significant shifts suggest that the microbial food webs are sensitive to physical oceanographic changes such as those occurring in the Canadian Arctic over the past decade. Citation: Comeau AM, Li WKW, Tremblay J-E´, Carmack EC, Lovejoy C (2011) Arctic Ocean Microbial Community Structure before and after the 2007 Record Sea Ice Minimum. PLoS ONE 6(11): e27492. doi:10.1371/journal.pone.0027492 Editor: Jack Anthony Gilbert, Argonne National Laboratory, United States of America Received June 21, 2011; Accepted October 18, 2011; Published November 9, 2011 Copyright: ß 2011 Comeau et al. This is an open-access article distributed under the terms of the Creative Commons Attribution License, which permits unrestricted use, distribution, and reproduction in any medium, provided the original author and source are credited. Funding: C.L.’s multiple cruise participations were funded by ongoing Natural Science and Engineering Research Council of Canada (NSERC) Discovery grants and the Canadian Healthy Oceans Network. The funders had no role in study design, data collection and analysis, decision to publish, or preparation of the manuscript. Competing Interests: The authors have declared that no competing interests exist. * E-mail:
[email protected] (CL);
[email protected] (AMC)
stratification is a subsurface chlorophyll maxima (SCM) layer that tracks the interface of Pacific Summer Water (PSW) and the Arctic Winter Water (AWW). The SCM is estimated to account for 70% of annual photosynthetic production in the Amundsen Gulf region of the Beaufort Sea (J Martin and J-E Tremblay, unpublished modelling result) and is a persistent feature throughout the Arctic Ocean. Protist communities within this layer change little over geographical space despite changes in depth [7] and at least one isolate from the Arctic has a remarkable capacity to adjust to varying irradiance levels [8]. Similarly, bacterial and archaeal taxa change little within distinct water masses [9,10]. However, interannual variation of communities within a given water-mass has not been systematically investigated. The principal goal of this study was to investigate whether the physical and nutrient properties of PSW had changed substantially since 2007 following the massive loss of summer sea ice and whether any changes were accompanied by changes in SCM microbial communities. To fulfill our aim, we analyzed available physical and nutrient data from multiple oceanic missions to the Amundsen Gulf region from 2002–2010, and available microbial DNA samples collected from 2003–2010 from the SCM, where photosynthetic activity occurs from June though early November [11]. All three domains of life were targeted using a high-throughput, tag small-subunit (SSU) rRNA gene amplicon sequencing approach [12]. To maximize the
Introduction Atmospheric and oceanic processes are directly affected by increasing global temperatures and the Arctic has been the most severely impacted region to date [1]. A long-term trend of deceasing minimum extent of summer sea ice was marked by a sharp decline and record low in September 2007. Summer sea ice extent remains below the long-term pre-2007 average [1,2]. While direct temperature effects appear to be the main driver of changes in terrestrial biomes, there is little data on whether and how physical changes impact the underlying microbial food webs that support all higher marine trophic levels [3]. Upper Arctic waters have warmed, but also freshened since the 1990s due to the melting of multiyear sea ice, increasing river runoff and increased transport of surface Pacific Water into the Arctic Basin [2,4]. Increased stratification of the upper water column due to surface freshening could have a profound effect on nutrient transport into the euphotic zone and decrease the overall productivity of the Arctic Ocean. Evidence for such a change has been reported from the upper 150 m of the Canada Basin, where smaller phytoplankton size-classes are becoming more prevalent [5]. The Arctic is much more quiescent than any other ocean because of salinity stratification and the duration of both multiyear and seasonal ice cover [6]. A persistent feature of this strong PLoS ONE | www.plosone.org
1
November 2011 | Volume 6 | Issue 11 | e27492
Arctic Microbial Communities and Reduced Sea Ice
microbial signal we focused on the 0.2–3 mm nominal size-fraction which enriches for smaller cells [13,14]. Since size-fractionation by filtration is inefficient, this approach provides comparative information on larger cells as well.
previously described [7] from the SCM. Filters were preserved at 280uC until DNA was extracted using lysozyme, proteinase K, SDS and a salt-based separation as previously described [17].
PCR primer design for 454 pyrosequencing Materials and Methods
PCR primers targeting the SSU rRNA gene within the 16S V68 region of Bacteria and Archaea, and the 18S V4 region for Eukaryotes, were adapted from existing rRNA primers and designed de novo to ensure amplicon sizes appropriate for 454RocheTM chemistry (Table S1). Care was taken to design 95% consensus primers, as determined using ARB (http://www.arbhome.de/) with the SILVA 100-SSU-Ref database, and their specificities were checked against the RDP database (http://rdp. cme.msu.edu/). Forward primers included Roche’s A adaptor and MIDs (‘‘multiplex identifiers’’) in the form of: 59-[A-adaptor]+ [MID1 to 10]+[specific F primer]-39; reverse primers included Roche’s B adaptor in the form of: 59-[B-adaptor]+[specific R primer]-39. Full sequences of all 39 primers are listed in Table S2. Final amplicon lengths were 508 bp for the Bacteria and Eukarya, and 516 bp for the Archaea.
Physicochemical sample collection and processing Water samples, conductivity, temperature and depth (CTD; Sea-Bird SBE-911) profiles were taken during missions (2002– 2010) to the Amundsen Gulf, Beaufort Sea region using a rosette system aboard the CCGS Amundsen. Additional CTD and nutrient data were collected in 2007 aboard the CCGS Louis St. Laurent and 2008 from the CCGS Sir Wilfred Laurier. Water samples were collected for nutrient analysis every 10 m to 100 m and additional samples taken at the depth of the SCM and the nitracline. These were detected on the downward cast from the output of the fluorometer (SeaPoint) for chlorophyll (Chl) and an in situ ultraviolet spectrometer (ISUS) for relative nitrate concentrations (Satlantic MBARI-ISUS). Irradiance as photosynthetically-active radiation (PAR) was estimated in situ with a PAR sensor (Biospherical Instruments) also mounted on the rosette. Salinity values from the CTD profiles were calibrated using a salinometer (Guideline Model 8400B). Samples for nutrient determinations were collected into acid-cleaned polyethylene tubes after thorough rinsing and pre-filtration; stored at 4uC in the dark and analyzed within a few hours for NO22, NO32 + NO22, PO432 and Si(OH)4 using standard colorimetric methods adapted for the AutoAnalyzer 3 (Bran+Luebbe). To characterize the change of Pacific-origin water in central Amundsen Gulf, we extracted salinity and nutrient data collected from stations deeper than 300 m water depth in ice-free months (July, Aug., Sep., Oct.) for all years. The number of stations included in the analysis varied by year as follows: 2002 (n = 10), 2003 (n = 16), 2004 (n = 14), 2005 (n = 4), 2006 (n = 16), 2007 (n = 13), 2008 (n = 29), 2009 (n = 40), and 2010 (n = 16). The timeseries trends were calculated by linear regression of year-based station averages of samples within the salinity range of 31–33, approximating the water mass defined by the Tmax of the PSW, and the Tmin of the Pacific Winter Water, which lies just below the PSW [15]. Chlorophyll a (Chl a) samples were collected, filtered and analyzed on board using standard techniques as previously reported [16]. Arctic Ocean sea ice extent data was obtained from the IARCJAXA website (http://www.ijis.iarc.uaf.edu/en/home/seaice_extent. htm) and the 30 daily values for September (month of minimum yearly extent) were averaged as a representation for each year from 2003–2010.
Extracted DNA from the 0.2–3 mm size-fraction was amplified in three independent 50 mL aliquots per domain using full-length 454 primers. PCR reactions contained: 1X HF buffer (NEB), 200 mM of each dNTP (Feldan Bio), 0.4 mg/mL BSA (Fermentas), 0.2 mM of each 454 primer (Invitrogen), 1 U of Phusion High-Fidelity DNA polymerase (NEB), and 1–3 mL of template DNA. Three separate DNA concentrations were used for each sample: 1/0.5/0.1X for Bacteria and Eukarya; and between 3X and 0.1X for Archaea that represent the smallest proportion of microbial biomass in the Beaufort [18]. Cycling conditions were as follows: an initial denaturation at 98uC for 30 s, followed by 30 cycles of denaturation at 98uC for 10 s, annealing at 55uC for 30 s, extension at 72uC for 30 s, and a final extension at 72uC for 5 min. The triplicate reactions for the separate domains were pooled, purified using the QIAquick PCR purification kit (QIAGEN), and quantified spectrophotometrically (Nanodrop ND-1000). The 11 sample-coded amplicons were mixed in equal quantity and 1/8th plate for each domain was sequenced on a Roche 454 GS-FLX Titanium platform at the McGill University/ Ge´nome-Que´bec Innovation Centre for Bacteria and at the IBIS/ Universite´ Laval Plate-forme d’Analyses Ge´nomiques for Archaea and Eukaryotes. The raw pyrosequencing reads have been deposited in the NCBI Sequence Read Archive with accession number SRA029114 and a ‘‘Minimal Information about a MARKer gene Sequence’’ (MIMARKS) compliant table is included with the data and given here in Table S3.
Biological sample collection and processing
Pyrotag pre-processing and quality control
Samples were collected from the Amundsen Gulf, Beaufort Sea, between October 2003 and October 2010 (Fig. 1) in conjunction with 8 different research expeditions aboard the CCGS Amundsen (all years, except 2008) and CCGS Sir Wilfred Laurier (2008). The SCM forms in the Amundsen Gulf following the spring bloom and, although surface nitrate concentrations are near detection limits throughout summer, concentrations of nitrate in PSW remain relatively high. Since the aim was to compare SCM communities from different years in the Amundsen Gulf, samples were selected to represent typical post-spring-bloom, light-limited communities; in addition, sufficient biomass for amplification was needed. Two samples met this criteria for three (2003, 2004, 2009) of the eight years, but only one sample for each of the other years was available. Five to 7 liters of seawater were collected as
Raw 454 reads were processed to remove low-quality reads defined using the following criteria: (i) presence of uncertain bases, one or more Ns; (ii) short reads, reads ,150 bp after adaptor and MID removal; (iii) unusually long reads, reads of greater than expected amplicon size; and (iv) reads with incorrect F primer sequence. Reads were also trimmed of all bases beyond the R primer. These quality-control steps have been shown to reduce 454 sequencing error rates to ,0.2% [19] without the need for more involved ‘‘denoising’’ applications [20] that can be computationally prohibitive and whose theoretical assumptions are not universally accepted [21]. The above, high-quality ‘‘final reads’’ were then aligned by domain using Mothur [22,23] (http://www.mothur.org/) against the provided SILVA reference alignments using the ksize = 9 parameter. The resulting alignments
PLoS ONE | www.plosone.org
SSU rDNA gene amplification and 454 pyrosequencing
2
November 2011 | Volume 6 | Issue 11 | e27492
Arctic Microbial Communities and Reduced Sea Ice
Figure 1. Sampling sites and dates. Locations, physicochemical parameters, and chlorophyll a concentrations of the samples used for tag pyrosequencing. doi:10.1371/journal.pone.0027492.g001
Measures of diversity, rarefaction, and community similarity analyses (shared OTUs and Bray-Curtis trees) were carried out in Mothur. Bacterial OTUs were taxonomically identified using the Classifier tool of the RDP database [24] using the 50% bootstrap cut-off value that has been shown to be .95% accurate at the genus level [25], even for V6 amplicons that are much shorter than ours (,80 bp). Archaea and Eukarya OTUs were taxonomically identified within Mothur (using 50% bootstrap cut-off) using user-designed reference sequence databases and taxonomy outlines (both available upon request), based upon a modification of the NCBI taxonomies and included our curated Arctic-specific sequences. Common ‘‘unclassified OTUs’’ generated from the above techniques were further identified using BLASTn at the NCBI. Fungi, Metazoa (except Choanoflagellates) and Streptophyta (plants) were ignored for the Eukarya, as were chloroplasts for the Bacteria.
were manually refined by removing those reads that were misaligned, generating the high-quality ‘‘final aligned reads’’ used for all downstream analyses (Table S4). The number of input reads for each bar-code was also randomly re-sampled from the total reads available to have the same number in all bar-codes, equal to the lowest number present in any one bar-code resulting in: 2474 per sample for Bacteria, 8700 per sample for Eukarya and 1118 per sample for Archaea.
OTU and taxonomy analyses The final aligned reads were clustered into Operational Taxonomic Units (OTUs) at the $97% similarity level for Bacteria and Archaea and at the $98% similarity level for Eukarya using Mothur (furthest-neighbor clustering). The former approximates a common species definition for prokaryotes, while the latter is a compromise between the preferred $99% species level and the recent recommendation for using a maximum of 98% with 454 GS-FLX Titanium chemistry to avoid misidentifying V4 Eukarya tags [21]. Singletons, OTUs comprised of single sequences occurring only once in the datasets, were removed at this step. PLoS ONE | www.plosone.org
Statistical analyses Because of limited ship time and logistic constraints on multidisciplinary missions, sampling was not carried out at a single site at the same time of the year for all the years – there is no 3
November 2011 | Volume 6 | Issue 11 | e27492
Arctic Microbial Communities and Reduced Sea Ice
Results
a results (binned as .60% [n = 5], 40–60% [n = 3], and ,40% [n = 3] of the Chl a in the large fraction). We tested the likelihood that the above factors, apart from before and after the 2007 ice minimum, may have influence our assessment of community changes using two different methods. Firstly, we constructed correspondence analysis ordination plots (Fig. S3) based upon the proportions of the different groups in each sample at different taxonomic levels. Secondly, Bray-Curtis similarity trees were constructed based on total OTU composition in the samples at the level of individuals, independent of taxonomic assignments, where samples that group together share more OTUs than those further apart. The taxonomy ordination plots showed relatively clear patterns along the primary axes with separation for the influence of ice extent, with only one 2003 sample, not grouping with the earlier years (Fig. S2). The OTU Bray-Curtis topologies showed similar separation, with one sample each for Bacteria and Eukarya not consistent with the before-andafter 2007 categorization. The Archaea communities were well segregated and the before-and-after sea ice minimum samples showed no overlap. These Bray-Curtis trends can be tested statistically since the existence of a cluster in the tree implies that the numbers of shared OTUs are higher among those members of the cluster than with members outside the cluster, anywhere else in the tree. Therefore, we tested for a difference between the numbers of shared OTUs within the low ice (,2007) and high ice (.2007) clusters compared to between the two clusters. Significance was found for the Bacteria for this before-and-after 2007 grouping (p = 0.04), and for a linear decrease of shared OTUs over time (p,0.01). Similarly, trends were significant for Archaea for before-and-after 2007 (p = 0.03) and for the linear decrease over time (p,0.01). With the exception of a geographic influence on the Archaea (p = 0.02), no significant effects were uncovered after segregating the OTUs into the other categories tested: season, PAR, and Chl a size distribution. Finally, there was no statistical support for the Eukarya topologies.
Physical changes in the Amundsen Gulf and Beaufort Sea
Overall community diversity
routine monitoring of the Canadian Arctic at this time or previously. We therefore tested the significance of confounding factors that could potentially influence community structure. In addition to ice extent before and after 2007 and time (year), we tested for significant effects due to: 1) geography, notably Franklin Bay, which is less directly linked to dominant current systems, versus offshore Amundsen Gulf; 2) season, by comparing summer (July, August and Sept) versus autumn (Oct and Nov) samples; 3) irradiance as PAR levels binned as ,0.1 mE m22 s21, 0.1–1.0 mE m22 s21 and .1.0 m22 s21 at the depth sampled; and 4) the community size distribution estimated from Chl a concentrations of small (0.7–3 mm) and large (.3 mm) fractions of filtered biomass. The percent distribution of Chl a in the small versus large fractions was taken as a proxy for successional stage, since larger cells are favoured when growth conditions are more favourable. Communities were binned as .60%, 40–60%, or ,40% in the large fraction. Details of the distribution of all samples into the above categories are given in Table S5. Differences between two categories were tested with either the two-sample t-test (normal distributions) or Mann-Whitney test (non-normal distributions). Trends with three categories were tested using the Kruskal-Wallis test (non-parametric version of ANOVA). The temporal trends over 8 years, 2003–2010, were tested using linear regression (normal distributions) or the Spearman Rank correlation (non-normal distributions). Correspondence analysis (CA) was performed on the taxonomic distribution data at the level showing the most significance: phylum-level for Bacteria, major group-level for Eukarya, and ‘‘group’’ equal to genus-level for Archaea that have inherent reduced taxonomic complexity at higher levels. These ordination plots and all statistical analyses were carried out in PAST (http:// folk.uio.no/ohammer/past/).
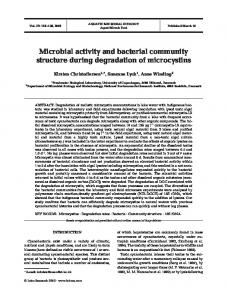
The data compiled from stations greater than 300 m maximum depth over the study region indicated that Pacific waters reaching the Amundsen Gulf had freshened consistently since 2002 (Fig. 2A). Overall nitrate values in this layer had also significantly decreased with average values of 9.4 mmol m23 from 2002–2004 to a minimum value of 6.5 mmol m23 2010 (Fig. 2B). Silica concentrations, while trending downward, did not change significantly (Fig. 2C). No change in phosphate concentrations were detected (Fig. 2D). Minimum annual sea ice extent occurred in 2007 and remained below the previous long-term average for the following 4 years (Fig. 2E), as has been extensively reported elsewhere [26], including over the Beaufort Sea and Amundsen Gulf region [2].
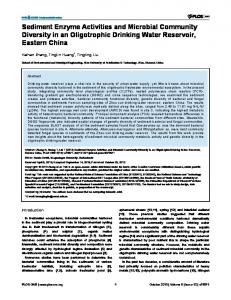
Bacterial richness, based on the total number of OTUs, declined significantly after 2007 with total diversity also affected (Fig. 3). The Shannon and Simpson indices showed significant changes in community evenness; there were fewer rare OTUs and more high frequency ones, defined as the top 50 OTUs representing the most sequences (Fig. 4B). Additional regression analysis indicated that the linear decrease in richness and evenness were statistically significant (Table 1). In contrast Archaea and Eukarya diversity indices showed no temporal trends or significant differences for before and after 2007. The potential influence of coastal samples (geography) on diversity indices was investigated by removing Franklin Bay samples. This reanalysis did not affect the significant levels for the Bacteria; Archaea and Eukarya results were also unchanged. The remaining factors (season, PAR, proportion of Chl a) did not significantly influence the diversity indices among the three domains (Table 1).
Pyrosequencing and analysis overview The numbers of final reads (and average length) following quality filters was: 44,287 (386 bp) for Bacteria, 74,775 (382 bp) for Archaea and 173,549 (402 bp) for Eukarya (Table S4). Once reads were re-sampled and singleton OTUs removed, all three domains showed saturation in the rarefaction analysis, with the Bacteria roughly twice as diverse as the Archaea (both at the 97% similarity level) and the Eukarya representing near 12,000 OTUs at the 98% level (Fig. S1). Samples were then grouped (Table S5) to test for the influences of geography (Franklin Bay [n = 3] vs. offshore Amundsen Gulf stations [n = 8]), season (summer [n = 5] vs. fall [n = 6]), PAR at the time of sampling (binned as high [n = 3], medium [n = 3] and low [n = 5]) and size-fractionated Chl PLoS ONE | www.plosone.org
Specific taxonomic changes Alphaproteobacteria consistently represented the largest proportion of OTUs (Fig. 4A), the majority of which (78%) were Pelagibacter (the SAR11 clade). Among the dominant OTUs (Fig. S4), Pelagibacter was the also the most abundant, sometimes representing over 25% of all bacterial sequences. The Gammaproteobacteria accounted for 10–20% of the bacterial OTUs, with little change over time. Among the other major bacterial groups, the proportion of Bacteroidetes sequences decreased prior to 2007 (Fig. 4A) and were significant fewer after 2007 compared to 4
November 2011 | Volume 6 | Issue 11 | e27492
Arctic Microbial Communities and Reduced Sea Ice
Figure 2. Physicochemical trends in the Arctic Ocean. (A–D) Salinity and nutrient concentrations in the central Amundsen Gulf. Values are from within the salinity layer bounded by 31 and 33 psu, approximating the Pacific water mass defined by the Tmax of the summer water and the Tmin of the winter water [15]. Values are averaged over all stations in waters deeper than 300 m; station variability is indicated by standard deviation. Time series trend is indicated by linear regression of year average, n = 9. (E–F) September minimum sea ice extent in the Arctic Ocean from the IARC-JAXA. Values for each year (E) are the averages of the 30 daily values of September and variability is indicated by standard deviation. The boxplot (F) indicates the medians, 1st and 3rd quartiles, and ranges (whiskers) of the data in (E) for the 4 years before the major melt of 2007 and the four subsequent years (n = 120 for each case). The statistical result indicated is the two-sample t-test (unequal variance). doi:10.1371/journal.pone.0027492.g002
PLoS ONE | www.plosone.org
5
November 2011 | Volume 6 | Issue 11 | e27492
Arctic Microbial Communities and Reduced Sea Ice
Figure 3. a-Diversity measures for Bacteria (97% OTU level), Eukaryotes (98% OTU level) and Archaea (97% OTU level). The boxplots indicate, as in Fig. 2, the medians, 1st and 3rd quartiles, and ranges (whiskers) of the data from 2003–2006 (,2007; n = 6) vs. 2007–2010 (.2007; n = 5) for Bacteria (Bact), Eukaryotes (Euk) and Archaea (Arch). The statistical results indicated are from either the two-sample t-tests (normal data) or MannWhitney tests (non-normal data). (A) Total richness (OTUs) per 1000 reads (to normalize for bar-code differences). The Bacteria also show a significant linear decrease (r2 = 0.75, p,0.01) over the 8 years. (B) Proportion of reads in top 50 dominant OTUs. The Bacteria also show a significant linear increase (r2 = 0.82, p,0.01) over the 8 years. (C) Shannon diversity index. The Bacteria also show a significant linear decrease (r2 = 0.82, p,0.01) over the 8 years. (D) Simpson diversity index. Note that the index should behave in the opposite direction of the other indices since it nears 0 as diversity increases. The Bacteria also show a significant linear increase (r2 = 0.86, p,0.01) over the 8 years. doi:10.1371/journal.pone.0027492.g003
the September 2005 sample was 2.14 mg L21, whereas all other samples were below 1 mg L21 (Fig. 1). Visually, the sample was dominated by the small diatom Chaetoceros socialis (onboard microscopy) and many of the 18S rRNA gene OTUs had best matches to Chaetoceros socialis and related species (Fig. S6). However, the overall decrease in the proportion of stramenopiles over time was driven primarily by the MASTs. Other groups changed as well, with Cryothecomonas (Rhizaria, Cercozoa) significantly less represented after 2007 when Franklin Bay samples were included. Alveolates, mostly small dinoflagellates and ciliates (Fig. S5B), were common in all years (Fig. 4B), however ciliate sequences, represented primarily by four genera (Strombidium, Novistrombidium, Codonellopsis and Pseudotontonia; Fig. S6), significantly increased after 2007 (Fig. 5C) even when excluding Franklin Bay samples. Haptophytes, with best matches to Phaeocystis and Chrysochromulina, significantly increased after 2007 when Franklin Bay samples were included. The dominant OTUs (Fig. S6) mirrored the whole community, showing a significant overall reduction (p = 0.05) in the numbers of stramenopiles and overall increase (p = 0.02) of ciliates after 2007. There was no significant trend in the OTU occurrences of Micromonas strain CCMP2099, a ubiquitous Arctic ecotype, over time. Similar to the
before (Fig. 5A), irrespective of whether or not the coastal samples were included. The majority of the Bacteroidetes sequences belonged to Flavobacteria (87%), with Polaribacter being the most commonly encountered genus, accounting for one fourth of the Flavobacteria OTUs. Verrucomicrobia and Planctomycetes were often recovered, but no trends were detected. After 2007, unclassified Proteobacteria, defined as taxonomically unknown to the RDP classifier and potential novel sequences or non-curated environmental groups, appeared to be more frequent, but this was not statistically significant. Separate BLASTn analysis indicated that some of these were possibly mitochondrial sequences with closest matches to Prasinophytes, especially Micromonas, however the similarity was only ,88% and we could not rule out the possibility of them representing novel bacteria. We found no significant effect of season, PAR, Chl a size fraction or geography on the bacterial taxa recovered (Table 1). There were some significant changes for several eukaryotic groups over time (Fig. 4B, 5C, S6). After 2007, the proportion of sequences with closest matches to stramenopiles fell significantly, independent of geography or other factors. These sequences had matches mostly to diatoms and uncultured marine heterotrophic flagellates (MASTs [27]; Fig. S5A). The Chl a concentration in PLoS ONE | www.plosone.org
6
November 2011 | Volume 6 | Issue 11 | e27492
Arctic Microbial Communities and Reduced Sea Ice
Figure 4. Taxonomic distribution of all OTUs. (A) Distribution of major Bacteria phyla and orders (97% level). (B) Distribution of non-Metazoan (retaining Choanoflagellates) Eukarya major groups (98% level). (C) Distribution of Archaea groups (97% level). ThaumA, Thaumarchaeota; EuryA, Euryarchaeota. doi:10.1371/journal.pone.0027492.g004
PLoS ONE | www.plosone.org
7
November 2011 | Volume 6 | Issue 11 | e27492
Arctic Microbial Communities and Reduced Sea Ice
Table 1. Comparison of the significant trends (p # 0.05) when analyzed for 6 different factors.
Analysis Factor Ice Extent
Geography
Year
Season
PAR
Chl a Distrib.
Shannon index – Bacteria
24%
ns
20.91
ns
ns
ns
Simpson index – Bacteria
+58%
ns
0.92
ns
ns
ns
Trend
Diversity Measures
OTU Distributions # OTUs – Bacteria
212%
ns
20.81
ns
ns
ns
# OTUs/1000 reads – Bacteria
215%
ns
20.86
ns
ns
ns
% reads in dominant OTUs – Bacteria
+21%
ns
0.91
ns
ns
ns
# shared OTUs (within vs. between groups) – Bacteria
?
ns
20.36
ns
ns
ns
# shared OTUs (within vs. between groups) – Archaea
?
?
20.42
ns
ns
ns
Bacteroidetes (Flavobacteria)
265%
ns
ns
ns
ns
ns
Pelagibacter
ns
FB , Ocean
ns
ns
ns
ns
ns
Taxonomic Distributions – Bacteria
Taxonomic Distributions – Eukarya Ciliates
+53%
ns
ns
ns
ns
Haptophytes
+71%
ns
ns
ns
ns
ns
Rhizaria
262%
ns
ns
ns
ns
ns
Stramenopiles
251%
ns
ns
ns
ns
ns
Euryarchaeota-Marine Group II
+50%
FB , Ocean
0.80
ns
ns
ns
Thaumarchaeota-Marine Group I
277%
FB . Ocean
20.81
ns
ns
ns
Taxonomic Distributions – Archaea
Trends with two categories were tested using either the t-test (normal data) or the Mann-Whitney test (non-normal data): Ice Extent (,2007 vs. .2007), Geography (Franklin Bay [FB] vs. open-ocean stations), Season (summer vs. fall) and searching for a difference within vs. between groups for the # shared OTUs. Trends with three categories were tested using the Kruskal-Wallis test (non-parametric version of ANOVA): Photosynthetically-Active Radiation (PAR; low vs. medium vs. high) and Chl a Distribution (picoplankton-dominated vs. shared vs. nanoplankton-dominated). The temporal trends (over 8 years, 2003–2010) were tested using linear regression (normal data) or the Spearman Rank correlation (non-normal data). Only those trends showing statistical significance out of the parameters tested are shown. Differences are indicated as either: overall percent increases (+X%) or decreases (2X%) for the two Ice Extent categories; FB more or less abundant than open-ocean for Geography; increasing or decreasing linear trends (r value) over the 8 Years; or ‘‘ns’’ for non-significant. For the # of shared OTUs it is a little different: using the example of Ice Extent, each sample from ,2007 is compared to the other samples from ,2007 (# shared OTUs within the group) and then to the samples from .2007 (between the groups). If the community structure is the same, they should share the same # of OTUs within vs. between groups. However, if there is a significant difference (?), then there has been a change in structure. For the linear decreasing trends, this implies that the more years separating samples, the less OTUs they share – indicating change in community structure over time. See Supplementary Table S5 for the assignments of the 11 samples into each of the respective categories. doi:10.1371/journal.pone.0027492.t001
a levels are generally below 1 mg L21 in the SCM, this peak in water column biomass is a striking features of much of the oligotrophic Canadian Arctic [16,30]. Post-bloom conditions persist though the autumn, but occasional local upwelling and advective nutrient input can promote sporadic increased concentrations of Chl a of ca. 2 mg L21 [31]. The September 2005 sample was an example of such an event with the lightly silicified diatom Chaetoceros socialis appearing in the SCM layer. Similar peaks in bacterial taxa, especially unclassified Alphaproteobacteria and Bacteroidetes, were also noted suggesting transient conditions can favor select taxa of Bacteria as well as phytoplankton. Similar peaks in specific archaeal taxa may also suggest transient conditions. The goal of our study was to find trends by pooling the data from before and after 2007. Overall significant differences in the probability of different taxa occurring were able to be distinguished from such occasional events. All three microbial domains showed significant shifts in some species or genera coinciding with the timing of changes in the global environmental conditions. Taxon ordination and OTU similarity trees indicated that diminishing summer ice cover over time was the best indicator of such taxonomic changes. Bacterial diversity fell over time, with fewer OTUs in recent years and the fewer OTUs accounting for higher percentages of the total
bacterial analysis, among Eukarya we did not detect any significant influences by season, PAR or Chl a size distribution (Table 1). Except for 2004, the majority of Archaea OTUs belonged to Euryarchaeota Marine Group-II (Eury-MG-II; Fig. 4C and 5B) and they showed a significant linear increase over the 8 years (Table 1). Over the same period, the Thaumarchaeota MG-I (Thaum-MG-I; formally classified within the Crenarchaeota), showed the inverse trend. This striking pattern was repeated amongst the dominant OTUs (Fig. S7), where the two Thaum-MG-I OTU groups represented up to ,60% of all Archaea sequences before 2007 (p = 0.04 and 0.05 for decrease). Afterwards, the situation was inversed, with Eury-MG-II OTUs representing 70% of all archaeal sequences in 2010 (p = 0.05 for increase). With the exception of a geographic influence, no other significant effects due to the other factors were noted (Table 1).
Discussion The main bloom in this region occurs in April or May, when surface Chl a levels can reach 5 to 12 mg L21 [28]. Following the spring bloom, surface waters are depleted in nitrogen and support very low levels of primary productivity [11,16,29]. Although Chl PLoS ONE | www.plosone.org
8
November 2011 | Volume 6 | Issue 11 | e27492
Arctic Microbial Communities and Reduced Sea Ice
Figure 5. Taxonomic groups showing changes. Boxplots of select taxonomic groups, with parameters as in Fig. 3 and colors corresponding to Fig. 4. Lighter shades indicate 2003–2006 and darker shades indicate 2007–2010. Those parameters that became non-significant (ns) when the coastal Franklin Bay (FB) samples were removed are indicated. Conversely, those that became significant when analyzed geographically (GEO; coastal Franklin Bay vs. open-ocean sites) are also indicated. (A) Various bacterial taxa (97% level). Pelagi., Pelagibacter spp.; Bact., Bacteroidetes phylum; Flavo., Flavobacteria class. (B) Archaea groups (97% level). The MG-I and MG-II show significant linear trends (r2 = 0.65, p = 0.02 and r2 = 0.64, p = 0.02) over the 8 years. (C) Various Eukarya taxa (98% level). Stram., stramenopiles; Rhiz., Rhizaria; Hapto., Haptophytes; Cili., Ciliates. doi:10.1371/journal.pone.0027492.g005
populations. The numbers of OTUs from the other two domains, in contrast, did not change and storage of the samples over time would not explain the decrease in diversity of Bacteria. In addition, if taxa were lost during storage of extracted DNA, fewer species would be retrieved from the older samples unless substantial degradation artificially increased the number of OTUs. A recent paper by Kalanetra et al. [32] used DNA collected from the Arctic Ocean in 1997 and reported no significant losses or degradation of the DNA over the 12 year storage period. An ecological-biological explanation for the increase in bacterial evenness and loss of rare taxa may be that increased stability of the physical layer results in less exchange with adjacent water-masses via mixing and a gradual loss of slower growing or less optimally adapted community members over time [33], without replacement by new ribotypes [34]. Taxonomically, there was a significant shift away from the Bacteroidetes represented by over a dozen genera, but with just over half (53%) belonging to two taxa: the psychrophilic Polaribacter [35] and unidentified Flavobacteriaceae. Bacteroidetes have a preference for, and selective advantage when growing upon, complex organic matter (OM) [36]; additionally Bacteroidetes and phytoplankton that produce complex OM exudates [37] are often found together [38–40]. Bacteroidetes are also significant and persistent members of sea ice biota, for example ice-associated Polaribacter are able to breakdown and grow on OM in brine channels [41,42]. Lo Giudice et al. [43] suggested PLoS ONE | www.plosone.org
that annual melt of sea ice is a source of Bacteroidetes found in the water column in spring and summer. Alternatively, Arctic watercolumn Bacteroidetes may be pelagic and populations increase when OM is released by melting sea ice [40]. Regardless of the mechanism, the decrease in Bacteroidetes OTUs over time suggests that they were an indicator of changes in the OM characteristics in the SCM. Among the three domains, Archaeal OTUs showed the pattern reflecting the most substantial change concurrent with reduced summer sea ice extent, with significant compositional changes within communities. Taxonomically, there was a decline in Thaum-MG-I over time, albeit with a strong geographic component. This may seem counter-intuitive as Thaum-MG-I have been associated with higher particle loads from river input and with the melting and flux of material from seasonal ice [44], which are becoming more prevalent in a warming Arctic. However, since 2007, ice free conditions have arrived earlier in the Amundsen Gulf and the seasonally longer exposure to higher irradiances would create less favorable conditions for the ThaumMG-I since they are likely inhibited by light [45]. Regardless the cause, their loss could have an effect on nitrogen availability to phytoplankton [45,46]. Thaum-MG-I oxidize ammonia as an energy source, and as fewer and fewer were available to carry out the first steps that convert ammonia to nitrate over time, their loss may have contributed to the decreasing nitrate concentrations in 9
November 2011 | Volume 6 | Issue 11 | e27492
Arctic Microbial Communities and Reduced Sea Ice
the SCM. Diatoms are thought to be better competitors for nitrate compared to picophytoplankton [47–49] and the loss ThaumMG-I could have unexpected effects on the capacity of diatoms to persist in the SCM. However, because of our focus on the smaller size fraction, larger robust diatoms were not well sampled and additional work is required to test this notion. Total eukaryote diversity (indices and OTUs) was much higher than reported from standard cloning and sequencing studies in this same region [7,50]. Although we only sequenced the size fraction between 0.2 and 3 microns, it is routine to recover sequences from more flexible or fragile cells that break up during filtration [50,51] and the diversity reported here would include these as well as rare OTUs not detected using standard cloning and sequencing approaches. All of the major groups we recovered have been previously reported, and the diversity found here suggests high species-level diversity, especially among small dinoflagellates which group together and are referred to as the GymnodinialesPeridiniales-Prorocentrales (GPP) complex [52]. These groups represent much of the diversity among Eukarya in most Arctic waters studied to date [7,50,53]. Several other dinoflagellates ribotypes were within clades of heterotrophic and mixotrophic species, notably the Gyrodinium helveticum and G. rubrum group [14,54]. These Gyrodinium spp. graze on other protists including phytoplankton [55,56] and fluctuations in their relative abundance may be an indication of shifts in the microbial food web dynamics. However, the major changes within the Eukarya sequences came from other heterotrophs; ciliates significantly increased and bacteriovorus MASTs [27] decreased, perhaps indicating overall changes in available prey among the Arctic microbiota. After 2007, MASTs may have access to fewer rstrategist bacteria, such as the Bacteroidetes, which have larger cellsizes and are preferred targets for bacteriovory. Finally, particular picoeukaryote photosynthetic groups, such as the Haptophytes and the Arctic ecotype of Micromonas CCMP2099 tended to increase and suggesting their physiological capacity to thrive over a range of conditions still present in the Arctic [57]. The continuing loss of sea ice in the Arctic has been mostly considered in the context of climate forcing and physical feedback. Some modeling results have suggested that the longer open-water season in the Arctic will result in increased productivity [58,59]. These models all assume that more open water will lead to increased mixing and entrainment of nutrients into the upper water column. Alternatively, the freshening of the Arctic could lead to stronger salinity stratification and fewer nutrients being entrained into the euphotic zone. The Beaufort Sea-Amundsen Gulf region has been a significant contributor to the Arctic-wide melt of multiyear sea ice [2] and the major effect of the ice melt has been a its contribution to the upper Arctic Ocean freshwater budget. The gradual decrease in salinity of the Pacific-origin water is consistent with the overall freshening of the Beaufort and increasing stratification since deep waters below the halocline are not affected. The lack of mixing is also consistent with the drawdown of nitrate over time in the region of the SCM layer of Amundsen Gulf. The SCM occurs at the bottom of the euphotic zone and increasing stratification and nutrient depletion of the upper waters may act to force the SCM deeper resulting in lower ambient PAR for an already light limited community [30]. The long-term consequence of further increasing stratification will be reduction of the vertical flux of nutrients to the euphotic zone and deceasing productivity of the entire Beaufort region [29]. The Amundsen Gulf itself is a broad (,200 km), deep (,500 m) tributary basin of the Canada Basin. Owing to free exchange of water masses above the sill depth (,350 m), the biophysical properties of its surface waters are broadly representative of the neighboring Canada Basin, where the trends toward PLoS ONE | www.plosone.org
increased stratification and a reduction of nitrate since 2002 is evident [5]. Biologically, there has been a size shift in the Canada Basin photosynthetic community where small cells have replaced larger species [5]. A physical size-shift in Arctic plankton has theoretical downstream effects on nutrient and carbon cycling. Changes in bacterial, archaeal and protist plankton composition will have internal feedbacks and understanding these is a prerequisite to predicting the ecological consequences of continuing climate-forced oceanographic changes. Here we report the first indications of significant changes the occurrence of multiple microbial taxa in the SCM, a biologically significant feature of much of the Western Arctic. In conclusion, our results point towards a change in the physical structure and nitrate concentrations in the SCM of the Western Arctic and changes in microbial communities over the same time period. Changes in the photosynthetic species composition and microbial food web structure has a direct and substantial effect on zooplankton that can cascade throughout the entire Arctic food chain [60,61]. Equally, changes in bacterial and archaeal communities that are responsible for nutrient and carbon biogeochemical cycling [62] may have downstream effects on net productivity and the tendency of the Arctic Ocean to sequester or release atmospheric carbon dioxide [63,64]. With our approach, we were able to identify the communities in the SCM before and after a major physical change in the Arctic Ocean. As change continues, knowing something not only of the taxonomy, but also of the functional capacity and ecology, of the three microbial domains of life will become critical for predicting the consequences of a warmer, more stratified, and perhaps soon-tobe seasonally ice-free Arctic.
Supporting Information Figure S1 Rarefaction analysis for Bacteria (97% OTU level), Eukaryotes (98% OTU level) and Archaea (97% OTU level). The inset box shows the Chao1 total richness estimate for the three domains. (PDF) Figure S2 Whole community diversity comparisons. Correspondence analysis calculated from the percent taxonomic distributions of the total OTUs. Dots are colored according to Ice Extent: ,2007 in blue and .2007 in red. (A) Bacteria 97% phylum-level OTUs. (B) Eukarya 98% major-group-level OTUs. (C) Archaea 97% genus-level OTUs. (PDF) Figure S3 Whole community diversity comparisons. Bray-Curtis similarity trees were calculated from total OTU compositions (independent of taxonomy). Trees are colored according to Ice Extent: ,2007 in blue and .2007 in red. (A) Bacteria 97% level OTUs. (B) Eukarya 98% level OTUs. (C) Archaea 97% level OTUs. (PDF) Figure S4 Taxonomic distribution of the top 50 dominant Bacteria OTUs (97% level). Colors are as in Figure 4: aProteobacteria (AlphaP) are in dark purple, c-Proteobacteria (GammaP) in light purple, d-Proteobacteria (DeltaP) in rose; Bacteroidetes in orange, Verrucomicrobia (Verruco) in red, Planctomycetes (Plancto) in blue and unclassified (unclass.) sequences are in black. Rhodobact., Rhodobacteraceae; Rhodospiril., Rhodospirillaceae; AlteroO, Alteromonadales; OceanoO, Oceanospirillales; CystoF, Cystobacteraceae; Cryo., Cryomorphaceae; FlavoF, Flavobacteriaceae. Gray squares indicate complete absence (0%). (PDF) 10
November 2011 | Volume 6 | Issue 11 | e27492
Arctic Microbial Communities and Reduced Sea Ice
Figure S5 Taxonomic distributions of select Eukarya group OTUs (98% level). (A) Distribution of stramenopiles. MAST, uncultured marine stramenopile groups. (B) Distribution of Alveolates. MALV, uncultured marine Alveolate groups. (PDF)
Table S3 MIMARKS-compliant table of the pyrosequencing
samples. (XLS) Table S4 Pyrotag raw data, filtering and OTU statistics.
(PDF)
Figure S6 Taxonomic distribution of the top 50 dominant eukaryotic OTUs (98% level). Colors are as in Figure 4: the different sub-groups of Alveolates are in shades of blue, the Biliphytes in pink, the Choanoflagellates (Choano) in orange, the Haptophytes in purple, the Prasinophytes (Prasino) in green, the Rhizaria in yellow, the stramenopile sub-groups in shades of red and the unclassified (unclass.) levels in black. Intramacro., Intramacronucleata; DinoGPP, Gymnodinium-Peridinium-Prorocentrum complex; Environ, environmental; MALV, uncultured marine Alveolate group; MAST, uncultured marine stramenopile group. Gray squares indicate complete absence (0%). (PDF)
Table S5 Assignments of the samples to the various categories
used to test for significant trends (see Fig. 1 and Table 1). (PDF)
Acknowledgments We thank our colleagues at the McGill University/Ge´nome-Que´bec Innovation Centre and the IBIS/Universite´ Laval Plate-forme d’Analyses Ge´nomiques for the DNA pyrosequencing; the IBIS Centre de Bioinfomatique et de Biologie Computationnelle, Compute-Canada and the CLUMEQ Supercomputing Facility for bioinformatics support. Comments from several anonymous reviewers considerably improved our original manuscript. We appreciate the contributions of M. Gosselin and Diana Varela for pigment data and the numerous students and Post-Docs, who collected, filtered and extracted the DNA as part of C.L. ’s ongoing Natural Science and Engineering Research Council of Canada (NSERC) Discovery program and the Canadian Healthy Oceans Network. We are indebted to Fisheries and Oceans Canada and crews of the CCGS Amundsen and CCGS Sir Wilfred Laurier during the following Arctic expeditions: CASES, ArcticNet2005/06, CFL, C3O, MALINA and ArcticNet 2009/10.
Figure S7 Taxonomic distribution of the top 50 dominant Archaea OTUs (97% level). Colors are as in Figure 4: Thaumarchaeota (ThaumA) Marine Group (MG) I are in shades of blue and Euryarchaeota (EuryA) MG-II in red. (PDF) Table S1 16S/18S rDNA primer re-design (original primers are on gray lines, new on white). (PDF)
Author Contributions Conceived and designed the experiments: AMC CL. Performed the experiments: AMC CL JE´T. Analyzed the data: AMC CL JE´T WKWL ECC. Wrote the paper: AMC CL JE´T WKWL ECC.
Table S2 16/18S pyrosequencing primers.
(PDF)
References 16. Martin J, Tremblay J, Gagnon J, Tremblay G, Lapoussie`re A, et al. (2010) Prevalence, structure and properties of subsurface chlorophyll maxima in Canadian Arctic waters. Mar Ecol Prog Ser 412: 69–84. 17. Harding T, Jungblut AD, Lovejoy C, Vincent WF (2011) Microbes in high Arctic snow and implications for the cold biosphere. Appl Environ Microbiol 77: 3234–3243. 18. Garneau M-E, Vincent W, Alonso-Sa´ez L, Gratton Y, Lovejoy C (2006) Prokaryotic community structure and heterotrophic production in a riverinfluenced coastal arctic ecosystem. Aquat Microb Ecol 42: 27–40. 19. Huse SM, Huber JA, Morrison HG, Sogin ML, Welch DM (2007) Accuracy and quality of massively parallel DNA pyrosequencing. Genome Biol 8: R143. 20. Quince C, Lanze´n A, Curtis TP, Davenport RJ, Hall N, et al. (2009) Accurate determination of microbial diversity from 454 pyrosequencing data. Nature Meth 6: 639–641. 21. Behnke A, Engel M, Christen R, Nebel M, Klein RR, et al. (2010) Depicting more accurate pictures of protistan community complexity using pyrosequencing of hypervariable SSU rRNA gene regions. Environ Microbiol 13: 340–349. 22. Schloss PD (2009) A high-throughput DNA sequence aligner for microbial ecology studies. PLoS One 4: e8230. 23. Schloss PD, Westcott SL, Ryabin T, Hall JR, Hartmann M, et al. (2009) Introducing mothur: Open source, platform-independent, community-supported software for describing and comparing microbial communities. Appl Environ Microbiol 75: 7537–7541. 24. Cole JR, Wang Q, Cardenas E, Fish J, Chai B, et al. (2009) The Ribosomal Database Project: Improved alignments and new tools for rRNA analysis. Nucl Acids Res 37: D141–145. 25. Claesson MJ, O’Sullivan O, Wang Q, Nikkila¨ J, Marchesi JR, et al. (2009) Comparative analysis of pyrosequencing and a phylogenetic microarray for exploring microbial community structures in the human distal intestine. PLoS One 4: e6669. 26. Strey ST, Chapman WL, Walsh JE (2010) The 2007 sea ice minimum: Impacts on the Northern Hemisphere atmosphere in late autumn and early winter. J Geophys Res 115: 1–13. 27. Massana R, Castresana J, Balague´ V (2004) Phylogenetic and ecological analysis of novel marine stramenopiles. Appl Environ Microbiol 70: 3528–3534. 28. Mundy CJ, Gosselin M, Ehn J, Gratton Y, Rossnagel A, et al. (2009) Contribution of under-ice primary production to an ice-edge upwelling phytoplankton bloom in the Canadian Beaufort Sea. Geophys Res Lett 36: 1–5. 29. Tremblay J-E´, Simpson K, Martin J, Miller L, Gratton Y, et al. (2008) Vertical stability and the annual dynamics of nutrients and chlorophyll fluorescence in the coastal, southeast Beaufort Sea. J Geophys Res 113: 1–14.
1. Screen JA, Simmonds I (2010) The central role of diminishing sea ice in recent Arctic temperature amplification. Nature 464: 1334–1337. 2. Kwok R, Cunningham GF (2010) Contribution of melt in the Beaufort Sea to the decline in Arctic multiyear sea ice coverage: 1993–2009. Geophys Res Lett 37: 1–5. 3. Vincent WF (2010) Microbial ecosystem responses to rapid climate change in the Arctic. ISME J 4: 1087–1090. 4. Proshutinsky A, Krishfield R, Timmermans M-L, Toole J, Carmack E, et al. (2009) Beaufort Gyre freshwater reservoir: State and variability from observations. J Geophys Res 114: 1–25. 5. Li WKW, McLaughlin FA, Lovejoy C, Carmack EC (2009) Smallest algae thrive as the Arctic Ocean freshens. Science 326: 539–539. 6. Rainville L, Woodgate RA (2009) Observations of internal wave generation in the seasonally ice-free Arctic. Geophys Res Lett 36: L23604. 7. Lovejoy C, Potvin M (2011) Microbial eukaryotic distribution in a dynamic Beaufort Sea and the Arctic Ocean. J Plank Res 33: 431–444. 8. Lovejoy C, Vincent WF, Bonilla S, Roy S, Martineau M-J, et al. (2007) Distribution, phylogeny, and growth of cold-adapted picoprasinophytes in Arctic seas. J Phycol 43: 78–79. 9. Galand PE, Casamayor EO, Kirchman DL, Lovejoy C (2009) Ecology of the rare microbial biosphere of the Arctic Ocean. Proc Natl Acad Sci USA 106: 22427–22432. 10. Kirchman DL, Cottrell M, Lovejoy C (2010) The structure of bacterial communities in the western Arctic Ocean as revealed by pyrosequencing of 16S rRNA genes. Environ Microbiol 12: 1132–1143. 11. Brugel S, Nozais C, Poulin M, Tremblay J, Miller L, et al. (2009) Phytoplankton biomass and production in the southeastern Beaufort Sea in autumn 2002 and 2003. Mar Ecol Prog Ser 377: 63–77. 12. Sogin ML, Morrison HG, Huber JA, Welch MD, Huse SM, et al. (2006) Microbial diversity in the deep sea and the underexplored ‘‘rare biosphere’’. Proc Natl Acad Sci USA 103: 12115–12120. 13. Marie D, Zhu F, Balague´ V, Ras J, Vaulot D (2006) Eukaryotic picoplankton communities of the Mediterranean Sea in summer assessed by molecular approaches (DGGE, TTGE, QPCR). FEMS Microbiol Ecol 55: 403–415. 14. Terrado R, Medrinal E, Dasilva C, Thaler M, Vincent WF, et al. (2011) Protist community composition during spring in an Arctic flaw lead polynya. Polar Biol;doi:10.1007/s00300-011-1039-5. 15. Jackson JM, Carmack EC, McLaughlin FA, Allen SE, Ingram RG (2010) Identification, characterization, and change of the near-surface temperature maximum in the Canada Basin, 1993–2008. J Geophys Res 115: 1–16.
PLoS ONE | www.plosone.org
11
November 2011 | Volume 6 | Issue 11 | e27492
Arctic Microbial Communities and Reduced Sea Ice
46. Nicol GW, Schleper C (2006) Ammonia-oxidising Crenarchaeota: Important players in the nitrogen cycle? Trends Microbiol 14: 207–212. 47. Stolte W, Riegman R (1995) Effect of phytoplankton cell size on transient-state nitrate and ammonium uptake kinetics. Microbiol 141: 1221–1229. 48. Sarthou G, Timmermans KR, Blain S, Tre´guer P (2005) Growth physiology and fate of diatoms in the ocean: A review. J Sea Res 53: 25–42. 49. Veldhuis MJW, Timmermans KR, Croot P, van der Wagt B (2005) Picophytoplankton; a comparative study of their biochemical composition and photosynthetic properties. J Sea Res 53: 7–24. 50. Lovejoy C, Massana R, Pedro´s-Alio´ C (2006) Diversity and distribution of marine microbial eukaryotes in the Arctic Ocean and adjacent seas. Appl Environ Microbiol 72: 3085–3095. 51. Shi XL, Marie D, Jardillier L, Scanlan DJ, Vaulot D (2009) Groups without cultured representatives dominate eukaryotic picophytoplankton in the oligotrophic South East Pacific Ocean. PLoS One 4: e7657. 52. Saldarriaga JF, Taylor FJRM, Cavalier-Smith T, Menden-Deuer S, Keeling PJ (2004) Molecular data and the evolutionary history of dinoflagellates. Eur J Protistol 40: 85–111. 53. Bachy C, Lo´pez-Garcı´a P, Vereshchaka A, Moreira D (2011) Diversity and vertical distribution of microbial eukaryotes in the snow, sea ice and seawater near the North Pole at the end of the polar night. Front Microbiol 2: 1–12. 54. Terrado R, Vincent WF, Lovejoy C (2009) Mesopelagic protists: Diversity and succession in a coastal Arctic ecosystem. Aquat Microb Ecol 56: 25–40. 55. Hansen PJ, Calado AJ (1999) Phagotrophic mechanisms and prey selection in free-living dinoflagellates. J Euk Microbiol 46: 382–389. 56. Jeong HJ (1999) The ecological roles of heterotrophic dinoflagellates in marine planktonic community. J Euk Microbiol 46: 390–396. 57. Lovejoy C, Galand PE, Kirchman DL (2010) Picoplankton diversity in the Arctic Ocean and surrounding seas. Mar Biodiv 41: 5–12. 58. Arrigo KR, Dijken G van, Pabi S (2008) Impact of a shrinking Arctic ice cover on marine primary production. Geophys Res Lett 35: 1–6. 59. Zhang J, Spitz YH, Steele M, Ashjian C, Campbell R, et al. (2010) Modeling the impact of declining sea ice on the Arctic marine planktonic ecosystem. J Geophys Res 115: 1–24. 60. Falk-Petersen S, Haug T, Hop H, Nilssen KT, Wold A (2009) Transfer of lipids from plankton to blubber of harp and hooded seals off East Greenland. Deep Sea Res Part II: Top Stud Oceanogr 56: 2080–2086. 61. Purcell JE, Hopcroft RR, Kosobokova KN, Whitledge TE (2010) Distribution, abundance, and predation effects of epipelagic ctenophores and jellyfish in the western Arctic Ocean. Deep Sea Res Part II: Top Stud Oceanogr 57: 127–135. 62. Falkowski PG, Fenchel T, Delong EF (2008) The microbial engines that drive Earth’s biogeochemical cycles. Science 320: 1034–1039. 63. Riebesell U, Ko¨rtzinger A, Oschlies A (2009) Sensitivities of marine carbon fluxes to ocean change. Proc Natl Acad Sci USA 106: 20602–20609. 64. Lavoie D, Denman KL, Macdonald RW (2010) Effects of future climate change on primary productivity and export fluxes in the Beaufort Sea. J Geophys Res 115: 1–15.
30. McLaughlin FA, Carmack EC (2010) Deepening of the nutricline and chlorophyll maximum in the Canada Basin interior, 2003–2009. Geophys Res Lett 37: L24602. 31. Forest A, Be´langer S, Sampei M, Sasaki H, Lalande C, et al. (2010) Three-year assessment of particulate organic carbon fluxes in Amundsen Gulf (Beaufort Sea): Satellite observations and sediment trap measurements. Deep-Sea Res I 57: 125–142. 32. Kalanetra KM, Bano N, Hollibaugh JT (2009) Ammonia-oxidizing Archaea in the Arctic Ocean and Antarctic coastal waters. Environ Microbiol 11: 2434–2445. 33. Alonso-Sa´ez L, Sa´nchez O, Gasol JM, Balague´ V, Pedro´s-Alio´ C (2008) Winterto-summer changes in the composition and single-cell activity of near-surface Arctic prokaryotes. Environ Microbiol 10: 2444–2454. 34. Howeth JG, Leibold MA (2010) Species dispersal rates alter diversity and ecosystem stability in pond metacommunities. Ecology 91: 2727–2741. 35. Gosink JJ, Woese CR, Staley JT (1998) Polaribacter gen. nov., with three new species, P. irgensii sp. nov., P. franzmannii sp. nov. and P. filamentus sp. nov., gas vacuolate polar marine bacteria of the Cytophaga-Flavobacterium-Bacteroides group and reclassification of ‘Flectobacillus glomeratus’ as Polaribacter glomeratus comb. nov. Int J Syst Bacteriol 48: 223–235. 36. Bauer M, Kube M, Teeling H, Richter M, Lombardot T, et al. (2006) Whole genome analysis of the marine Bacteroidetes ‘Gramella forsetii’ reveals adaptations to degradation of polymeric organic matter. Environ Microbiol 8: 2201–2213. 37. Passow U (2002) Transparent exopolymer particles (TEP) in aquatic environments. Prog Oceanogr 55: 287–333. 38. Grossart H-P, Levold F, Allgaier M, Simon M, Brinkhoff T (2005) Marine diatom species harbour distinct bacterial communities. Environ Microbiol 7: 860–873. 39. Zeder M, Peter S, Shabarova T, Pernthaler J (2009) A small population of planktonic Flavobacteria with disproportionally high growth during the spring phytoplankton bloom in a prealpine lake. Environ Microbiol 11: 2676–2786. 40. Piquet AM-T, Bolhuis H, Meredith MP, Buma AGJ (2011) Shifts in coastal Antarctic marine microbial communities during and after melt water-related surface stratification. FEMS Microbiol Ecol 76: 413–427. 41. Staley JT, Gosink JJ (1999) Poles apart: Biodiversity and biogeography of sea ice bacteria. Ann Rev Microbiol 53: 189–215. 42. Collins RE, Rocap G, Deming JW (2010) Persistence of bacterial and archaeal communities in sea ice through an Arctic winter. Environ Microbiol 12: 1828–1841. 43. Lo Giudice A, Caruso C, Mangano S, Bruni V, De Domenico M, et al. (2011) Marine bacterioplankton diversity and community composition in an Antarctic coastal environment. Microb Ecol;doi:10.1007/s00248-011-9904-x. 44. Galand PE, Lovejoy C, Vincent WF (2006) Remarkably diverse and contrasting archaeal communities in a large arctic river and the coastal Arctic Ocean. Aquat Microb Ecol 44: 115–126. 45. Schleper C, Nicol GW (2010) Ammonia-oxidising archaea – Physiology, ecology and evolution. Adv Microb Physiol 57: 1–41.
PLoS ONE | www.plosone.org
12
November 2011 | Volume 6 | Issue 11 | e27492