Epidemiology/Health Services Research B R I E F
R E P O R T
Are Hemoglobin Levels Elevated in Type 1 Diabetes? BAQIYYAH N. CONWAY, PHD RACHEL G. MILLER, MS TREVOR J. ORCHARD, MD
OBJECTIVE — While lower hemoglobin is generally associated with adverse events in diabetes, we have recently observed in type 1 diabetes that those with overt nephropathy had hemoglobin levels as high as 18.8 g/dl. We thus explored whether hemoglobin concentrations are generally higher in type 1 diabetes. RESEARCH DESIGN AND METHODS — Baseline (1986 –1988) hemoglobin levels from the Pittsburgh Epidemiology of Diabetes Complications Study (EDC) of type 1 diabetes were compared with general population data from the National Health and Nutrition Examination Survey (NHANES) III in the same age range as the EDC population (aged 8 – 48 years). RESULTS — Both male and female EDC study participants had significantly higher hemoglobin levels than their NHANES III counterparts (men: 16.0 vs. 15.1 g/dl, P ⬍ 0.0001; women: 14.1 vs. 13.3 g/dl, P ⬍ 0.0001). The difference between the two populations was greatest in adolescent female subjects. CONCLUSIONS — Hemoglobin levels may be higher in type 1 diabetes than in the general population, which may have important clinical implications. Diabetes Care 33:341–343, 2010
A
lthough low hemoglobin is generally associated with adverse events in diabetes (1) and kidney disease (2), we have recently observed relatively high hemoglobin levels (as high as 18.8 g/dl) among individuals with type 1 diabetes and overt nephropathy (3) compared with the general renal disease population (4). This led us to question whether hemoglobin levels are generally elevated in type 1 diabetes. We therefore assessed 652 individuals from the Pittsburgh Epidemiology of Diabetes Complications Study (EDC) of type 1 diabetes and compared the hemoglobin levels observed with those of the general National Health and Nutrition Examination Survey (NHANES) III population. RESEARCH DESIGN AND METHODS — EDC is a 20-year prospective study based on a well-defined cohort with childhood onset (aged ⬍17 years) type 1 diabetes living within 100
miles of the University of Pittsburgh at study baseline (5,6). For these analyses, baseline data (1986 –1988) from 652 participants (50.5% female, 98% Caucasian) were examined. Blood samples were assayed for hemoglobin and A1C. Overt nephropathy was defined as albumin excretion rate ⬎200 g/min or dialysis/ renal transplantation. Hemoglobin in EDC was measured using the Coulter Counter Model S-Plus IV automated blood cell counter (Coulter Electronics, Hialeah, FL). General population comparison data were retrieved from NHANES III (years 1988 –1994) (7) for Caucasians in the same age range as the EDC population (i.e., aged 8 – 48 years). Hemoglobin in NHANES III was measured using a semiautomated cell counter (Coulter hemoglobinometer) (7). Appropriate sampling weights were used to obtain unbiased estimates of hemoglobin means and SEs in NHANES III. These sampling weights account for the
● ● ● ● ● ● ● ● ● ● ● ● ● ● ● ● ● ● ● ● ● ● ● ● ● ● ● ● ● ● ● ● ● ● ● ● ● ● ● ● ● ● ● ● ● ● ● ● ●
From the Department of Epidemiology, University of Pittsburgh, Pittsburgh, Pennsylvantia. Corresponding author: Trevor J. Orchard,
[email protected]. Received 14 April 2009 and accepted 2 November 2009. Published ahead of print at http://care. diabetesjournals.org on 16 November 2009. DOI: 10.2337/dc09-0713. © 2010 by the American Diabetes Association. Readers may use this article as long as the work is properly cited, the use is educational and not for profit, and the work is not altered. See http://creativecommons. org/licenses/by-nc-nd/3.0/ for details. The costs of publication of this article were defrayed in part by the payment of page charges. This article must therefore be hereby marked “advertisement” in accordance with 18 U.S.C. Section 1734 solely to indicate this fact.
care.diabetesjournals.org
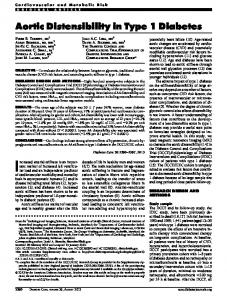
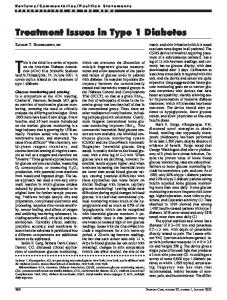
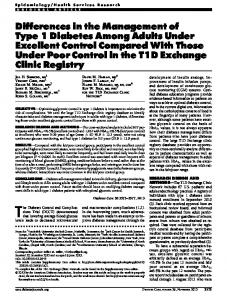
complex design of the NHANES III survey, including oversampling of certain subgroups and nonresponse bias, and provide estimates that are representative of the noninstitutionalized U.S. population. Mean hemoglobin levels were calculated using PROC Surveymeans in SAS 9.1.3 (SAS Institute, Cary, NC). RESULTS — Hemoglobin ranged from 8.3 to 20.0 g/dl in EDC and from 5.2 to 18.7 g/dl in NHANES III. Relative to the general population, EDC participants had higher hemoglobin levels overall (15.1 vs. 14.2 g/dl, P ⬍ 0.0001) (Fig. 1) and sex specifically (men: 16.0 vs. 15.1 g/dl, P ⬍ 0.0001; women: 14.1 vs. 13.3 g/dl, P ⬍ 0.0001). The difference between the two populations was greatest in teenage females; girls aged 15–19 years with type 1 diabetes had hemoglobin levels ⬃2 g/dl higher than similarly aged NHANES III females; the difference in boys was ⬃1 g/dl. EDC teenage girls had hemoglobin levels similar to those of NHANES III teenage boys (Fig. 1). In male subjects with type 1 diabetes, hemoglobin levels were stable until about age 14 years, when they began to rise, peaking at 16.9 g/dl at approximately age 22 years. A similar rise in hemoglobin, though less steep, was seen in NHANES III male subjects (Fig. 1). In female subjects with type 1 diabetes, hemoglobin levels did not display the same pattern of a constant rise throughout adolescence observed in male subjects, but rose sharply, by 1.6 g/dl, at the beginning of their teens, remaining elevated throughout the teen years, peaking at 15.0 g/dl. In contrast, in NHANES III female subjects aged 12–19 years, hemoglobin remained constant (Fig. 1). In the general population adults, hemoglobin levels remained relatively stable in both sexes. In the EDC type 1 diabetic population, hemoglobin in male subjects began to drop in their mid-20s whereas in female subjects, this occurred earlier (Fig. 1). The decline in hemoglobin in adult type 1 diabetic male subjects could be explained by overt nephropathy, as those without overt nephropathy showed no decline in adulthood after their mid-20s. In adult type 1 diabetic female subjects, this difference by overt nephropathy sta-
DIABETES CARE, VOLUME 33, NUMBER 2, FEBRUARY 2010
341
Total hemoglobin and type 1 diabetes
Figure 1—Hemoglobin distributions in EDC and NHANES III. A: Hemoglobin distribution in NHANES III and EDC populations. B: Hemoglobin levels in NHANES III and EDC male subjects by age-group. Solid line, NHANES III. Dotted line, EDC. C: Hemoglobin levels in NHANES III and EDC female subjects by age-group. Solid line, NHANES III. Dotted line, EDC.
tus was less marked. Women without overt nephropathy still showed this agerelated decline, and the difference by overt nephropathy status did not reach statistical significance until age 40 years (online appendix Fig. 1 [available at http:// care.diabetesjournals.org/cgi/content/full/ dc09-0713/DC1]). To determine whether the elevated hemoglobin observed in EDC subjects might simply be due to increased hemoconcentration from dehydration secondary to poor glycemic control, analyses were repeated with EDC participants restricted to those with 1) A1C levels greater than or equal to the median and 2) A1C levels less than or equal to the median. Similar results were obtained to those in Fig. 1. In a subanalysis, hemoglobin levels in our 13 African American female subjects with type 1 diabetes (aged 18 –39 years) did not differ from our Caucasian female subjects (13.7 vs. 14.1 g/dl, P ⫽ 0.20) but were significantly higher than NHANES III African American female subjects (13.7 vs. 12.4 g/dl, P ⬍ 0.0001). Hemoglobin levels significantly differed between NHANES III African American and Caucasian female subjects (12.4 vs. 13.2 g/dl, P ⬍ 0.0001). Sample size prohibited formal analyses in males. 342
CONCLUSIONS — We have demonstrated that hemoglobin levels are higher in type 1 diabetes than in the general population, by ⬃1 g/dl. To our knowledge, this is the first report to document this finding. We have shown that this difference is greatest for adolescent females, particularly striking since in the general population the adolescent rise in hemoglobin is only observed in male subjects (8). Although hemoglobin levels began to decline in type 1 diabetes in the early to mid-20s this decline was not observed in the general population. In men with type 1 diabetes, kidney disease largely accounted for this decline. The increase in hemoglobin was unrelated to glycemic control. Potential explanations include a response to generalized hypoxia secondary to vascular disease, or a response to testosterone, which has been reported to be increased in type 1 diabetes (9,10). In addition to the erythropoietic effects of testosterone, insulin and insulin-like growth factor-1 and -2 stimulate erythropoietin production in astrocytes (11). Finally, intermittent ketosis might lead to increased -hydroxy-butyrate, resulting in higher fetal hemoglobin (12) and hence total hemoglobin levels. Elevated fetal hemoglobin has been observed in both children
DIABETES CARE, VOLUME 33, NUMBER 2, FEBRUARY 2010
and adults with type 1 diabetes and correlated only weakly (13), or not at all (14), with glycemic control but increased in adolescence (14). These data have potentially important clinical implications not only for interpreting hemoglobin values in type 1 diabetes but also for complications, as we have recently reported that high hemoglobin is a risk factor for proliferative retinopathy in men; while in women, who are more likely to be in the normal to low end of the hemoglobin distribution, a U-shaped relationship exists (15). Acknowledgments — This work was supported by National Institutes of Health Grant DK34818. No potential conflicts of interest relevant to this article were reported. We thank the EDC participants for their dedicated participation. References 1. Thomas M, MacIsaac R, Tsalamandris C, Molyneaux L, Goubina I, Fulcher G, Yue D, Jerums G. Anemia in patients with type 1 diabetes. J Clin Endocrinol Metab 2004; 89:4359 – 4363 2. Levin A, Thompson C, Ethier J, Carlisle E, Tobe S, Mendelsshon D, Burgess E, Jindal K, Barrett B, Singer J, Djurdjev O. Left ventricular mass index increase in early care.diabetesjournals.org
Orchard and Associates
3.
4.
5.
6.
renal disease: impact of decline in hemoglobin. Am J Kidney Dis 1999;34:125– 134 Conway B, Fried L, Orchard T. Hemoglobin and overt nephropathy complication in type 1 diabetes. Ann Epidemiol 2008; 18:147–155 KDOQI clinical practice guidelines and clinical practice recommendations for anemia in chronic kidney disease. Am J Kidney Dis 2006;47:S11–S145 Orchard T, Dorman J, Maser R, Becker D, Ellis J, LaPorte R, Kuller L. Factors associated with the avoidance of severe complications after 25 years of insulindependent diabetes mellitus: Pittsburgh Epidemiology of Diabetes Complications Study-I. Diabetes Care 1990;13:741–747 Orchard T, Dorman J, Maser R, Becker D, Drash A, Ellis J, LaPorte R, Kuller L. The prevalence of complications in insulindependent diabetes mellitus by sex and duration: Pittsburgh Epidemiology of Diabetes Complications Study-II. Diabetes 1990;39:1116 –1124
care.diabetesjournals.org
7. U.S. Department of Health and Human Services (DHHS), National Center for Health Statistics. Third National Health and Nutrition Examination Survey, 1988 –1994, NHANES III laboratory data file (CD-ROM). Public Use Data File Documentation no. 76200. Hyattsville, MD, Centers for Disease Control and Prevention, 1996 8. Krabbe S, Christensen T, Worm J, Christiansen C, Transbol I. Relationship between haemoglobin and serum testosterone in normal children and adolescents and in boys with delayed puberty. Acta Paediatr Scand 1978;67:655– 658 9. Meyer K, Deutscher J, Anil M, Berthold A, Bartsch M, Kiess W. Serum androgen levels in adolescents with type 1 diabetes: relation to pubertal stage and metabolic control. J Endocrinol Invest 2000;23:362– 368 10. Christensen L, Hagen C, Henriksen J, Haug E. Elevated levels of sex hormones and sex hormone binding globulin in male patients with insulin dependent
11.
12.
13.
14.
15.
diabetes mellitus: effect of improved blood glucose regulation. Dan Med Bull 1997;44 Masuda S, Chikuma M, Sasaki R. Insulinlike growth factors and insulin stimulate erythropoietin production in primary cultured astrocytes. Brain Res 1997;746:63–70 Peters A, Rohloff D, Kohlmann T, Renner F, Jantscheck G, Kerner W, Fehm HL. Fetal hemoglobin in starvation ketosis in young women. Blood 1998;91:691– 694 Diem P, Mullis P, Hirt A, Schuler JJ, Burgi W, Zuppinger K, Teuscher A. Fetal haemoglobin levels in adult type 1 (insulindependent) diabetic patients. Diabetologia 1993;36:129 –132 Mullis P, Schuler J, Zuppinger K. Increased prevalence of fetal haemoglobin in type 1 (insulin-dependent) diabetes mellitus. Diabetologia 1989;32:227–230 Conway B, Rachel R, Klein R, Orchard T. Prediction of proliferative diabetic retinopathy with hemoglobin level. Arch Ophthalmol 2009;127:1494 –1499
DIABETES CARE, VOLUME 33, NUMBER 2, FEBRUARY 2010
343