ARIHANT capital markets ltd. ..... Disclaimer: Arihant capital markets limited is not
soliciting any action based upon it. ... Before its publication the firm, its.
Stock Outlook
Rolta India Ltd.
ARIHANT capital markets ltd.
Date: 20th November 2009
BUY
Rolta India Ltd.—Poised for growth CMP: Rs.172
Target Price: 206
Stock Info Market Capital
Rs.2875 cr
Equity Capital
Rs.161cr
Avg Trading Vol. 52 WK High/Low Face Value
270974 (Qtly) 206.3/40.7 Rs. 10
Industry: Information Technology
BSE Group
A
Shareholding Pattern (30th Sept.’09)
BSE Code NSE Symbol Bloomberg Reuters BSE Sensex NSE Nifty
500366 ROLTA RLTA IN ROLT.BO 16785 4989
Promoters Domestic Institutions
41.2% 3.4%
Foreign Institutions Non Promoters Corp. Public & Others Govt. Holdings
30.4% 4.2% 20.1% 0.0%
Q1FY10 results highlights Results in line with expectation: Rolta posted its 1QFY10 results that were in line with our expectation. The Q1 revenue growth was led by the GIS segment which grew by a healthy 7.2%, while EDA by 2.5% and EICT by 4.8% (qoq). After two consecutive quarters of decline the growth in the EDA segment’s revenue is a healthy sign. It is an indication that with the increase in manufacturing activities and crude prices, this segment which mainly caters to refineries and manufacturing plants can be expected to show better results going ahead. The management has further said that the Q1 results reflects strongest growth in the Middle-east—which we believe is again a positive for EDA. Stability in billing rates: The billing rates remained almost flat over the quarters implying that stability has returned with regards to pricing matters. The management has also indicated that pricing pressure were “behind them”. However, the introduction of VAT of 15-25% by the EU on services delivered by non-EU nation like India will put pressure on its margins and may nullify any increase in billing rates that the company expects in the coming quarters. Increase in order-book: The company’s order-book position improved by 3% to Rs.1659cr covering 85% of the guided revenues for FY10. The majority of the order-book is driven by GIS. However, the EDA segment also showed a healthy uptick. The company is also having over Rs.5000cr orders in the pipe-line, a majority of which are for the GIS segment. Thus it looks well set to increase its revenue substantially once the global scenario improves further. Improvement in margins: The company reported a qoq improvement of 200bps in its gross margin. This was mainly due to higher utilisation, increase in off-shoring, increasing demand for margin-accretive IP solutions and cost rationalization. The company however expects SGA to go up in the coming quarters due to their massive re-branding exercise in order to present itself as a solution-oriented company. This will increase its marketing expenses. But the company aims to maintain its current margins by continuing to rationalize its cost. Head-count reduction continues: The company went for another round of lay-offs for the third consecutive quarter—the main brunt being bored by the EDA segment. The management however says that they are not looking to reduce employee count any further. Infact the company is looking to go for lateral hiring and mid-level managers. Equity dilution in near-future: The company have passed an enabling resolution to raise funds upto US$250mn through various instruments like ADR,GDR, FCCBs, QIPs, etc. that will be convertible to equity shares. We believe the fund will be mostly used for de-leveraging its balance sheet; acquisition looks a rare probability as of now. The possibility of stock dilution may put pressure on the stock price in the near-term. Valuations: At CMP the stock is trading at a P/E of 7.9xFY10E earnings. We maintain our expected yoy revenue growth of 12% and estimated EPS of Rs.21.6 per share. We reiterate our ‘Buy’ recommendation on the stock and maintain our target price of Rs.206 with an ‘upside risk’ for a period of 12 months. We base our recommendation on a strong and an increasing order book size, better revenue visibility, and good Q1 performance. Particulars (Rs. in cr)
FY09
FY10 (E)
1089
1442
1619
Growth %
51%
32%
12%
Net Profit
231
294
347
Growth %
34
27
18
EPS (Rs)
14.4
18.2
21.6
P/E
11.9
9.4
7.9
2.7
2.2
1.8
P/BV
ARIHANT capital markets ltd
FY08
Net Revenue
1
Stock Outlook
Rolta India Ltd.
Background Rolta India Ltd., promoted by Mr. Kamal K.Singh was incorporated in the year 1989 at Mumbai. After attaining the Certificate of Commencement of business in the same year, the company made its Initial Public Offering (IPO) in 1990. Headquartered in Mumbai, Rolta provides IT-based Geospatial and Geographic Information (GIS) solutions & services, Engineering & Design Automation (EDA) and Enterprise Information & Communication Technology (EICT) services to customers across the world. The company has grown significantly over the years and at present operates through a network of 15 branch and regional offices across India. Besides, the company also has ten subsidiaries located in the USA, Canada, UK, Netherlands, Germany, Saudi Arabia, United Arab Emirates and Australia. It also established a 50: 50 Joint Venture company named Stone & Webster Rolta Limited with Shaw, Stone & Webster Inc. USA and a 51:49 Joint Venture Company called Rolta Thales Limited with Thales Group of France. These joint ventures not only bought in new clients for the company but also newer technologies which has benefitted the it to a very large extent and has the potential to be of even greater benefits in the future. The company has been consistently producing exceedingly good results over the years. Both its net profit and sales have grown at a CAGR of more than 35 per cent over FY06-‘09. Rolta gets a majority of their income from domestic sources. This has provided a sort of safety cap to any downside risk to the company’s revenue. Moreover, the fact that the BFSI segment which took the maximum beating during the recession contributes as a whole less than 5 per cent of revenue puts the company in a better position to weather through the global slowdown. Q1 FY10 financial data Particulars (Rs. In cr) Total Sales Total Expenditure (Increase) / Decrease In Stocks Raw Material Cost Manufacturing Expenses Employee Cost PBIDT (Excl OI) Other Income Operating Profit Interest Exceptional Items PBDT Depreciation PBT Tax Profit After Tax Calculated EPS (Unit Currency) EBIDTA% PAT%
Q1FY10 350.5 225 1.9 52.6 40.5 129.9 125.5 9.9 135.4 8.3 0 127.1 62.1 64.9 9 55.9 3.5 38.6 15.9
Q1FY09 346.1 227.7 2.5 58.7 36.7 129.9 118.5 14.9 133.4 0 -61.4 72.1 37.9 34.23 10.5 23.7 1.5 20.8 6.9
YoY%chng. 1.3% -1.2% -19.2% -10.3% 10.3% 0.0% 5.9% -33.8% 1.5% 100.0% -100.0% 76.3% 64.0% 89.8% -14.1% 135.8%
Q4FY09 332.7 220.2 2.5 37.4 45.9 134.4 112.5 36.4 148.9 5.7 0 143.2 57.8 85.5 9.4 76 4.7 44.8 22.9
QoQ%chng. 5.3% 2.2% -19.8% 40.6% -12.0% -3.3% 11.6% -72.8% -9.1% 46.5% 0.0% -11.3% 7.5% -24.0% -4.0% -26.4%
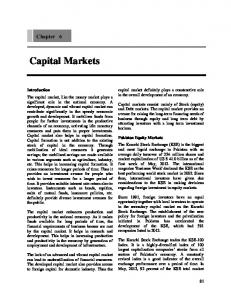
PE Band
ARIHANT capital markets ltd
2
Stock Outlook
Rolta India Ltd.
Profit and Loss Statement Y/E June ( Rs. in cr )
(consolidated)
FY08A
FY09A
Y/E June (Rs. in cr)
FY10E
1072.2
1372.8
1538.5
YoY%
50.7
28.1
12.1
Other Inc.
16.9
69.1
80
Net Sales
Cash Flow Statement Extract
Net profit after tax & extra-ordinary item
FY08A
FY09A
FY10E
229.7
293.1
346.5
Depreciation
138.3
186.7
254
Other items
107.7
30.5
63
Increase/Decrease in working capital Cash generated from operations
-18 386.6
-115.1 395.2
-171.6 491.9
27.5
34.9
48
359.2 -345.3
360.2 -763.9
428.9 -350
16.8
9.1
10
Adjustment for:
1089.2
1441.9
1618.5
Interest Depreciation
320.1 256 0 138.3
548.7 196.8 12.6 186.7
560 225 15 254
Direct taxes paid Net cash provided by operating activities (Inc.)/ Dec. in Fixed assets
Other expenses
106.4
163.8
170
Total Expenditure
820.7
1108.6
1224
3.2 -363.9
10.5 104.1
42 0
PBT
268.4
333.3
394.5
Interest Received Other items Cash Inflow/ (outflow) from Investments
-689.1
-640.2
-298
Interest Paid Dividend Paid Issue of equity shares Other items Cash Inflow/ (outflow) from Financing Net Cash Inflow/ (outflow) Cash at beginning Net Cash carried forward
0 -47.3 6.34 -8.2
-11.8 -57.6 0.86 226.2
-12 -60 0 0
-49.2 -379.2 638.9 259.8
157.7 -122.2 259.8 137.6
-72 58.9 137.6 196.4
Total Income
Expenditures: Manpower costs Material cost
Tax
38.8
40.2
48
Tax rate%
14.5
12.1
12.2
PAT
229.7
293.1
346.5
YoY%
33.6
27.4
18.2
EPS
14.4
18.2
14.2
PAT %
21.2
20.4
21.5
Important Ratios
Balance Sheet Y/E June (Rs. in cr)
Dividend Received
FY08A
FY09A
FY10E
Y/E June
Sources of Funds: Equity Capital (FV-Rs.10) Reserves & Surplus Shareholder’s Equity Total Debt Deferred Tax Liability Minority Interest Total Liabilities
160.9 1024.7 1185.6 693.8 45.9 1.5 1926.8
161 1280.6 1441.6 996.7 47.9 0.8 2486.9
161 1543.9 1704.9 996.7 47.9 0.8 2750.3
Goodwill Gross Block Less: Acc. depreciation Net Block CWIP Investments Deferred Tax Asset Current Assets: Debtors Cash and equivalent Loans and Advances Other current assets Less: Current liabilities & Provisions Net current asset Total Assets
ARIHANT capital markets ltd
200 1058.3 409 649.3 172.9 281.6 6.3
301.4 1651.8 404.7 1247.1 279.3 35.4 7.2
300 1901.8 558.7 1343.1 202.3 35.4 8
501.8 259.8 94.5 21.6
595.1 137.6 116.9 13.6
700 196.4 110 13.6
282.5 616.7 1926.8
274.5 599.1 2486.9
188.5 861.6 2750.3
FY09A
FY10E
Performance Ratios Gross Profit %
36.3
33.8
36.0
Net Profit %
21.2
20.4
21.5
Sales per share (SPS)
66.6
85.3
95.6
Price/SPS
2.6
2
1.8
Dividend %
30
30
30
0.57
0.58
0.59
0.22
0.21
0.23
Net Sales / Assets
1.2
1.6
1.5
Assets / Equity
0.8
0.6
0.6
19.5
20.4
20.4
Diluted EPS
14.2
18.2
21.6
Cash EPS
22.9
29.9
37.3
P/E
11.9
9.4
7.9
2.7
2.2
1.8
17.4
9.1
10.9
EV/ Sales
4.3
2.2
2.8
ROCE%
13.9
13.4
14.3
Assets Turnover
Application of Funds:
FY08A
Du Pont Analysis PAT / Net Sales
ROE % Valuation Ratios
P/BV EV/ EBIDTA
3
Stock Outlook
Rolta India Ltd.
ARIHANT - Research Desk For more information contact:
[email protected] Tel: 022-42254830/32
Head Office
Registered Office
3rd Floor, Krishna Bhuvan, 67 Nehru Road, Vile Parle (East), Mumbai-400057. Tel: (91-22) 67664800/42254800 Fax: (91-22) 67664880
Arihant House E-5 Ratlam Kothi Indore-452003, (M.P.) Tel: (91-731) 2519610 Fax: (91-731) 2519817
Stock Rating Scale
BUY ACCUMULATE HOLD REDUCE
: : : :
Absolute Return >20% 12-20% 5-10%