Environ. Chem. 2016 doi:10.1071/EN15154_AC
©CSIRO 2016
Supplementary material
Arsenic adsorption onto aluminium-substituted goethite Ana E. Tufo,A María dos Santos AfonsoB and Elsa E. SileoB,C A
Laboratorio de Química Ambiental, 3iA–ECyT, Universidad de San Martín,
Martín de Irigoyen 3100, CP1650, Buenos Aires, Argentina. B
Instituto de Química Física de los Materiales, Medio Ambiente y Energía,
Departamento de Química Inorgánica, Analítica y Química Física, Facultad de Ciencias Exactas y Naturales, Universidad de Buenos Aires, Pabellón II, Ciudad Universitaria, C1428EHA, Buenos Aires, Argentina. C
Corresponding author. Email:
[email protected]
Page 1 of 6
Environ. Chem. 2016 doi:10.1071/EN15154_AC
©CSIRO 2016
1689.7
3428.8
Intensity (a.u.)
3416.3
1257.2
3150.8 794.4
3416.3
3150.8 793.6
3411.9 Surface OH
3500
899.8
3141.8 stretch
3000
2500
793.3
2000
1500
1000
893.9
891.3
500
cm–1
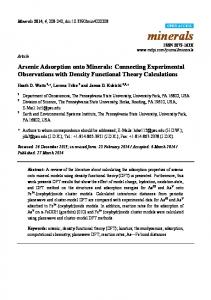
Fig. S1.
Attenuated total reflection Fourier-transform infrared (ATR-FTIR) interferograms of: GAl0 (blue
line); GAl3.78 (red dashed line); GAl7.61 (green dashed line); and ammonium oxalate (black dashed line).
Page 2 of 6
Environ. Chem. 2016 doi:10.1071/EN15154_AC
©CSIRO 2016
1.00 0.98
mass (mg)
0.96 0.94 0.92 0.90 0.88 0
100
200
300
400
500
Temperature (°C) Fig. S2. Thermogravimetric analysis of the samples: GAl0 (blue line); GAl3.78 (red dashed line); and GAl7.61 (green dashed line).
Table S1. Agreement factors for the Rietveld refinements Rp = 100Σ|Io – Ic|/ΣIo; wRp = 100[Σwi(Io – Ic)2/Σ(wiIo)2]0.5; RBragg = 100Σ|Iko – Ikc|/ΣIko; χ2 = Σwi(Io – Ic)2/(N – P). Io and Ic, observed and calculated intensities; wi, weight assigned to each step intensity; Iko and Ikc, observed and calculated intensities for Bragg k-reflection; N and P, number of data points in the pattern and number of parameters refined Sample χ2 wRp Rp RBragg
GAl0 1.51 8.38 6.88 3.11
GAl3.78 1.40 9.40 7.63 4.19
Page 3 of 6
GAl7.61 1.46 7.42 6.04 2.95
Environ. Chem. 2016 doi:10.1071/EN15154_AC
Fig. S3.
©CSIRO 2016
(a)
(b)
(c)
(d)
Scanning electron micrographs of the samples, magnification 400 000× for: (a) GAl0, average size
903 × 110 nm; (b) GAl3.78, average size 515 × 88 nm; (c) GAl7.61, average size 484 × 80 nm. Micrograph at 600 000× for (d) GAl3.78.
Page 4 of 6
©CSIRO 2016
Intensity (a.u.)
Environ. Chem. 2016 doi:10.1071/EN15154_AC
15
20
25
30
35
40
45
2 (°) Fig. S4.
X-ray diffraction patterns: GAl0 (blue line); GAl3.78 (red dashed line); GAl7.61 (green dashed line).
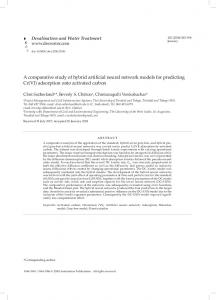
Fig. S5.
Scanning electron microscopy (SEM) and energy dispersive spectroscopy (EDS) analysis of diaspore.
Page 5 of 6
Environ. Chem. 2016 doi:10.1071/EN15154_AC
©CSIRO 2016
5000
Intensity (a. u.)
4000
3000
2000
1000
0 10
20
30
40
50
2
Fig. S6.
X-ray diffraction pattern of natural diaspore.
Page 6 of 6
60
70