California State UniVersity, Northridge, California 91330-8268. ReceiVed: September ... and are found to be in good agreement with the literature. The present ...
5398
J. Phys. Chem. B 2003, 107, 5398-5403
ARTICLES Estimate of the Ionization Degree of Ionic Micelles Based on Krafft Temperature Measurements Carolina Vautier-Giongo and Barney L. Bales* Department of Physics and Astronomy and The Center for Supramolecular Studies, California State UniVersity, Northridge, California 91330-8268 ReceiVed: September 28, 2002; In Final Form: April 22, 2003
The Krafft temperature, TK, of two classical ionic surfactants, sodium dodecyl sulfate (SDS) and cetyltrimethylammonium bromide (CTAB), were measured by conductivity, in the absence and in the presence of added salt, to test a recent suggestion (J. Phys. Chem. B 2002, 106, 9033) that TK measurements can be used to estimate the degree of counterion dissociation of ionic micelles, R. The method is based on the fact that TK of SDS and CTAB are functions of the concentration of counterions in the aqueous phase, Caq, whether the counterions are provided by the surfactant or both the surfactant and added salt. The values of R are estimated by requiring that the values of TK fall on a common curve when plotted against any function of Caq and are found to be in good agreement with the literature. The present results confirm that the Krafft temperature of ionic surfactants is one of the properties from which R can be derived for both anionic and cationic micelles. In the case of SDS, because the aggregation number, N, is known as a function of Caq, TK may be plotted versus N. The plot showed excellent linear correlation; however, it is not yet known if the linear behavior is theoretically significant.
Introduction A definition of the degree of counterion dissociation, R, based on the variation of any micellar property that is a function of the concentration of counterions in the aqueous phase, Caq, has been previously proposed.1 The validity of this definition1 was demonstrated for properties such as the aggregation number, N,2 and the micelle hydration as measured by EPR.1,2 A recent paper3 presented data consistent with the Krafft temperature being another such property that is a function of Caq for cesium dodecyl sulfate (CsDS) aqueous solutions. The concentration of counterions in the aqueous phase, Caq, according to the conventional pseudophase ion exchange mass balance relationship4-6 is given by
Caq ) F(Ct){RCt + (1 - R)Cf + Cad}
(1)
where Ct, Cf, and Cad are the molar concentrations of total surfactant, surfactant in monomer form, and added common counterion in the form of salt, respectively. The factor within the brackets would give the concentration of counterions in the aqueous phase if that phase occupied the entire sample; however, at higher surfactant concentrations, the excluded volume effect becomes important and can be corrected by including the factor F(Ct)6
F(Ct) )
1 1 - VCt
(2)
where V is the molar volume of the anhydrous surfactant in L * To whom correspondence should be addressed. E-mail: barney.bales@ csun.edu.
mol-1, assuming that the density of the surfactant is approximately 1.0 g mL-1.6 According to eq 1, any property dependent upon Caq may be varied by changing either surfactant or salt concentrations. Several combinations of Ct and Cad will lead to the same value of Caq; thus, any property that is a function of Caq will attain the same value for all of these combinations. Assuming that R is constant with Caq, it is possible to demonstrate that a property depends only on Caq by showing that it forms a common curve if plotted versus F(Ct){RCt + Cad}, as follows
F(Ct){RCt + Cad} ) constant
(3)
when either Ct or Cad are varied and an adequate value of R is employed, because the value of Cf in eq 1 is the same for a given value of Caq.1 The procedure of eq 3 is valid whether R is constant or if it varies as a function of N. There is experimental1,7 evidence that R remains nearly constant as Ct or Cad is varied, at least in the range of surfactant and added salt concentrations where the micellar growth is slow.7a Nevertheless, R can change considerably due to changes in the micellar shape.6,8 Thus, in this work, we deal with Ct and Cad in the range below the sphere-to-rod transition. Theoretically,9 R is also found to be approximately constant. In addition, R shows only a weak dependence with the temperature.10 Therefore, we proceed assuming that R is constant. An important consequence of the fact that a property is a function of Caq is that the property is independent of the concentration of micelles at a given value of Caq. For a detailed discussion of eqs 1 and 2, see ref 2 and the references therein. In our recent work, we suggested that the Krafft temperature measurements for ionic micelles might be used to estimate the
10.1021/jp0270957 CCC: $25.00 © 2003 American Chemical Society Published on Web 05/20/2003
Estimate of the Ionization Degree of Ionic Micelles
J. Phys. Chem. B, Vol. 107, No. 23, 2003 5399
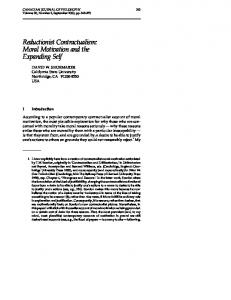
Figure 1. Conductance (G) versus temperature behavior of aqueous solutions of (b) SDS 400 mmol L-1 without NaCl and (O) CTAB 137 mmol L-1 without NaBr. The Krafft temperatures (TK), showed by the arrows, are the same as those corresponding to a complete clarification of the solutions.
degree of counterion dissociation of CsDS.3 The objective of the present work is, first, to show that the increase in Krafft temperature with the addition of the counterions for other surfactants, both anionic and cationic, is a function of Caq, as given by eq 1, and, second, to estimate the values of R for these surfactants. For this purpose, we used conductivity measurements to determine Krafft temperatures of aqueous solutions of two classical ionic surfactants that have accessible Krafft temperatures, the anionic sodium dodecyl sulfate (SDS) and the cationic cetyltrimethylammonium bromide (CTAB). Experimental Section Materials. Sodium dodecyl sulfate (SDS; Sigma) and cetyltrimethylammonium bromide (CTAB, Aldrich), as well as analytical reagent grade sodium chloride (Fisher) and sodium bromide (Alfa Aesar), were used without further purification. The electrical conductance of the distilled and deionized water (NANOpure) used was less than 1 µS at 25 °C. Krafft Temperature Measurements. To determine TK, clear aqueous solutions of surfactant, SDS or CTAB, in the absence or in the presence of salt of a common counterion (NaCl for SDS and NaBr for CTAB) were prepared and placed in a refrigerator at c.a. 5 °C for at least 24 h, where the precipitation of surfactant hydrated crystals occurred. The temperature of the precipitated system was raised gradually under constant stirring, and its conductance (G) was measured using an autobalance Wayne-Kerr conductivity bridge 6430A and a Radiometer Analytical conductivity cell. At each temperature, the conductance reading was checked every 2 min until it reach a steady value. The temperature was measured using a thermocouple (precision of ( 0.01 °C) immersed in the investigated system. The Krafft temperature was taken as the temperature where the conductance versus temperature plots showed an abrupt change in slope, as indicated by the arrows in the curves presented in Figure 1. Operationally, TK values were determined from plots of the second derivative of the data. This temperature was the same as that required to completely dissolve the hydrated solid surfactant, judged visually to be the point of complete clarification of the system. The reproducibility of TK measurements on a single sample (typically ( 0.05 °C) was superior to the reproducibility in samples presumably prepared identically (averages about ( 0.1 °C). It is important to distinguish between
Figure 2. Conductance (G) versus temperature behavior of aqueous solutions of (a) (O) [SDS] ) 100.28 mmol L-1 and [NaCl] ) 0 and (b) [SDS] ) 25.32 mmol L-1 and [NaCl] ) 20 mmol L-1; (b) (0) [CTAB] ) 68.81 mmol L-1 and [NaBr] ) 22 mmol L-1 and (9) [CTAB] ) 115.45 mmol L-1 and [NaBr] ) 12 mmol L-1. The two solutions of each surfactant have different values of St and Cad, but because F(Ct){RCt + Cad} is kept the same, they have approximately the same Krafft tempertaure. Pairs of samples were selected by assuming R ) 0.26 for SDS and R ) 0.23 for CTAB, the best fit values. See text.
our definition of TK and the Krafft point, TP, which is defined11,12 to be the temperature at which the solubility of the monomer becomes equal to the critical micelle concentration, cmc. Above the Krafft point, micelles begin to form provoking a rapid increase in the solubility of the surfactant as was first clearly described by Murray and Hartley in 1935.13 Results For SDS, TK was measured as a function of [SDS]t up to [SDS]t ) 600 mmol L-1 in the absence of added NaCl. In the presence of NaCl, the maximum [SDS]t used was 250 mmol L-1 and the maximum [NaCl] was 60 mmol L-1. Under these conditions, it was shown previously that R is constant for SDS.1 For CTAB, the measurements were performed using [CTAB]t up to [CTAB]t ) 192 in the absence of NaBr and, in the presence of this salt, the maximum [CTAB]t and [NaBr] used were 111 and 12 mmol L-1, respectively. For this work, the range of concentrations was limited in order to avoid a sphererod transition known to occur for CTAB micelles when [CTAB]t is above 200 mmol L-1 in absence of salt.14 In the presence of NaBr at 100 mmol L-1, the sphere-rod transition can occur at [CTAB]t lower than 60 mmol L-1. 15
5400 J. Phys. Chem. B, Vol. 107, No. 23, 2003
Vautier-Giongo and Bales
TABLE 1: Krafft Temperatures of SDS [SDS]/ [NaCl]/ sample mol L-1 mol L-1 F(Ct)a F(Ct){R[SDS]t+[NaCl]}b 1 2 3 4 5 6 7 8 9 10 11 12 13 14 15c 16c 17c 18c 19c 20c 21c 22c 23c
0.025 0.025 0.025 0.025 0.050 0.050 0.085 0.100 0.101 0.120 0.200 0.250 0.400 0.600 0.0917 0.0471 0.0238 0.0100 0.0653 0.0300 0.0429 0.0329 0.0376
0 0.004 0.02 0.01 0 0.028 0 0 0.040 0 0 0.060 0 0 0 0 0 0 0.005 0.005 0.01 0.025 0.05
1.01 1.01 1.01 1.01 1.01 1.01 1.03 1.03 1.03 1.04 1.06 1.08 1.13 1.21 1.03 1.01 1.01 1.00 1.02 1.01 1.01 1.01 1.01
0.007 0.011 0.027 0.017 0.013 0.042 0.023 0.027 0.068 0.032 0.055 0.135 0.118 0.189 0.094 0.048 0.024 0.010 0.072 0.035 0.054 0.058 0.089
TK/ °C 14.36 14.90 16.25 15.45 15.04 17.25 15.84 16.23 18.31 16.55 17.75 19.82 19.42 20.67 15.87 15.03 14.21 13.38 15.87 15.03 15.87 16.71 18.10
a Eq 2, using V ) 0.288 L mol-1 for SDS. b R ) 0.26 (best fit value). From the data of Nakayama and Shinoda,16 where [SDS]t are the solubility values extracted from solubility versus temperature curves above the Krafft point (see Figure 2 of ref 16).
c
TABLE 2: Krafft Temperatures of CTAB sample 1 2 3 4 5 6 7 8 9
[CTAB]/ [NaBr]/ mol L-1 mol L-1 F(Ct)a F(Ct){R[CTAB]t+[NaBr]}b 0.027 0.027 0.069 0.069 0.069 0.111 0.163 0.137 0.192
0 0.005 0 0.007 0.022 0.012 0 0 0
1.01 1.01 1.03 1.03 1.03 1.04 1.06 1.05 1.07
0.006 0.011 0.015 0.023 0.038 0.038 0.038 0.032 0.045
TK/ °C 24.88 25.27 25.59 25.97 26.72 26.70 26.67 26.46 26.98
a Eq 2, using V ) 0.364 L mol-1 for CTAB. b R ) 0.23 (best fit value).
Representative conductance versus temperature curves for SDS and CTAB in the absence of added electrolyte are presented in Figure 1. Figure 2 shows such plots in the presence of added salt. The pairs of samples in parts a and b of Figure 2 were chosen such that they have the same value of F(Ct){RCt + Cad} employing the best values of R ) 0.26 and 0.23 for SDS and CTAB, respectively, as detailed below. It is clear from Figure 2 that different combinations of Ct and Cad giving the same value of F(Ct){RCt + Cad} yield the same value of TK. In the case of SDS, there is a 4-fold difference in the surfactant concentrations of the two samples (compare also samples 3 and 8 or 5 and 16 of Table 1 and samples 5, 6, and 7 of Table 2). The plots in Figures 1 and 2 show that at low temperatures G increases slowly because the solubilities of the ionic surfactants are quite limited. During a temperature transition region, G increases sharply with increasing temperature beginning at the Krafft point, TP, because there is an abrupt increase of the solubility of the hydrated surfactant due to micelle formation, until the Krafft temperature, as defined in previous section, is reached. Then, G increases gradually due to the increase in ionic mobility with increasing temperature. It is apparent from Figures 1 and 2 that TK may be measured with a high degree of precision using conductivity data, whereas the Krafft point, TP, is less well defined. Nevertheless, the value of TP may be discerned
Figure 3. Krafft temperature, TK, versus F(Ct){RCt + Cad} for SDS (a) R ) 1 and (b) best fit value of R ) 0.26. Open symbols (O) are for salt free samples and filled symbols (b), for NaCl-added. (/) From the solubility data of Nakayama and Shinoda.16
within an uncertainty of 1-2 °C. It is clear from Figure 2a that TP is larger in the presence of salt even though TK for the two samples is the same. This is expected. The Krafft point increases with increasing counterion concentration because the solubility of the surfactant is reduced at a faster rate than the cmc.12 The two samples in Figure 2a have the same value of Caq for temperatures above TK, but the salt-containing sample has a larger value of Caq below TK because of the incomplete dissolution of the surfactant. Tables 1 and 2 collect the Krafft temperatures for SDS and CTAB, together with the calculated values of F(Ct) (eq 2) and F(Ct){RCt + Cad}. The molar volumes used in eq 2 are V ) 0.288 L mol-1 for SDS and V ) 0.364 L mol-1 for CTAB. Table 1 also includes values of TK for SDS deduced from the solubility measurements of Nakayama and Shinoda.16 From Tables 1 and 2, we can see that TK increases with an increase of Ct for Cad ) 0. If St is fixed, TK increases with an increase of Cad (e.g., compare samples 1, 2, 3, and 4 of Table 1 and samples 3, 4, and 5 of Table 2). This behavior is in accordance with that observed by Nakayama and Shinoda16 and Mazer et al.17 for SDS in aqueous NaCl solutions and by La Mesa et al.18 for CTAB in aqueous NaBr solutions. Figures 3 and 4 show plots of TK as a function of F(Ct){RCt + Cad} for SDS and CTAB, respectively, using the data extracted from Tables 1 and 2. In Figures 3a and 4a, the value
Estimate of the Ionization Degree of Ionic Micelles
Figure 4. Krafft temperature, TK, versus F(Ct){RCt + Cad} for CTAB (a) R ) 1 and (b) best fit value of R ) 0.23. Open symbols (O) are for salt free samples and filled symbols (b), for NaBr added.
of R is fixed at unity. Following the procedure outlined schematically in Figure 2 of ref 2, the value of R was varied by trial and error until a common curve was achieved for each surfactant. The best common curves were judged by plotting the mean squared deviation (χ2) of the data from a quadratic trial function versus R, as shown for SDS and CTAB in Figure 5. For SDS, the plot in Figure 5a has a minimum at R ) 0.26 with an estimate error of (0.02. For CTAB (Figure 4b), the minimum for R was 0.23 ( 0.03. Uncertainties in values of R based on eq 3 were recently discussed in detail in the Appendix to ref 2. Figures 3b and 4b show the common curves using these values of R. Figure 3 also includes TK values estimated from the solubility data of Nakayama and Shinoda16 for SDSNaCl mixtures, which fall on the same common curve with our TK measurements, being in excellent agreement with our results. It is clear that using a constant value of R to find the common curves in Figures 3b and 4b leads to a value of R that is averaged over the two respective temperature ranges. Alpha values are known2,10 to vary slightly with temperature, often showing a broad, shallow minimum near room temperature. A small variation of R with temperature could be treated using a Taylor expansion over the entire range, or by experimentally studying a “constant Caq” series, i.e., a series of samples prepared to yield the same value of Caq. The original hypothesis leading to the definition of R asserted that equal values of N resulted from equal values of Caq.1 Nevertheless, no knowledge of N itself is needed1 to find the value of R either by matching pairs of samples with the same
J. Phys. Chem. B, Vol. 107, No. 23, 2003 5401
Figure 5. Mean square deviations, χ2, of the values of TK from a quadratic trial function for (a) SDS and (b) CTAB as a function of the degree of dissociation, R.
Figure 6. Krafft temperature, TK, versus aggregation number, N ) k2(Caq)γ, for SDS. R ) 0.26; γ ) 0.25, and k2 ) 164.19 Open symbols (O) are for salt free samples and filled symbols (b) are for NaCl added.
value of Caq1 or by searching for common curves1 such as those in Figures 3b and 4b. If, in fact, values of N are available, as is the case with SDS,19 then any property that is a function of Caq may also be plotted as a function of N. Such a plot is given for values of TK in Figure 6. The abscissa in Figure 6 was computed using the consensus values of N for 25 °C. Values of N for
5402 J. Phys. Chem. B, Vol. 107, No. 23, 2003 SDS are known20-22 to vary with the temperature. Averaging the results from two TRFQ studies20,21 and a SANS study,22 the aggregation number decreases by 0.5 ( 0.3 molecules per degree. Because, over the temperature range of Figure 6, 17.5 ( 3 °C, N is predicted to vary by only 1.5 molecules, corrections have not been made to the plot. The data conform to a straight line; however, because the range of N is restricted, it is not yet clear if there is any theoretical significance in the linear behavior. Discussion An ionic surfactant dissolves in water up to the saturation concentration above which a hydrated solid surfactant phase separates.11 At temperatures below the Krafft point, the solubility is limited because of the nature of the surfactant having a long alkyl chain. At the Krafft point, micelles begin to be formed.12 The Krafft point is often defined as the temperature at which the solubility versus temperature curve intersects the cmc versus temperature curve.11 The history of the progress of the conceptual understanding of the Krafft point beginning with the initial work published in 1895 until 1988 is summarized in the paper by Moroi and Matuura.12 See also the important paper by Murray and Hartley.13 The interesting temperature region between the Krafft point and the Krafft temperature, i.e., for temperatures T in the range TP < T < TK, has been a matter of debate and has led Moroi23,12 to propose the term “micelle temperature range”. Another term, “the critical micelle temperature”, was introduced by Mazer et al.17 It seems to us that conductivity would be an excellent method to cast light on the debate in this intermediate temperature range, but that is beyond the scope of the present work. Turning to the point at which T ) TK, the total solubility of the surfactant becomes equal to Ct. Thus, solubility data taken at any temperature T > TP may be used to evaluate TK as a function of Caq. At this temperature, Caq may be computed from eq 1 by substituting the total solubility for Ct. Thus, Nakayama and Shinoda’s measurements16 of the solubility of SDS at various values of Cad afford another opportunity to test our hypothesis. Taking values of the total solubility of the surfactant at temperatures T > TP for given values of Cad from Figure 2 of ref 16 and computing Caq from eq 1 yields the data in Table 1 which are plotted as asterisks in Figure 3. Equation 3, as implemented for constant R, appears to work well to describe the behavior of TK of both SDS and CTAB as a function of the surfactant and/or added salt concentration, i.e., all values of TK fall on a common curve when plotted versus F(Ct){RCt + Cad} if the correct value of R is employed. The value of R ) 0.26 ( 0.02 found by TK measurements for SDS are in good agreement with literature values based on EPR measurements (R ) 0.272 ( 0.017, also derived by using eq 3),1 conductivity using the Evans’ method (R ) 0.256),24 activity measurements (R ) 0.27),25 micelle electrophoretic mobility (0.29 ( 0.01),26 and radio isotope Na+ mobility measurements (R ) 0.27).27 In the case of CTAB, the obtained value of R ) 0.23 ( 0.03 can be compared to values determined by micelle electrophoretic mobility (R ) 0.24),28 by conductivity using the Evans’ method (R ) 0.22),28 by measurements of the rate of deprotonation of benzimidazole in CTAB-NaBr mixtures (R ) 0.25),29 and by dynamic light scattering (R ) 0.22).30 The fact that two samples having the same value of Caq yield the same value of TK suggests that intermicellar interactions do not affect the precipitation of the hydrated surfactant. Because at T ) TK these two samples produce micelles having the same value of N, the energetics of transferring a surfactant molecule from the hydrated solid to a micelle depends on the aggregation
Vautier-Giongo and Bales number, not on the concentration of micelles. It is clear that the energetics of both the hydrated solid as well as the micelle are important in determining the value of TK. The relationship between TK and Caq, found for both systems SDS-NaCl and CTAB-NaBr, is interesting because it offers a way to predict TK from different combinations of salt and surfactant and could help in the planning of experiments that must be performed above the Krafft temperature. The same kind of relationship can also be found for the aggregation number, N, or any other micellar property that is a function of Caq. The new method to estimate R can be applied to all ionic detergents with experimentally accessible Krafft temperatures. Conclusions The Krafft temperatures of SDS and CTAB were shown to be functions of the concentration of counterions in the aqueous phase whethever the counterions are provided by the surfactant or both the surfactant and added salt. The estimated values of R for SDS and CTAB are in good agreement with literature values. Thus, the present results confirm that the Krafft temperature of ionic surfactants is another of the properties through which R can be defined and derived. Acknowledgment. This work was supported by the NIH/ MBRS S06 GM48680-03, the CSUN Research and Grants Committee, the College of Science and Mathematics, and the CNRS. References and Notes (1) Bales, B. L. J. Phys. Chem. B 2001, 105, 6798. (2) Bales, B. L.; Zana, R. J. Phys. Chem. B 2002, 106, 1926. (3) Bales, B. L.; Benrraou, M.; Zana, R. J. Phys. Chem. B 2002, 106, 9033. (4) Chaimovich, H.; Aleixo, F. M. V.; Cuccovia, I. M.; Zanette, D.; Quina, F. H. In Solution BehaVior of Surfactants; Mittal, K. L., Fendler, E. J., Eds.; Plenum Press: New York, 1982; Vol. 2, p 949. (5) Bunton, C. A.; Nome, F.; Quina, F. H.; Romsted, L. S. Acc. Chem. Res. 1991, 24, 357. (6) Soldi, V.; Keiper, J.; Romsted, L. S.; Cuccovia, I. M.; Chaimovich, H. Langmuir 2000, 16, 59. (7) (a) Romsted, L. S. Rate Enhancements in Micellar Systems. Ph.D. Thesis, Indiana University, Bloomington, IN, 1975. (b) Sasaki, T.; Hattori, M.; Sasaki, J.; Nukina, K. Bull. Chem. Soc. Jpn. 1975, 48, 1397. (c) Stilbs, P.; Jermer, J.; Lindman, B. J. Colloid Interface Sci. 1977, 60, 232. (8) (a) Aswal, V. K.; Goyal, P. S. Chem. Phys. Lett. 2002, 357, 491. (b) Beunen, J. A.; Ruckenstein, E. J. Colloid Interface Sci. 1983, 96, 469. (9) (a) Stigter, D. Prog. Colloid Polym. Sci. 1978, 65, 45. (b) Gunnarsson, G.; Gustavsson, H. J. Chem. Soc., Faraday Trans. 1 1982, 78, 2901. (c) Linse, P.; Gunnarsson, G.; Jonsson, B. J. Phys. Chem. 1982, 86, 413. (d) Evans, D. F.; Mitchell, D. J.; Ninham, B. W. J. Phys. Chem. 1984, 88, 6344. (c) Jo¨nsson, B.; Lindman, B.; Holmberg, K.; Kronberg, B. Surfactants and Polymers in Aqueous Solution; John Wiley: Chichester, U.K., 1998. (f) Hayter, J. B. Langmuir 1992, 8, 2873. (g) Maeda, H. J. Colloid Interface Sci. 2001, 241, 519. (10) Barry, B. W.; Wilson, R. Colloid Polym. Sci. 1978, 256, 251. (11) (a) Shinoda, K. In Colloidal Surfactants; Academic Press: New York, 1963; Chapter I, pp 6-8. (b) Shinoda, K.; Becher, P. Priciples of Solution and Solubility; Marcel Dekker: New York, 1978; pp 159-162. (12) Moroi, Y.; Matuura, R. Bull. Chem. Soc. Jpn. 1988, 61, 333. (13) Murray, R. C.; Hartley, G. S. Trans. Faraday Soc. 1935, 31, 183. (14) (a) Reiss-Husson, F.; Luzzati, V. J. Phys. Chem. 1964, 68, 3504. (b) Ekwall, P.; Mandel, L.; Solyom, P. J. Colloid Interface Sci. 1971, 35, 519. (15) Gamboa, C.; Sepulveda, L. J. Colloid Interface Sci. 1986, 113, 566. (16) Nakayama, H.; Shinoda, K. Bull. Chem. Soc. Jpn. 1967, 40, 1797. (17) Mazer, N. A.; Benedek, G. B.; Carey, M. C. J. Phys. Chem. 1976, 80, 1075. (18) La Mesa, C.; Ranieri, G. A.; Terenzi, M. Thermochim. Acta 1988, 137, 143. (19) Quina, F. H.; Nassar, P. M.; Bonilha, J. B. S.; Bales, B. L. J. Phys. Chem. 1995, 99, 17028.
Estimate of the Ionization Degree of Ionic Micelles (20) Coonen, Y.; Gelade´, E.; Van der Auweraer, M.; Vandendriessche, H.; De Schryver, F. C. J. Phys. Chem. 1983, 87, 1426. (21) Malliaris, A.; Le Moigne, J.; Sturm, J.; Zana, R. J. Phys. Chem. 1985, 89, 2709. (22) Bezzobotnov, V. Y.; Borbe´ly, S.; Cser, L.; Farago´, B.; Gladkih, I. A.; Ostanevich, Y. M. J. Phys. Chem. 1988, 92, 5738. (23) Moroi, Y.; Sugii, R.; Akine, C.; Matuura, R. J. Colloid Interface Sci. 1985, 108, 180. (24) Evans, H. C. J. Chem. Soc. 1956, 579.
J. Phys. Chem. B, Vol. 107, No. 23, 2003 5403 (25) Sasaki, T.; Hattori, M.; Sasaki, J.; Nukina, K. Bull. Chem. Soc. Jpn. 1975, 48, 1397. (26) Stigter, D.; Mysels, K. J. J. Phys. Chem. 1955, 59, 45. (27) Mysels, K. J.; Dulin, C. I. J. Colloid Sci. 1955, 10, 461. (28) Sepulveda, L.; Cortes, J. J. Phys. Chem. 1985, 89, 5322. (29) Bunton, C. A.; Romsted, L. S.; Sepulveda, L. J. Phys. Chem. 1980, 84, 2611. (30) Dorshow, R.; Briggs, J.; Bunton, C. A.; Nicoli, D. F. J. Phys. Chem. 1982, 86, 2388.