INTERNATIONAL JOURNAL OF CONTROL, AUTOMATION AND SYSTEMS VOL.2 NO.2 July 2013 ISSN 2165-8277 (Print) ISSN2165-8285 (Online) http://www.researchpub.org/journal/jac/jac.html
Artificial Neural Network Model for Evaluation of the Ploughing Process Performance B. Saleh1, and Ayman A. Aly2
FM f h i j k L1 L2 L3 m n v w x z
Abstract—A multiple-layer artificial neural network (ANN) model is applied for evaluating the performance of the simple multi-flat plate ploughing tines using the error back propagation learning algorithm. The present preliminary study is necessary to get some technical and design information helping in simulation of the conventionally curved tines such as moldboard plows. Evaluation of the ploughing performance has been in terms of ploughing forces and degree of soil breakup. Unlike regression-based models, ANN provides an efficient alternative to map complex nonlinear relationships between an input and output datasets without requiring a detailed knowledge of underlying physical relationships. The hidden and output layers of the model have sigmoid transfer functions. The experimental results of a previous study are used to construct the ANN model. The model was trained and tested with different ploughing tine parameters (geometry, speed, lift angle, orientation, and ploughing depth) and soil conditions (moisture content, density, and soil strength) as input parameters and the measured ploughing performance as output parameter. The ANN model results showed a good agreement with the corresponding experimental data where the relative error is found in the order of ±2%. Also the proposed model is tested over the studied range in a predictive mode and it is found to be a reliable tool to estimate the ploughing performance.
fineness modulus activation function ploughing depth, cm index representing input layers index representing hidden layers index representing output layers length of first segment of the tine, cm length of second segment of tine, cm length of third segment of tine, cm moisture content, % number of input neurons tine velocity, m/s percent of mass retained in sieve, % output neurons hidden neurons
Greek symbols weight of connection β
ρ τ
i
tine rotation angle, deg. soil density, g/cm3 bias for neuron lift angle with horizontal of the first, second and third segments of the tine, i = 1, 2 and 3
I. INTRODUCTION Ploughing is the mechanical manipulation of the soil to promote its physical condition towards good plant growth. Soil ploughing is considered one of the biggest hard farm processes. Several ploughing implements are applied to prepare seedbed. However, selection of the appropriate implements depends on soil type and conditions, type of crop, soil pretreatments, crop residues and weed type. It is estimated that ploughing accounts for about one half of the energy used in crop production [1]. Therefore, ploughing forces and power requirements are important in order to determine the size of the tractor that could be used for a specific implement. Also final soil conditions are important for plant growth. Ploughing performance is normally measured in terms of ploughing forces and final soil conditions [2]. The forces on the ploughing tine moving into the soil can be resolved into three (x, y, z) components
Index Terms— artificial neural network, ploughing tines, ploughing performance. Nomenclature Latin symbols b tine width, cm CI cone index, N/cm2 Fx draft force, N Fy vertical force, N Fz side force, N 1,2
Mechanical Eng. Dept., Faculty of Engineering, Assiut University, 71516, Assiut, Egypt, Emile:
[email protected],
[email protected] 2 Current address: Mechanical Eng. Dept., Faculty of Engineering, Taif University, 888,Taif , Saudi Arabia.
1
INTERNATIONAL JOURNAL OF CONTROL, AUTOMATION AND SYSTEMS VOL.2 NO.2 July 2013 ISSN 2165-8277 (Print) ISSN2165-8285 (Online) http://www.researchpub.org/journal/jac/jac.html
namely, draft or horizontal force (Fx), vertical force (Fy), and side force (Fz). The tine should technically accomplish the necessary soil manipulation with a minimum power input, and acceptable final soil conditions. In fact, detailed final soil conditions are difficult to be quantitatively described. However, some descriptive terms are of great concern for evaluating the performance of ploughing tines such as soil breakup, segregation, and mixing [2]. In this research [2]the degree of soil break up is used to represent the final soil conditions. The degree of soil breakup can be practically determined by sieving some soil samples representing the entire tilled depth. Sieving process provides a simple mean for measuring the range of clod size and the relative amount of soil in each size class. Grain size analysis is carried out using the standard Tyler screen [2] that can be expressed in terms of fineness modulus (FM). The FM is calculated from the following relation:
An experimental soil bin was designed and constructed by Manuwa and Ademosun [4] to study the influence of some soil parameters on draught force and soil disturbance of model tillage tools. The tools were tines in the groups of very narrow, narrow and wide tines. The authors used a mathematical model to relate the draught force with different soil parameters. Ploughing performance was measured and compared for different simple multi-flat plate ploughing tines and soil conditions by Saleh [2]. The relationships relating ploughing performance with the tine and soil parameters have been obtained using dimensional analysis based on data obtained from the experimental measurements. Four dependent variables are taken into account (Fx, Fy, Fz and FM). A mathematical model describing the ploughing forces and FM groups for the ranges of the independent tested groups was represented. Numerical simulations of soil-tool interactions using FEM and DEM mostly based on a solid mechanics approach were conducted. Due to limitations of constitutive relations, predictions of these numerical models have not been able to handle tillage dynamics with high shear rates. The application of computational fluid dynamics (CFD) modeling to soil-tool interaction for dynamic analysis of tillage was faced by many limitations [5]. ANN models become very popular recently to overcome some of the limitations of analytical and other numerical methods in physical and dynamical modeling. ANN models have been used successfully to model complex nonlinear input-output time-series relationships in a wide variety of fields including finance, medicine, physics, engineering, geology, and hydrology [6-10]. ANN models are capable of relating output to input variables for cases where no theoretical model works satisfactorily in a realistic time frame. An ANN is an information-processing paradigm inspired by the manner in which the heavily interconnected parallel structure of the human brain processes information. Training of ANN models, which can be based on experimental data and/or results from numerical models, typically implies adjustments of connection weights and biases so that the difference between ANN output and desired output is minimized [11-15]. Different tillage tool and soil parameters were used to develop an ANN model to predict draft force and energy required for tillage by Reza et al. [16]. Their model shows high accuracy in prediction and simulation. ANN model was used to predict the specific draft of four ploughing implements (chisel plow, an offset disk harrow, a moldboard plow, and a disk plow) from the field data by Al-Janobi et al. [17]. The model was trained and tested with different parameters of soil and tools. The proposed model indicated that there is a small variation between experimental and predicted draft force. The aim of the present study is to develop a model that can predict ploughing performance of simple multi-flat plate ploughing tines using ANN technique. The experimental results from [2] are used to construct and
Where, wi is the percent of mass retained in sieve number i, and fi is an integer factor with value from zero to 10 for pan and sieve numbers from 10 to 1 respectively. The FM range from ten for large soil clod particles to zero for small soil clod particles. Increasing the FM number means simply reduction of soil segregation. Studies of soil-tool interaction have been carried out mostly for development of force prediction. So far, five major methods have been used as approaches to solve the problems in the area of soil-tool interaction and failure mechanism [3]. These methodologies are namely: empirical and semi-empirical, dimensional analysis, finite element method (FEM), discrete element method (DEM), and ANN. Mathematical solutions based on empirical and semiempirical models have been developed to describe soil–tool interaction. These analytical models are based on the physics of soil and system parameters, tool configuration under assumed conditions. Experimental models are cost and time consuming. The relation between the variables is expressed by a suitable curve fits to the observed data to develop an appropriate model. Similitude or dimensional analysis techniques involve representing different parameters of a tillage system by PI terms and developing relations between dependent and independent variables. Effectiveness of a similitude model depends on the completeness of the list of independent. An instrumentation system was developed and mounted on a tractor to measure and record data for the various performance parameters of the tractor and attached tillage implements by Al-Suhaibani et al. [3]. Three chisel plows with different shanks, an offset disk harrow, a moldboard plow and a disk plow were used in the experiments. A general regression equation to predict the draft of the implements was developed.
2
INTERNATIONAL JOURNAL OF CONTROL, AUTOMATION AND SYSTEMS VOL.2 NO.2 July 2013 ISSN 2165-8277 (Print) ISSN2165-8285 (Online) http://www.researchpub.org/journal/jac/jac.html
validate the model. Eighteen tines with different shapes were used in the experiments to study the effect of tine parameters on ploughing performance. One of the reasons for using ANN technique is its powerful estimation and the other one is that there is no specific material relation between the dependent and independent variables.
generally a compromise between computation cost and performance, and the most popular is the back propagation algorithm [8]. The basic or original back propagation algorithm, used in this investigation, adjusts the weights in the steepest descent direction (negative of the gradient). The working procedure of the back propagation algorithm is explained in appendix-A. Most ANNs have three or more layers namely, an input layer, a hidden layer, and an output layer. The hidden and output layers have sigmoid transfer functions in neural networks model. The number of hidden layers and the number of nodes in each layer were adjusted by a trial and error approach to obtain the optimum network. The optimum solution can be estimated based on minimizing the difference between the neural networks and the desired outputs. The mean squared error (MSE) and linear correlation coefficient (r) were used for the determination of neural network performance. As the networks learn, its MSE value decreases, and the closer the value to zero the better the convergence.
II. MATHEMATICAL MODEL The mathematical model describing the ploughing performance obtained using dimensional analysis technique by Saleh [2] is difficult because of its complicated equations and large number of parameters. Also the accuracy of the obtained equations can vary greatly depending on the selected dimensionless groups. So the ANN technique will be used in this research to overcome the difficulties and drawbacks in the analysis based on dimensional analysis technique. III. THE ARTIFICIAL NEURAL NETWORK TECHNIQUE An ANN model of a physical system can be considered as a form of highly complex and nonlinear regression model of undefined structure. For instance, consider an ANN model with n input neurons (x1, …,xn), h hidden neurons (z1,…,zh), and m output neurons (y1, …, ym). Let i, j, and k be the indices representing input, hidden, and output layers, respectively. Let be the bias for neuron zj and be the bias for neuron yk. Let wij be the weight of the connection from neuron xi to neuron zj and be the weight of connection from neuron zj to yk. The functions that an ANN calculates is:
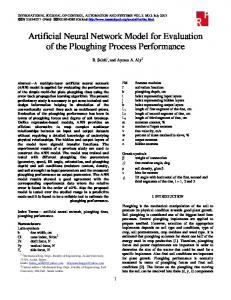
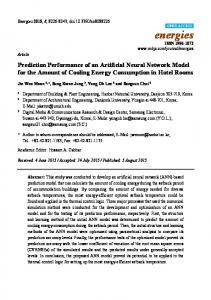
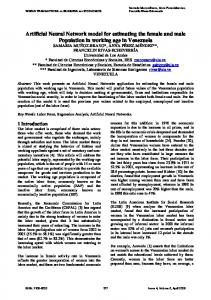
IV.THE ARTIFICIAL NEURAL NETWORK MODEL In the present study, four dependent parameters are chosen due to their importance for evaluating ploughing performance. These parameters are Fx, Fy, Fz and FM. The four parameters depend on the initial soil conditions, tine shape and manner of tine movement. The initial soil condition variables considered in the model are: the soil moisture content (m), cone index (CI) and soil density ( ). The tine shape variables are: tine width (b) and length and angle with respect to horizontal of the first, second, and third tine segments (L1, L2, L3, , , and ). The variables related to the manner of the tine movement are: tine speed (v), rotation of tine about the vertical axis ( ) measured from the ploughing main direction, and the ploughing depth (h). Consequently, thirteen independent variables are assumed in this analysis. These thirteen inputs are fed into the first layer of hidden layers. Each connection to a neuron has adjustable weighting factor associated with it. The output of the hidden units is distributed over the next layer of hidden units, until the last layer of hidden units, of which the outputs are fed into a layer of output units. The activation functions in hidden layer neurons are tan sigmoid functions and the piecewise linear activation function is used for the last layer neurons. The algorithm tries to minimize the objective function, i.e. the least square error between the predicted and the target outputs. Figure 1 shows the architecture of the ANN model used in this work. The input layer comprises the thirteen input variables connected to neurons in the hidden layer through the weights assigned for each link. The number of neurons in the hidden layer is found by optimizing the network. The range of values of the thirteen input variables used to develop the model are listed in Table 1.
wheregA and fA are activation functions, which are usually continuous, bounded, and non-decreasing functions. The usual choice is the logistic function for a variable s is defined as:
The training of an ANN model involves finding the optimal weight factor for the network. Several training techniques are available. The aim of network training is to determine a global solution to the weight matrix, which is typically a nonlinear optimization problem. Consequently, the theory of nonlinear optimization is applicable to the training of ANN. The suitability of a particular method is
3
INTERNATIONAL JOURNAL OF CONTROL, AUTOMATION AND SYSTEMS VOL.2 NO.2 July 2013 ISSN 2165-8277 (Print) ISSN2165-8285 (Online) http://www.researchpub.org/journal/jac/jac.html
x1: ploughing depth x2: tine width x3: length of first segment of the tine x4: length of second segment of the tine x5: length of third segment of the tine x6: lift angle of the first segment with horizontal x7: lift angle of the second segment with horizontal x8: lift angle of the third segment with horizontal x9: tine velocity x10: soil density x11: cone index x12: moisture content x13: tine rotation angle
y1: draft force y2: vertical force y3: side force y4: fineness
modulus
Input layer
Output layer
Hidden layer
Fig. 1 Schematic of the neural network model
Table 1 Range of input variables No
Input variables
horizontal, degree
Range of study Minimum
8
x8: angle of the third segment of the tine with horizontal, degree
20
75.5
x9: tine velocity, m/s
Maximum
1
x1: ploughing depth, cm
4
12
2
x2: tine width, cm
6
18
9
3
x3: length of the tine first segment, cm
2
18
x4: length of the tine second segment, cm
2
4
6
5
x5: length of the tine third segment, cm
2
6
6
x6: angle of the first segment of the tine with horizontal, degree
20
52.5
7
x7: angle of the second segment of the tine with
20
52.5
0.18
1.028
10
3
x10: soil density, g/cm
0.94
1.4
11
x11: cone index, N/cm2
11.2
40.2
12
x12: moisture content, %
8
12.5
13
x13:
0
40
tine
rotation
angle,
degree
V.RESULTS
AND DISCUSSION
Ploughing performance has been estimated using ANN model and compared with experimental measurements from [2]. A simple multi-flat plate ploughing tines were used in
4
INTERNATIONAL JOURNAL OF CONTROL, AUTOMATION AND SYSTEMS VOL.2 NO.2 July 2013 ISSN 2165-8277 (Print) ISSN2165-8285 (Online) http://www.researchpub.org/journal/jac/jac.html
the experiments. These tines are characterized by tine width, tine length and angle with respect to horizontal of the first, second, and third tine segments. The soil used in the experiments was sandy loam soil with 70.6% sand, 15.9% silt, and 13.5% clay. Three moisture contents (8%, 10%, and 12.5%) and three corresponding density values (950, 1120, and 1400 kg/m3) were utilized to study the effect of soil parameters on ploughing performance. These values were chosen to simulate the field conditions of the soil before actual ploughing operations which cover the range from a relatively dry soil to a highly moist soil. The optimal values of neural network parameters such as number of hidden layers and number of nodes in each hidden layer needed to be determined. The total number of experimental data was consisting of 167 sets. The data are divided into two groups. The first group consists of 102 sets and used as training data for the proposed model. The second group consists of the remaining 65 sets is used to test the model in the predictive mode. Several neural network models were trained with various designs including number of hidden layers and number of nodes in each hidden layer. The selection of the optimum model was based on minimizing the difference between the neural network results and the desired output. The developed model was validated by comparing the model output and the actual data obtained from the experiments. After the training process was preformed, the model was tested and the predicted ploughing performance from the model was compared with the experimental values and error analysis was performed. Table 2 shows the relative percentage error in training and validation of the output variables. The maximum error is 2.16% in the values of draft force. It can be concluded that the model provides acceptable values for all the output variables which is evidenced by good agreement between the outputs from the model and the corresponding experimental measurements.
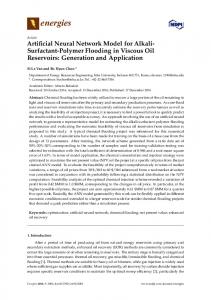
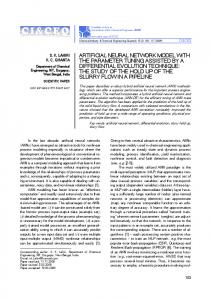
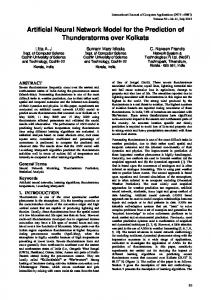
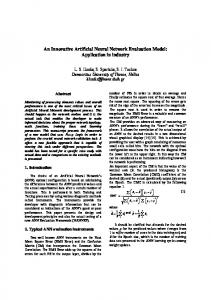
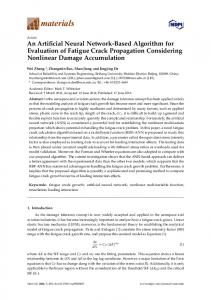
Figures 6-9 compare the trained values of ploughing forces and FM with the corresponding experimental values. Perfect correlation of the trained values with the measured values would be a 45 degree diagonal line. The figures indicated that the developed ANN model gave more accurate values than the predicted correlations (PI theorem), where the relative error is found in the order of ±2%. The figures show that the developed model agrees very well with the experimental data. 500 450
Draft force, N
350 300 250 200 150 100 50 0 0
10 20 30 40 50 60 70 80 90 100 110
Experiment number
Fig. 2 Comparison between trained data of the ANN model and experimental measurements for draft force
200
Trained Experimental
Vertical force, N
150
Table 2 the relative percentage error in training and validation for outputs variables output variables y1: draft force y2: vertical force y3: side force y4: fineness modulus
Trained Experimental
400
relative error, % 2.16 2.07 1.94 1.09
100
50
0 0
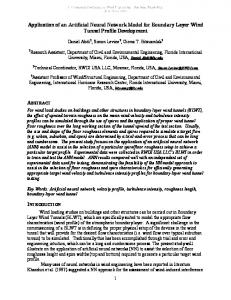
Figures 2-4 illustrate validation of the trained data from the ANN model against the experimental results for draft, vertical, and side forces over all the 102 experiments used in the construction of the model. Also, the model data of the degree of soil breakup measured by the FM is validated with the experimental data as shown in Fig. 5. Good agreement is shown between the trained data of the model for ploughing forces and FM and the experimental results.
10 20 30 40 50 60 70 80 90 100 110
Experiment number
Fig. 3 Comparison between trained data of the ANN model and experimental measurements for vertical force Figures 10 and 11 represent the results of the ANN model in the predictive mode (using the 65 sets of
5
INTERNATIONAL JOURNAL OF CONTROL, AUTOMATION AND SYSTEMS VOL.2 NO.2 July 2013 ISSN 2165-8277 (Print) ISSN2165-8285 (Online) http://www.researchpub.org/journal/jac/jac.html
experimental data) versus experimental measurements for draft and vertical forces. It is shown from the figures the good prediction of ANN model against the experimental data. The same accuracy is obtained in side force and FM. The accuracy of the model in predictive mode is found the same as that of the trained mode. The effects of some selected variables on ploughing performance are discussed in the following sections. In each case, one parameter is varied and the rest are kept constant. Further discussion of the effect of other parameters on ploughing performance can be done in a similar manner.
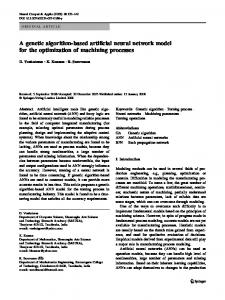
a. Effect of Ploughing Depth Substituting some selected test conditions (L1 = L2 = L3 = b = 6 cm, v = 1.03 m/s, = deg.,deg., = 1.4 g/cm3, and m = 12.5%) and change the ploughing depth in the ANN model to study the effect of ploughing depth on ploughing performance. The ploughing depth is varying from 4 to 12 cm and the results are plotted in Fig. 12. Since the tine rotation angle is zero, the side force tends to zero. It 500
100
Trained Experimental Trained draft force, N
Side force, N
80
400
60
40
300
200
100 20
0
0 0
5
10
15
20
0
25
100
200
300
400
500
Experimental draft force, N
Fig. 6 Trained data of the ANN model versus experimental measurements for draft force
Experiment number
Fig. 4 Comparison between trained data of the ANN model and experimental measurements for side force
225
9
Trained Experimental
175 Trained vertical force, N
Fineness modulus
8
7
6
5
125
75
25
25
4 0
75
125
175
225
Experimental vertical force, N
10 20 30 40 50 60 70 80 90 100 110
Fig. 7 Trained data of the ANN model versus experimental measurements for vertical force
Experiment number
Fig.5 Comparison between trained data of the ANN and experimental measurements for fineness modulus
6
INTERNATIONAL JOURNAL OF CONTROL, AUTOMATION AND SYSTEMS VOL.2 NO.2 July 2013 ISSN 2165-8277 (Print) ISSN2165-8285 (Online) http://www.researchpub.org/journal/jac/jac.html
can be concluded that that, increasing ploughing depthincreases both ploughing forces and FM, which simply means reduction of soil segregation. Also as seen from the figure, a threefold increase in ploughing depth results in an increase of both the draft and vertical forces by about three times where the relationship seems to be approximately linear, while the soil segregation decreases by about one forth only. The increase in draft force is attributed to increasing in soil cross sectional area. The specific draft is measurements for fineness modulus
seems to be almost constant (ranged from 4.25 to 4.44 N/cm2) for this case, which is comparable to specific draft fromreference [ASAE D230.3: specific draft for salty clay, sandy silt, sandy loam and sand soils are 7.67, 3.44, 2.98, and2.18 N/cm2 respectively at speed 1.03 m/s]. The vertical force reached a maximum value of about 250 N which is 30 500
400 Predective draft force, N
100
Trained side force, N
80
60
300
200
40
100
20
0 0
100
200
300
400
500
Experimental draft force, N
Fig. 10 Predictive data of the ANN model versus experimental measurements for draft force
0 0
20
40
60
80
100
Experimental side force, N 225
Fig. 8 Trained data of the ANN model versus experimental measurements for side force 9 Predective vertical force, N
175
Trained fineness modulus
8
7
125
75
6 25
5
25
75
125
175
225
Experimental vertical force, N
4 4
5
6
7
8
Fig. 11 Predictive data of the ANN model versus experimental measurements for vertical force
9
Experimental fineness modulus
Fig.9 Trained data of the ANN model versus experimental
7
INTERNATIONAL JOURNAL OF CONTROL, AUTOMATION AND SYSTEMS VOL.2 NO.2 July 2013 ISSN 2165-8277 (Print) ISSN2165-8285 (Online) http://www.researchpub.org/journal/jac/jac.html
times the weight of the soil above the tine. This is due to the vertical component of the high internal friction forces between stagnant soil and the soil slices cut by the time, the acceleration force, and the adhesion force between soil slice and the tine. However, it is difficult to evaluate the effect of each component individually. The trained data of the model showed a good agreement with the experimental measurements. 350
while the rest of the variables are kept constant at the test conditions (L1 = L2 = L3 = h = 6 cm, v = 1.03 m/s, = 20 deg., = 27.5 deg., = 34.5 deg., = 1.4 g/cm3, m = 12.5%, and CI = 32.59 N/cm2). It is common to indicate rise of draft and vertical forces values with tine width owing to increase the soil cross sectional area. Also, FM valuesincrease with tine width which simply means decrease of soil segregation. This meansless disturbance of soil occurs when using wider tines. As shown from the figure, the relationship between the ploughing forces and FM with the tine width seems to be almost linear.
9.5 Exp. draft force Exp. vertical force Exp. fineness modulud Trained
9
250
8.2 Exp. draft forec Exp. vertical force Exp. fineness modulus Trained
200 7.5 150 7 100
6.5
50
6 2
4
6
8
10
12
8
200
Ploughing forces, N
8
Fineness modulus
Ploughing forces, N
8.5 250
7.8 150 7.6 100 7.4 50
14
Fineness modulus
300
7.2
Ploughing depth, cm
Fig. 12 Effect of ploughing depth on ploughing performance
0
7 0
0.2
0.4
0.6
0.8
1
1.2
Tine velocity, m/s
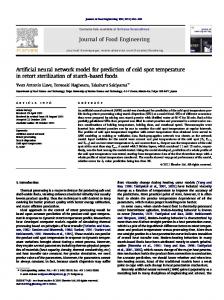
b. Effect of Ploughing Velocity
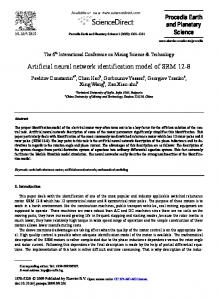
Fig. 13 Effect of tine velocity on ploughing performance 500
9.5 Exp. draft force Exp. vertical force Exp. fineness modulus Trained
450
Ploughing forces, N
400
9 8.5
350
8
300
7.5
250
7
200
6.5
150
6
100
c. Effect of Tine Width
Fineness moduls
The tine velocity is changed from 0.18 to 1.028 m/s in the ANN model to study its effect on the ploughing performance at some selected test conditions (L1 = L2 = L3 =6 cm, b = 10 cm, h = 4 cm, = 30 deg., = 37.5 deg., = 44.5 deg., = 0 deg., = 1.4 g/cm3, m = 12.5%, and CI = 21.17 N/cm2). Figure 13 shows the results at zero side force since the tine rotation angle is equal zero. From the figure it is indicated that, increasing ploughing velocity increases ploughing forces but shows an inverse trend on FM which means improvement of the soil pulverization. The results showed that as the ploughing velocity increases by about six times, the forces increased by about 3.4 and 3 folds for draft and vertical forces respectively, as well as soil pulverization is augmented by about 11%. The increase in ploughing forces results from the increase in soil pulverization. The high accuracy of the estimated trained data of the model for ploughing forces and FM is indicated by the well agreement with the experimental measurements.
5.5 4
6
8
10
12
14
16
18
20
Tine width, cm
Figure 14 depicts the effect of changing the tine width in the ANN model from 6 to 18 cm on ploughing performance
Fig. 14 Effect of tine width on ploughing performance
8
INTERNATIONAL JOURNAL OF CONTROL, AUTOMATION AND SYSTEMS VOL.2 NO.2 July 2013 ISSN 2165-8277 (Print) ISSN2165-8285 (Online) http://www.researchpub.org/journal/jac/jac.html
When changing the width by three times, the pertinent draft force, vertical force and FM increased by about 200, 125 and 50 % respectively. Good agreement between the trained data of the model and the experimental measurements was resulted.
predicting the ploughing performance of different simple multi-flat plate ploughing tines. In neural networks modeling applications, the number of hidden layers, the number of neurons in the hidden layer, and learning iterations are first optimized before using the neural networks. The neural network model is implemented and its feasibility is established. The proposed methodology results some desirable characteristics. The neural networks were trained and tested with different parameters for tines (geometry, speed, lift angle, orientation, and depth of ploughing) and soil (moisture content, density, and penetration resistance) as inputs and the measured ploughing performance (ploughing forces and degree of soil breakup) as output. The hidden and output layers have sigmoid transfer functions in neural network model. The ANN technique showed powerful estimation and good agreement with the corresponding experimental results, where the relative deviation is in the order of ±2% only. The current model supplied more accurate results than other predicted experimental correlations. It is also concluded that the proposed model can be successfully used for predicting the ploughing performance for wide range of tine and soil parameters and investigating the effect of these parameters on ploughing performance.
d. Effect of Tine Rotation Angle The results of studying the effect of varying the tine rotation angle from 0 to 40o on the ploughing forces are shown in Fig. 15 with fixation of the other parameters 125
Ploughing forces, N
100
75
50
Exp. draft force Exp. vertical force Exp. side force Trained
25
APPENDIX-A Back-propagation algorithm
0 0
5
10
15
20
25
30
35
40
45
Back-propagation learning is one of the most popular types of ANN learning methods. It has two operational phases. In first (i.e. forwarding) phase, input data from input layer is sent to the output layer. In the second (i.e. back-propagation) phase the error (between target and output) is calculate and the error is propagated backwardly to the input layer in order to change the weights of hidden layers by using the gradient descent method. Several studies [9, 12, 13] have found that a threelayered neural network with one hidden layer can approximate any nonlinear function to any desired accuracy. The network consists of input layer, hidden layer, and output layer. To explain the back-propagation rule in detail, a three layer network shown in Fig. 2 will be used. The training phase is divided as follows: forward-propagation phase: X = [x1, x2, x3, …, x13] is propagating from the input layer to the output layer Y = [y 1, y2, y3, y4].
Tine rotation angle, deg.
Fig. 15 Effect of tine rotation angle on ploughing forces
(L1 = L2 = L3 = b = 6 cm, h = 4 cm, v = 1.03 m/s, = 20 deg., = 27.5 deg., = 34.5 deg., = 1.4 g/cm3, m = 12.5%, and CI = 21.17 N/cm2) in the ANN model. The change in FM as a result of changing the tine rotation angle is very small (from 5.17 to 5.11) and can be considered constant and is not shown in Fig. 15. The figure shows that the side force increases in approximate by parabolic form with tine rotation angle. The increase is about 80 times as the tine rotation angle increases from 0 to 40 deg. . While both draft and vertical forces show a considerable decrease of about 15% and 19% respectively. The rate of increase in side force with the angle of rotation decreases with increasing the angle specially for angles larger than 20 degree. Good agreement between the trained data of the model and the experimental measurements was obtained.
Zq f
VI.CONCLUSION
m
v
qi
j 1
Xj ,
l Yi f wiq Z q q 1
In this study, a multilayer perception with error back propagation learning algorithm was used to construct a neural network model using the experimental data for
9
(A-1) m 13
(A-2)
INTERNATIONAL JOURNAL OF CONTROL, AUTOMATION AND SYSTEMS VOL.2 NO.2 July 2013 ISSN 2165-8277 (Print) ISSN2165-8285 (Online) http://www.researchpub.org/journal/jac/jac.html
Several forms of differentiable activation functions have been used with the most popular activation functions for back propagation networks is the sigmoid.
[5].
2. back-propagation phase: equation (A-3) shows the error between the output, Y, and the target, d:
E
1 2
[6].
n
(d y ) i
i
2
,
(A-3)
n4
i 1
[7].
By using the gradient-descent method, the weights in hidden-to-output connections are updated as follows: [8].
wiq
E Y E i Wiq Yi neti
neti Wiq
di yi f ' neti Z q oi Z q
[9].
[10].
(A-4) [11].
Following equations are the weight update on the inputto-hidden correction. Also chain rule and gradient-descent method are employed:
vqi
E E Vqi netq
[12].
netq hq xi Vqj (A-5)
[13].
[14].
oi di yi f ' (neti )
[15].
(A-6)
[16].
E Z q
hq
Zq netq
[17].
(A-7)
In Back-propagation learning rule, the two phases are iterated until the performance error decreased to certain range.
Engineering International: the CIGR Ejourna, Manuscript PM 06 016. Vol. IX. March, 2007. SubrataKarmakar, "Numerical modeling of soil flow and pressure distribution on a simple tillage tool using computational fluid dynamics", A Doctoral thesis, Department of Agricultural and Bioresource Engineering, Faculty of Graduate Studies and Research, University of Saskatchewan, 2005. Zangeneh, M., Omid, M., and Akram, A. "Assessment of machinery energy ratio in potato production by means of artificial neural network", African Journal of Agricultural Research, 5(10), pp. 993998, May 2010. MinyoungKima, and John E. Gilley, "Artificial neural network estimation of soil erosion and nutrient concentrations in runoff from land application areas", Computers and Electronics in Agriculture, 64, 268–275, 2008. Sudheer, K. P., PrasannaGowda, IndrajeetChaubey and Terry Howell, "Artificial neural network approach for mapping contrasting tillage practices", Remote Sens., 2, pp. 579-590, 2010. M. Youssef, Ayman A. Aly and E. Zeidan, "Computing the Pressure Drop of Nanofluid Turbulent Flows in a Pipe Using an Artificial Neural Network Model," Open Journal of Fluid Dynamics, Vol. 2 No. 4, pp. 130-136, 2012. Aly, A., Zeidan, E., and Hamed, A. "Performance evaluation of open solar regenerator using artificial neural network technique", International Engineering Conference on Hot Arid Regions (IECHAR) Al-Ahsa, KSA, March 1-2, 2010. Kumar, A., and DebRoy, T. "Neural network model of heat and fluid flow in gas metal arc fillet welding based on genetic algorithm and conjugate gradient optimisation", Science & Technology of Welding & Joining, vol. 11 (1), 106-119, 2006. Virk, G. S., and Al-Dmour, A. ''System simulation using neural networks'', Departmental Research Report no. 537, University of Bradford, January 1994. Ayman A. Aly, ''Flow rate control of variable displacement piston pump with pressure compensation using neural network'', Journal of Engineering Science, JES, Vol. 33, No. 1, pp 199-209, Feb. 2007. Farrell, J., and Baker, W. "Learning control systems", In: An Introduction to Intelligent and Autonomous Control, ed. P.J. Antsaklis and K.M. Passino, Kluwer Academic, pp. 237–262, 1992. Kung, S. Y. "Digital neural networks", Prentice Hall, Englewood Cliffs, 1993. Reza Alimardani, YousefAbbaspour-Gilandeh, Ahmad Khalilian, AlirezaKeyhani and SeyedHosseinSadati, "Prediction of draft force and energy of subsoiling operation using ANN model", Journal of Food, Agriculture & Environment Vol.7 (3&4), 537 – 542, 2009. Al-Janobi, A. A., Aboukarima, A. M., and Ahmed, K. A. "prediction of specific draft of different tillage implements using neural networks", Misr Journal of Agricultural Engineering Vol. 18, No. 3, 699-714, July 2001.
Author profile, B. Saleh is with Mechanical Engineering Department, Faculty of Engineering, Assiut University, Assiut, Egypt, from 2005 till now. Ph. D. researcher, Institute of Chemical and Energy Engineering, Department of Materials Sciences and Process Engineering, University of Natural Resources and Applied Life Sciences, Vienna, Austria, from 2000 till 2005. M. Sc. Degree, Mechanical Engineering Department, Assiut University, Assiut, Egypt, 1997. B. SC. Degree with,
REFERENCES [1].
[2].
[3].
[4].
Al-Suhaibani, S. A. and Ghaly, A. E. "Effect of plowing depth of tillage and forward speed on the performance of a medium size chisel plow operating in a sandy soil", American J. of Agricultural& Biological Sci., 5 (3), 247-255, 2010. Saleh, B. "Soil bin performance of simple multi-flat plate ploughing tines", Master thesis, Dep. of Mechanical Eng., Faculty of Engineering, Assiut university, 1997. Al-Suhaibani, S. A., Al-Janobi, A. A., and Al-Majhadi, Y. N. "Development and evaluation of tractors and tillage implements instrumentation system", American Journal of Engineering and Applied Sciences 3 (2), 363-371, 2010. Manuwa, S. I., and Ademosun, O. C. "Draught and soil disturbance of model tillage tines under varying soil parameters", Agricultural
11
INTERNATIONAL JOURNAL OF CONTROL, AUTOMATION AND SYSTEMS VOL.2 NO.2 July 2013 ISSN 2165-8277 (Print) ISSN2165-8285 (Online) http://www.researchpub.org/journal/jac/jac.html
Distinction with honor's, Mechanical Engineering Department, Assiut University, Assiut, Egypt, 1991. Major research interests are in Thermofluid, refrigeration and air condition, energy systems, cavitations erosion, and artificial intelligence. Ayman A. Aly is the head of Mechatronics Section at Taif University, Saudi Arabia since 2008. Prior to joining Taif University, He is also one of the team who established the “Mechatronics and Robotics Engineering” Educational Program in Assiut University in 2006. He was in the Managing and implementation team of the Project “Development of Mechatronics Courses for Undergraduate Program” DMCUP Project- HEEPF Grant A-085-10 Ministry of Higher Education – Egypt, 2004-2006. The international biographical center in Cambridge, England nominated and selected Ayman A. Aly as the International Educator of the year 2012.Also, Ayman A. Aly nominated and selected for inclusion in Marquis Who's Who in the World, 30th Pearl Anniversary Edition, 2013. In additions to 5 text books, Ayman A. Aly is the author of more than 75 scientific papers in Refereed Journals and International Conferences. He supervised some of MSc. and PhD. Degree Students. His main areas of research are Robust and Intelligent Control of Mechatronics systems, Automotive control systems, Thermofluid systems modeling and simulation.
11