Invited paper for Malaysia-Japan Seminar on Artificial Intelligence Applications in Industry, 24-25 June 2003, Kuala Lumpur.
Artificial Neural Network Modelling of Steady State Chemical Engineering Systems Khairiyah Mohd. Yusof 1, Ani Idris, Lim Jet Siong, Wong Hun Mun and Noor Azian Morad
Abstract-- This paper presents the development artificial neural network (ANN) models for three steady state chemical engineering systems, which are 1) a crude oil distillation column for use in real time optimisation, 2) physical properties of palm oil components, and 3) pore size determination for membrane characterization. Although studies on ANN applications in chemical engineering in the literature are more concentrated on utilising dynamic models, there has been an increasing trend for diverse application of ANN to model steady state systems. For the crude oil distillation column standard radial basis function (RBF) gave sufficiently accurate predictions. For the physical properties of palm oil components, a multi layer perceptron (MLP) network model was able to give a much better prediction of the density of trilaurin than a thermodynamic correlation that is based on group contribution method. For pore size determination of an asymmetric membrane, stacked network gave slightly better prediction than the more commonly used single MLP network. On the whole, this study shows that there is high potential for various applications of ANN models in chemical engineering.
I.
INTRODUCTION
Artificial neural networks (ANN) have been designed on the premises of mimicking the complexities of the brain functions in an effort to capture (or at least partially capture) the amazing learning capabilities of the brain. ANN is a sort of parallel computer/processor designed to imitate the way the brain accomplishes a certain task [Willis, et al, 1991]. The smallest processing element of ANN is a neuron (also called node), which performs simple calculations. Using the nodes collectively with massive connections among them results in a network that is able to process and store information for mapping the network inputs to its outputs. With this capability, there are widespread interests due to on-going and potential applications in solving complex problems particularly in the fields of pattern recognition (especially in speech and image processing), classification, control, forecasting, systems identification and optimisation. ANN had generated much interest in the chemical engineering community since the late eighties. While there have been numerous successful applications of neural networks in the chemical industry, [Zhao, et al., 1997;; The authors are with the Faculty of Chemical & Natural Resources Engineerng, University Teknologi Malaysia. 1 email:
[email protected]
Baratti, et al., 1995; Cheung, et al., 1992; Thibault and Gradjean, 1991], there are also those who claim neural networks to be nothing more than a class of nonlinear parameter estimation techniques. While the criticisms were sometimes well founded, there is a need to remember that drawbacks, extreme expectations and negative reactions are the norm in the exploration of an emerging field [Venkatasubramanian and McAvoy, 1992]. Hence, there is a need to find suitable roles that can best exploit the capabilities of neural networks in the chemical engineering field. Currently, research in chemical engineering on ANN are mostly in process fault diagnosis, dynamic process modelling and process control. Compared to the large number of literature found on dynamic modelling, there are fewer papers on steady-state ANN process models. Nevertheless, there has been lately an increasing trend for diverse application of ANN to model steady-state processes. Among them are: • Pollock and Eldridge [2000] and Whaley, et al. [1999] fitted ANN models to experimental data for prediction of height equivalent of a theoretical plate (HETP) and pressure drop for columns with structured packing. Compared to a traditional semi-empirical method, the ANN models were found to give more accurate predictions of experimentally determined HETP values. • Elkamel, et al. [1999] developed an ANN model for a hydrocracking unit in an oil refinery using plant data. The model was used for prediction of product flow and quality. • Mandlischer, et al. [1999] fitted ANN to experimental data to predict the enthalpy of vaporisation. The model was found to be just as accurate as two physical models, and was slightly more accurate at critical temperatures. • Sharma, et al. [1998], and Ganguly [2003] fitted ANN to vapour-liquid equilibrium (VLE) data. They found that ANN was able to model the VLE phase envelope better than existing equations-of -state, especially for highly polar mixtures. • Altissimi, et al. [1998] developed ANN models for a hydrocracker outlet gas separation unit, which consisted of four distillation columns in series, for use in RTO.
Invited paper for Malaysia-Japan Seminar on Artificial Intelligence Applications in Industry, 24-25 June 2003, Kuala Lumpur.
•
Sabharwal [1997] estimated contaminant composition in a xylene distillation column in a refinery in Japan using ANN models trained by both plant and simulated data, and then used in off-line process optimisation.
This paper presents brief descriptions on the development of steady-state ANN models for three chemical engineering applications. The ANN models were developed for: 1) a crude oil distillation column, 2) physical properties of palm oil components, and 3) pore size determination for membrane characterisation.
__________ __________ __________ __________ __________ __________ __________
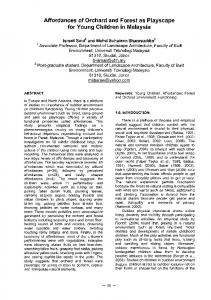
The ANN models developed are steady-state, multivariable models for the complete process. This is different than ANN models developed for process control or other offline applications, which are dynamic models used to predict one or two variables. RTO requires steady-state models that can yield all output variables required by the optimiser. For large, multivariable processes, there can be more than 100 input and output variables. In addition, since the application is on-line, the models must also have short computation times. Figure 5 shows a schematic diagram of the crude distillation column,. The column has four pumparounds (p/a), four side strippers and six product streams, which are the distillate, heavy naphtha, kerosene, diesel, atmospheric gas oil (AGO) and low sulphur waxy residue (LSWR) streams. In actual operation, the product draw-off flowrates are adjusted to ensure on-specification products and to achieve the targeted production rate. The feed flow rate is adjusted according to the production target. Feed going into the column consists of a mixture of two different feed streams: a condensate stream, of which the light components were first flashed off, and a sweet crude oil stream. The feed composition depends on the mixture of the oil being fed to the column.
_____
__________ __________ __________
_____
__________
STEAM
__________ __________
_____
__________
_____ _
__________
__________ __________
__________
STEAM
KEROSENE
HEAVY NAPHTHA
DIESEL
STEAM
FEED
_____ _
_____
__________
II. CRUDE OIL DISTILLATION COLUMN A. Background The ANN models developed for the industrial crude oil distillation column is for use in real-time optimisation (RTO). RTO, which is the continuous evaluation and adjustment of a process operating conditions to optimise the economic productivity subject to constraints, traditionally uses steady state first principles (FP) models. Developing FP models require in-depth knowledge of material, energy and momentum conservation, as well as thermodynamics and kinetics, of the processes. As a result, the model is complex and requires a high level of expertise to develop and maintain. Model development is also time-consuming and expensive. The crude tower is a practical candidate for RTO due to variations in operating conditions and its complex, multivariable nature.
DISTILLATE (Meduim Naphtha and above)
__________
_____ _____
STEAM
AGO
RESIDUE (LSWR)
Figure 5. Schematic diagram of the crude oil distillation column. B. Model Development The model for the crude tower is divided into the following sections: 1) top (T), 2) heavy naphtha stripper (HN), 3) kerosene stripper (K), 4) diesel stripper (D), 5) AGO stripper (AG), and 6) bottom (B). Only variables associated with the particular section are included in the network model. Product from the side draws must meet certain specifications. Operators obtain these specifications from the production planning section and adjust the tower operating conditions (ie. set points) to ensure on-spec products. The quality specifications are sampled and tested off-line once during each shift - twice a day - at 06:00 and 18:00, in the quality control laboratory. Therefore, the ability to predict these cold properties would be an added advantage. Table 1 lists the specifications and the corresponding products and manipulated variables. Since the results of the different sections are similar, only the results obtained on the top and heavy naphtha (HN) stripper are shown in this paper. To develop the ANN model, data were first generated for the purpose of training and testing. A reconciled steady state simulation of the crude tower was developed in a process simulation package, Aspen Plus, using the PETROFRAC model, a rigorous tray by tray equilibrium based distillation column model designed specifically for petroleum applications. The main column, side strippers, pumparounds and condenser were all modelled as part of
Invited paper for Malaysia-Japan Seminar on Artificial Intelligence Applications in Industry, 24-25 June 2003, Kuala Lumpur.
the column with PETROFRAC. The feed stream compositions were approximated with seven conventional components ranging from C2 to C5, and about 50 pseudocomponents. The Peng-Robinson equation of state, which is recommended for refinery applications [Aspen Technologies, 1995], was used to calculate all thermodynamic properties. Table 1. Product specifications and manipulated variables.
Heavy Naphtha Kerosene Diesel AGO LSWR Note:
Specifications/ Properties IBP FBP Flash Point / IBP Freeze Point / FBP Pour Point / Colour IBP FBP Pour Point / Colour IBP FBP Pour Point
Manipulated Variables Top temperature or Q HN draw HN draw SS Kerosene draw Diesel draw Kerosene draw Diesel draw AGO draw Diesel draw AGO draw AGO draw
IBP is initial boiling point FBP is final boiling point Q is reboiler duty SS is stripping steam rate
The sensitivity analysis feature in Aspen Plus was used to generate training and testing data for the crude tower. Input variables for the ANN models include the feed flow rates for the two feed streams, and the specified variables of a particular section for the tower operation. The output variables are the dependant variables that were needed by the optimiser and were calculated due to changes in the input variables. Ranges for the variables were within the operating region of the column. Within this region, the variables in each section of the column have negligible influence on other sections in the column, except the sections that are immediately above and below it. This allowed data to be generated one section at a time. For the top and heavy naphtha (HN) sections, the input variables are the feed flow-rates of the condensate and crude oil, heavy naphtha draw rate and kerosene draw rate. The output variables are the top temperature (TTOP), reflux ratio (RR), condensate duty (QCOND), top pump-around (PAT), HN pump-around (PAH), top and bottom temperatures of the HN stripper (TTOPH and TBOTH respectively), initial and final boiling points of HN product (IBPH and FBPH respectively), and HN density (RHOH). IBPH, FBPH and RHOH are cold properties used to gauge the quality of the heavy naphtha product. In this work, all ANN models were developed in MATLAB environment and utilizes MATLAB neural network toolbox. The type of ANN chosen was the radial basis
function networks (RBFN), a feed forward network that has a single hidden layer of nodes with Gaussian density function. MATLAB uses the orthogonal least squares (OLS) algorithm by Chen et al. [1991] to solve for the RBF centers and weights for the connections between the nodes in the hidden and output layers. To develop the RBFN models, other than specifying an error goal, the spread constant, σ, which determines the width of the receptive fields must also be specified. σ should be large enough for the receptive fields to overlap one another to amply cover the whole input range. Nevertheless, it should not be too large that there is no distinction between the output of different nodes in the same area of the input space. For the RBFN models, the OLS algorithm calculated the number of hidden nodes. Evaluations of the models are based on root mean squared (RMS) error from each model prediction. Error is defined as the difference between desired (or actual value provided by the testing data) output value and the predicted output value. Training time was also taken into consideration, mainly because of the convenience in developing models with short training times. Nevertheless, this is not as important as RMS error because once a connectionist model is trained, the execution of the model is very fast. The training time will only be a major concern when the model is periodically updated on-line. For all the models, the results presented in this paper are the best ones obtained after numerous trials of different training error tolerance and spread constant. The crude tower model was not developed as a single lumped system. Since changes within the operating range for a section in the crude distillation tower affects only the sections that are immediately above and below the section, this allows the crude tower model to be divided into sections where the variables that are related are grouped together, and thus make the model more manageable. C. Results and Discussions Several techniques may be used to predict all the output variables. One way would be to predict all the variables in the crude tower using a single RBFN model, which would result in a single, large model. On the other hand, the variables may also be predicted individually (ie. one at a time), which would result in many RBFN models, each with a single output. The variables may also be grouped either randomly or according to the respective sections. To determine if the grouping of output variables had a strong influence on the prediction, the variables in the first two sections at the top of the column were predicted individually and in different groups. The results are shown in Table 2, where the first 11 output variables (from Ttop to RhoH) were predicted individually. Table 2 lists the prediction error for the top section and the HN section of the column. From Table 2, it can be seen
Invited paper for Malaysia-Japan Seminar on Artificial Intelligence Applications in Industry, 24-25 June 2003, Kuala Lumpur.
that for almost all the variables, the RMS errors are smaller when the variables are grouped together in a suitable combination. For example, the RMS errors for variables at the top of the column, Ttop, Ovhd, RR, Qcond and PAT are 0.0048, 0.0029, 0.0046, 0.0033 and 0.0140 respectively when predicted individually, compared to 0.0014, 0.0015, 0.0025, 0.0017 and 0.0075 respectively when predicted together. This is also true with the variables in the HN section. Table 2: RMS errors of variables of top and HN sections of the crude tower. Overall RMS Outputs Ttop PAT RR Ovhd Qcond TtopH TbotH PAH IBPH FBPH RhoH IBPH, RR, Qcond Ttop,RR,Qcond Ttop, Ovhd, RR, Qcond, PAT TtopH, TbotH, PAH, IBPH, FBPH, RhoH
Error 0.0048 0.0140 0.0046 0.0029 0.0033 0.0039 0.0039 0.0099 0.0046 0.0046 0.0076 0.0134 0.0067 0.0146
Individual RMS Error
0.0051, 0.0042, 0.0041 0.0023, 0.0035, 0.0009 0.0014, 0.0015, 0.0025, 0.0017,0.0075 0.0021, 0.0028, 0.0121, 0.0029, 0.0019, 0.0074
The results also show that it is not advisable to combine unrelated variables. For example, comparing the two variable combinations that are highlighted in bold letters in Table 2, the combination with IBPH, which is in a different section than RR and Qcond, the RMS error for RR and Qcond are higher than when the variables were combined with Ttop. III.
PHYSICAL PROPERTIES OF PALM OIL COMPONENTS
A. Background Physical properties are essential in the design of chemical processes. The design of processes in the palm oil industry is of no exception. Since palm oil is very significant in the Malaysian economy, determination of its properties are important. Palm oil, like other vegetable oils, are made up of mostly glyceridic components with some non-glyceridic components in small or trace quantities. The chemical composition determines the chemical and physical characteristics of palm oil. Triglycerides, which are esters formed from glycerol and fatty acids, are the major component of the glyceridic
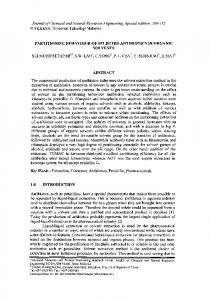
material in palm oil. The chain lengths of the fatty acids present in the triglycerides fall within a range from twelve to twenty carbons. Palm oil triglycerides consist of myristic acid, stearic acid, linoleic acid, palmitic acid and oleic acid. The design and optimisation of processes can only be achieved with the availability of physical properties. Examples of these physical properties are density, viscosity, specific heat and vapour pressure. These properties are not constants, but vary with temperature. The determination of physical properties of chemical components is found through experiments. However, it is expensive and impossible to perform experiments for all variations of the independent variable. The common practice is to fit these experimental data to suitable thermodynamic correlations. For palm oil, there is a lack physical properties data and inadequate correlation methods for proper prediction [Morad 1995], which is definitely a setback in the development of local technology. In this research, instead of using the traditional thermodynamic correlations, ANN models were developed to calculate the values of the physical properties of palm oil components. Models were developed for physical properties like density, specific heat and viscosity for several palm oil components. This section describes the development of an ANN model for predicting the density of trilaurin. B. Model Development Experimental data of trilaurin for training and testing the network model were obtained from Morad [1995]. There are a total of 14 data points (ranging from 60oC to 190oC), of which 8 were used for training and 6 for testing. These data were scaled between 0 to 1 to give better results. The ANN model chosen was the multi-layer perceptron (MLP) feed forward network that was trained using the Levenberg-Marquadt algorithm. The network model has one hidden layer with five nodes and sigmoid activation function. Similar to the crude tower models, the RMSE of the network prediction was calculated to find the best model. The density of trilaurin was also calculated using a group contribution method for calculating density, GCVOL [Morad 1995], for the purpose of comparison with the ANN model. C. Results and Discussion Table 3 gives the density prediction of the ANN model and the values calculated from the GCVOL correlation for the test data. The scaled test data are plotted in Figure 2. The RMSE calculated for the ANN model and the GCVOL correlation are 0.0081 and 0.2126 respectively.
Invited paper for Malaysia-Japan Seminar on Artificial Intelligence Applications in Industry, 24-25 June 2003, Kuala Lumpur.
Comparing the results obtained, the ANN model is better than the GCVOL method in representing the density of trilaurin. Because of good prediction, the values for the test data from the ANN model is very difficult to distinguish from the experimental values in the graph shown in Figure 2. From the results obtained, the ANN model was able to predict density very well, and therefore has potential for prediction of other properties for palm oil components. Table 3: Scaled and actual testing results for the density of trilaurin Tem
Experimental
p
Data
(°C) Scaled
GCVOL ANN Model
g/ml
Scaled
Correlation
g/ml
Scaled
g/ml
70
0.7180 0.87978 0.7093
0.878881
1
0.908696
90
0.6168 0.8694
0.6132
0.869034
0.8193
0.890166
110 0.4809 0.85546 0.4830
0.855675
0.636
0.871413
130 0.3126 0.83819 0.3055
0.837469
0.4524
0.852538
150 0.1680 0.82337 0.1574
0.822282
0.2679
0.833617
170 0.0021 0.80635
0.806132
0.0835
0.8147
0
SCALED DENSITY
1 0.9 0.8 0.6
Experimental Data
0.5
ANN Modelling
0.7
0.4 0.3
GCVOL Correlation
0.2 0.1 0 50
100
150
200
TEMPERATURE(°C)
Figure 2: Comparison of ANN model prediction and GCVOL correlation with experimental data used for testing.
IV.
MEMBRANE CHARACTERISATION
A. Background Various methods have been used to characterize the pore size and pore size distribution of hollow fiber membranes. The 3 general methods generally used are the i) microscopy observation method, ii) thermoporometry method and iii) permeation experiments. In cases of asymmetric hollow fiber membranes, due to the very small pore sizes, microfiltration characterization techniques such as
microscopy observation method cannot be used for asymmetric membranes [Mulder , 1981]. Generally, the last method is used, based on permeation and rejection performance using reference molecules and particles. In order to characterize the pore size and pore size distribution from permeation experiments, quantitative transport model and the so-called “pore model” or hydrodynamic model has been used. In recent years the surface force pore flow model has been developed to correctly characterize the pore size and pore size distribution [Ani et al, 2002 and Tam et. al.1993]. It contained the interfacial force parameters and friction force parameters and the effect of concentration polarization and operating conditions. However, the mathematical solutions involved in the determining the pore size and pore size distribution involved complex equations, with trial and error calculations that is complicated and tedious. Thus, in this study, artificial neural network (ANN) is applied as an alternative method to estimate the pore size of the asymmetric hollow fibre membranes. In reviewing literature on membrane characterization, so far there has not been any work found that uses ANN for modeling. A hindering factor is the small number of data points available for training from permeation experiments. In an effort to overcome the obstacle, in addition to the multi-layer perceptron network (MLP), stacked network is also investigated. This section describes an on-going project to develop an ANN model to predict the pore size asymmetric membrane. The results shown are from the initial work on this study. B. Stacked Neural Network Using a single basic neural network with few experiment data points, it is difficult to guarantee that a good predictive model will be obtained in the complete experimental domain [Lanouette et al, 1999]. To improve the accuracy of a model when only a limited number of experimental data points in the training data set is available, stacked neural network is recommended [Wolpert, 1992]. Stacked neural network is a concept where several different neural network models are combined in order to improve model performance. Since each neural network representation can behave differently in different regions of the input space, representational accuracy over the entire input-output space can be improved by combining several neural network models [Zhang et al, 1997]. A sample architecture for a stacked neural network is shown in Figure 1. Starting from the identical training data set, a large number of different neural network models can be obtained, using each time a different set of initial weights or using a different subset of the training data set. The outputs of these networks, called the level-0 models outputs, along with the original input data, are then used as inputs to other models, at a higher level in the stacking structure. The second level of model, called the level-1 model, is developed using the results of level-0 model.
Invited paper for Malaysia-Japan Seminar on Artificial Intelligence Applications in Industry, 24-25 June 2003, Kuala Lumpur.
A set of training data set is needed in order to develop the stacked neural network. Firstly, let us denote level-0 and level-1 data set as DL0 and DL1 respectively. For level-0, a few networks models have to be developed using data set DL0. Next, one experimental data point is removed from DL0. This subset is known as D1. By using the same method, more different subset of data Di can be obtained by removing different data points. Each of these subsets is then used as training data for the candidate ANN models that has been developed earlier. The output predicted by these models is combined with the actual output to develop level-1 models. In this study, we restricted our ANN models only to feedforward backpropagation function with one hidden layer. Two main methods have been used in this study to combine the individual neural network models; average output and stacked generalization. There exist numerous methods that can be used to average the output neural network models. A simple approach is to take equal weights for the individual networks [Zhang et al, 1997]. A second way is to obtain a weighted sum of each prediction, the weight corresponding to inverse of the contribution of each level to the sum of squares of the errors calculated which is known as weighted output [Lanouette et al, 1999]. The third way is to combine the models is by using principal component analysis (PCA). Wolpert [1992] has studied another method, stacked generalization, where models are combined. Basically, the main concept of this method is stacking different models and a single ANN model represents the final result. The training data set is divided into a few subsets. These subsets are used to develop ANN models for level-0 models. The outputs from level-0 models is denoted as yi and true output as y. yi and y are used as training data to train the new ANN model, which is known as level-1 model. The output from this model is the final output for the entire stacked network. C. Model Development Raw experimental data used to develop the ANN models are shown in Table 4. Single MLP network models were first investigated to predict the pore size with varying numbers of data points for training and testing. Since the number of data points is small, a stacked ANN model was developed to investigate if there can be further improvement on the model. Table 4 : Raw data Permeate Rate, 10
PR X 10 kg/hr 1 2 3 4 5 6
69.45 69.63 90.19 112.13 133.67 156.94
Solute Separation, f 0.978 0.965 0.885 0.857 0.827 0.679
For the stacked network, ten individual MLP neural network models have been developed to estimate pore size with different subset of training data and network architecture. These are the level-0 models. Data number 5 are used for the overall model testing. To create the 1st training subset for ANN 1, data number 1 is taken out and assigned as the testing datum for ANN1. ANN1 is trained until the weights and biases have been optimized to give an acceptable training error. ANN1 was then tested with the test data in the generalization phase. ANN2 to ANN10 were similarly formulated, except different training subsets and hidden nodes were used. D. Results and Discussion Table 5 gives the root mean square error (RMSE) for single network prediction. The MLP model used had 5 nodes in the hidden layer. As expected, as the number of training data increased from 3 to 5, the prediction error decreased. However, since the available number of experimental data is small, the RMSE is unsatisfactory. RMSE for stacked network with different methods of combination are shown in Table 6. This result shows that utilising an ANN as the level-1 model gave the best performance. Comparing the Tables 5 and 6, the stacked model gave a slight improvement over the single network models, except for the last combination technique. The results show that ANN has the potential to be used for membrane characterisation. Nevertheless, further work is needed to improve the model to yield better and more reliable predictions, especially with the typically small number of data points available from experimental data. Table 5: Single network prediction. Training Testing data data set set 2,4,6 1,3,5 1,2,4,6 3,5 1,2,3,4,6 5
RMSE 0.3208 0.2563 0.1469
Table 6: Stacked network prediction with different level-1 models. Method RMSE ANN 0.1111 Average 0.1314 Weighted average 0.3261
Membrane pore size, R X 1010m 6.9 8.2 12.7 13.2 13.7 18.2
V.
CONCLUSION
Research done on the three cases described revealed further potential for the use of ANN in chemical engineering. From the results obtained, the ANN models were found to give at least satisfactory, if not excellent predictions. Although there are undoubtedly problems and setbacks to
Invited paper for Malaysia-Japan Seminar on Artificial Intelligence Applications in Industry, 24-25 June 2003, Kuala Lumpur.
be overcome, they only serve as challenges and motivating factors that fuels further interest in the area. VI. REFERENCES Altissimi, R., Brambilla, A., Deidda, A., and Semino, D. "Optimal Operation of a Separation Plant using Artificial Neural Networks", Computers in Chemical Engineering, Vol. 22, S939-S942 (1998). Ani Idris, Ismail A. F.,. Shilton S. J, Roslina, R., Musa, M. “The Deduction of Fine Structural Details of Reverse Osmosis Hollow Fiber Membranes Using Pore Modelling”. Separation and Purification Tech. (29) 217- 227 (2002). Aspen Technology Inc., Cambridge, Massachusetts. SPEEDUP User Manual Volume 1, release 5.5, (March 1995). Baratti, R., Vacca, G., and Servida, A., “Neural Network Modelling of Distillation Columns”, Hydrocarbon Processing, pp 35-38 (June 1995). Bittanti, S., and Savaresi, S., “Hierarchically Structured Neural Networks: A Way to Shape a ‘Magma’ of Neurons”, Journal of Franklin Institute, Vol 335B, No. 5, pp 929-950 (1998). Chen, S., Cowan, C., and Grant, P., “Orthogonal Least Squares Learning Algorithm for Radial Basis Function Networks”, IEEE Transactions on Neural Networks, 2(2), pp. 302-309 (1991). Cheung, T., Kwapong, O., and Elsey, J., “Building Empirical Models of Process Plant Data by Regression or Neural Network”, Proceedings American Control Conference, Chicago, Illinois, pp 1922-1925 (1992).
Knowledge on Different Levels of Sophistication”, Chemical Engineering Technology, 17, pp 10-20 (1994). Tam, C. M., Matsuura, T. and Tweddle, T.A. “Polysulfone Membrane: iii Performance Evaluation of PES-PVP Membrane”, Sep. Science and Tech., 28 2621 – 2633 (1993). Thibault, J., and Grandjean, B., “Neural networks in Process Control – A Survey”, Proceedings IFAC Advanced Control of Chemical Processes, Toulouse, France, pp. 251-278, (1991). Thompson M. and Kramer, M., “Modeling Chemical Processes using Prior Knowledge and Neural Networks”, AICHE Journal, 40(8), pp. 1328-1340 (1994). Venkatasubramanian, V., and McAvoy, T., “Editorial – Neural Network Applications in Chemical Engineering”, Computers and Chemical Engineering, pp. v-vi (1992). Whaley, A., Bode, C., Ghosh, J., and Eldridge, R., "HETP and Pressure Drop Prediction for Structured Packing Distillation Columns using a Neural Network Model", Ind. Eng. Chem. Res., 38(4), pp. 1736-1739 (1999). Willis, M., Di Massimo, C., Montague, G., Tham, M., and Morris, A., “Artificial Neural Networks in Process Engineering”, IEE Proceedings-D, 138(3), pp. 256-266 (1991). Wilson, J., and Zorsetto, L., “A Generalized Approach to Process State Estimation using Hybrid Artificial Neural Network/Mechanistic Models”, Computers and Chemical Engineering, 21(9), pp. 951-963 (1997). Wolpert, D.H. “Stacked Generalization” Neural Networks Vol. 5, 241-259 (1992).
Elkamel, A., Al-Ajmi, A., and Fahim, M., "Modeling the Hydrocracker Process using Artificial Neural Networks", Petroleum Science and Technology, 17(9&10), 931-954 (1999).
Zhang, J., Martin, E.B., Morris, A.J. and Kiparissides, C. Inferential Estimation of Polymer Quality Using Stacked Neural Networks. Computers and Chemical Engineering. Vol.21, 1025-1030 (1997).
Lanouette, R., Thibault, J. and Valade, J.L. (1999). Process Modeling with Neural Networks Using Experimental Datasets. Computers and Chemical Engineering. Vol.23, 1167-1176.
Zhao, J., Chen, B., and Shen, J., “A Hybrid ANN-ES System for Dynamic Fault Diagnosis of Hydrocracking Processes”, Computers in Chemical Engineering, 21, Supplement, pp S929-S933 (1997).
Mandlischer, M., Geyer, H., and Ulbig, P., "Neural Networks and Evolutionary Algorithms for the Prediction of Thermodynamic Properties for Chemical Engineering", Lecture Notes in Computer Science, Vol. 1585, pp. 106-113, (1999). Morad, N. A., The Physical Properties of Palm Oil Mixtures for Design of Process Equipment,, PhD. Thesis, University of Leeds (1995). Mulder, M. Basic Principles of Membrane Technology. Kluwerr Academic Publishers, pp 157-189 (1996). Pollock, G., and Eldridge, R, "Neural Network Modeling of Structured Packing Height Equivalent of a Theoretical Plate", Ind. Eng. Chem. Res., 39(5), pp. 1520-1525 (2000). Psichogios, D., and Ungar, L., “A Hybrid Neural Network-First Principles Approach to Process Modelling”, AICHE Journal, 38(10), pp. 1499-1511 (1992). Sabharwal, A., Bhat, N., and Wada, T., “Integrate Empirical and Physical Modelling”, Hydrocarbon Processing, pp. 105-112 (October 1997). Sharma, R., Singhal, D., Ghosh, R., and Dwivedi, A., "Potential Applications of Artificial Neural Networks to Thermodynamics: VaporLiquid Equilibrium Predictions", Computers in Chemical Engineering, 23, pp. 385-390 (1999). Schubert, J., Rimvydas, S., Dors, M., Havlik, I., and Lubberi, A., “Hybrid Modelling of Yeast Production Processes – Combination of a priori