Jun 15, 2002 - Mark J. Krasna, David Shibata, John M. Abraham, and Stephen J. Meltzer3. Department of Medicine, Division of Gastroenterology [Y. X., ...
[CANCER RESEARCH 62, 3493–3497, June 15, 2002]
Artificial Neural Networks and Gene Filtering Distinguish Between Global Gene Expression Profiles of Barrett’s Esophagus and Esophageal Cancer1 Yan Xu,2 Florin M. Selaru,2 Jing Yin,2 Tong Tong Zou, Valentina Shustova, Yuriko Mori, Fumiaki Sato, Thomas C. Liu, Andreea Olaru, Suna Wang, Martha C. Kimos, Kellie Perry, Kena Desai, Bruce D. Greenwald, Mark J. Krasna, David Shibata, John M. Abraham, and Stephen J. Meltzer3 Department of Medicine, Division of Gastroenterology [Y. X., F. M. S., J. Y., T. T. Z., V. S., Y. M., F. S., T. C. L., A. O., S. W., M. C. K., K. D., B. D. G., J. M. A., S. J. M.], Department of Surgery, Division of Thoracic Surgery [M. J. K.], and Department of Surgical Oncology [K. P., D. S.], Greenebaum Cancer Center, University of Maryland School of Medicine, Baltimore VA Hospital, Baltimore, Maryland 21201
ABSTRACT cDNA microarrays, combined with bioinformatics analyses, are becoming increasingly used in current medical research. Existing analytic methods, particularly those that are unsupervised, often have difficulty recognizing subtle differences among predefined subgroups. In contrast, supervised methods, such as Artificial Neural Networks (ANNs), are able to recognize subtly different biological entities. We applied ANNs in a proof-of-principle study of cDNA microarray data in esophageal cancer (CA) and premalignancy. cDNA microarrays, each containing 8064 clones, were hybridized to RNAs from 22 esophageal lesions, including 14 Barrett’s esophagus (BA) metaplasias and 8 esophageal carcinomas (3 squamous cell carcinomas and 5 adenocarcinomas). Scanned cDNA microarray data were analyzed using the bioinformatics software Cluster/ TreeView, Significance Analysis of Microarrays (SAM), and ANNs. Cluster analysis based on all 8064 clones on the microarrays was unable to correctly distinguish BA specimens from CA specimens. SAM then selected 160 differentially expressed genes between Barrett’s and cancer. Cluster analysis based on this reduced set still misclassified 2 Barrett’s as cancers. The ANN was trained on 12 samples and tested against the remaining 10 samples. Using the 160 selected genes, the ANN correctly diagnosed all 10 samples in the test set. Finally, the 160 genes selected by SAM may merit further study as biomarkers of neoplastic progression in the esophagus, as well as in elucidating pathological mechanisms underlying BA and CA.
INTRODUCTION Although the incidence of squamous cell carcinoma of the esophagus has remained relatively constant, the incidence of esophageal adenocarcinoma has steadily increased in recent years (1). In fact, in the United States, the incidence of this cancer has been rising faster than that of any other malignancy (2). Moreover, CA is usually discovered at an advanced stage and is rapidly fatal (3). Both 1-year and 5-year survival rates for patients with esophageal carcinoma are very low: 75% of untreated patients with CA die within 1 year of diagnosis (4), whereas 5-year survival rates are 25–30% (5). This survival pattern applies to both squamous cell carcinoma and adenocarcinoma of the esophagus. BA4 is a premalignant condition caused by chronic gastroesophageal reflux (6). Numerous scientific reports suggest that BA is a precursor lesion for esophageal adenocarcinoma (7–9). Elucidation of the molecular biology underlying malignant transformation in BA Received 12/8/01; accepted 4/17/02. The costs of publication of this article were defrayed in part by the payment of page charges. This article must therefore be hereby marked advertisement in accordance with 18 U.S.C. Section 1734 solely to indicate this fact. 1 Supported by NIH Grants DK47717, CA95323, CA85069, CA78843, and CA77057 and the Medical Research Office, Department of Veterans Affairs. 2 Y. X., F. M. S., and J. Y. contributed equally to this manuscript. 3 To whom requests for reprints should be addressed, at University of Maryland, Room N3W62, 22 South Greene Street, Baltimore, MD 21201. E-mail: smeltzer@medicine. umaryland.edu. 4 The abbreviations used are: BA, Barrett’s esophagus; SAM, Significance Analysis of Microarrays; ANN, Artificial Neural Network; FDR, False Discovery Rate; aRNA, amplified RNA; CA, esophageal cancer.
may lead to markers for early detection of carcinomas and enable therapeutic interventions to prevent or treat these otherwise highly lethal neoplasms (2). In recent years, cDNA microarray technology has brought new hope to the field of cancer research. This technology has proven capable of improving accuracy in disease classification, discriminative diagnostic power, and early lesion detection efficiency (10, 11). Although cDNA microarrays have permitted the collection of expression information on thousands of genes simultaneously, analysis of this large amount of data has proven difficult. For this reason, numerous bioinformatics strategies have been developed, including hierarchical clustering (12), multidimensional scaling (13), and ANNs (14, 15). For global gene expression profiling, cDNA microarray-generated information has been analyzed using hierarchical agglomerative clustering techniques (10, 12, 16 –22). However, despite numerous advantages, clustering has a series of drawbacks (14). It is an unsupervised classification method that may group patient samples based on characteristics irrelevant to the clinical question under study. In contrast, ANNs are a supervised classification technique. Originally designed to mimic the parallel functioning of the mammalian brain, ANNs are mathematical informationprocessing models composed of many units, named neurons. The units in an ANN are highly interconnected by weighted links, very similar to neural synapses. Another similarity between the mammalian brain and ANNs is that they both learn by example. ANNs are presented with sets of defining characteristics for the particular state of an object, such as cDNA microarray data, by which ANNs are taught the correct interpretation of this data (such as diagnosis). By performing repetitive cycles, ANNs adjust the weights of links between neurons in order to associate input data with correct output. After training with multiple input-output data pairs, ANNs are usually able to make diagnoses on blinded input data. A schematic illustration of these concepts is given in Fig. 1. ANNs have only been applied to medical research relatively recently (23–25). They have been chosen as a primary analysis tool in studies where other techniques were not accurate (14). ANNs are a powerful method for interpreting data when it is abundant, contradictory, biased, or complex (15). A major aim of published microarray studies is the identification of differentially expressed genes between two sample groups (26, 27). Genes identified from these comparisons are candidate targets for diagnosis and therapy (28). This study of differentially expressed genes could provide important new information regarding the progression of BA to cancer. Furthermore, these genes could unveil pathologic pathways that would further our understanding of CA. One method for identifying differentially expressed genes is SAM, a software program developed at Stanford University (29). Using a derivation of the unpaired Student t test, SAM assigns each gene a score based on its change in average expression between two groups, relative to the gene’s SD within each group. An estimate of the FDR,
3493
ANNs AND cDNA MICROARRAYS IN ESOPHAGEAL LESIONS
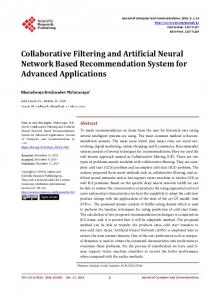
Fig. 1. A schematic representation of a typical ANN. One typical type of ANN has an input layer, one or more hidden layers, and an output layer. The user of the ANN interacts with the input and output layer (diagnosis), whereas the hidden layers are transparent. The training set is composed of sets of microarray data paired with a correct diagnosis. Multiple expression ratios from a microarray experiment comprise the input layer. This information is processed from one layer to the next using multiple transfer functions or formulas. The final product of this processing is the output layer, in this case, a provisional diagnosis. The output produced by the first data passage through the ANN is compared with the ideal output, in this case, a known clinical diagnosis, and an error is generated. The error is backpropagated through the ANN, and the weights of various connections between the neural units are adjusted, in an attempt to decrease this error. Once this backpropagation reaches the input layer, another wave of forward processing begins and reaches the output layer again, at which time, a new, smaller error is calculated. This learning process is repeated until the ANN is able to make an accurate diagnosis on the training set. After training, the ANN is presented with new microarray data from patients in a test set.
i.e., the percentage of genes falsely reported as significant, is also provided. In the current study, we show that ANNs can discriminate between subtly different clinical disease lesions, specifically, the premalignant lesion BA versus CA, based on microarray-derived data. Moreover, by applying SAM, we identified 160 clones that are significantly differentially expressed between BA and CA. MATERIALS AND METHODS Tissues and Patients. Patients from the University of Maryland or Baltimore VA Hospitals were enrolled in the study during a 3-year period. Presumptive diagnoses of BA or CA were confirmed by histological examination. The criteria for BA were either complete intestinal metaplasia or specialized columnar epithelium. Informed consent was obtained from all patients before enrollment under a protocol approved by the University of Maryland/Baltimore VA Hospital Institutional Review Boards. Preparation of Microarray Clones. The 95% nonredundant, sequenceverified cDNA library prepared by the Lawrence Livermore Laboratories was used as a source of clones (Research Genetics, Huntsville, AL). Inserts from the first 8064 clones in this library were amplified for microarray printing. Each bacterial stock (1 l) was amplified in a 108-l reaction containing 2.5 units of Taq polymerase (Life Sciences, Gaithersburg, MD). The master mix for each 96-well plate contained 9.5 ml of double-distilled water, 1 ml of 10 ⫻ buffer, 10 l each of 1000 M M13 primers (forward and reverse), 20 l each of the four deoxynucleotide triphosphates (100 mM), and 50 l of Taq polymerase (5 units/l). PCR conditions consisted of an initial denaturation step at 96°C for 30 s followed by 30 cycles of 45 s at 94°C, 45 s at 55°C, and 2 min 30 s at 72°C, then concluded by a final extension of 5 min at 72°C. The amplified inserts were then purified using a Qiagen PCR purification kit (Qiagen) on a Qiagen BioRobot 9600 liquid handling robotic workstation.
After purification, PCR products were desiccated in 96-well plates using a large Speed-vac apparatus, then reconstituted in 30 l of distilled water. Reference Probe. All microarrays were cohybridized to an experimental aRNA and invariant reference probe. The reference probe was prepared from an equimolar mixture containing RNAs from the cell lines HCT116, HT29, CaCo-2, HCT15, HTB114, MCF-7, HeLa, and AGS. HTB114 was derived from a patient with leukemia, HeLa was from a cervical cancer, MCF-7 was from a breast cancer, and AGS was from a gastric cancer. The remaining four cell lines (HCT116, HT29, CaCo-2, and HCT15) were derived from colorectal cancers. The choice of cell lines included in the reference probe was influenced by previous microarray studies (18, 19, 21, 30). These cell lines were chosen to represent a variety of cell types to obtain a reference expression level on as many genes as possible and to maintain consistency of experimental design between studies. These cell lines were chosen as a source of reference probe RNA before initiation of the current study; esophageal cell lines were not available at the time of this study. Extraction, Amplification, and Labeling of the aRNA Probe. Total RNA (20 –50 g) was extracted from freshly frozen tissue by standard organic methods and amplified with a T7-based protocol (31–33). For each two-way comparison, 3– 6 g of aRNA prepared from the reference cells or esophageal lesion were labeled by incorporating Cy3- or Cy5-labeled dCTP using random primers and Superscript reverse transcriptase. The resulting probes were purified with a Microcon microcentrifuge filter device and recovered in a volume of 25 l. Microarray Preparation. We prepared lysine-coated slides using National Cancer Institute-Advanced Technology Center and Stanford University protocols.5 cDNA clones were printed using eight pins in a 32-pin print head (Majer Precision Engineering, Tempe, AZ) on a GeneMachines Omnigrid Arrayer (GeneMachines, Oxnard, CA). The printed slides were UV cross-linked, post-treated with succinic anhydride to reduce background, and subjected to hybridization. Each slide was incubated in 35 l of hybridization solution containing Cy3- and Cy5-labeled target, 1 l of 50 ⫻ Denhardt’s blocking solution (Sigma, St. Louis, MO), 20 g of Human COT 1-DNA (Roche Diagnostics Corp., Indianapolis, IN), 10 g of yeast tRNA (Roche Diagnostics Corp.), and 8 –10 g of Poly-A (Roche Diagnostics Corp.) in 2.24 ⫻ SSC/ 0.25% SDS under a 40 ⫻ 22-mm coverslip at 65°C overnight in a final hybridization volume of 35 l. The slide was placed in a sealed hybridization chamber (Teleckem, Sunnyvale, CA) containing two side wells with a total of 50 l of water for humidification at 65°C overnight. On the next day, the slide was washed in 500 ml of 2 ⫻ SSC, 0.1% SDS at room temperature, during which time the coverslip fell off, and washing continued for 2 min. The slide was then placed in 1 ⫻ SSC for 2 min at room temperature. Finally, it was washed once with 0.2 ⫻ SSC at room temperature and once with 0.05 ⫻ SSC for 2 min and air dried. Each hybridized slide was scanned using a GenePix 4000A dual-laser slide scanning system (Axon) at wavelengths corresponding to each probe’s unique fluorescence (635 and 532 nm for Cy5 and Cy3, respectively). Hierarchical Agglomerative Clustering. Data imported from GenePix was manipulated and clustered, using established algorithms implemented in the software program Cluster (12, 22). Average linkage clustering with centered correlation was used. TreeView software (ibid.) generated visual representations of clusters. SAM Gene Filtering. The gene filtering process was performed using SAM (29). Specifically designed for usage with microarray data, SAM is a software program that reports the most statistically significant differentially expressed genes between two groups of samples. In addition, SAM reports an estimate of the median FDR, which is the percentage of genes falsely reported as showing statistically significant differential expression. SAM uses an algorithm based on the Student t test and also performs data permutations to determine the FDR. ANN Construction and Testing. We constructed an ANN using the software program MatLab (MathWorks, Inc., Natick, MA). Our ANN was based on the principle of FeedForward with Error Backpropagation. The net was designed with one hidden layer. The number of neurons in the input layer was equal to the number of clones used, whereas the ideal outputs were set at ⫺1 for BA and ⫹1 for CA. The ANN was then trained using a training set
3494
5
Internet addresses: http://www.microarrays.org/protocols.html and rana.lbl.gov.
ANNs AND cDNA MICROARRAYS IN ESOPHAGEAL LESIONS
Fig. 2. Data analysis diagram. Microarray expression data from all 8064 clones were used to cluster the 22 esophageal samples. Two main groups emerged: (a) a “Barrett’s” group containing eight BAs; and (b) a cancer group that comprised all eight CAs and six Barrett’s specimens. SAM identified 160 genes that were significantly differentially expressed between BAs and CAs. Information from these 160 clones was input into Cluster; this information was also used to train and test an ANN. To contrast clustering with ANNs, we applied both techniques on this reduced data set and then compared the results. The ANN was trained on 12 esophageal tissues and then tested with the remaining 10 samples.
consisting of eight Barrett’s metaplasias and four cancers. After training, the ANN was tested with the remaining samples, consisting of six Barrett’s specimens and four cancers.
RESULTS We initially applied hierarchical agglomerative clustering based on information from all 8064 clones. Using SAM, we selected 160 genes with statistically significant differential expression levels between BA and CA. Information from these 160 clones alone was used when hierarchical clustering was reapplied. An ANN, based again on these 160 genes, was constructed, trained on 12 samples (eight Barrett’s and four cancers) and tested on 10 additional blinded samples (six Barrett’s and four cancers; Fig. 2). The use of the same 160 gene set allowed us to compare the classification performance of clustering to that of ANNs. Hierarchical Agglomerative Clustering Based on Information from all 8064 Cones. We used Cluster and TreeView (22) to group samples based on their global gene expression profiles. Information from all 8064 clones was input into Cluster, and the results were displayed using TreeView (Fig. 3) Eight Barrett’s samples fell into one major cluster, whereas the remaining six Barrett’s specimens were grouped with the eight cancers in a second major cluster. The global gene expression profile of the two major clusters appeared very contrasting: genes that were overexpressed in one cluster (red vertical bars, Fig. 3) tended to be underexpressed in the other cluster (green vertical bars, Fig. 3). This result suggested that the six Barrett’s samples clustering in the “cancer” group were more closely related to CAs than to the remaining eight Barrett’s samples.
Use of SAM to Select Differentially Expressed Genes between Barrett’s and Cancer. SAM selected genes showing statistically significant differences in expression level between Barrett’s and cancer specimens. At an FDR of 0, SAM identified 160 clones. Among these 160 clones, 129 were expressed more highly in cancer than in Barrett’s, whereas 31 were expressed at higher levels in Barrett’s.6 Hierarchical Agglomerative Clustering Based on Information from the 160 Clones Selected by SAM. All 22 esophageal samples were reclustered based on expression data from the 160 genes selected by SAM (Fig. 4). All but two of the Barrett’s metaplasias clustered in one main group. All eight cancers clustered in the other main group, which also contained the two Barrett’s specimens. However, the two Barrett’s cases in the cancer group were in a separate subcluster very close to the Barrett’s cluster (Fig. 4). Lesion Profiling Using ANNs. We trained an ANN to distinguish malignant esophageal tissue (either squamous cell carcinoma or adenocarcinoma) from premalignant esophageal tissue (Barrett’s). The ANN was trained on 12 esophageal lesions: eight Barrett’s metaplasias and four CAs. By convention, the diagnosis of BA was encoded by ⫺1 and that of CA was encoded by ⫹1. After training, 10 additional esophageal samples were input into the ANN. For six lesions, the ANN output was very close to ⫺1 (Fig. 5). Pathology reports revealed that these six samples were all Barrett’s metaplasias. The remaining four lesions produced an ANN output very close to ⫹1 (Fig. 5). Similarly, all four of these lesions were histologically esophageal adenocarcinomas or squamous cell cancers. DISCUSSION cDNA microarrays have formed the foundation for many cancer research studies. The advantage of this methodology derives from its ability to analyze the expression levels of thousands of genes simultaneously over many specimens. Classical statistical techniques, such as hierarchical clustering, can be used to analyze microarray data (10, 16). However, this type of analysis is unsupervised. Thus, its output may not match the pathological diagnosis, because biological samples contain an abundance of information, much of which is unrelated to the characteristic under study (34, 35). Supervised techniques can also be used to analyze microarray data. These techniques can focus on a specific comparison of interest, such as esophageal premalignancy versus malignancy. Supervised techniques include SAM, a gene filtering software program that identifies genes significantly different in expression level between two groups (29). Supervised methods also include ANNs, which can be trained to recognize clinically discrete groups of lesions or other biological entities, even when these entities are very similar (14, 15). In our study, we first applied unsupervised, classical statistical techniques to unfiltered microarray data. Thus, the esophageal samples were grouped using Cluster based on gene expression information from all 8064 clones. This approach was unsuccessful in distinguishing between Barrett’s metaplasias and CAs. The clustering result can be interpreted as a consequence of using unfiltered, unsupervised data. In other words, although some of these data were relevant to the premalignant or malignant status of the samples, much of the data contained irrelevant information. Because of this type of “noise”, Cluster was unable to group the samples according to their pathologic diagnoses. To restrict the genes to those showing statistically significant differential expression between Barrett’s and CA, we used SAM. With an FDR of 0, SAM reported 129 genes overexpressed in cancer and 31 genes overexpressed in Barrett’s. The complete list containing all 160
3495
6
Internet address: http://microarray.umaryland.edu.
ANNs AND cDNA MICROARRAYS IN ESOPHAGEAL LESIONS
Fig. 3. Clustergram based on microarray data from all 8064 clones. Left side, graphic representation of expression data from all 8064 clones in all 22 esophageal samples. The esophageal samples appear as horizontal lanes, whereas the genes appear as very narrow vertical slits. Red 䡺, genes that are overexpressed relative to the reference probe; green 䡺, genes that are underexpressed compared with the reference probe. Right side, sample clustering result (dendrogram). Red horizontal branches, cancers; green branches, Barrett’s metaplasias. Six Barrett’s samples were misclassified into the same group as the cancers.
Fig. 4. Post-gene filtering clustergram. TreeView display of Cluster results based on microarray data from 160 clones selected by SAM. This clustergram consists of only 160 vertical slits (clones). Again, the horizontal lanes on the left side represent individual patients. The dendrogram (right side) now shows a more accurate grouping of specimens into their natural pathological diagnostic categories. Two Barrett’s metaplasias still clustered close to the cancers, but on this analysis, the dendrogram branch containing them was very close to the Barrett’s cluster.
of these genes can be found on a Web site.6 Clustering based on these 160 genes produced results very close to the true pathological diagnosis (Fig. 3). Although two Barrett’s samples were still misclassified in the cancer group, these samples clustered very closely to the other Barrett’s samples. This result supports the conclusion that genes selected by SAM were relevant to distinguishing Barrett’s from CA. Moreover, this result also suggests that gene filtering to select genes relevant to the difference between Barrett’s and cancer is itself a
Fig. 5. Graphic display of ANN results on the test set. The numbers assigned to each diagnosis are displayed on the Y axis. Blue f, ideal (Pathologic) diagnosis; red f, ANN approximation. Barrett’s metaplasia, ⫺1; CA, ⫹1. The 10 samples in the test set were not used to train the ANN and had not been presented to the ANN before. Displayed below the graph are the precise ideal (Pathologic Diagnosis) and ANN approximation (ANN diagnosis) values. In all 10 cases, the ANN was very accurate in its approximation of the known pathologic (ideal) diagnosis.
justifiable intermediate step before applying unsupervised techniques, such as clustering. However, when using only the 160 genes selected by SAM, clustering still misclassified two specimens, whereas our ANN correctly classified all specimens in its test set. By using gene filtering programs, subgroups of important genes could be identified for the differential diagnosis of BA and CA. This gene filtering technique could potentially be applied to isolate other subgroups of genes. For example, it could identify genes capable of predicting outcome (i.e., likelihood of neoplastic progression) in the Barrett’s population. It would be quite useful to predict which patients with BA will rapidly evolve toward frank carcinoma and which will have a slow progression. The same technique could be applied to the esophageal carcinoma population, with the purpose of identifying therapeutic responders versus nonresponders or long survivors versus short survivors. Therapies could be tailored based on these findings, with significant improvements in the outcome and quality of life of patients with esophageal premalignant and malignant lesions. However, to achieve high sensitivity and specificity, it will be necessary to analyze a large cohort of patients and to have very accurate pathologic, clinical, and epidemiological data. The classification results obtained with ANNs add to the promise of microarray-derived data analysis. The results of another research group (14), as well as our own (15), suggest that ANNs are robust classifiers, capable of recognizing patterns even when data are incomplete, biased, or extremely abundant. With the proper training, ANNs are capable of making subtle correlations and distinctions based on complex input data, such as microarray data, and to use these correlations to arrive at a correct diagnosis. In fact, there are many published examples in which ANNs performed better than classical statistical techniques (36, 37). Although we did not compare the efficiency and accuracy of these two approaches in a large, prospec-
3496
ANNs AND cDNA MICROARRAYS IN ESOPHAGEAL LESIONS
tive study, our results suggest that ANNs will at least complement classical statistical approaches. In conclusion, these data suggest that ANNs are a useful addition to the armamentarium of methods currently used to analyze microarray data. They offer the potential to advance our ability to extract more information from microarray data and to more accurately interpret these data. Finally, when combined with gene filtering algorithms, ANNs appear to represent powerful tools to identify and understand subtle or occult pathologic processes. Ultimately, we believe that these tools will have a far-ranging impact on cancer detection, diagnosis, and management.
19.
20.
21.
REFERENCES 1. Gamliel, Z. Incidence, epidemiology, and etiology of esophageal cancer. Chest Surg. Clin. N. Am., 10: 441– 450, 2000. 2. Altorki, N. K., Oliveria, S., and Schrump, D. S. Epidemiology and molecular biology of Barrett’s adenocarcinoma. Semin. Surg. Oncol., 13: 270 –280, 1997. 3. Daly, J. M., Karnell, L. H., and Menck, H. R. National Cancer Data Base report on esophageal carcinoma. Cancer, 78: 1820 –1828, 1996. 4. Parker, E. F., Hanna, C. B., and Postlethwait, R. W. Carcinoma of the esophagus. Ann. Surg., 135: 697, 1952. 5. Blot, W. J., and McLaughlin, J. K. The changing epidemiology of esophageal cancer. Semin. Oncol., 26: 2– 8, 1999. 6. Ransford, R. A., and Jankowski, J. A. Genetic versus environmental interactions in the oesophagitis-metaplasia-dysplasia-adenocarcinoma sequence (MCS) of Barrett’s oesophagus. Acta Gastroenterol. Belg., 63: 18 –21, 2000. 7. Pera, M., Trastek, V. F., Pairolero, P. C., Cardesa, A., Allen, M. S., and Deschamps, C. Barrett’s disease: pathophysiology of metaplasia and adenocarcinoma. Ann. Thorac. Surg., 56: 1191–1197, 1993. 8. Rogers, E. L., Goldkind, S. F., Iseri, O. A., Bustin, M., Goldkind, L., Hamilton, S. R., and Smith, R. L. Adenocarcinoma of the lower esophagus. A disease primarily of white men with Barrett’s esophagus. J. Clin. Gastroenterol., 8: 613– 618, 1986. 9. Zhuang, Z., Vortmeyer, A. O., Mark, E. J., Odze, R., Emmert-Buck, M. R., Merino, M. J., Moon, H., Liotta, L. A., and Duray, P. H. Barrett’s esophagus: metaplastic cells with loss of heterozygosity at the APC gene locus are clonal precursors to invasive adenocarcinoma. Cancer Res., 56: 1961–1964, 1996. 10. Selaru, F. M., Zou, T., Shustova, V., Xu, Y., Yin, J., Mori, Y., Sato, F., Wang, S., Olaru, A., Shibata, D., Greenwald, B. D., Krasna, M. J., Abraham, J. M., and Meltzer, S. J. Global gene expression profling in Barrett’s esophagus and esophageal cancer: a comparative analysis using cDNA microarrays. Oncogene, 21: 475– 478, 2002. 11. Elek, J., Park, K. H., and Narayanan, R. Microarray-based expression profiling in prostate tumors. In Vivo, 14: 173–182, 2000. 12. Eisen, M. B., and Brown, P. O. DNA arrays for analysis of gene expression. Methods Enzymol., 303: 179 –205, 1999. 13. Khan, J., Simon, R., Bittner, M., Chen, Y., Leighton, S. B., Pohida, T., Smith, P. D., Jiang, Y., Gooden, G. C., Trent, J. M., and Meltzer, P. S. Gene expression profiling of alveolar rhabdomyosarcoma with cDNA microarrays. Cancer Res., 58: 5009 – 5013, 1998. 14. Khan, J., Wei, J. S., Ringner, M., Saal, L. H., Ladanyi, M., Westermann, F., Berthold, F., Schwab, M., Antonescu, C. R., Peterson, C., and Meltzer, P. S. Classification and diagnostic prediction of cancers using gene expression profiling and artificial neural networks. Nat. Med., 7: 673– 679, 2001. 15. Selaru, F. M., Xu, Y., Yin, J., Zou, T., Liu, T. C., Mori, Y., Abraham, J. M., Sato, F., Wang, S., Twigg, C., Olaru, A., Shustova, V., Leytin, A., Shibata, D., Harpaz, N., and Meltzer, S. J. Artificial Neural Networks distinguish among subtypes of neoplastic colorectal lesions. Gastroenterology, 122: 606 – 613, 2002. 16. Chu, S., DeRisi, J., Eisen, M., Mulholland, J., Botstein, D., Brown, P. O., and Herskowitz, I. The transcriptional program of sporulation in budding yeast (Published erratum in Science, 282: 1421, 1998). Science, 282: 699 –705, 1998. 17. Spellman, P. T., Sherlock, G., Zhang, M. Q., Iyer, V. R., Anders, K., Eisen, M. B., Brown, P. O., Botstein, D., and Futcher, B. Comprehensive identification of cell cycle-regulated genes of the yeast Saccharomyces cerevisiae by microarray hybridization. Mol. Biol. Cell, 9: 3273–3297, 1998. 18. Iyer, V. R., Eisen, M. B., Ross, D. T., Schuler, G., Moore, T., Lee, J. C. F., Trent, J. M., Staudt, L. M., Hudson, J., Jr., Boguski, M. S., Lashkari, D., Shalon, D.,
22.
23.
24.
25.
26.
27.
28.
29.
30.
31. 32.
33.
34.
35.
36.
37.
3497
Botstein, D., and Brown, P. O. The transcriptional program in the response of human fibroblasts to serum. Science, 283: 83– 87, 1999. Perou, C. M., Jeffrey, S. S., van de Rijn, M., Rees, C. A., Eisen, M. B., Ross, D. T., Pergamenschikov, A., Williams, C. F., Zhu, S. X., Lee, J. C., Lashkari, D., Shalon, D., Brown, P. O., and Botstein, D. Distinctive gene expression patterns in human mammary epithelial cells and breast cancers. Proc. Natl. Acad. Sci. USA, 96: 9212–9217, 1999. Alizadeh, A. A., Eisen, M. B., Davis, R. E., Ma, C., Lossos, I. S., Rosenwald, A., Boldrick, J. C., Sabet, H., Tran, T., Yu, X., Powell, J. I., Yang, L., Marti, G. E., Moore, T., Hudson, J., Jr., Lu, L., Lewis, D. B., Tibshirani, R., Sherlock, G., Chan, W. C., Greiner, T. C., Weisenburger, D. D., Armitage, J. O., Warnke, R., Staudt, L. M., et al. Distinct types of diffuse large B-cell lymphoma identified by gene expression profiling. Nature, 403: 503–511, 2000. Perou, C. M., Sorlie, T., Eisen, M. B., van de Rijn, M., Jeffrey, S. S., Rees, C. A., Pollack, J. R., Ross, D. T., Johnsen, H., Akslen, L. A., Fluge, O., Pergamenschikov, A., Williams, C., Zhu, S. X., Lonning, P. E., Borresen-Dale, A. L., Brown, P. O., and Botstein, D. Molecular portraits of human breast tumours. Nature, 406: 747–752, 2000. Eisen, M. B., Spellman, P. T., Brown, P. O., and Botstein, D. Cluster analysis and display of genome-wide expression patterns. Proc. Natl. Acad. Sci. USA, 95: 14863– 14868, 1998. Mattfeldt, T., Gottfried, H., Schmidt, V., and Kestler, H. A. Classification of spatial textures in benign and cancerous glandular tissues by stereology and stochastic geometry using artificial neural networks. J. Microsc., 198: 143–158, 2000. Kehoe, S., Lowe, D., Powell, J. E., and Vincente, B. Artificial neural networks and survival prediction in ovarian carcinoma. Eur. J. Gynaecol. Oncol., 21: 583–584, 2000. Rodvold, D. M., McLeod, D. G., Brandt, J. M., Snow, P. B., and Murphy, G. P. Introduction to artificial neural networks for physicians: taking the lid off the black box. Prostate, 46: 39 – 44, 2001. Wolf, M., El-Rifai, W., Tarkkanen, M., Kononen, J., Serra, M., Eriksen, E. F., Elomaa, I., Kallioniemi, A., Kallioniemi, O., and Knuutila, S. Novel findings in gene expression detected in human osteosarcoma by cDNA microarray. Cancer Genet. Cytogenet., 123: 128 –132, 2000. Wang, T., Hopkins, D., Schmidt, C., Silva, S., Houghton, R., Takita, H., Repasky, E., and Reed, S. G. Identification of genes differentially over-expressed in lung squamous cell carcinoma using combination of cDNA subtraction and microarray analysis. Oncogene, 19: 1519 –1528, 2000. Xu, J., Stolk, J. A., Zhang, X., Silva, S. J., Houghton, R. L., Matsumura, M., Vedvick, T. S., Leslie, K. B., Badaro, R., and Reed, S. G. Identification of differentially expressed genes in human prostate cancer using subtraction and microarray. Cancer Res., 60: 1677–1682, 2000. Tusher, V. G., Tibshirani, R., and Chu, G. Significance analysis of microarrays applied to the ionizing radiation response. Proc. Natl. Acad. Sci. USA, 98: 5116 – 5121, 2001. Alizadeh, A., Eisen, M., Botstein, D., Brown, P. O., and Staudt, L. M. Probing lymphocyte biology by genomic-scale gene expression analysis. J. Clin. Immunol., 18: 373–379, 1998. Chomczynski, P., and Sacchi, N. Single step extraction of RNA isolation. Anal. Biochem., 162: 156 –159, 1987. Van Gelder, R. N., von Zastrow, M. E., Yool, A., Dement, W. C., Barchas, J. D., and Eberwine, J. H. Amplified RNA synthesized from limited quantities of heterogeneous cDNA. Proc. Natl. Acad. Sci. USA, 87: 1663–1667, 1990. Luo, L., Salunga, R. C., Guo, H., Bittner, A., Joy, K. C., Galindo, J. E., Xiao, H., Rogers, K. E., Wan, J. S., Jackson, M. R., and Erlander, M. G. Gene expression profiles of laser-captured adjacent neuronal subtypes. Nat. Med., 5: 117–122, 1999. Dhanasekaran, S. M., Barrette, T. R., Ghosh, D., Shah, R., Varambally, S., Kurachi, K., Pienta, K. J., Rubin, M. A., and Chinnaiyan, A. M. Delineation of prognostic biomarkers in prostate cancer. Nature, 412: 822– 826, 2001. Welsh, J. B., Sapinoso, L. M., Su, A. I., Kern, S. G., Wang-Rodriguez, J., Moskaluk, C. A., Frierson, H. F., Jr., and Hampton, G. M. Analysis of gene expression identifies candidate markers and pharmacological targets in prostate cancer. Cancer Res., 61: 5974 –5978, 2001. Biagiotti, R., Desii, C., Vanzi, E., and Gacci, G. Predicting ovarian malignancy: application of artificial neural networks to transvaginal and color Doppler flow US. Radiology, 210: 399 – 403, 1999. Bottaci, L., Drew, P. J., Hartley, J. E., Hadfield, M. B., Farouk, R., Lee, P. W., Macintyre, I. M., Duthie, G. S., and Monson, J. R. Artificial neural networks applied to outcome prediction for colorectal cancer patients in separate institutions. Lancet, 350: 469 – 472, 1997.