Partnerships for the Sustainable Development of Cities in the APEC Region
APEC Policy Support Unit April 2017
Editors: Brian H. Roberts, Michael Lindfield and Florian Steinberg* Urban Frontiers Pty Ltd Brisbane, Queensland, Australia Tel: (61) 07 3870-5939 Email:
[email protected]
Produced for: Asia-Pacific Economic Cooperation Policy Support Unit Asia-Pacific Economic Cooperation Secretariat 35 Heng Mui Keng Terrace Tel: (65) 6891-9500 Fax: (65) 6891-9690 Email:
[email protected] Website: www.apec.org APEC#214-SE-01.22
This work is licensed under the Creative Commons Attribution-NonCommercialShareAlike 3.0 Singapore License. To view a copy of this license, visit http://creativecommons.org/licenses/by-nc-sa/3.0/sg/.
* Consultants. The views expressed in this research study are those of the authors and do not necessarily represent those of the APEC Secretariat and the APEC Member Economies.
i
TABLE OF CONTENTS
1.
Table of Contents ii List of Tables vi List of Figures viii List of Photos x About the Contributors xi Acknowledgements xiv Preface i Key Findings and Recommendations ii Executive Summary v New Agenda for Sustainable Development of APEC Cities ............................1
2.
Brian H. Roberts, Michael Lindfield and Florian Steinberg 1 1.1 Urbanization in the Regional Context 3 1.2 A Region with More, Bigger and Greying Cities 6 1.3 Cities are the Region’s Drivers of Economic Growth and Prosperity 10 1.4 Challenges Facing the Future Development of APEC Cities 11 1.5 The New Economic Geography of Cities in the Region 14 1.6 Changes in the Typology of Cities 16 1.7 The Sustainable City Debate 18 1.8 Defining Sustainable Cities 19 1.9 A Framework for Sustainable City Development 20 1.10 Challenges to Achieving Sustainable Urban Development in the Region 23 1.11 A New Sustainability Agenda for Cities in the Region 28 1.12 New Models for Urban Governance in Sustainable City Development 30 1.13 Focus and Purpose of the Book 35 1.14 Building Momentum for an APEC Asia-Pacific Partnership for Urbanization and Sustainable City Development 38 Auckland, New Zealand ...................................................................................39
3.
Brian H. Roberts and Simone E. Roberts 39 2.1 Introduction 39 2.2 The Economy 40 2.3 Strategic Infrastructure and Assets 49 2.4 Environmental Systems and Sustainability 53 2.5 Social Integration and Multiculturalism 54 2.6 Urban Governance 57 2.7 Partnerships for Sustainable Development 61 2.8 Examples of Best Practice Partnerships 64 2.9 Conclusions 67 Bandung, Indonesia ..........................................................................................69 Wicaksono Sarosa, Wahyu Mulyana and Brian H. Roberts 3.1 Introduction 3.2 Economic Dynamics 3.3 Strategic Infrastructure and Assets 3.4 Social and Environmental Systems and Sustainability 3.5 Urban Governance ii
69 69 72 82 88 91
4.
3.6 Partnerships for Sustainable Development 96 3.7 Conclusions 98 Bangkok–Phnom Penh–Ho Chi Minh Corridor, Greater Mekong Sub-region ........................................................................................................100
5.
Alain Maulion, Florian Steinberg and Michael Lindfield 100 4.1 Introduction 100 4.2 Major Corridor Cities 105 4.3 Intermediate Corridor Towns 121 4.4 Corridor Development Governance 125 4.5 Conclusions 126 Greater Brisbane Region, Australia ..............................................................129
6.
Brian H. Roberts, John Abbott and Michelle Addison 129 5.1 Introduction 129 5.2 Economic Environment 131 5.3 Social and Environmental Sustainability 141 5.4 Effectiveness of Governance 144 5.5 Challenges to Sustainable Development 148 5.6 Good Practice Partnerships for Sustainable Development 150 5.7 Conclusions 156 Jing-Jin-Ji Region, People’s Republic of China ...........................................160
7.
Michael Lindfield, Xueyao Duan and Aijun Qiu 160 6.1 Introduction 160 6.2 Economic Environment 164 6.3 Innovation, Creativity and Business Entrepreneurship 167 6.4 Strategic Infrastructure 169 6.5 Social and Environmental Sustainability 173 6.6 Effectiveness of Urban Governance 176 6.7 Partnerships for Sustainable Development 179 6.8 Conclusions 181 Kitakyushu City, Japan ..................................................................................183
8.
Hitomi Nakanishi and Hisashi Shibata 183 7.1 Introduction 183 7.2 Economic Dynamics 185 7.3 Strategic Infrastructure and Assets 188 7.4 Social and Environmental Systems and Sustainability 191 7.5 Urban Governance 197 7.6 Partnerships for Sustainable Development 199 7.7 Conclusions 201 Lima, Peru .......................................................................................................202 Florian Steinberg and Juana Kuramoto 8.1 Introduction 8.2 Economic Environment 8.3 Strategic Infrastructure 8.4 Social and Environmental Sustainability 8.5 Effectiveness of Urban Governance 8.6 Sustainable Development Partnerships iii
202 202 204 215 222 223 224
9.
8.7 Potential APEC partnerships 225 8.8 Conclusions 225 Metro Manila, Philippines ..............................................................................227
Theresa Audrey O. Esteban and Michael Lindfield 227 9.1 Introduction 227 9.2 Economic Environment 228 9.3 Strategic Infrastructure 237 9.4 Social Environment 242 9.5 Effectiveness of Urban Governance 248 9.6 Partnerships for Sustainable Development 249 9.7 Conclusions 253 10. Mexico City, Mexico .......................................................................................254 Fernando Ramirez and Florian Steinberg 254 10.1 Introduction 254 10.2 Economic Environment 257 10.3 Strategic Infrastructure 268 10.4 Social and Environmental Sustainability 271 10.5 Urban Governance 273 10.6 Good Practice for Sustainable Development 275 10.7 Potential APEC Partnerships 277 10.8 Conclusions 278 11. Pearl River Delta Supracity, People’s Republic of China ...........................280 Michael Lindfield, Xueyao Duan and Aijun Qiu 280 11.1 Introduction 280 11.2 Economic Environment 283 11.3 Strategic Infrastructure 295 11.4 Social Sustainability 301 11.5 Environmental Sustainability: Policies and Measures 302 11.6 Effectiveness of Urban Governance 303 11.7 Partnerships for Sustainable Development 305 11.8 Conclusions 309 12. Santiago, Chile.................................................................................................311 Florian Steinberg, Marcela Allué and Jose Tomás Videla 311 12.1 Introduction 311 12.2 The City in Context 312 12.3 Economic Environment 314 12.4 Competitiveness of the Economy 317 12.5 Strategic Infrastructure 320 12.6 Social Environment 325 12.7 Sustainability and Environmental Management 327 12.8 Effectiveness of Urban Governance 331 12.9 Partnerships for Sustainable Development 332 12.10 International Partnerships 335 12.11 Potential Partnerships through APEC 336 12.12 Conclusions 338 13. Seoul, Korea .....................................................................................................340 iv
Miree Byun, Chang Yi, Mook Han Kim, Jun Sik Bae and Inhee Kim 340 13.1 Introduction 340 13.2 Population Growth and Economic Development 341 13.3 Strategic Infrastructure and Assets 348 13.4 Social Systems and Sustainability 355 13.5 Environmental Management and Sustainability: Policies and Initiative 358 13.6 Urban Governance 361 13.7 Partnerships for Sustainable City Development 365 13.8 Conclusions 376 14. Taipei Metropolitan Area, Chinese Taipei ...................................................378 Wei-Bin Chen and Brian H. Roberts 378 14.1 Introduction 378 14.2 The Economy 381 14.3 Strategic infrastructure and Assets 390 14.4 Planning, Environmental and Urban Governance Systems 394 14.5 Sustainable Development Initiatives 395 14.7 Metropolitan Partnerships 401 14.8 Conclusions 404 15. I-5 Highway Corridor (Seattle–Vancouver) .................................................406 Richard McAlary 406 15.1 Introduction 406 15.2 Economic Dynamics 409 15.3 Strategic Infrastructure 419 15.4 Social and Environmental Sustainability 427 15.5 Urban Governance and Planning 430 15.6 Partnerships for Sustainable Development 434 15.7 Conclusions 437 16. Sustainable Development Agenda for APEC Cities ....................................439 Brian Roberts, Michael Lindfield and Florian Steinberg 439 16.1 Findings from the Case Studies of APEC Cities 439 16.2 Need for a New Agenda for APEC Cities 446 16.3 Principles Underpinning a Sustainable Development Agenda for APEC Cities 447 16.4 Five Agendas to Shape Partnerships for Sustainable Cities 449 16.5 Vision and Agenda for Sustainable City Development 465 16.6 Priority Actions for an APEC Cities Partnership Initiative 467 16.7 Roadmap for APEC Partnerships for Inclusive and Sustainable Growth 469 16.8 Implementing the Sustainable Cities Agenda for the APEC Region 471 16.9 Concluding Remarks 472 17. Notes .................................................................................................................475
v
LIST OF TABLES Table 1.1 Urban Population of APEC Member Economies, millions, 2000–2050 ................................ 4 Table 1.2 Urban Population Growth Rates in APEC Member Economies, percentage, 2000–2050 ..... 5 Table 1.3 Population in APEC Member Economies by City Size as a Percentage of the Total World Urban Population, 2015 ..................................................................................................... 9 Table 1.4 Potential for Developing Multilevel Partnerships within Cities in APEC ............................ 33 Table 1.5 Potential for Strategic Partnerships between Cities in the APEC Region ............................ 34 Table 2.1 Key Economic Facts – Auckland ......................................................................................... 41 Table 2.2 Economic Competitiveness of Auckland, Melbourne and Sydney, 2013 ............................. 45 Table 2.3 Employment by Sector for Auckland Subregions, 2010 ...................................................... 46 Table 2.4 Employment Location Quotients (LQs) for Employment Regions, 2010 ............................ 48 Table 2.5 Inventory of Auckland’s Strategic Assets ............................................................................ 50 Table 2.6 Targets for Emissions Reduction, Auckland City ................................................................ 54 Table 2.7 Population and Ethnic Structure of Auckland, 2001–2013 .................................................. 55 Table 2.8 Examples of Partnerships for Sustainable Development, Auckland City ............................. 62 Table 3.1 Area, Population and Urban Density for the Bandung Metropolitan Area ........................... 71 Table 3.2 Key Economic Facts – Bandung .......................................................................................... 72 Table 3.3 Economic Competitiveness of Singapore, Jakarta, Surabaya and Bandung, 2013 ............... 75 Table 3.4 Location Quotient (LQ) of Economic Sectors in Bandung City, 2008–2011 ....................... 76 Table 3.5 Contribution of Small- and Medium-sized Enterprises (SMEs), Bandung .......................... 79 Table 3.6 Inter-municipality Cooperation, Bandung ............................................................................ 81 Table 3.7 International Cooperation, Bandung ..................................................................................... 82 Table 3.8 Status of Physical Infrastructure and Assets in Bandung City ............................................. 85 Table 3.9 Human Development Index (HDI) for Bandung City, 2006–2013 ...................................... 89 Table 3.10 Employment Conditions in Bandung City, 2008–2012 ...................................................... 90 Table 3.11 Employment by Sector of Persons Age 10+, Bandung City, 2012 ..................................... 90 Table 3.12 Local Partnerships for Sustainable Development in Bandung City .................................... 95 Table 3.13 Partnership Opportunities for Sustainable Development in Bandung City ........................ 96 Table 4.1 Features of the Southern Economic Corridor ..................................................................... 122 Table 4.2 Key Economic Facts – Bangkok, Phnom Penh, Ho Chi Minh City ................................... 124 Table 5.1 Key Economic Facts – Greater Brisbane ............................................................................ 132 Table 5.2 Structure of the Brisbane Region Economy, 2000/01–2010/11 ......................................... 133 Table 5.3 Employment Trends in Greater Brisbane ........................................................................... 138 Table 6.1 Annual GDP Growth Rate in the Jing-Jin-Ji Region, percent ............................................ 161 Table 6.2 Official Resident Population of the Jing-Jin-Ji Region, 2012 ............................................ 163 Table 6.3 Key Economic Facts – Jing-Jin-Ji Region, 2013 ................................................................ 164 Table 6.4 Key Industrial Sectors in the Jing-Jin-Ji Region, 2014 ...................................................... 165 Table 7.1 Main Trading Destinations of Container Cargo at Hibiki Container Terminal, 2014 ........ 190 Table 7.2 Employment Trends in Kitakyushu, by Sector, percent ..................................................... 194 Table 7.3 Employment Creation in Kitakyushu, 2008–2011 ............................................................. 195 Table 7.4 Evaluation of the Kitakyushu Environmental Model City Basic Plan................................ 197 Table 8.1 Economic Competitiveness of New York and Lima, 2012 ................................................ 204 Table 8.2 Key Economic Facts – Lima .............................................................................................. 206 Table 8.3 Clusters in the City of Lima ............................................................................................... 215 Table 8.4 Lima’s Required Logistics Investment ............................................................................... 217 Table 8.5 Lima’s Mega-Projects ........................................................................................................ 220 Table 9.1 Key Economic Sectors – Metro Manila, 2014 .................................................................... 229 Table 9.2 Economic Competitiveness of New York, Singapore and Manila, 2012 ........................... 232 Table 9.3 Operating Economic Zones in the Philippines, 2015 ......................................................... 236 Table 9.4 Employment by Sector, Philippines ................................................................................... 243 Table 10.1 Key Economic Facts – Mexico ......................................................................................... 258 Table 10.2 Employment, Regional Shift and Location Quotient (LQ), by Industry Sector, in the Federal District and the Central Region, 2013 ............................................................... 261 Table 10.3 Economic Competitiveness of New York, Los Angeles and Mexico City, 2012 ............. 267 Table 11.1 Key Economic Facts – Pearl River Delta, 2013 ............................................................... 284
vi
Table 11.2 Key Industrial Sectors in the Pearl River Delta, 2014 ...................................................... 286 Table 11.3 Total Imports and Exports of Goods for Hong Kong, China, million USD, 2013 ........... 287 Table 11.4 Clusters in the Cities of the Pearl River Delta .................................................................. 293 Table 11.5 Key Transport Infrastructure Investments in the Pearl River Delta.................................. 298 Table 12.1 Key Economic Facts – Santiago ....................................................................................... 314 Table 12.2 GDP by Sector, Santiago Metropolitan Region, 2011 ...................................................... 316 Table 12.3 Economic Competitiveness of New York, Buenos Aires and Santiago, 2012 ................. 317 Table 12.4 Exports by Industry Sector, Santiago Metropolitan Region, million USD ....................... 318 Table 12.5 Value of Exports from the Santiago Metropolitan Region, by Geographical Zone, million USD ................................................................................................................... 319 Table 12.6 Infrastructure Deficit Projection in Santiago .................................................................... 323 Table 12.7 Examples of Sustainable Development Partnerships, Santiago Metropolitan Region ...... 333 Table 12.8 Sister City Partnerships for Santiago ................................................................................ 336 Table 13.1 Estimated Population of Seoul and the Seoul Metropolitan Area, 2011–2014................. 341 Table 13.2 Key Economic Facts – Seoul and Seoul Metropolitan Area............................................. 343 Table 13.3 Number/Share of Establishments and Annual Growth Rate by Industry, Seoul, 2010 and 2013 ......................................................................................................................... 343 Table 13.4 Exports, Imports and Growth Rates by Economy, Seoul, 2014 ....................................... 345 Table 13.5 Industrial Specialization and Competitiveness by Industry, Seoul, 2013 ......................... 345 Table 13.6 Applications for Intellectual Property, Seoul, 2007–2013................................................ 347 Table 13.7 New Business Formations, Seoul, 2013 ........................................................................... 347 Table 13.8 Transportation Mode Share in Seoul, percent .................................................................. 349 Table 13.9 Evaluation Indicators of Seoul’s Sustainable Development ............................................. 360 Table 13.10 Examples of Partnerships for Sustainable Development ................................................ 366 Table 13.11 Resolving Conflicts between Major Stakeholders of the Yonsei-Ro Transit Mall Project, Seoul ................................................................................................................. 368 Table 14.1 Key Economic Facts – Taipei Metropolitan Area ............................................................ 382 Table 14.2 Output by Industry, Taipei Metropolitan Area, 2014 ....................................................... 383 Table 14.3 Economic Competitiveness of Taipei ............................................................................... 383 Table 14.4 Unemployment Rate in the Taipei Metropolitan Area, 1995–2014.................................. 385 Table 14.5 Trends in Average Annual Household Income for the Taipei Metropolitan Area, 2001– 2013................................................................................................................................ 385 Table 14.6 Employment Location Quotient (LQ) for Industry Sectors, Taipei Metropolitan Area ... 386 Table 14.7 Employment by Sector, Taipei Metropolitan Area ........................................................... 388 Table 14.8 Sector Missions of the New Taipei City Sustainable Development Commission ............ 400 Table 15.1 Population of the Pacific Northwest Metro Area, 2015 .................................................... 408 Table 15.2 Metro Labour Force (Non-Farm Employment), I-5 Corridor, March 2015 ..................... 411 Table 15.3 Estimated Gross Metropolitan Product (GMP), I-5 Corridor, 2014 ................................. 412 Table 15.4 Estimated Valuation for Exports, I-5 Corridor, 2014 ....................................................... 412 Table 15.5 Largest Export Sector by Metro Area, I-5 Corridor, 2014 ............................................... 413 Table 15.6 Key Economic Facts – United States and Canada, April 2015 ......................................... 413 Table 15.7 Enrolment of Selected Universities within the I-5 Corridor, 2014–2015 ......................... 416 Table 15.8 Distance between Downtown Seattle and Other I-5 Corridor Cities ................................ 429 Table 16.1 Examples of Development Partnerships from the Case Studies of APEC Member Economies ...................................................................................................................... 444
vii
LIST OF FIGURES Figure 1.1 Asia-Pacific Region and APEC Member Economies ........................................................... 1 Figure 1.2 Expected Growth in Cities by Size in APEC Member Economies, 2015–2025 ................... 8 Figure 1.3 Emerging Urban Economic Development Corridors HCMC, Viet Nam ............................ 17 Figure 1.4 Five Key Transactional Elements of a Sustainability Framework for Cities ...................... 21 Figure 2.1 Breakdown of GDP (percent) of Auckland’s Economy ...................................................... 42 Figure 2.2 Key Economic Growth Sectors of Auckland Economy, million NZD, 2010 ...................... 44 Figure 2.3 Employment Regions in the City of Auckland ................................................................... 47 Figure 2.4 The Influence of Infrastructure in Auckland ....................................................................... 52 Figure 2.5 Monitoring and Evaluation Framework of the Auckland Plan ............................................ 60 Figure 2.6 Ten-year Forecast for Assets and Liabilities, Auckland City .............................................. 61 Figure 2.7 Auckland’s Formal Partnerships ......................................................................................... 63 Figure 3.1 Growth of the Bandung Urban Area, 1991–2012 ............................................................... 71 Figure 3.2 Economic Structure of Bandung City, 2008–2012, based on current prices ....................... 73 Figure 3.3 Export Commodities of Bandung City in 2012, percent ..................................................... 74 Figure 3.4 Industries and Universities in Bandung............................................................................... 77 Figure 3.5 The Focus on Infrastructure Development in Bandung’s Medium Term Development Plan (RPJMD) 2013–2018 ............................................................................................... 86 Figure 3.6 Bandung City Vision – City Spatial Plan and Local Development Plans ........................... 92 Figure 3.7 Revenue Projection for Bandung City, 2014–2018, in billion IDR .................................... 93 Figure 4.1 The Southern Economic Corridor (SEC) of the Greater Mekong Subregion (GMS)........ 102 Figure 4.2 Connecting Bangkok, Phnom Penh and Ho Chi Minh City – The Southern Economic Corridor (SEC): The Viet Nam and Cambodia Connection ........................................... 103 Figure 4.3 Bangkok Regional Plan 2057 ............................................................................................ 110 Figure 5.1 Twelve Local Governments of the Greater Brisbane or Southeast Queensland (SEQ) Region ............................................................................................................................ 130 Figure 5.2 Export Value By Industry, Brisbane Local Government Area, 2011–2031 ...................... 134 Figure 5.3 Map of South East Queensland ......................................................................................... 147 Figure 5.4 Australia Trade Coast and its 32 Development Precincts ................................................. 152 Figure 6.1 Main Transportation Infrastructure in Jing-Jin-Ji Region ................................................. 170 Figure 6.2 High-Speed Railway Network in Jing-Jin-Ji Region ........................................................ 171 Figure 7.1 Map of City of Kitakyushu ............................................................................................... 185 Figure 8.1 The Dominance of Lima in Peru’s Economy, GDP by Region ......................................... 208 Figure 8.2 Production Growth Rates in Peru, by Region ................................................................... 208 Figure 8.3 Economic Activities in Lima, 2012 ................................................................................... 209 Figure 8.4 Traditional Centres of Lima’s Urban Economy ................................................................ 212 Figure 8.5 Lima: Local Productive Development Policies ................................................................. 213 Figure 8.6 Peru’s Logistics Nodes ...................................................................................................... 216 Figure 8.7 Lima’s Complementary Vital Corridors............................................................................ 218 Figure 9.1 Map of Metro Manila ........................................................................................................ 227 Figure 9.2 Mega Manila Urban Region .............................................................................................. 229 Figure 9.3 Philippines Export and Imports ......................................................................................... 231 Figure 9.4 Doing Business in the Philippines: Major Issues and Barriers .......................................... 234 Figure 9.5 Business Process Outsourcing (BPO) and Information Technology (IT), 2004-–2011 .... 236 Figure 9.6 Intra-urban Region Inequity (Gini Coefficients) ............................................................... 245 Figure 9.7 Baseline Greenhouse Gas Emissions Estimates for the Power and Transport Sectors, Philippines ...................................................................................................................... 248 Figure 9.8 Institutional Structure for Delivering Urban Development ............................................... 249 Figure 9.9 The Triangle Park, Quezon City (Proposed Plan) ............................................................. 251 Figure 10.1 Map of the Central Region, Mexico ................................................................................ 256 Figure 10.2 Breakdown of GDP (%) of Mexico’s Economy, First Quarter 2015 .............................. 259 Figure 10.3 Mexico’s Trade, by Region/Economy, 2014 ................................................................... 262 Figure 10.4 Mexico’s Trade with Asia, by Economy, billion USD, 2014 .......................................... 263 Figure 10.5 Foreign Direct Investment (FDI) Flows into Mexico, by Economy, billion USD, 2014 265
viii
Figure 10.6 Map of Mexican Road Corridor to the NAFTA Region ................................................. 268 Figure 10.7 Map of Mexico City’s Urban Footprint and Its Local Government Boundaries ............. 274 Figure 11.1 Nine Policy Zones in the Pearl River Delta .................................................................... 282 Figure 11.2 Hong Kong, China’s Imports by Origin (right) and Domestic Exports by Destination (left), 2013 ...................................................................................................................... 288 Figure 11.3 Relocation of Industry from Hong Kong, China ............................................................. 289 Figure 11.4 Cross-Boundary Transportation Facilities in the Greater Pearl River Delta City–Region 297 Figure 11.5 Development of the Regional Intercity Railway Network, Guangdong .......................... 301 Figure 11.6 Government Structure in the Pearl River Delta (PRD) ................................................... 304 Figure 11.7 Outbound High-Speed Railways of the Greater Pearl River Delta Region ..................... 306 Figure 11.8 Institutional Arrangements for Railway Development in the Pearl River Delta through Province–Ministry Cooperation ..................................................................................... 307 Figure 12.1 Map of Santiago Metropolitan Region ............................................................................ 311 Figure 12.2 Regional Metropolitan Highway Network ...................................................................... 321 Figure 12.3 Infrastructure and Social Development Needs, Santiago ................................................ 324 Figure 12.4 Labour Market Occupied Persons by Occupational Category, Santiago Metropolitan Region ............................................................................................................................ 326 Figure 12.5 Human Development Index of Santiago by Commune (District) .................................... 327 Figure 12.6: Santiago Local Government Communes (Districts) ....................................................... 332 Figure 12.7 Bi-oceanic Corridors: Pacific–Atlantic Axes in the 1990s .............................................. 336 Figure 13.1 GRDP of Seoul and the Seoul Metropolitan Area, million USD, 2005–2013 ................ 342 Figure 13.2 Proposed Light Rail Lines in Seoul ................................................................................. 351 Figure 13.3 Nambu Express Line (Proposed)..................................................................................... 352 Figure 13.4 Shin Bundang Extension Line (Proposed) ...................................................................... 352 Figure 13.5 KTX Extension Line (Proposed) ..................................................................................... 353 Figure 13.6 Employment and Unemployment Rates, Korea .............................................................. 356 Figure 13.7 Percentage of Workers by Industry, Seoul ...................................................................... 357 Figure 13.8 Plans to Guide Development in Seoul ............................................................................. 364 Figure 13.9 Promotion Committee for the Yonsei-ro Transit Mall Project, Seoul ............................. 368 Figure 13.10 Energy-Independent Villages in Seoul .......................................................................... 371 Figure 13.11 Power Savings in 2013 and 2012, Seoul and the Energy-Independent Villages ........... 373 Figure 13.12 Establishments in the Manufacturing Industry by Neighbourhood (Dong), Seoul, 2011................................................................................................................................ 374 Figure 13.13 Trends in Establishments and Workers at the Seoul Digital Industrial Complex ......... 375 Figure 14.1 Taipei Metropolitan Region ............................................................................................ 379 Figure 14.2 Population Trends, Taipei Metropolitan Area, 1995–2014 ............................................. 380 Figure 14.3 Distribution of Industries, Taipei Metropolitan Area ...................................................... 387 Figure 14.4 Taipei Mass Rapid Transit (MRT) System, 2017 ........................................................... 391 Figure 14.5 Taipei Riverside Bike Parkway Map............................................................................... 392 Figure 14.6 Organizational Structure of the New Taipei City Sustainable Development Commission ................................................................................................................... 399 Figure 15.1 Map of the I-5 Corridor (Seattle–Vancouver) ................................................................. 406 Figure 16.1 Roadmap for Building Better Partnerships for Inclusive and Sustainable Growth of Cities in the APEC Region ............................................................................................. 470
ix
LIST OF PHOTOS Photo 1.1 Expansion of Chinese Cities: Tianjin South ........................................................................... 7 Photo 1.2 Lights Showing Emerging Corridors of Cities in South America (left) and East Asia (right) ................................................................................................................................. 8 Photo 1.3 Slum Settlements: A Major Challenge to Improving Living Conditions in Some APEC Economies ........................................................................................................................ 24 Photo 2.1 Auckland City ...................................................................................................................... 39 Photo 2.2 Wynyard Quarter Rejuvenation Project, Auckland .............................................................. 64 Photo 3.1 Pasupati Bridge, Bandung City ............................................................................................ 69 Photo 3.2 Bandung Command Centre .................................................................................................. 84 Photo 4.1 Bangkok’s Old City Centre ................................................................................................ 105 Photo 4.2 Phnom Penh – City Centre near the Tonle River ............................................................... 112 Photo 4.3 Ho Chi Minh City – Central Area ...................................................................................... 116 Photo 5.1 Brisbane Central Business District (CBD) ......................................................................... 129 Photo 5.2 Port of Brisbane, Brisbane Airport and the Australia Trade Coast Area ............................ 140 Photo 5.3 Powerhouse Brisbane – From Power Station to Arts and Cultural Facility ....................... 154 Photo 7.1 City of Kitakyushu ............................................................................................................. 183 Photo 7.2 Overcoming Severe Environmental Pollution, City of Kitakyushu ................................... 184 Photo 7.3 Refurbished Wine Bar in Kitakyushu City’s Central Business District (CBD) ................. 198 Photo 8.1 Larcomar Shopping Mall, Miraflores, Lima – A Commercial Highlight ........................... 203 Photo 8.2 San Isidro’s Financial District ............................................................................................ 214 Photo 9.1 Metro Manila ...................................................................................................................... 228 Photo 10.1 City Centre of Mexico City– Main Square with City Hall and Cathedral ........................ 254 Photo 10.2 Reforma Street (left) and Santa Fe Business District (right) in Mexico City ................... 257 Photo 10.3 Mexico City’s Metro (left) and Metrobus (right) ............................................................. 269 Photo 10.4 Suburban Train in Mexico City ........................................................................................ 276 Photo 11.1 Macau Central District ..................................................................................................... 281 Photo 12.1 Sanhattan Business District, Santiago, Chile ................................................................... 312 Photo 13.1 Central Seoul .................................................................................................................... 340 Photo 13.2 High Concentrations of Solar Power Panels Installed on Homes in Shipjaseong Village 370 Photo 14.1 Taipei: A Metropolitan River City ................................................................................... 378 Photo 14.2 Taipei 101 Tower ............................................................................................................. 384 Photo 15.1 Seattle Space Needle ........................................................................................................ 410 Photo 15.2 False Creek, Vancouver ................................................................................................... 414 Photo 15.3 Aerial View of Vancouver ............................................................................................... 422 Photo 15.4 Ships Awaiting Loading, English Bay, Vancouver .......................................................... 423 Photo 15.5 Seatle Waterfront ............................................................................................................. 425 Photo 15.6 Portland Waterfront .......................................................................................................... 433
x
ABOUT THE CONTRIBUTORS Editors Professor Brian H. Roberts is Emeritus Professor at the University of Canberra and Director of Urban Frontiers and an expert in urban management based in Brisbane, Australia. Dr Michael Lindfield is an urban management specialist and Director of Urban Infrastructure Services, based in Sydney, Australia. Dr Florian Steinberg is a senior urban management specialist and consultant for development agencies worldwide, based in Pereira, Colombia.
Authors Dr John Abbott holds a PhD in urban and regional planning. He lecturers in urban and regional planning at the University of Queensland and is the Principal of John Abbott Planning. Michelle Addison holds qualifications in geographical sciences and environmental management from the Queensland University of Technology and Griffith University. She is Director of Michelle A. Addison Consulting. Marcela Allué holds qualifications in economics and business from Pontificia Universidad Católica de Chile and Universidad del Desarrollo, Chile. She is General Manager of the Asociación de Concesionarios de Obras de Infraestructura Pública Chile. Dr Jun-Ski Bae has a PhD in public economics in the defence sector from the University of York. Dr Bae is a Research Fellow at the Seoul Institute. Dr Miree Byun holds a PhD in sociology and is Director of the Department of Future and Social Policy Research at the Seoul Institute. Dr Wei-Bin Chen is Assistant Professor at the Chinese Cultural University and holds a PhD in city and regional planning from the Ohio State University. Holly Xueyao Duan has a master’s degree in urban and regional planning from the University of Sydney. She holds qualifications in environmental management and development and forestry economics and management from the Australian National University and Beijing Forestry University. Theresa Esteban holds a master’s degree in urban management and development with a specialization in urban governance. She has 17 years’ experience in urban planning and development, and has managed projects throughout Asia. xi
Dr Shu-Li Huang graduated with a PhD in urban planning from the University of Pennsylvania and is a lecturer at the Graduate Institute of Urban Planning at National Taipei University. Soo-Hyun Kim is President of the Seoul Institute and conducts surveys and studies on urban development for Seoul. Dr Inhee Kim has a PhD from the Institute of Urban and Regional Planning at Technische Universität Berlin. Dr Kim is Director of the Office of Research and Coordination at the Seoul Institute. Dr Mook Han Kim holds a PhD in planning and public policy from Rutgers, The State University of New Jersey. Dr Kim is a Research Fellow at the Seoul Institute. Juana Kuramoto Huamán has a background in economics and political and public administration from the University of Lima and Carnegie Mellon University. She is Director of Policy and Programs for Concytec, which is involved in scientific, technological and innovation development in Peru. She is also a Research Associate with the Group for the Analysis of Development (GRADE) in Peru. Alain Maulion is an international consultant on competitiveness and inclusive growth with experience in policy research and development. Geographical areas of focus include cities, towns, community enterprises, industries in the Philippines and the Asia-Pacific. Richard McAlary is an international consultant in urban and regional economics. He is Past President of the Association of Professional Economists of British Columbia and has published extensively in his field. He was educated at the University of New Brunswick and Carleton University. Wahyu Mulyana is an urban planner and development expert specializing in urban development, environmental management, and strategic planning for local development. He is Executive Director of the Urban and Regional Development Institute (URDI) in Jakarta, Indonesia. Dr Hitomi Nakanishi holds a doctorate in urban and regional planning and is Assistant Professor at the University of Canberra. She has over 100 publications in the field of planning. Dr Aijun Qui is Deputy Director General of the China Centre for Urban Development (CCUD), National Development and Reform Commission (NDRC). Fernando Ramirez is Director of Real Sustainability, an economic consulting firm, and is an advocate of responsible economic development. His experience includes consulting on urban economics, lecturing at Anahuac University, analysing the Mexican financial sector and serving as policymaker for the Australian Capital Territory’s Treasury in Canberra. Simone Roberts holds qualifications in community development and urban and regional planning from the University of Canberra and the University of Queensland. She is a xii
researcher with Urban Frontiers and is currently Social Planning Consultant with Urbis in Brisbane. Dr Hisashi Shibata has a doctorate in engineering from the Tokyo Institute of Technology and is a professor in the Department of Civil Engineering at Fukuoka University. José Tomás Videla is an architect and holds qualifications in sustainability, management and urban and regional planning, with experience in Chile, Spain, Viet Nam, Japan and Australia. Dr Wicaksono Sarossa is an urban and regional planner, teacher and consultant. He chairs the Executive Board of Kemitraan Habitat, Indonesia. He was formerly Director of URDI and has worked extensively on urban and regional policy and development studies in Indonesia and other economies in the region. Dr Chang Yi holds a PhD in urban planning from the University of Austin and is an Associate Research Fellow at the Seoul Institute.
xiii
ACKNOWLEDGEMENTS The editors would like to express their appreciation to the following for their inputs in preparing the various chapters: Ms Rosalie Roberts of Urban Frontiers; Professor Leslie Chenoweth, Griffith University; Professor Bob Stimson, University of Melbourne; Mr Michael Kerry, THG Resource Strategists; Mr Tony Duncan, Duncan Planning Consultants; Professor Harvey C. Perkins, University of Auckland; Mr John Courtney, China Specialist, Sydney; Mr Richard Harris of Jasmax Architects, Auckland and Mr Suparb Treethanya, Department of Public Works and Town and Country Planning, Thailand. The editors are also grateful for the considerable support given by the APEC Secretariat in Singapore, especially Dr Denis Hew Wei Yen, Mr Emmanuel A. San Andres, Ms Bernadine Zhang Yuhua and Mr Carlos Kuriyama. Excellent copyediting was provided by Ms Yen Ong. The authors of Chapter 7 wish to thank the City of Kitakyushu and the Ministry of Economy, Trade and Industry (METI) of Japan for providing materials and advice during the preparation of the chapter.
xiv
PREFACE Over the past three decades, cities in the Asia-Pacific region have experienced unprecedented economic growth and development. Until the global financial crisis in 2007, it seemed that nothing could slow their development. The global financial crisis and the slowdown of the Chinese economy, however, has had a profound impact: the region’s cities face a range of challenges related to slower investment growth and job creation, and an increasing shortage of housing and basic services. Factors such as climate change, security issues, and increasing disparities between personal and regional wealth, development, and quality of life are also having a big impact on shaping the agenda for the future development and management of cities in the region. The pressures since the global financial crisis have given rise to a period of reflection and debate by governments and communities about the sustainability of urbanization and economic development of cities in the region. Fresh approaches are needed to the way cities are managed and developed to ensure their future prosperity, quality of life and the sustainable use of resources. This calls for governments and cities to work more cooperatively and collaboratively in fostering the development of partnerships for urban governance, trade, investment, services delivery, and human capital development, and for resolving environmental problems. This is central to APEC’s agenda for sustainable urbanization and the development of cities in the region. Partnerships involving collaboration is a new business model for development as we move towards a more sharing global economy. Such partnerships are not just local; they involve governments, business and communities working together to overcome common problems and issues and to improve service delivery. The new model of partnership involves various levels of government collaborating domestically and internationally through networks, alliances and associations to address the complex sets of problems that are common to many cities, and to foster the expansion of knowledge, trade, investment and other exchanges that benefit the development of communities, and especially wealth creation and jobs. This book explores the ways cities in the region are supporting partnerships for sustainable development. It builds on previous APEC work on sustainable urbanization, using 14 case studies to assess economies, infrastructure, social and environmental systems and urban governance. The case studies evaluate cities at secondary city, metropolitan region, and regional economic tradecorridor levels. The book will contribute to existing knowledge on ideas and practices that can help build more sustainable cities and economies in the region. It will be of interest to community leaders, administrators, business, and academics. The lessons outlined will have relevance for governments, other public policy organizations and business, for infrastructure investment, and for managing structural and technological change, the development of human capital and fostering improvements in the quality of life. These lessons provide the basis for an action agenda under APEC’s Asia-Pacific Partnership on urbanization and sustainable cities development.
i
KEY FINDINGS AND RECOMMENDATIONS The Asia-Pacific region comprises 46 economies and has the largest geographic concentration of population, wealth and urban settlements on earth. The region includes some of the fastest-growing and most developed economies and cities in the world. Cities in the region constitute around 80 percent of economic product in most member economies. Unfortunately, the rapid development of the Asia-Pacific region has resulted in significant and manifest growth management challenges for cities across the economic, social and environmental dimensions of sustainability. Overcoming these challenges will be difficult. Given the complexity and scale of many of these challenges, governments and cities will need to work much more collectively to address them. The sustainable development of APEC cities should thus constitute an issue to be addressed at the highest level of government. APEC, as the representative organization for 21 economies in the region, should play a leading role in facilitating partnerships for the development of sustainable cities. This report uses a case study approach to develop a framework for an initiative by APEC to help realize the vision for Building Better Partnerships for Inclusive and Sustainable Urban Growth in Cities in the Region. Primary action agendas This report identifies five primary action agendas focused on the economic, physical, social, natural (environmental) and governance spheres. These five agendas are all equally important for improving the sustainability of development in the cities of APEC member economies. While cities in the region will have their own priorities when it comes to implementing the agendas, they will have many agenda items in common. Given the wide range of experience available – with some cities displaying very good practice – there is scope for learning from each other. Partnerships constitute an effective way of disseminating that learning and supporting the adoption of best practice across a range of agendas. Priority partnerships A wide range of partnership arrangements exist – from city-specific ones to those at the multilateral level. These could be significantly enhanced through support by APEC member economies, to the benefit of their economies and that of the region. APEC and its Secretariat could support priority partnerships as part of an initiative focused on Building Better Partnerships for Inclusive and Sustainable Urban Growth of Cities in the Region initiative. This report identifies key areas meriting such priority support:
ii
Partnerships to Lift Economic Performance and Trade: While urban areas and systems could help lift economic outcomes at the regional or member-economy level, the city case studies in this report and the literature have found limited evidence of them doing so. The case studies present good examples of sustainable development practices; but very few have been expanded to a city, or system of
cities, scale. The development of economic industry clusters, corridors and city to city economic linkages across urban systems will be central to scaling up such partnerships. The Jing-Jin-Ji, Pearl River Delta, Vancouver–Seattle, Ho Chi Minh City and Mercosur trade development corridors provide relevant lessons in the management, financing, and development of such corridors and systems. Partnerships to Foster Sustainable Urban Forms: Many cities have evolved toward lower density, high carbon and dispersed forms of urban development which are environmentally unsustainable and economically inefficient. Shortfalls in metropolitan planning, in particular, the lack of integration of land-use and transport/logistics solutions, and in governance are the primary cause of such problems. The chapters on Mexico, Lima, Auckland and Manila show that urban sprawl is responsible for issues associated with congestion and adding to the costs for business, government and communities. Increasing urban density and consolidation of development is vital to improving the sustainability of development across the region. Partnerships to Support Development of Strategic Infrastructure: The governance agenda should promote partnerships for strengthening programme development and implementation mechanisms for strategic infrastructure, and for addressing systemic faults related to preparing, financing and implementing investments needed for sustainable development. Infrastructure investment tends to be opportunistic and ad hoc and lacks the context of a ‘nested’ set of plans at the member-economy, regional and local levels together with integrated metropolitan asset management plans. Private-sector and community inputs are not systematically and equitably canvassed in respect of such investments. Partnerships for Financing Investment for Sustainable Development: Urban governments do not have revenue-raising mandates in line with city infrastructure needs. Local governments have no incentive to maximize tax yields or leverage private and community resources. Funding requirements, in many cases, are unknown. Strategic and asset management plans seldom exist; where they do exist, the investment required has not been adequately estimated. Enterprises in secondary cities often have less access to funding; and micro, small and medium enterprises suffer restricted access to funding no matter where they are located. Supporting these initiatives will be Partnerships to Enhance City Information, Trade Data, and Asset Management Systems: For trade and investment to grow, information, trade, services and infrastructure need to be more closely integrated, and the nature, volume, capacity and spatial identity of assets and value-adding inputs to production and waste streams better known.
Key Recommendations The economic planning ministries of APEC member economies could develop dedicated units capable of analysing urban economic systems and of fostering best practices in sustainable urban development. The focus should be on providing appropriate enabling frameworks for acquiring, adapting and implementing best practices through supporting effective partnerships with cities, communities and the private sector. The implementation of best practices should extend across the various systems – planning; iii
project development and assessment; project procurement; and finance. Improving only one area is unlikely to improve outcomes. APEC should support the development of such capacity. Responsible ministries should tap the substantial body of expertise in academic and policy institutions. The APEC Secretariat should form a Sustainable Urban Development group to coordinate activities to implement an urban agenda. The representatives of this group would be drawn from the economic planning ministries of member economies, or their nearest equivalent having a strategic overview of city infrastructure needs. The group would report directly to the Senior Officials Meeting owing to its cross-cutting nature and the potential involvement of several committees of APEC. The activities of the group would fall into two areas. The first would entail the formation of advisory groups for the five agenda areas. The second, and related, activity area concentrates on priority actions for partnership initiatives. These activities could be coordinated by a small ‘Initiative Secretariat’, which would also act as the repository of data on APEC urban systems. In conclusion, because of the economic importance of cities to member economies, the issue of sustainable urban development is one to be addressed at the highest level of government, in partnership with all levels of government. Only such a coordinated and collaborative approach will enable the expansion and development of trade, and the proactive adaptation to new models of economic development and to new technologies. The report makes the following recommendations:
APEC, through the Friends of the Chair meetings on urban issues, should create an initiative aimed at Building Better Partnerships for Inclusive and Sustainable Urban Growth of Cities in the Region. The APEC Secretariat is mandated by the Friends of the Chair to implement the four key partnership initiatives and the collaborative arrangements required for better data collection. The APEC Secretariat publishes this report to support the launch of the Building Better Partnerships for Inclusive and Sustainable Urban Growth of Cities in the Region initiative.
iv
EXECUTIVE SUMMARY The Asia-Pacific region comprises 46 economies and has the largest geographic concentration of population, wealth and urban settlements on earth. The region includes some of the fastest-growing and most developed economies and cities in the world. The rapid development and urbanization in the region have created significant growth management challenges for cities. Overcoming these challenges will be difficult. Given the complexity and scale of many of these challenges, governments and cities will need to further work collectively to address them. APEC is well-placed to play a role here. APEC represents 21 economies in the region, including the world’s three largest economies – the USA; China; and Japan. APEC’s primary goal is to support sustainable economic growth and prosperity in the region, but its focus extends into social, environmental and governance issues affecting the development of its member economies. In 2015, the APEC region’s vision was expanded to embrace economic prosperity and interconnectedness at all levels – beginning at the grassroots. As regional economic integration continues, APEC policies and initiatives will also be implemented through its inclusive growth strategy for the benefit of its members’ economies and their people. Most of these people live and work in the region’s cities. Over the past three decades, cities in the Asia-Pacific region, and especially those in the APEC member economies, have experienced unprecedented economic growth and development. The 21 APEC economies account for approximately 42 percent of the world’s population, 57 percent of the world’s total GDP and 44 percent of global trade. In 2014, APEC GDP was estimated at USD 41 trillion, based on purchasing power parity (PPP). APEC member economies include half the world’s megacities, 22 (55%) of the world’s cities with populations of 5–10 million, 185 (41%) of the cities with populations of 1–5 million, and 284 (48%) of the cities with populations of 0.5–1 million. These percentages are expected to increase slightly over the next three decades, as population growth and urbanization rates rise. The rapid development comes at an environmental cost, with growing exposure to risks. Until the global financial crisis, it seemed nothing could slow the momentum of development in the region. However, the crisis and the slowdown in the Chinese economy have had a profound impact on the performance and development of economies and cities in the region. Population and economic growth rates have slowed. The region’s cities face a range of development, environmental, social and political challenges. Factors such as climate change, terrorism, and security issues; increasing income and wealth disparities between cities and communities; rising poverty; unemployment; and inadequate affordable housing are increasingly shaping the agenda for the future development and management of cities in the direction of sustainability and change. The pressures facing the development of APEC member economies have given rise to a period of reflection and debate about the sustainability of urbanization and economic development of cities by member economies at various levels of government and v
community. The region’s cities are not producing the economic growth, jobs and wealth they once did. The model to achieve competitive advantage which focused on developing strong agglomeration economies and pitching cities in competition against each other has done little to prevent a flatlining of economic growth. Climate change, congestion, pollution, urban sprawl, and issues such as renewable resources and future energy needs, are giving rise to broad-ranging debates across the region on sustainable city development and ways to achieve it. Fresh approaches are needed in the way APEC member economies develop their economies and manage their cities. This is vital to ensure the resilience of cities, to maintain prosperity, ensure a better quality of life for citizens and make cities more efficient. As APEC member economies move toward a development model based on the concept of a sharing economy, governments will need to work more cooperatively and collaboratively with each other, with business and with their communities to foster sustainable regional and local economic and social development. This model of development will lead to the development of a broad range of partnerships to support urban governance, trade, investment, services delivery, human capital development and environmental management. APEC could play a useful role in working with governments to facilitate partnerships supporting the sustainable urbanization and development of cities in the region. Such partnerships will involve governments, business and communities working together to innovate, to share resources and information and to raise the capital, technology and skills to overcome common problems and issues affecting the sustainable development of the region’s cities. A new model for the partnerships will involve central and city governments collaborating domestically and internationally through networks, alliances and associations to foster the expansion of knowledge, trade, investment and other exchanges that benefit the development of communities, especially wealth creation and jobs, while concurrently addressing complex problems that require a collective effort to resolve.
Purpose of the Report This report explores the ways cities in the region are supporting partnerships for sustainable development. It documents the state of urban systems and the lessons gained from the development of cities and urban corridors using case studies. The 14 case studies assess economic, physical development, social and environmental management, and urban governance systems. The case studies include secondary cities, metropolitan regions, and regional economic trade development corridors. This report builds upon previous research by APEC on shaping the future partnership for urbanization and sustainable city development between member economies. The report presents a framework for an initiative by APEC member economies for Building Better Partnerships for Inclusive and Sustainable Urban Growth of Cities in the Region.
vi
The report was prepared by a team of urban experts living in the cities of member economies. The research is intended as a knowledge document and to share ideas on good urban management practices to improve the sustainability of development of the region’s cities and their economies. The findings are expected to be of interest to a wide audience of readers – including community leaders, administrators, business and academics. The lessons presented in the report have relevance to all levels of government, policymakers, planning organizations, business, investors, and community and professional interest groups. The report highlights the importance of partnerships for advancing good urban governance; encouraging greater infrastructure investment and innovation; managing structural and technological change; improving the development of human capital; and fostering a better quality of life in cities.
Urbanization in the Regional Context Over the next 35 years to 2050, an unprecedented increase will occur in the urban population of the APEC member economies. Currently, 1.8 billion people or around 60 percent of the region’s population live in urban areas; this is expected to reach 77 percent by 2050. Table ES.1 shows urban population growth and expected trends to 2050 for APEC member economies. By 2050, the urban population is expected to increase to 2.4 billion, or by 33 percent. Some economies are more than 80 percent urbanized and many others are urbanizing rapidly. Fourteen of the world’s 37 megacities are located in APEC member economies.
vii
Table ES.1 Urban Population of APEC Member Economies, millions, 2000–2050 APEC economies Australia Brunei Darussalam Canada Chile China Hong Kong, China Indonesia Japan Korea Malaysia Mexico New Zealand Papua New Guinea Peru Philippines Russia Singapore Thailand Chinese Taipei United States Viet Nam Total urban population
2000
2005
2010
2015
2020
2025
2030
2035
2040
2045
2050
16.8 0.2
18.1 0.3
19.9 0.3
21.4 0.3
22.9 0.4
24.4 0.4
25.8 0.4
27.2 0.4
28.6 0.4
30.0 0.4
31.3 0.5
24.4 13.3 459.4
25.8 14.3 560.5
27.6 15.2 669.4
29.4 16.0 779.5
31.1 16.8 874.4
32.8 17.5 947.5
34.3 18.1 998.9
6.9
7.0
7.3
7.5
7.7
7.9
37.1 19.0 1,044. 4 8.0
38.3 19.2 1,050. 8 8.0
39.6 19.4 1,049.9
6.8
35.7 18.6 1,030. 0 8.0
87.8 98.9 36.6 14.5 77.6 3.3 0.7
103.1 109.2 38.3 17.2 84.5 3.6 0.8
120.2 115.3 39.7 20.1 91.7 3.8 0.9
137.4 118.6 41.0 22.9 99.2 4.0 1.0
154.2 119.4 42.2 25.5 106.3 4.2 1.1
170.1 118.7 43.2 28.0 113.0 4.4 1.3
184.9 116.9 44.1 30.2 119.0 4.5 1.5
198.0 114.4 44.7 32.0 124.2 4.7 1.8
209.2 111.5 45.0 33.5 128.6 4.9 2.1
219.1 108.6 45.0 34.9 132.1 5.0 2.5
227.8 105.8 44.7 36.2 134.8 5.2 3.0
19.0 37.2 107.7 3.9 19.6 15.3
20.8 40.0 105.7 4.5 24.6 16.4
22.5 42.3 105.8 5.1 29.3 17.3
24.5 45.2 105.2 5.6 34.0 18.0
26.5 48.9 104.4 6.1 37.9 18.6
28.4 53.5 103.2 6.3 41.0 19.0
30.2 59.2 101.9 6.6 43.1 19.2
31.7 65.9 100.9 6.8 44.3 19.3
33.1 73.3 100.0 6.9 44.7 19.1
34.4 80.8 99.1 7.0 44.7 18.8
35.4 88.4 98.0 7.1 44.3 18.3
225.0 19.7
238.3 23.2
252.2 27.1
265.4 31.4
278.8 35.7
292.2 39.9
305.4 43.7
317.7 47.2
329.0 50.4
339.8 53.3
350.3 55.7
1,287.7
1,456.0
1,632.6
1,807.2
1,962.9
2,092.6
2,196.0
2,273.6
2,328.9
2,372.0
2,403.8
8.0
Source: United Nations, Department of Economic and Social Affairs, Population Division, World Urbanization Prospects: The 2014 Revision (New York: United Nations, 2015).
A Region with More, Bigger, and Greying Cities APEC member economies have more than 825 cities with populations greater than 300,000 people. The pattern of urban development varies in density, rates of growth and age across the region. Most of the region’s cities are less than 100 years old. During the late nineteenth century to the latter half of the twentieth century, cities in North and South America and Japan grew rapidly, and urbanization rates peaked. Australasian cities have continued to grow steadily. Populations and cities in many APEC member economies are ageing rapidly, which will bring about significant challenges in caring for an ageing community, and historic buildings and infrastructure. Over the next three decades, urban populations in most APEC member economies are expected to live in cities of 500,000 to 1 million people. Figure ES.1 shows the anticipated growth in cities (by size) in APEC member economies between 2015 and 2025.
viii
Figure ES.1 Expected Growth in Cities by Size in APEC Member Economies, 2015–2025
400
353
350 284
300 No.
249
250 185
200 150 100 50
14
17
22
33
— 10 million or more
5 to 10 million 2015
1 to 5 million
500,000 to 1 million
2025
Source: United Nations, Department of Economic and Social Affairs, Population Division, World Urbanization Prospects: The 2014 Revision (New York: United Nations, 2015).
Many of the smaller cities (population less than 300,000) have fewer financial and physical assets, skills and resources to plan, manage and accommodate urban growth. Most will continue to struggle to attract investment, leading to a widening of the per capita income and development gap between cities. An additional 64 cities with populations of 1–5 million and 67 cities of between 0.5–1 million people are expected to be added to the region by 2050, mostly in China. Cities such as Tianjin are growing rapidly while some cities in Japan are experiencing declining populations. South America is the most urbanized part of the Asia-Pacific region, and the population of many cities there has stabilized. The dominant feature of the Asia-Pacific region is its megacities. There are 15 of them, and it is predicted that a further 17 will be added by 2025, mostly in China. Collectively, the megacities are home to 7 percent of the region’s total population or 15 percent of the urban population. Many of these large cities are expanding and merging along corridors to form supra cities of 50 million, as has occurred along the Pearl River Delta between Guangdong and Hong Kong. Other corridors of cities are developing in North and South America, and Southeast Asia.
ix
Table ES.2 Population in APEC Member Economies by City Size as a Percentage of the Total World Urban Population, 2015 Cities’ populations
No. of cities in the world
No. of
Percent
Pop. of
Pop. of
Percent
Percent
cities in
world
cities in
APEC
world pop.
APEC
APEC
cities (%)
the
cities
(%)
urban
world
(‘000s)
economies
pop. (%)
(‘000s) 10 million or more
29
14
48
451,145
227,692
50
14
5 to 10 million
40
22
55
281,226
149,617
53
9
1 to 5 million
449
185
41
887,590
376,993
42
23
500,000 to 1 million
587
284
48
403,053
198,409
49
12
Less than 500,000
1,903,779
681,654
36
42
Total
3,926,793
1,634,365
42
100
Source: United Nations, Department of Economic and Social Affairs, Population Division, World Urbanization Prospects: The 2014 Revision (New York: United Nations, 2015).
Table ES.2 shows the distribution of the urban population in APEC member economies for cities of different sizes. In 2015, an estimated 54 percent of the population of APEC member economies live in cities or towns of less than 1 million people, while 14 percent live in megacities. By 2025, the urban population is estimated to increase to 2.4 billion, with a rising proportion of the urban population living in medium-sized cities of between 1 and 5 million. By 2030, the percentage of the population living in the region’s megacities is expected to remain stable at around 15 percent. People living in cities of less than 1 million are expected to account for less than 42 percent of APEC member economies’ urban population by 2050. Secondary cities, with populations of between 1 million and 5 million, are expected to experience the strongest growth pressures over the next 30 years. Many such cities are likely to be components of a cluster of cities in metropolitan regions or larger urban development corridors.
Sustainability Challenges Cities in APEC member economies are transforming rapidly. Growth in middle-income economies has been driven by rapid industrialization achieved through a focus on developing agglomeration of economies, but also by progressive reforms to central and local governance systems designed to make economies and cities more efficient and competitive. These changes have boosted growth, but they have often been associated with high levels of environmental damage and social dislocation associated with rural– urban migration, including cross-border and international migration.
x
In the cities of developing APEC member economies, economic development and employment have grown rapidly. However, shortages of investment and limitations on public capital from taxes and loans have resulted in severe shortfalls in public and private sector infrastructure and services. Poor environmental management affects public health and the productivity of urban workers. For the disadvantaged and poor, urban poverty and the shortage of housing add to the stress of living in cities. These are priority areas in the sustainability debate on improving the competitiveness, efficiency and liveability of cities. Improvements in urban governance, liveability, competitiveness, and support for local economic development, trade, and urban management are needed to improve the functionality and efficiency of cities in the APEC region. In advanced APEC member economies, many cities have experienced a tough transition from manufacturing to advanced services-based economies. A significant diversity of economic activities and employment has been generated in the advanced services sector, the knowledge sector and technology-based manufacturing industries. However, unemployment and underemployment rates, income disparities and social disadvantage remain stubbornly high. Urban regeneration is bringing about the revitalization of old city centres, resulting in new economic activities and significant socio-demographic changes. These inner-city centres are beneficiaries of proactive responses to change, which increasingly involve partnership arrangements with business and local communities. As a necessary first step toward a model of sustainable urban development, APEC member economies and city governments, business and communities must recognize the need for change. Perhaps the two greatest challenges to sustainable urban development among APEC member economies are to demonstrate a commitment to change and to decide how to go about that change. One certainty is that change will occur in response to the need to address the impacts of disruptive technology events, and growing pressure on governments to reduce congestion and pollution, and open up systems of governance to greater community engagement, increasingly through the use of social media. A second major challenge to creating sustainable cities is the need for more multi-sector and integrated strategies and solutions to support well-managed urban development, problem-solving and innovation. Many of the strategies and solutions to urban development issues will require governments and cities to be more visionary and less risk averse. They need to be responsive to disruptive and transformative events, and foster positive attitudes and commitment to innovation and collaboration. Collaborative governance through a broad range of partnerships with stakeholders and interest groups is vital to drive more sustainable solutions and outcomes to address urban development problems in the cities of APEC member economies.
xi
Framework for Sustainable Systems of City Development Urban sustainability is a difficult concept to understand, and even harder to implement. Figure ES.2 shows a framework employed in the report to help explain and analyse the sustainability of urban development using a systems approach. Cities are made up of an intricate set of interacting systems. There is a metabolism of cities, which in a way mimics natural systems and structures.
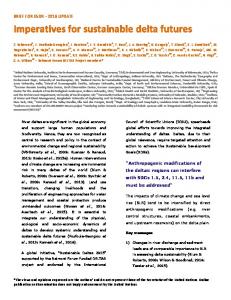
Figure ES.2 Five Key Transactional Elements of a Sustainability Framework for Cities
Physical Environment
Natural Environment
Governance Environment
Economic Environment
Social Human Environment
Source: Authors.
There are five key systems environments in the framework for explaining the sustainable development of cities.
Economic Environment includes a profile of the economies of cities and support for fostering the investment environment, business support, and innovation. Business support and innovation involve initiatives aimed at building local economic dynamism through financial and other support, e.g. through the development of green industry in local clusters and their supply chains. Physical Environment includes not just built infrastructure and assets, but also the quality of service delivery provided by them. It includes infrastructure that is important to add value and generate higher levels of efficiency in urban economies. Building green logistics systems and other infrastructure to support local industry clusters; and the knowledge, health and wellbeing infrastructure
xii
that make cities smarter, healthier and less risky places to do business, are crucial elements of strategic infrastructure. Social Environment involves initiatives fostering a good quality of life, and more knowledgeable, creative, innovative and inclusive cities. It also includes building levels of trust, lowering levels of corruption, and improving human rights and workplace health and safety conditions, which affect the productivity and performance of workers, especially in the low-paid services and manufacturing industries. Natural Environment (Environmental Sustainability) is concerned with maintaining the environmental quality of cities and ensuring the replenishment of degraded natural resources. Environmental sustainability is linked to systems used to provide clean water, soil, etc. It also includes reducing the use of non-renewable resources, and supporting cleaner energy and production, industrial ecology, and materials recycling. Urban Governance Environment is core to the sustainability of cities. It is concerned with building institutions that are effective in managing multi-level urban systems and producing outcomes that make the development of cities more sustainable. Urban governance is concerned with good urban management, integrated planning, participatory decision-making, accountability and sound financial management of cities and public institutions. Urban governance extends to areas of collaborative governance, partnerships and resource sharing.
These five environmental systems of cities are all interconnected and interdependent in many different ways. The structure and dynamics of urban systems vary enormously in the cities of APEC member economies. The systems operate, interact and pulsate through a broad range of networks, patterns and flows. Flows include the movement of goods, services and people, data and information, learning, energy and environmental services, etc. A change or disturbance in one flow system invariably impacts on the dynamics other systems. In all cities, there are a myriad of changes and disruptions occurring daily to urban systems, yet there are harmonics which continually stabilize them to enable cities to develop, grow and function, albeit not necessarily in a sustainable manner. To make the cities of APEC member economies more sustainable, policymakers need to understand that development decisions involve trade-offs in the use of resources and the ways these are used for consumption, exports, and asset creation. The economy’s accounting systems measure these factors, including GDP and other economic data. Governments and business rely heavily on this data for planning, budgeting and expenditure outlays. However, in a more globalized world, trade-offs between the region’s economies (not just APEC member economies) are necessary. Interregional networks and partnerships of interest are an important way of internalizing and externalizing APEC member-economy and city decision-making arrangements to address wider ranging issues associated with sustainable urban development.
xiii
Value of Case Studies in Learning about Urban Partnerships The approach used to analyse the sustainability of the region’s cities in the report involves an extensive literature review and 14 case studies. The case studies examine two different typologies of the systems of cities. These are ‘stand-alone’ cities and metropolitan regions; and urban economic development ‘corridors’. Each case study investigates the five elements for sustainable city development identified in Figure ES.2. The case studies provide a deeper understanding of some of the challenges facing the development of cities. The stand-alone city case studies include Auckland, Bandung, Brisbane, Manila, Kitakyushu, Lima, Mexico City, Santiago de Chile, Seoul and Taipei. The urban development corridor cities include the Pearl River Delta, the Ho Chi Minh City–Bangkok trade corridor, the Jing-Jin-Ji Circle, and the Seattle–Vancouver urban corridor. The case studies highlight many examples of sustainable urban development good practice. However, examples of urban partnerships that could be scaled up are too few. Many examples of good practice are limited in scope and scale. While there are some examples of integrated or city-to-city systems, partnerships involving the planning and management of cities, many examples of good local partnerships, especially in smaller cities, are poorly documented. Case studies are an excellent learning tool to study the way cities in the region address and adapt to problems that impact on the sustainability of urban development. Data, examples and knowledge of good practice enable APEC as a whole to adapt better to the disruptive ‘mega-trends’ of social, climate and technological change and to support the development of ideas, policies and actions to underpin a more broad-based approach to urban development that could have a transformative impact on cities. The case studies show that partnerships among APEC economies and cities could facilitate better knowledge and practical action to improve outcomes. However, there is not, as yet, a systematic effort to address the scope of issues required to promote sustainable urban development partnerships in the cities of APEC member economies. The case studies show a need to develop partnerships for sustainable development that span key economic, spatial, social, environmental and governance dimensions of sustainable city development. More cross-cutting partnership arrangements are needed for addressing climate change, public–private partnerships (PPP), community involvement, risk and resilience, and knowledge-sharing. The case studies show the importance of good governance and networks in making partnerships work. Some partnerships have open governance systems. Others are more formalized. Some are more like networks than partnerships. The case studies show many ways that cities in APEC member economies are engaging in partnerships. Many partnerships are new. Others have been established for a long time. The research shows urban partnerships take time to develop, beginning with an important period of trust building. It is important that the expectations of partners match the risks, realities and resources needed to keep them going. The willingness of stakeholders to commit and stay committed to being open, honest and self-critical about the workings of governance arrangements is essential.
xiv
Finally, partnerships must be flexible, especially when dealing with the need to respond to change and destabilizing events. The best cases in this report show that partnerships need to be innovative, focused, responsive and progressive. They need to be inclusive and accountable in their governance arrangements. Partnerships for sustainable urban development also need to recognize that there comes a time for renewal and closure when a better solution comes along.
xv
Auckland, New Zealand Key Development Indicators Value of the economy Area
Estimated residential population
Urban density Economic growth Unemployment Key export sectors
USD 66 billion (2013) Total: 4,894 km2 Urban: 1,102.9 km2 (23%), Rural: 3,791 km2 (77%) Total: 1,527,000 (2014) Urban: 1,413,700 (92.6%) Rural: 113,300 (7.4%) 1,280 people per km2 2.9% (2013) 5.4% (2013) Dairy, meat, wool and wood products, fish and machinery
Urban Sustainable Development Issues Urban development: Sustainable urbanization is a challenging developmental issue. Auckland has low-density development and traffic congestion problems. It must increase its urban density through redevelopment to make land management more sustainable. Social: Auckland faces challenges of integration and multiculturalism with high levels of domestic and international immigrants. Lack of social housing provision is also an important factor in the sustainable social development of the city. Environmental: Auckland faces significant unpredictable environmental risks from climate change to tectonic activity. The city’s natural location and topography make it susceptible to earthquakes, rising sea level, and potential tsunami impact. Governance: The city previously experienced significant integrated planning and development issues, which have led to a backlog of crucial infrastructure and public transport services. This requires major changes in urban governance and management arrangements. Learning Outcomes: Sustainable City Development Partnerships
The amalgamation of seven local governments has created collaborative government and governance, resulting in better managed urban, social, environmental and economic development. The introduction of comprehensive, holistic planning policy and practices involving partnerships has led to a more sustainable development growth model for the city. The decentralization of employment, investment and services has been advanced through planning support for polycentric city development to decrease pressure on the CBD, ensuring sustainable land use, employment, transport and urban services delivery systems. Strong domestic and international partnerships provide the city with global recognition. Initiatives such as sister cities and free trade agreements have resulted in significant economic benefits, and attracted attention to Auckland’s educational institutions, and to the city as a place of opportunity for immigrants.
xvi
Bandung, Indonesia Key Development Indicators Value of the economy
Estimated residential population Employment Unemployment Number of non-formal businesses Key export sectors
Bandung: USD 3.89 billion (constant value, 2012) Bandung Metropolitan Area: USD 11.17 billion (constant value, 2012) Bandung: 2,455,517 (2012) Bandung Metropolitan Area: 8,002,462 (2012) 1,064,167 (2012) 9.17% (2012) Bandung: 71,204 (2012) Bandung: Trade USD 669.2 million (2012)
Urban Sustainable Development Issues Urban development: The city of Bandung is home to 2.5 million people while Greater Bandung (Bandung city and the surrounding urbanized municipalities) has a population of more than 8 million. It is a tourist destination with total number of visitors reaching 6 million annually. The main challenges involve urban infrastructure deficits. Bandung has chronic traffic congestion, especially during weekends; and experiences serious problems with regular floods, waste treatment, expanding slums and other infrastructure-related challenges. Social: Bandung has more than 80 higher education institutions and is the economic centre of the West Java Province, the most populous province in Indonesia. These lead to increased need for housing, not only for students but also for low-income groups. Environmental: Due to the lack of infrastructure development, Bandung faces significant problems related to environmental degradation such as flash floods, landslides and air pollution. The conversion of lands in the hilly areas in the northern parts of the city from green to residential and other uses could potentially endanger the availability of clean ground water. Governance: Given that the city has limited financial capacity to develop urban infrastructure, the government has embraced the vision of public–private partnerships in urban infrastructure provision as well as in other development areas. Institutional and regulatory reforms are needed to improve the enabling conditions for the public–private partnerships. Learning Outcomes: Sustainable City Development Partnerships
The city of Bandung has become one of the few cities in Indonesia thought to be achieving above average progress and experiencing significant improvements. Under Mayor Ridwan Kamil, previously a highly-accomplished architect, Bandung has become more vibrant and promising. The mayor envisions making Bandung the best city in Indonesia by integrating innovation, creativity and collaboration as the core spirit. Efforts have been made to improve partnerships with various stakeholders, both at domestic and international levels, to support the city’s vision. Initiatives such as sister cities and corporate social responsibility (CSR) from private and state-owned companies have resulted in significant contributions to city development. Some initiatives are in the development stage and need strong institutional and regulatory support.
xvii
Bangkok to Ho Chi Minh Corridors Key Development Indicators Population Area (km2) Value of the economy (billion USD) Nominal GDP per capita (USD) Share of member economy’s GDP (%) GDP growth (%)
Bangkok 11,190,037 (2012) 1,568.7 129.38 (2013)
Phnom Penh 2,301,725 (2012) 678.46 2.053 (2009)
Ho Chi Minh City 7,521,138 (2011) 2,094 71.1 (2015)
15,192 (2013)
1,130 (2014)
5,538 (2014)
30.8 (2013)
25 (2014)
38 (2014)
4.3 (2012)
6.1 (2012)
9.2 (2012)
Urban Sustainable Development Issues The Southern Economic Corridor in the Greater Mekong Subregion spans Cambodia; China (Guanxi and Yunnan provinces); Lao PDR; Myanmar; Thailand; and Viet Nam. This region in Southeast and East Asia is as big as the European Union. The Greater Mekong Subregion by its nature represents regional and cityto-city economic cooperation. Urban development: In economic and spatial terms, the corridor between Bangkok, Phnom Penh and Ho Chi Minh City is one of the Greater Mekong Subregion’s busiest economic corridors. The flow of goods is largest between Bangkok and Phnom Penh, and between Ho Chi Minh City and Phnom Penh. Less flows in the reverse direction. Thailand uses the Southern Economic Corridor as an alternative route to the sea for many of its products since the Bangkok port is often clogged, and harbour processing can be done more efficiently and at lower cost in Viet Nam. Bangkok and Ho Chi Minh City have modern, world-class infrastructure, high-end services and residential areas; and Phnom Penh is trying to rapidly catch up and be a compatible city partner. Social: Bangkok provides the best service situation among the three cities, followed by Ho Chi Minh City. Phnom Penh suffers from weak social services (health and schooling). Despite their economic dynamism, all three cities are struggling with unemployment, particularly among their youth. Environmental: Bangkok and Ho Chi Minh City find their economic activities threatened by impacts of climate change, particularly flooding, as does Phnom Penh. Bangkok’s traffic remains congested and air pollution is an ongoing issue. Ho Chi Minh City has started to invest in major flood abatement measures. Governance: Bangkok is the heart of an upper middle-income economy and is so governed. Politically, Bangkok has seen much unrest und upheaval, but it has also demonstrated remarkable resilience and continuity due to investor support and its strong economic position. Ho Chi Minh City, at the other end of the corridor, is an example of stability and planned growth. Phnom Penh assumes the middle ground, with many problems originating from inequality and labour unrest.
Learning Outcomes: Sustainable City Development Partnerships
The membership of Thailand; Cambodia; and Viet Nam in regional economic networks, including APEC and the Greater Mekong Subregion, strengthens their quest for market prominence. Bangkok, in particular, has been able to develop balanced relationships with all major APEC member economies (USA; China; Japan; and recently, Korea).
xviii
Brisbane Metropolitan Region Key Development Indicators Value of the economy
USD 170 billion (2014)
Area
22,900 km2
Estimated residential population
3,300,000 (2015)
Urban density (Brisbane City local government area) GDP per capita Unemployment
827 persons per km2
Key export sectors
Manufacturing, business services, hospitality, and education
USD 62,175 (2012) 5.9% (2014)
Urban Sustainable Development Issues Economic: The region needs to grow and diversify its economy, especially the knowledge economy, if it is to achieve world city recognition. Brisbane City has developed a new world city vision and action plan. Urban Development: The challenge is to maintain and strengthen the planning focus on compact urban development activity centres for employment growth, and residential infill. Social: There is a need to improve housing affordability and employment prospects, as well as services and infrastructure provision to vulnerable residents in some outer parts of the region. Environmental: Climate change will impact significantly on coastal and flood-prone areas of the region. An effective plan for climate change adaptation needs to be put into place. Governance: The State government and 12 local governments of the Greater Brisbane Region
should maintain their focus on collaborative planning, urban growth management, and infrastructure coordination through the South-East Queensland (SEQ) Regional Plan. Collaborative planning for economic development and the knowledge economy needs to be strengthened. Learning Outcomes: Sustainable City Development Partnerships
Greater Brisbane provides a model of collaborative partnerships at a megacity region scale in which multiple governments exchange information, work together and collaborate on urban management, planning and infrastructure issues. Collaboration also occurs at a local scale in key economic areas. In the Australia Trade Coast area, governments and large private corporations have collaborated and planned to develop a positive business and investment environment that allows them and smaller businesses to flourish and innovate. Brisbane City Council initiated the Asia-Pacific Cities Summit in 1996, and has been resourcing it since. The forum now plays a key role in creating links and sharing knowledge about sustainable city development among APEC member economies and cities.
xix
Beijing–Tianjin–Hebei (Jing-Jin-Ji) Region, China Key Development Indicators Value of the economy Area Estimated residential population Urban density (urban districts) GDP per capita Economic growth Unemployment Key export sectors
USD 936 billion (2013) 231,418 km2 Total: 108.6 million (2013) Urban: 62.0 million Up to 26,700 per km2 in Beijing with the average for the urban area at approx. 5,000 per km2 USD 8,610 (2012) 9.1% (2013) 3.2% (2013) Metals, machinery, electronics, petrochemicals, automotive products and pharmaceuticals.
Urban Sustainable Development Issues Urban development: Better coordination of strategic infrastructure provision (particularly public transport and logistics) with urban development is needed to make land management sustainable. Economic: Innovation systems need boosting through industry partnerships. Significant investment in human capital development and support to SMEs are necessary to enhance productivity, support higher value-adding industry, assist the lower-skilled and to develop a service-sector-led economy. Social: A key challenge lies in integrating large numbers of rural, low-skilled workers and providing social services to economically important migrant groups. Unequal distribution of income and access to public welfare via the hukou system have the potential to increase social tension. Environmental: The challenges include freshwater supply, elevated levels of pollution and environmental risks from climate change. The region’s topography makes it susceptible to increasing desertification, rising sea levels and tsunamis. Governance: Due to the lack of effective regional governance structures, the region has significant integrated strategic planning, financing and development issues which have led to serious shortfalls in the provision of social infrastructure. Significant challenges exist with coordination, transparency and accountability of agencies dealing with key urban functions and local government. Learning Outcomes: Sustainable City Development Partnerships Recognition at the highest levels of central government of the need to manage the Jing-Jin-Ji Region as a whole is a significant step forward for more collaborative government and governance resulting in better management of urban, social, environmental and economic development. Decentralization of employment, investment and services is needed to support polycentric regional development but also has the potential for ineffective regulation and wasteful duplication of strategic infrastructure. Better approaches to coordination are necessary to address environmental problems and support sustainable development. Stronger domestic and international partnerships will allow the region to increase its importance as a service-focused centre for high value-added industry, but partnerships will require proactive support through the development of international city-to-city economic links. The region needs to prioritize areas such as education (e.g. partnering with cities in Australia), aerospace (e.g. partnering with cities in the European Union), and heavy industry (e.g. partnering with cities in Korea).
xx
City of Kitakyushu, Japan Key Development Indicators Value of the economy Area Estimated residential population Urban density GDP per capita Economic growth Unemployment Key export sectors
USD 32 billion (2013) 489.6 km2 1 million (2014) 1,950 persons per km2 USD 31,945 (2013) 3.3% (2012) 7.7% (2010) Steel materials, machinery, shipping containers, electrical equipment
Urban Sustainable Development Issues Urban development: The City of Kitakyushu has relatively high population density in some areas because of topographic constraints, but over the last few decades, it has experienced urban sprawl. This will potentially cause an increase in CO2 emissions due to the growing use of private cars. Kitakyushu City’s urban development aims to develop towns along public transport networks (consists of JR line, monorail, Chikuho railway and bus) Environmental: The City of Kitakyushu was developed by the steel industry in the modern era (the 1900s) and confronted severe environmental pollution in the 1960s. The city dramatically recovered from the environmental degradation and evolved toward sustainability. It was designated a ‘Green Growth City’ by the Organisation for Economic Co-operation and Development (OECD) in 2011. Kitakyushu has been one of the most engaged Japanese cities in international environmental cooperation, demonstrating a high level of commitment. Governance: The City of Kitakyushu has been engaged in government reform to cope with the challenges brought by societal, economic and environmental changes. The current plan proposes collaboration among residents, non-profit organizations and the private sector. Learning Outcomes: Sustainable City Development Partnerships
The City of Kitakyushu survived severe environmental pollution and transformed itself into an environmentally friendly city. While improving its environmental management, the city invested in economic development by promoting new technology and extending its logistics/transport networks. The new, growing sector of environmental technologies will be the key for the City of Kitakyushu to be more competitive internationally and to be a technology hub in Asia. The city could invite trainers from partner economies/cities and disseminate knowledge in logistics and infrastructure maintenance and design. Employment creation is one of the Kitakyushu region’s biggest challenges. The city needs to provide opportunities for the younger generation to increase confidence among youths that they are able to achieve a better quality of life and environment for them to raise their families. It is important to stop urban sprawl and provide high-quality living close to transit corridors.
xxi
Metropolitan Lima, Peru Key Development Indicators
Value of the economy Population GDP per capita Employment Unemployment Number of businesses ] Key export sectors
Local Government Area Greater Lima Region (2013) (2013) USD 70.1 billion n.a. 8,617,314 n.a. USD 5,120 USD 8,137 4,607,100 n.a. 4.7% n.a. n.a. 842,522 Agriculture, agroindustry, clothing and chemicals
Urban Sustainable Development Issues Urban development: Over the previous decade, Lima has improved its physical infrastructure through an array of public and private-sector projects. This has resulted in the overall modernization of the economy: telecommunications, financial services, infrastructure, and logistics services. Social: Underemployment has been high for decades, and there is a large informal economic sector, particularly for youths. Labour participation of young persons is also determined by inequality; those from poorer social backgrounds find it harder to enter and prevail in the labour market. Delinquency and security have become problematic in the city. Environmental: The environment of greater Lima is very susceptible to the impacts of climate change. Rapid urban expansion has caused a reduction of agricultural land near Lima. Contamination due to inadequate waste disposal and industrial pollutants threatens the health and wellbeing of its citizens. Governance: Improvements in the business climate and competitiveness factors have helped Lima to maintain a mid-ranking level worldwide. The prospects for further expansion of the oil, gas and mining sectors, and the development of transcontinental road and pipeline connectivity from Peru’s coast toward neighbouring Brazil, will favour the development of Lima and Peru, not only as a point of transit but as a location for industrial development and trade. Peru and its capital city of Lima will be part of the new economic geography which will transform the South American region
Learning Outcomes: Sustainable City Development Partnerships
Peru will see significant benefits from its membership in the Pacific Alliance (Mexico, Colombia, Peru, and Chile) and APEC. The fact that Lima will be the entry point for transcontinental east-west connectivity greatly enhances its importance. The city’s historical linkages with Asia – foremost China and Japan, and recently Korea – are assets that could be utilized much more in future, and stimulate new synergies. Peru’s membership in regional groupings such as the Andean Pact economies and the Pacific Alliance complements its APEC membership and ensures a broad reach for the economy’s products and services.
xxii
Metro Manila, Philippines Key Development Indicators USD 80.9 billion (2013) 638.55 km2 Total: 11.86 million (2010) Urban: 10.98 million (92.6%) Rural: 877,342 (7.4%) 18,600 people per km2 USD 6,700
Value of the economy Area Estimated residential population
Urban density GDP per capita
Approx. 10% (2013) 6% (2014) Tourism, education, electronic products, clothing/ apparel and business process outsourcing
Economic growth Unemployment Key export sectors
Urban Sustainable Development Issues Urban development: Many areas of strategic infrastructure, particularly public transport and logistics, need to be further developed. The provision of transport must be coordinated with urban development to make land management more sustainable. Economic: Innovation systems need to be boosted. Significant investment in human capital development and support for SMEs are necessary to enhance productivity, support higher value-adding industry, and to absorb the lower-skilled. In addition, there is a need for improved logistics, energy and communications infrastructure to reduce the cost of doing business in the city. Social: A highly unequal distribution of income has the potential to increase social tension. Lack of effective and inclusive urban renewal processes means that the provision of shelter for low-income groups falls far short of basic requirements. Environmental: Manila faces high environmental risks from climate change. The city’s location, geotechnics and topography make it susceptible to earthquakes, rising sea level and tsunamis. Governance: Owing to the lack of effective metropolitan governance structures, the city has significant integrated planning and development issues which have led to serious shortfalls in the provision of strategic infrastructure. Significant challenges also remain in respect of the transparency and accountability of agencies dealing with key urban functions and local government. Learning Outcomes: Sustainable City Development Partnerships
The potential for effective partnerships, both at the strategic level and at the level of individual renewal projects, is significant, with Manila being home to the Philippines’ leading universities, and a network of non-government organizations. The involvement of academe can spark intellectual debate and knowledge exchange among experts, as well as the private and public stakeholders in and around the city. Examples of such partnerships exist and could be scaled up. Partnerships encompassing central and local government to foster a more comprehensive approach to managing the city are desperately needed. The Urban Land Institute has called for the creation of an Urban Development Commission similar to institutions in Hong Kong, China (Harbourfront Commission), Vancouver (Urban Design Panel), and Singapore (Urban Redevelopment Authority) to formulate and implement a Metro Manila master plan. Public–private partnerships in the economy are quite strong, with the central government relying on these types of partnerships to meet infrastructure needs. The PPP Centre catalyzes and has oversight over such partnerships and is operating quite well.
xxiii
Mexico City Region, Mexico Key Development Indicators Federal District
Estado de México
Value of the economy Area Urban area Estimated residential population Urban density
USD 200 billion (2013) 1,485 km2 792 km2 8.85 million (June 2015) 11,175 persons per km2
USD 112 billion (2013) 22,357 km2 2,370 km2 16.87 million (June 2015) 7,119 persons per km2
Persons employed age 15+ Unemployment Value of exports Key export sectors
4.06 million 6.0% USD 2.63 billion (2013) Manufacturing, chemical products.
6.88 million 5.3% USD 18.51 billion (2013) Motor vehicles.
Urban Sustainable Development Issues Urban development: Previously known as one of the world’s most polluted cities, Mexico City is cleaning up its act, starting with Plan Verde (Green Plan). This 15-year initiative began in 2007 and is backed by the United Nations and the World Bank. Plan Verde aims to set aside approximately 8 percent of the city’s annual budget for implementing extensive and ambitious initiatives to make the city more environmentally friendly. There is a strong focus on sustainability targeting improved air quality and reduced traffic congestion. Social: Despite its poor overall human capital performance, Mexico has a large, well-educated labour force. Many decide to work abroad because of a lack of opportunity at home and are welcomed for their quality and performance. Remittances from Mexican citizens working in the United States account for 0.2 percent of Mexico’s GDP. Environmental: The metropolitan region is expected to struggle with environmental problems, which may increase. In 1992, the United Nations declared Mexico City the most polluted city on the planet. The Mexican government was forced to act. It banned old cars, removed lead from gasoline, embraced natural gas, expanded public transportation, and relocated refineries and factories to outside the city. Today, air pollution in Mexico City has improved, but particle emissions levels remain high. Governance: Despite having higher income levels than most of its regional competitors, Mexico City ranks only fifth in terms of city competitiveness in Latin America and the Caribbean. By 2050, Mexico will have the fifth largest city economy in the world. Mexico City urgently needs better governance structures to address problems of competitiveness, which are undermining Mexico’s ability to reap the full potential of being a vital part of Latin America’s productive base. Learning Outcomes: Sustainable City Development Partnerships
Mexico has benefited from cooperation with various APEC members (in particular, the USA; Japan; Korea; and more recently, China) and regional groupings like the North American Free Trade Agreement (NAFTA), and the Pacific Alliance. Sister cities are a form of legal and social agreement between cities to promote cultural and commercial ties. Mexico City (Federal District) as a megacity has many sister cities including Chicago, Los Angeles, Athens, Beijing, Beirut, Berlin, Rio de Janeiro, Sao Paulo, Seoul, Tel Aviv, Istanbul, Lisbon, Paris, Rome, Sydney, Bogota and Buenos Aires.
xxiv
Pearl River Delta, China Key Development Indicators USD 856.7 billion (2013) 54,754 km2 Urban: 48.0 million (2014) Total: 63.7 million (2014) Up to 109,600 per km2 in Hong Kong, China with average mainland urban area at 10,000 to 15,000 per km2 USD 13,450 (2012) 12.2% (2013) n.a. Machinery, electronics, petrochemicals, textiles, automotive products and pharmaceuticals.
Value of the economy Area Estimated residential population Urban density (urban districts) GDP per capita Economic growth Unemployment Key export sectors
Urban Sustainable Development Issues Urban development: Better coordination of strategic infrastructure provision, particularly of public transport and logistics with urban development, is needed to make land management more sustainable. Economic: Innovation systems need to be boosted through strategic industry partnerships. Significant investments in human capital development and support for SMEs are necessary to enhance productivity, support higher value-adding industry, to absorb the lower-skilled and to develop a service-sector-led economy. Social: Challenges include maintaining its attractiveness to labour and providing the social services needed by economically important migrant groups. Unequal distribution of income and access to public welfare via the hukou system have the potential to increase social tension. Environmental: The Pearl River Delta faces high environmental risks from climate change and tectonic activity. The region’s natural location and topography make it susceptible to rising sea levels, cyclones, and tsunami. Governance: Owing to the lack of effective regional governance structures, the Pearl River Delta has significant integrated strategic planning, financing and development issues which have led to serious shortfalls in the provision of social infrastructure. Significant challenges also remain in respect of the coordination, transparency and accountability of agencies dealing with key urban functions and with local government. Learning Outcomes: Sustainable City Development Partnerships
Recognition of the need to manage the Pearl River Delta as a whole is a significant step forward and has created the opportunity for more collaborative government and governance, resulting in better management of urban, social, environmental and economic development. Decentralization of employment, investment and services supports polycentric regional development, decreasing pressure on a given centre; but it carries with it the potential for wasteful duplication of strategic infrastructure. Better approaches to coordination are needed to ensure sustainable land use, employment, transport and urban services delivery systems. Stronger domestic and international partnerships will allow the Pearl River Delta to increase its importance as a service-focused centre for high value-added industry.
xxv
Santiago, Chile Key Development Indicators USD 88.4 billion (2011) 641.4 km2 (2002) Greater Santiago: 6,246,244 (2014) Metropolitan Region: 7,228,581(2014) 85 persons per hectare (urban area 2002) USD 14,150 5.9% (2014) Financial and business services, manufacturing, wholesale and retail Tourism, mining, wines and manufacturing
Value of the economy Area Estimated residential population Urban density GDP per capita Unemployment Key industry sectors Key export sectors
Urban Sustainable Development Issues Urban development: While the city has experienced intense physical and economic transformation and development since the 1990s, it still faces many development problems. It is an economically divided city, with significant areas of urban poverty. Social: Despite steady growth in real wages and higher income levels than most of its regional competitors, Santiago has significant inequality in income and wealth distribution. Environmental: The city faces many environmental challenges associated with air pollution and waste management, as well as the threat of natural hazards such as earthquakes. Governance: Greater Santiago lacks a metropolitan government for its administration, which is currently distributed between various local authorities. Although the central government can intervene and coordinate, this governance arrangement has complicated the operation of the city as a single entity. Learning Outcomes: Sustainable City Development Partnerships
Chile has recognized the importance of tertiary or service sectors to the economy, boosting its international liberalization and leading to the signing of several free trade agreements. Santiago is a very competitive city in Latin America. For many years, the city has ranked as the best place to do business in Latin America; and due to its openness to world markets, it is likely to maintain this position. Consequently, the government has encouraged the use of Santiago as an ‘investment platform’ for multinational corporations planning to operate in the region. The newly initiated transcontinental connectivity projects, particularly with Argentina, Brazil and Bolivia, will further strengthen its role as an entry point and hub in the region. Development of modern road infrastructure through urban expressway concessions has enlivened the city’s activity and its connectivity with the airport and Chile’s main seaports. Such infrastructure development is part of a broader long-term globalization strategy to counterweigh the city’s geographic isolation. The expansion of the metro network, the longest in South America, and its integration with the bus network will increase accessibility to employment centres and services. The city is addressing many of its environmental problems, developing innovative yet replicable collaborative approaches to solving issues such as water treatment, waste management and air quality.
xxvi
Seoul, Korea Key Development Indicators Value of the economy Area Estimated residential population Urban density GDP Economic growth Unemployment Key export sectors
USD 31.9 billion (2013) 605.2 km2 Total 10,118,000 (2014) 16,700 persons per km2 USD 31.9 billion (2013) 1.6% (2013) 4% (2013) Industrial products, finance and insurance, information and communications
Urban Sustainable Development Issues Urban development: In an era of weak economic growth, Seoul is in the middle of a transition from profit-oriented redevelopment to urban restoration focusing on participatory processes in policymaking. Social: With a steady increase in its elderly population, Seoul needs to address issues arising from the shrinking labour market. The Seoul Metropolitan Government recognizes unemployment, in particular youth unemployment, as a serious problem for the future. Environmental: There is growing pressure from inside the economy and from the international community to reduce CO2 emissions. Seoul has to develop viable environmental strategies in the transportation, energy and planning sectors. Governance: ‘Rebuilding Community’ is a core theme of the urban policies of the Seoul Metropolitan Government. Seoul is undertaking the important task of creating collaborative governance with various stakeholders. The current top-down decision-making process, organizational culture and relations between civil servants and citizens need to change so that citizen participation is encouraged. Learning Outcomes: Sustainable City Development Partnerships
Efforts to build international partnerships through active participation in various international organizations have attracted major international cities to economic opportunities in Seoul. Public–private partnerships with global and local business networks have contributed to job creation and the attraction of investment in communities around Seoul. Shifting the focus of urban regeneration from physical improvement to community participation and economic development has produced a more sustainable development model for the future.
xxvii
Taipei Metropolitan Area, Chinese Taipei Key Development Indicators Value of the economy Area
Estimated residential population
Urban density Economic growth Unemployment Key export sectors
USD 167 billion (2012) Total: 1,576 km2 Urban: 1,024 km2 (65%) Rural: 552 km2 (35%) Total: 6,669,133 (2014) Urban: 6,424,421 (96.3%) Rural: 244,712 (3.6%) 4,232 persons per km2 1.9% (2013) 3.94% Wholesale and retail trade, information and communication, finance and insurance activities, manufacturing, construction
Urban Sustainable Development Issues Urban development: Rapid industrialization and urbanization left the central and local governments illequipped to regulate and control development. With weak planning and governance systems were weak, the city developed severe shortages of infrastructure and unplanned urban sprawl. Open spaces and parkland were also used for new industries. Urban renewal is a major issue for urban development.
Economic: With localized transaction costs of production rising, the region is losing its competitiveness. As a result, Chinese Taipei’s manufacturing sector has found itself in a difficult situation. The need to innovate, an ageing population, integrated urban planning and regulatory reforms are having an impact on the region’s competitiveness. Social: An ageing society and high housing prices, lack of social housing and a comprehensive housing policy are the major challenges. Environmental: Protecting agriculture and environmentally sensitive areas from development and establishing a governance system for improved metropolitan management are some of the major challenges. Air and water pollution, loss of natural habitat, congestion and waste management are issues that were neglected for decades. Governance: Significant issues include managing urban restructuring and competition, democracy in urban governance, and the new urbanism of community empowerment, environmental sustainability and cultural conservation. There is a need for improved integration of the governments which make up the region. Better vertical integration of policy is needed between central and local governments, especially given party political differences.
Learning Outcomes: Sustainable City Development Partnerships
The integration of public transportation, water resources and city-wide emergency response management and spatial planning strategy between the Taipei City and New Taipei City governments have resulted in better managed social, environmental and economic development. The metropolitan city government has been working with private industry and public enterprises to develop a green transportation system, an infrastructure system and ecological protection projects. The private sector has adopted and practised socially responsible approaches to environmental sustainability. Non-governmental and non-profit organizations play an important role in emergency response in the Taipei Metropolitan Area because they have strong connections with the community. Such organizations also focus on environmental education and improvement activities in supporting sustainable development.
xxviii
Vancouver, Canada and Seattle, USA Key Development Indicators Urban corridor population Value of the economy Exports I-5 Corridor Seattle to Vancouver Labour force Unemployment Key export sectors
9,630,000 (est., 2015) USD 576.42 billion (est., 2014) USD 97.67 billion (est., 2014) 180km (110miles) 4,543,200 (March 2015) 5.2% (March 2015) Aircraft products, primary products, semiconductors, software and tourism
Urban Sustainable Development Issues Urban development: Within the I-5 urban corridor, the United States and Canadian border formalities have become increasingly challenging to the natural flow of trade and population between Seattle and Vancouver. The ageing north–south transportation infrastructure needs to be upgraded and/or replaced both from a natural disaster management perspective and to allow increased economic development to occur. Economic: Seattle and Vancouver are well advanced towards becoming global cities. The depth and growth of the technical, research and tourism sectors and the ‘green industries’ are a feature of this growth corridor which was previously almost entirely focused on the still important but relatively declining primary production sectors. Social: Seattle and Vancouver appear to face very similar social challenges and a more regional approach, or at least an increased consultative approach, would likely be of benefit to all parties. Affordable housing and improvements in core transportation issues are a key to helping solve some of the higher profile social issues. Environmental: Efforts on environmental and natural disaster planning need to have ongoing priority. Unpredictable risks from natural disasters abound. The entire region is coastal and in an earthquake and volcanic zone. Governance: Urban planning and governance challenges are many. Difficult urban amalgamation options will need to be faced as the region continues to grow. Learning Outcomes: Sustainable City Development Partnerships
Creating urban green spaces full of walking and biking paths and reclaiming parts of the waterfronts for urban open space have created world-renowned ’liveable cities’. Urban transportation in all its forms is a very high priority and better intercity transportation solutions are needed. Lessons can be learned from other APEC cities with larger population bases. Major urban renewal and relocation of large, clean industries back into the city centre is being undertaken. The scale of the urban centre as a place to live and work can be a workable model for other urban areas and could be further examined by APEC. Mega urban areas, which span international borders, have varied and unique economic and social challenges above and beyond normal growth issues. Harmonized border clearance procedures can work effectively even under changing political and economic circumstances.
xxix
Key Lessons from Case Studies of Cities in APEC member economies The findings of the case studies and related investigations reveal universal lessons for the cities of APEC member economies, which call for actions by governments, interest groups and communities to make the development of cities in the region more sustainable. Overall, the findings show that: Despite the overwhelming importance of cities to the development of the region, there is still a poor understanding, at all levels of government, of the structural base for local economies, and how to manage the economic base of cities to proactively support competitive, inclusive and sustainable urban development. A model based on a more collaborative, cooperative and open system of engagement for urban development and management is required for cities in APEC member economies to become more dynamic, liveable and sustainable. The analytic, policy and implementation shortfalls of central and city governments have resulted in many APEC cities failing to achieve their full potential as drivers of development in APEC member economies. The current approaches to urban development and management are not having a significant impact on entrenched problems of inequality, poverty, productivity, and unemployment, or on improving living conditions. Overall there is substantial room for improvement. Some cities have shown remarkable resilience in the face of natural and manmade disasters, and global economic shocks, to recover and grow back into healthy and dynamic cities. Christchurch in New Zealand and Yogyakarta in Indonesia are examples of cities which have suffered severe earthquakes and have worked hard on resilience strategies to ensure their recovery. There are significant opportunities to improve productivity and the liveability of the region’s cities. As most cities do not realize their full development potential, changes in policies and initiatives are required that foster greater collaboration in leveraging resources and infrastructure, creativity, innovation and social contracts that give greater protection to the vulnerable and disadvantaged. Many cities in the APEC region are encouraging and developing a broad range of partnerships as a way of sharing risk, reducing transaction costs and leveraging resources. Many types of partnerships have emerged in cities, as shown in the case studies, that demonstrate a strong commitment to sustainable development. Some cities, such as Mexico City and Chicago, have advanced to develop collaborative networks for economic cooperation and trade partnerships. The development of cityto-city trade partnerships and agreements is the next step down from free trade agreements. If cities in the APEC region are to become more sustainable, ways to realize the latent potential of underutilised physical, social and economic capital to support development need to be addressed through a broad range of policies, plans and actions by governments, business and communities. The global economy is evolving rapidly under transformative social, technological and climate changes. Exogenous growth models, even in successful examples such as China, have been found to have limits in propelling economies past ‘middle income’. Endogenous growth models will be needed for the next stage of development. Such models rely on acquisition, adaptation, dissemination and adoption of new techniques and practices in larger industry clusters. xxx
APEC cities, in general, are not providing the enabling environments, and economic and social infrastructure needed to create new enterprises and trade development, investment and endogenous job growth opportunities. These issues are attributable to poor metropolitan and urban governance and planning, and to severe congestion and poor management of networks and service failures. These factors are adding significantly to the transaction and externality costs of production, government and living in cities across the region. Data on APEC cities are poor, especially for secondary and smaller cities. The lack of good data on urban economies (i.e. trade, the value of public and private investment, and private transfers) makes it difficult to develop policy, to plan, to conduct market research, and to improve logistics systems and spatially coordinate development and investment. In this area, shortfalls occur in key dimensions: in the availability of city assets and product data, trade data, and data on natural capital; and in the techniques of analysis that enable the formulation of effective economic, environmental and social policy. Effective partnerships for gathering, sharing and assessing data are needed but do not exist. Efforts to address climate change and other environmental issues, and create greener economies, remain inadequate. Ways to scale-up promising initiatives to address these concerns at member-economy and regional levels must be identified. Cities in the APEC region are failing to provide the necessary social infrastructure to maximize the productivity and inventiveness of human resources. Many are failing to preserve and build the levels of social and natural capital needed to manage cities in the future. Sustainable development is recognized as an important issue for cities, but efforts by cities to become more sustainable are sluggish and not sufficient to slow the negative externalities resulting from rapid urbanization, congestion, increasing travel times, growing housing shortages, and rising income and wealth inequalities. Despite the significant improvement in international relations and connectivity of business enterprises between cities, the strategic infrastructure of most cities in the region do not support global learning and trade development. The links are mostly confined to symbolic ‘sister city’ relationships. The breadth and depth of such relations are far too narrow and shallow. Fostering improved linkages is an economic priority for member economies, but is seldom seen as such. Partnerships as Tools for Creating Sustainable Cities in the APEC Region The need for sustainable development in cities in the APEC region is becoming more apparent as many sustainability indicators show. Rising traffic congestion, poor metropolitan urban governance and management, impacts of climate change, pollution, poverty, crime, lack of low-income housing, poor liveability and job creation are challenges faced by nearly every city in the region. This report uses a systems analysis of city and corridor development derived from the sustainability framework in Figure ES.2. The analysis provides a basis for APEC to develop and support a sustainable development agenda for cities in the APEC region that is based on partnerships. Such an agenda calls for changes in the management and development of cities, along with a strong focus on innovation, and collaborative business and governance models. It emphasizes renewable energy and resources; efficiencies in transport, logistics and knowledge management systems; green building design; technologies; and finance. Given the global significance of APEC’s economic position, xxxi
its population, and the scale of development, it should have a key role in shaping a new agenda for urbanization and sustainable cities – not only at the regional level – but also globally. Partnerships are a tool that could significantly improve the sustainability of cities in the APEC region. The case studies show clearly that partnerships identified in cities and development corridors in the region can be local and specific, system or cross-system, and multi-levelled. There is no universal model of partnership. There are, in fact, a myriad of ways to form partnerships. The quality and performance of partnership governance are the most significant factors in improving the effectiveness of partnerships to improve the sustainability of cities in the region. Governments, international development assistance agencies and financing banks must identify ways to improve the urban management and development of cities, including their peri-urban areas. For example, substantial investment in infrastructure is not sustainable if those assets cannot be maintained, or costs recovered. Similarly, appropriate governance arrangements to integrate transport, infrastructure and land-use planning activities are essential. One way some cities in the region are addressing metropolitan and urban management issues is through collaborative urban governance. Collaborative urban governance involves government agencies working in collaborative networks, rather than in a structural/hierarchical way, to manage urban development and services delivery. Collaborative urban governance extends to new public-sector management models to privatize or franchise the provision and delivery of infrastructure and services, through public–private partnerships, public–public community and NGO-based services delivery, and partnerships between the community and the private sector. The issues of economic, environmental and social sustainability must be aggressively addressed in the region’s cities. Effective action is within the remit of ‘city governance’ at both central and city government levels. The challenges of managing urbanization occur at different scales, scopes, geography, and levels of development. The model of cross-organizational partnerships offers efficient service delivery and management mechanisms for sustainability which can be embedded at the operational, not just the policy level, in those cities. Many opportunities exist for partnerships involving collaboration and resource sharing arrangements, to minimize public and private transaction costs in the region’s cities. Table ES.4 shows some of these in relation to themes and interest groups. This report explores good-practice examples of some of these types of partnerships that are supportive of sustainable urban development in the region’s cities.
xxxii
Table ES.4 Potential for Developing Multilevel Partnerships within Cities in APEC Economic
Research and innovation
Technology
Governance
Infrastructure
Labour and skills
Environmenta l
Central government
Co-funding LED projects Funding support for green economy initiatives
Collaborative research to improve the efficiency of urban systems
Partnerships for development of regional technology and ICT services
Multilevel planning and resource sharing processes, truly inclusive of cities, for development projects and building capacity for collaborative competition
Co-investment in infrastructure for inner-city revitalization and redevelopment projects
Partnerships with labour, and professional and knowledge industries
Collaborative partnerships and funds for city and local environmental management projects
Local (city) government
LED partnerships with business, providing infrastructure and support for greener production and consumption
Collaboration on urban R&D with universities
One window and single porthole access to government services
Collaborative governance involving departments and other local governments
PPPs for infrastructure delivery and maintenance
Partnerships with unions and professional organizations on skills development
PPPs for integrated waste management services
Global business
Industry-cluster development partnerships on best practice in green development
R&D opportunities for small-scale research
Local technology partnerships on transfer programmes
Partnerships for assessing and mitigating economic risks
PPPs with GC for infrastructure delivery, operations, and maintenance
Partnerships for skills development based on demand
Local environmental charters and support for local environmental improvement programmes
Membereconomy level business
Support for micro-credit schemes and business support for sustainable development
R&D opportunities for small-scale research
Industry groups
Partnerships for business collaboration between cities
PPPs for smaller scale infrastructure delivery, operations and maintenance
Partnerships for skills development based on demand
Local environmental charters and support for local environmental improvement programmes
Local business
Local business and government networks for disseminating best practice in green industry
Collaborative localized research partnerships for SMEs
Technology partnerships for localized product adaptation
Collaborative marketing of local products and services
Local area services repairs and maintenance partnerships
Job experience, workplace partnerships with education facilities
Partnerships for application of industrial ecology and cogeneration
Public utilities and institutions
Low carbon investments, collaborative maintenance and revenue systems
Collaborative R&D partnerships
Collaborative partnerships for technology development
Collaborative governance agreements
PPPs
Job experience, workplace partnerships with education facilities
Cogeneration and waste recycling
NGO community
Budgeting and planning of LED projects, fostering awareness of green consumption
Monitoring and evaluation of local programmes
Localized technology transfer and development projects
Local community planning and budgeting
Local services delivery and maintenance
Labour training schemes for skills development
Local environmental management of drainage and waste
Green economy initiatives
Other
GC = Good coordination; LED = local economic development; NGO = non-governmental organization; PPP = public–private partnership; R&D = research and development; SME = small and medium-sized enterprise Source: Authors.
xxxiii
City-to-City Partnerships Some cities in the APEC region have realized development opportunities created by international and regional free trade agreements and have reoriented their strategic infrastructure and governance systems to reap the benefits through innovative networks and partnerships arrangements. One of the most significant to date is the Global Cities Economic Partnership agreement signed between Mexico City and Chicago in 2013. This is not a typical sister city partnership, but a series of joint initiatives in trade, innovation and education to increase employment, expand advanced industries, and strengthen overall global competitiveness. This Mexico City–Chicago partnership demonstrates a new model for how cities can work together in the future. As the region’s economies become increasingly integrated, so too does the network of cities and metro areas that form its backbone. As with corporate business, city political and business leaders need to examine new ways to fashion strategic partnerships with their natural trading partners’ cities to expand the flow of ideas, investment, talent, and goods and services between their markets. This can be done by examining ways to remove barriers to trade and investment at a local government level, and by fostering collaborative partnerships between like and competitive clusters of industries to help reduce local transaction costs. City-to-city partnerships, like that between Mexico City and Chicago, add a new dimension to the way cities in the APEC region can create collaborative advantage and enhance the sustainability of cities in the region (Table ES.5). Such arrangements seek to reduce resource use and transaction costs. They also offer co-investment opportunities to add value to trade and supply chains, especially for secondary cities along economic trade development corridors. APEC could foster such partnerships focusing on the ‘green and sustainable’ aspects of practice. Such initiatives will also have strong synergies with ongoing low carbon initiatives.
xxxiv
Table ES.5 Potential for Strategic Partnerships between Cities in the APEC Region City partnerships
City-to-city level
Regional and membereconomy level
International level
Economic and trade
Intra-regional trade and investment partnerships to foster development of clusters
City-to-city trade development partnerships
City-to-city economic and trade development partnerships
Infrastructure
Metropolitan collaborative partnerships between local government units (LGUs) on infrastructure development
Collaborative partnerships for infrastructure development between cities in a member economy or the region
Collaborative partnerships for infrastructure development between cities in a member economy or the region
Social
Regional skills, education and knowledge sharing and development partnerships between cities
Skills, education and knowledge sharing and development partnerships between cities in a member economy
International skills, education and knowledge sharing and development partnerships between cities
Environmental
Integrated resource management partnerships between metropolitan, regional governments
Integrated resource management partnerships between cities and subregional governments
Cross-border partnerships for conservation and natural resource management
Governance
Metropolitan economic and trade development corridor authorities
Economic and trade development corridor authorities of member economies
Multiple economic and trade development corridor authorities
Source: Authors.
Cities can foster a broad range of partnerships, both within their jurisdictional boundaries and hinterlands and with other cities. Tables ES.5 shows possible partnerships identified by the research and the case studies that could be developed, using a systems approach, at a local and international level within cities in the APEC region to encourage value adding, and reduce transaction costs through improved access to common user services and facilities. Such partnerships could make a significant contribution to sustainability by reducing unnecessary duplication and better utilization of resources and infrastructure. This is crucial to reducing resource demand and operational costs of business and governments.
An APEC Partnership for Sustainable Urban Development The research for the report shows that APEC could play a valuable role in leading an initiative for building better partnerships for inclusive and sustainable urban growth of cities in the region. Such an initiative, however, needs a clear vision and agenda if it is to contribute significantly to managing urbanization and sustainable development processes in the cities of the APEC region. The vision and agenda must be realistic, achievable and xxxv
acceptable to member economies and the cities they represent. They should be capable of responding to the dynamics of change, be progressive, and collectively agreed. Building Better Partnerships APEC has given its support to Building Better Partnerships for Inclusive and Sustainable Urban Growth of Cities in the Region. Such a partnership initiative needs a vision that APEC member economies and cities can direct their support towards sustainable urban growth in the region. The vision proposed by the report is for APEC to support collaborative governance arrangements and partnerships as the preferred operational model of public-, private- and community-sector engagement and inclusive decisionmaking on policy, investment, development and urban management that results in more competitive, inclusive, equitable and sustainable development outcomes for the region’s cities. Urban Partnerships Agenda APEC, as the representative organization for 21 economies in the region should play a leading role in facilitating partnerships for the development of sustainable cities. The report proposes a framework for an initiative by APEC to help realize the vision for Building Better Partnerships for Inclusive and Sustainable Urban Growth of Cities in the Region. The framework is developed from five primary agenda items: economic, physical, social, natural (environmental), and governance. The five agenda items are all equally important to improving the sustainable development of the region’s cities. The priorities in implementing these agendas will be city-specific; however, many agenda items are common to the systems of cities in the region. Further, there is a broad range of experience in the region. Some cities display very good practice from which others could learn. Partnerships constitute an effective way of disseminating learning and supporting the adoption of best practice across a range of agendas. A wide range of partnership arrangements exist and can be significantly enhanced through support by the governments of member economies to the benefit of their economies and that of the region – from city-specific to multilateral levels of partnerships. Some priority partnerships, meriting the support of APEC and its member economies, are described in the five agendas below. These action agendas will provide concrete support for the inclusive and sustainable urban growth of cities in the region. Economic Development Agenda The economies of cities are their existential backbone. Strong city and metropolitanregion economies are key to sustainable urban growth and development, and the ability of cities to innovate, revitalize and transform. Central and city governments have a crucial role to play in removing barriers to trade, encouraging cities to become more competitive and improving the flow of logistics systems. Innovation and support for business are critical to supporting sustainable city development. More coordinated and collaborative support for business is needed to foster the development of competitive industry clusters, public–private partnerships, collaborative research, reforms to intellectual capital, xxxvi
targeted industry grant schemes, and risk management. There is a need to support partnerships for city-to-city learning in respect of innovation and collaborative business development. Key partnerships required to support the sustainable economic development of the region’s cities include those focused on:
Economic and Trade Development Corridors: The development of these corridors focus on: (i) major transit corridors within cities; (ii) city regions or urban areas; (iii) emerging trade development corridors. Industry Clusters and Business Networks: These bring together various stakeholders involved in industry clusters and business networks to support the development of value-adding and creative businesses in economic corridors, metropolitan regions, and secondary cities. Cluster Investment: Given the opportunities and constraints identified in the report for the major clusters and business networks, the next step is to determine enabling actions and to assign responsibility for implementing and addressing them. In this activity, all levels of government should be involved, working in partnership with business, professionals, labour, and community and professional interest groups.
City Competitiveness: Enhancing the competitiveness of cities in the APEC region requires cooperation between a wide range of interest groups (including enablers, researchers, entrepreneurs, producers and suppliers) to conduct analysis of: (i) the changing nature of competitiveness in the region’s cities; (ii) comparative as opposed to competitive advantage; (iii) collaborative advantage, the new agenda for sustainable cities. Value-Adding in Urban Industry Clusters: Urban economies will require greater support for: (i) fostering endogenous growth and import substitution; (ii) the growth of innovative, creative and smart industries. Property Market Dynamics: The aim is to improve the dynamics and efficiency of property markets to ensure: (i) better security of tenure, especially for tenants; (ii) transparency and accountability in land administration and management; (iii) the application of market value applied to all land and property. Financial Market Reform: The aim is to reform and develop financial markets to deliver: (i) access to enterprise finance, particularly SME finance; (ii) access to more affordable microfinance; (iii) regulated bond markets; (iv) leveraging or sinking (future) funds, e.g. the Chicago Infrastructure Trust. Implications of the Third Industrial Revolution Economy: A proactive response is required for effective adjustment to, and adoption of, advances in technology that will fundamentally change the way of doing business in all member economies. The advances include developments in 3D printing; computer-aided manufacturing; robotics; artificial intelligence; energy storage, production, and distribution; and new materials.
xxxvii
Improved Performance in Cross-Cutting Social and Environmental Issues: Education and health, in particular, cross-cut the economic agenda, largely determining the productivity of the labour force, and increasingly the environment plays a role in determining a city’s attractiveness to investment.
Physical (Asset) Development Agenda Infrastructure, buildings and structures are crucial assets supporting the development and operation of cities. Infrastructure assets may be hard or soft. Nearly all cities in the APEC region have shortfalls in strategic infrastructure. In developed member economies, logistics, enabling environments and integrated planning issues are priority areas for addressing how to overcome ageing infrastructure, congestion and capacity issues. In developing member economies, integrated planning and development, provision of strategic infrastructure, management of peri-urban areas, the protection of utility corridors and value capture are high priority matters needing attention to support sustainable city development. Key partnerships needed to support the sustainable physical development of the region’s cities are those that support:
Integrated Capital Works and Development Programmes: The preparation of integrated capital works development plans and programmes is essential to efficient development and should be linked to city, departmental and corporation budgets which include financing plans for identified capital works. Land Value Capture for Infrastructure: Capital works development plans should also identify developer financing and value capture financing options. Obtaining revenue from these sources is critical to the funding of works programmes. Improved Practice in Asset Inventory Preparation and Management: The type, location, age and other characteristics of assets need to be rigorously and comprehensively recorded and assessed as the basis for analysis to determine priority investments and maintenance. The cost of collecting data and records and maintaining asset inventories is reduced substantially when public and private utility agencies collaborate on data collection, information sharing and revenue-raising from selling services from a single central city assets registry. Based on such data, operations and maintenance processes could be improved and implemented. Effective Collaboration with Potential Investors and Other Stakeholders: Various partnership arrangements can support private and community participation in the development of infrastructure, buildings and other structures. Ways of engaging stakeholders in policy dialogue need to be designed.
Social Development Agenda Health, education, legal and emergency services are crucial to the development of sustainable and liveable cities in the APEC region. Access to these services is critical to the economy of cities: healthy, better-educated and safe workers are more productive. It is also important to a city’s social stability and wellbeing. Social development programmes will lead to improvements in security, education, health, and housing. High xxxviii
levels of exclusion from these services result in unemployment, constraints to career development, rising crime, and violence. Particularly disadvantaged are women, the aged, the physically challenged, and children. Key partnerships required to support the sustainable social development of cities in the APEC region include those focused on:
Mapping of the Socioeconomic Profiles of Cities: There is a need for public agencies to partner in mapping the social wellbeing and development of cities, providing baseline profiles of the socioeconomic characteristics of citizens including comprehensive, spatially tagged, gender-disaggregated statistics and data on families, incomes, shelter circumstances, skills and livelihoods; the levels of housing, health, education and security services provided; and levels of risk associated with crime, disease and exposure to disaster by socioeconomic groups and geographic location. Development of Social Services Audits and Inventories: It is necessary to identify the various stakeholders involved in the provision of vital social services – in particular, housing, health and education – for the region in question. Ways of engaging these public agencies in partnerships with private service providers in policy dialogue and integrated planning of social and community services needs to be identified for each major social service. In the absence of comprehensive data, stakeholder partnerships can provide significant and useful information as a basis for preliminary assessment. Engagement and Inclusiveness: Participation has become a valuable tool for engaging communities in planning, budgeting, resource mobilization, service delivery and emergency management. Partnership mechanisms for engaging communities in these participatory processes are necessary to reduce public-sector costs and outlays on social and community services, and to improve outcomes regarding inclusive delivery of services. This supports a policy change for economic development agreed at the 2015 APEC meeting. Access to Affordable Housing: Housing is a vital element in a citizen’s quality of life; distorted housing markets result in reduced quality of life for many. Shelter policy and housing development need to take into account affordability to the full spectrum of income groups and delivery systems which match appropriate housing types and finance to all parts of the spectrum. Better partnership mechanisms are needed to expand affordable housing and bring large numbers of vacant units of accommodation and/or land into the housing market – both are essential to addressing urban housing problems. Healthy Cities: Healthy cities are vital to the wellbeing and productivity of workforces in cities. Creating healthy cities requires the cities, collectively, to take action to improve water, air and food quality; ensure better urban living and working conditions; and better health care services. Health programmes must provide better facilities and services but also policy measures for preventative health, social and mental wellbeing to reduce health costs and demand for services. Many of these programmes can be delivered through partnerships with non-government and community-based organizations and cadres. xxxix
Safer Cities: Safer cities are essential to public safety, investment, emergency and disaster prevention and management. Inadequate security, dangerous working environments, poor roads and utility services cost the region’s cities billions of dollars annually in lost productivity, premature deaths, disabilities, and damage to life and property caused by natural and manmade disaster. Actions to improve public and workplace safety are needed. Creating safer cities requires multiple levels of partnerships in planning, management and development coordination, and in improved and enforced laws and regulations.
Environmental Management Agenda Cities in the APEC region are particularly vulnerable to the potential impacts of climate change which include: an increase in extreme weather events; sea level rise; storm surges and flooding; and increased temperatures – all with related public health concerns. Amelioration of other environmental problems such as water, air and soil pollution, flooding, depletion of natural resources, and invasive species, requires appropriate policies, improved skills and institutional arrangements, and adequate funding. These issues are particularly challenging for smaller cities which are facing relatively slow economic growth or rapid urbanization. Resolving environmental issues is something that often requires multi-jurisdictional cooperation and agreement. At the city level, these issues can be successfully addressed through partnerships at the local level. Key partnerships needed to support the sustainable environmental management of cities in the APEC region include those focused on:
Restoration of Natural Capital and Environmental Services: To improve the environmental management of cities in the APEC region, it is necessary to document the state of the natural capital, its vulnerabilities, and pollution sources within the development corridor, city region or urban area. More comprehensive, spatially tagged statistics on water, forest and other natural-resource stocks and usage are needed as the basis for such analysis. For this, cities need to develop measures of natural-capital stock and the depletion and restoration rates. Based on this data they need to develop partnerships for action and investment to counter the degradation of key capital assets. Restoring natural capital is fundamental to the sustainability of cities and to reducing ecological footprints. Climate Change Resilience: Several very large cities in the region like Bangkok, Jakarta, Manila, and Shanghai are among the most vulnerable cities in the world to the impacts of climate change. The threat of climate change calls for the futureproofing of cities.While that will be difficult to achieve, it is vital if the most at-risk cities are to safeguard their economies against this threat. Climate change will call for action plans to be prepared for adaptation measures for all cities in the region which are less than 10m above sea level. While high priority should be given to fostering economic resilience in response to climate change and sharing best practice in this area, the pathways to achieving this are likely to include promotion of strong community-level support and partnerships.
xl
Circular Economies: Cities in the APEC region must implement policies to encourage the development of circular economies where waste materials, resources and energy are recovered and reused. Cities can apply industrial ecology and cleaner production as standard practices to reduce waste and heat emissions to the lowest levels possible. The development of circular economies in cities requires a collective approach to waste and energy recovery and partnerships for the dissemination of appropriate planning techniques and technologies. Green Cities: Green cities embody a wide range of environmental management practices and add to the focus on the role of cities in mitigating the impact of their population on the environment and on resilience. The sustainability of cities in the region will, in particular, be highly dependent on the creation of more energy-efficient green cities. Green cities will involve cities moving to alternative or renewable energy sources, and developing local energy grids and energy storage buildings. The transition to green cities offers many opportunities to support more renewable and less fossil-fuel dependent cities. It will require the development of partnerships to share good practice and to link cities to technology and service providers.
Urban Governance Development Agenda Better urban governance is essential to effectively implement all of the above agendas, but it is one of the most difficult challenges. At the central government level, many urban and spatial economic development strategies and plans lack clarity and are not integrated. Decentralization policies are poorly aligned to the fiscal and administrative responsibilities of the different levels of government. At the city level, there is confusion over responsibility for the urban fringe and the functional responsibilities for city-wide delivery and maintenance of local services. Key partnerships needed to support the sustainable urban governance of cities in the APEC region would need to focus on:
More Collaborative Governance: This could cover: (i) city-to-city trade partnerships; (ii) a collaborative governance culture (planning, budgeting, resource sharing) replacing current ‘siloed’ systems which are inefficient and stifle innovation. Improved Metropolitan Management: Effective management would require attention to: (i) metropolitan governance arrangement; (ii) integrated strategic planning; (iii) integrated spatial multi-sectoral budgeting; (iv) integrated services delivery based on multi-sectoral planning; (v) infrastructure investment prioritization processes. Enhanced Public Revenue: There is a need to improve the efficiency and equity of: (i) intergovernmental fiscal relations so as to provide incentives for local revenue mobilization and leveraging; (ii) property tax collection; (iii) land value capture; (iv) asset leveraging. Reform of Regulatory Systems: There is a need for: (i) realistic, responsive and enforced development and planning regulations; (ii) effective and enforced environmental regulations; (iii) respect for the rights of citizens. xli
Development of Anti-Corruption Cultures: More transparent political processes, government and business operations are vital. E-Governance: There is a need to develop modern IT-based management information systems and public information systems. Effective Monitoring and Evaluation: There is a need for systems at regional and member-economy levels to monitor and evaluate: (i) policy environments relevant to the agenda areas; (ii) capital investments related to agenda areas; (iii) operations and maintenance programmes; (iv) The performance of cities and city competitiveness across the agenda areas; (v) Longitudinal studies on dynamics and changes in urban economic, social and environmental systems.
Priority Actions for an APEC Partnership Initiative Many actions are necessary to address key shortfalls and realize opportunities identified by the report to improve the performance and sustainability of cities in the APEC region. APEC’s mandate is limited to policy, but the organization could work with its members on a limited number of priority actions that could make a meaningful contribution to the sustainable development of cities in the APEC region. The research identifies four key areas that could be supported by APEC and its Secretariat as part of an initiative focused on Building Better Partnerships for Inclusive and Sustainable Urban Growth of Cities in the Region. They are: 1. Partnerships to Lift Economic Performance and Trade: While there appear to be many sensible theoretical reasons why city networks and partnerships could help lift economic outcomes, the city case studies and literature have found limited evidence of them actually doing so. The case studies present good and outstanding examples of sustainable development practices, but very few have been expanded to a city or system of cities level. Scaling up the individual lessons drawn from the case studies into central and regional systems of cities through partnerships – city-to-city clusters, trade, economic development and investment exchanges (such as the Chicago– Mexico City partnership) – is vital to enhancing the performance and sustainability of cities in the APEC region. A critical element of development partnerships to enhance economic performance is the development of more specialised spatial clusters of industry and economic activities. Economic development strategies and government enabling support to the development of export-orientated industry clusters is important, but the focus on support endogenous growth is equally important. With the advancement in ITC and other technologies (especially 3 D printing), there are many opportunities for the glocalization and localization of production of goods and services in large, medium and small cities across the region. The development of economic corridors and economic linkages across urban systems will be central to such partnerships. The dominance of one or two cities tends to multiply agglomeration diseconomies in the primate cities and to intensify underutilization of enterprise and human capital in smaller cities. The lack of xlii
institutions to manage trade corridors, facilitate access to domestic and international economic opportunities, is a major contributor to such problems. The development of trade corridors comprising networks of linked and interdependent cities is an emerging phenomenon, but the challenge lies in how to develop and manage these corridors. The Jing-Jin-Ji, Pearl River Delta, Vancouver–Seattle, Ho Chi Minh City, and Mercosur trade development corridors are vital to fostering commerce and development between cities, but the management, financing and development of these will be a significant challenge, which is best addressed through partnership arrangements between APEC member economies and city governments. 2. Partnerships to Foster Sustainable Urban Forms: Many cities have evolved toward lower density, high carbon and dispersed forms of urban development that are environmentally unsustainable and economically inefficient. Shortfalls in metropolitan planning, in particular, the integration of land use and transport/logistics solutions, and in governance are the primary causes of such problems. The chapters on Mexico, Lima, Auckland and Manila all show that urban sprawl is adding to the costs and issues associated with congestion for business, government and communities. Increasing urban density and consolidation of development is vital to improving the sustainability of development across the region. 3. Partnerships to Support for Development of Strategic Infrastructure: The governance agenda should promote partnerships for strengthening programme development and implementation mechanisms for strategic infrastructure, and for addressing the systemic faults occurring at all levels in systems related to financing investments for sustainable development. In many cases, infrastructure investment tends to be opportunistic and ad hoc and lacks the context of a ‘nested’ set of integrated metropolitan asset management and local development plans. Privatesector and community inputs are not systematically and equitably canvassed in respect of such investments. In addition, and importantly, investments are seldom subject to independent, transparent analysis that relates to performance criteria once a project has been implemented and throughout its life. 4. Partnerships to Improve Systems related to Financing Investments for Sustainable Development: Urban governments do not have revenue-raising mandates in line with city infrastructure needs. Local governments lack any incentive to maximize tax yields or leverage private and community resources. Funding requirements, in many cases, are unknown. Strategic and asset management plans seldom exist; and where they do exist, funding requirements have not been adequately estimated. Enterprises in secondary cities often have less access to funding for investment. Micro, small and medium enterprises suffer restricted access to funding no matter where they are located. Supporting these initiatives will be Partnerships to Enhance City Information, Trade Data, and Asset Management Systems: APEC member economies are becoming more closely linked to expanding trade, investment, tourism and other types of exchange. For trade and investment to grow, information, trade, services and infrastructure need to be more closely integrated, and the nature, volume, capacity and spatial identity of assets and value-adding inputs to production and waste streams better known. Most cities in the region have incomplete information about their economies, what they import and export, where and how value-adding occurs spatially and the changing dynamics of technology and skills requirements for expanding service sector economies. The development of xliii
integrated city information and management systems is vital to improving logistics for supply chains and movement systems, streamlining administrative systems and developing higher levels of risk assessment and preparedness in cities. It is also crucial that these partnerships and ITC systems are made more open to micro business and the urban poor to enable them to gain equitable access to new knowledge, technology and markets in the transformation to more service sector driven economies. The economic planning ministries of APEC member economies should develop dedicated units capable of analysing urban economic systems and of fostering best practices in sustainable urban development. The focus should be on providing appropriate enabling frameworks for acquiring, adapting and implementing best practices through supporting effective partnerships with cities, communities and the private sector. The implementation of best practices should extend across the various systems – planning; project development and assessment; project procurement; and finance. Improving only one area is unlikely to improve outcomes. APEC should support the development of such capacity. Responsible ministries should tap the substantial body of expertise in academic and policy institutions. The following section provides a suggested roadmap of how such support could be organized.
Roadmap for Building APEC Better Partnerships for Inclusive and Sustainable Urban Growth In shaping a roadmap to move forward on an agenda for Building Better Partnerships for Inclusive and Sustainable Urban Growth of Cities in the Region, it is essential, given APEC’s pivotal position in representing several of the largest and most influential economies in the world, that APEC identifies and agrees upon how to develop the initiative, along with the scope and scale of activities the organization engages in. Figure ES.4 is a roadmap showing the structure and scope of a possible urban partnerships agenda and programme for APEC. The scale of these activities initially might be limited to a few member economies and cities. It is essential that the activities be designed as part of a learning experiment to identify how APEC can best support sustainable urban development activities within and between a few member economies and cities before attempting to scale up some of these. APEC should select activities where member economies feel confident that experimental outcomes will generate results and positive learning outcomes that can be shared or possibly adopted or adapted by other member economies and cities where successful. Even when there are experimental failures, much can be learned from these. In urban development, the margins between success and failure are often small; what succeeds in one city will not always succeed in another, and vice versa. The APEC Secretariat will need to form a Sustainable Urban Development group to coordinate activities to implement an urban agenda. The representatives of this group would be drawn from the economic planning ministries of the member economies or their nearest equivalent having a strategic overview of city infrastructure needs.
xliv
The group would report direct to the Senior Officials Meeting owing to its cross-cutting nature and the potential involvement of several committees of APEC. These activities would fall into two main and related areas. The first would entail the formation of advisory groups for the five agenda areas (see Figure ES.2). These groups would be voluntary, but specific studies could be undertaken with groups – depending on the availability of funds. They should meet at least yearly and at these meetings, the focus should be on a particular topic – which can then be documented as a knowledge product. The second activity area would concentrate on the priority actions for partnership initiatives. Again, depending on the funding available, an ‘Initiative Secretariat’ could be established. This secretariat would have two primary functions. The first would be to service the work of the initiatives and the second would be to act as a repository for data on APEC urban systems. Figure ES.4 Roadmap for a Strategy for an Urban Agenda for Building Better Partnerships for Inclusive and Sustainable Urban Growth in the APEC Region.
Source: Authors
Conclusions This report has highlighted many good examples of sustainable development practices and partnerships between cities in the APEC region. The region’s cities, however, still have many challenges to overcome to become more sustainable. To address these challenges will require changes to the ways business, governance and trade function; a greater focus on sustainable use of resources; investment in people; and a more collaborative approach to developing innovative solutions that will ensure the sustainable development of cities in the region. It requires cities to move to green platforms of xlv
production, greater inclusiveness and involvement in public decision-making, and a higher level of consciousness in communities about providing for the needs of future generations. Because of the importance of city economies to the central economy, the issue of sustainable urban development is one to be addressed at the highest level of government. It cannot be left to the largely under-resourced cities themselves. While the expansion and development of trade are important to support the growth of economies and cities in the region, new models of economic development with a stronger focus on endogenous growth will be necessary to create the jobs, investment opportunities and impact the changes technology will have on them. Technology offers a tool to improve the sustainable development of cities in the region, but will not tackle all of their challenges. Finally, the report has highlighted many promising initiatives by APEC member economies and cities to work with different levels of government, business and communities in developing better and more sustainable cities through a range of partnerships. Partnerships offer one avenue of using precious resources more wisely in developing and managing cities. Partnerships are a valuable mechanism for the sustainable development of cities in the APEC region. They can be expected to occur on many different levels across the region. They include but go far beyond the dissemination of information. Effective partnerships help cities solve problems and catalyze investment – both in public facilities and in private enterprise. APEC, as a forum representing the interests of governments, can play an influential role in fostering the development of partnerships between economies and cities, particularly in facilitating the sharing of knowledge, innovation, and ideas for improving the management, development and transitioning of cities. It is vital that APEC takes this up as part of an initiative for Building Better Partnerships for Inclusive and Sustainable Urban Growth of Cities in the Region. Recommendations The report makes the following recommendations:
APEC, through the Friends of the Chair meetings on urban issues, should create an initiative aimed at Building Better Partnerships for Inclusive and Sustainable Urban Growth of Cities in the Region. The APEC Secretariat is mandated by the Friends of the Chair to implement the four key partnership initiatives and the collaborative arrangements required for better data collection. The APEC Secretariat publishes this report to support the launch of the Building Better Partnerships for Inclusive and Sustainable Urban Growth of Cities in the Region initiative
xlvi
1. New Agenda for Sustainable Development of APEC Cities Brian H. Roberts, Michael Lindfield and Florian Steinberg
The economies of the Asia-Pacific region form the largest geographic concentration of people, wealth, cities and natural resources on earth. The region has some of the fastestgrowing and most developed economies in the world. Its impressive development has reduced greatly levels of poverty and brought many benefits to people living and investing in the region, but development has also created problems and challenges of a physical, economic, social, environmental and governance nature. APEC can play a key role in bringing governments and business together to meet these challenges and help make the development of cities in the region more sustainable. Overcoming the challenges will be difficult; and better linkages, partnerships, coordination and collaboration between governments and business at various levels of government, along with governance arrangements involving multilateral organizations, will be necessary. The Asia-Pacific is vast, with 46 economies spread around the Pacific Ocean rim. Distances and travel times between cities and economies in the region are substantial. Despite this, APEC economies are becoming increasingly interconnected and dependent on each other for their growth, development, trade, investment, and security.
Figure 1.1 Asia-Pacific Region and APEC Member Economies
Source: APEC, 2014.
1
With over 75 percent of gross domestic product (GDP) and jobs produced by cities, the future of the APEC region depends on the sustainable development of its cities. However, the population of some of Asia’s cities is growing at more than 5 percent per annum, which makes it almost impossible to meet demand for housing, infrastructure and basic services. In 2014, APEC released a discussion paper outlining a framework for an Asia-Pacific Partnership to Shape the Future of Urbanization and Sustainable City Development.1 The paper sought to bring to the attention of APEC member economies the critical role that could be played by better management of urbanization and city development, for the future prosperity and sustainable development of the region. The discussion paper called for the adoption of a new agenda for APEC to make the region’s cities more sustainable, by making them better places in which to live, learn, enjoy, invest and do business. The agenda calls for creative, collaborative and innovative solutions and thinking; new forms of partnerships for the development of the region’s cities; together with new policies and strategies to improve the management of urban and economic development. It calls for greater inclusiveness, equity, and engagement of women and the poor in the management and development of cities. These elements are essential to advance the development of cities in the region. The discussion paper set out why there is a need for an Asia-Pacific Partnership to address urbanization and sustainable city development. It drew on a series of working papers on five cities and four urban corridors, highlighting important lessons about the ways cities in the region were addressing urbanization and sustainable development issues.2 The role of innovation and partnerships in identifying solutions was stressed. The working papers provided valuable Partnerships are part of the new Agenda insights into sustainability initiatives for the Sustainable Development of by cities in the region, involving APEC Cities partnership arrangements to support sustainable urban development. APEC saw merit in developing these working papers further as exemplars of good practice, and to conduct some additional studies which would expand upon different aspects of sustainability in areas of urban governance, finance, planning and development, social and community needs provision, and environmental management. This book presents a series of case studies that describe initiatives and partnerships to support the sustainable development of cities in the APEC region. It commences with a profile of urbanization and cities in the region, discusses some challenges facing the development of cities, and presents the framework used for the presentation of the case studies which are presented as separate chapters. The rationale for selection of the cities, metropolitan regions and corridor studies is discussed later in the chapter. The closing chapter draws together the findings, learning and insights gained from the case studies. It draws conclusions about the benefits of using partnerships to facilitate sustainable urban development projects and programmes for the region’s cities. Finally, it outlines a potential role for APEC to support good practice partnerships for sustainable urban development in the Asia-Pacific region. 2
1.1
URBANIZATION IN THE REGIONAL CONTEXT
Urbanization – the process leading to the greater spatial concentration of people and economic activities in urban settlements – has been occurring for centuries. At the turn of the twentieth century, an estimated 15 percent of the world’s population lived in cities.3,4 Since then, the urban population has risen to 53 percent of the global population.5 Unique to the APEC region is the speed and scale at which urbanization has occurred, especially in Asian economies. Urbanization has boosted productivity in all APEC economies, driven by the liberalization of world trade and capital markets and, increasingly, by labour markets. However, economic gains have come with social and environmental costs, which are impacting on the productivity and liveability of cities in the region, at both local and global levels. Over the next 35 years to 2050, an unprecedented increase will occur in the urban population in the APEC region. The region currently accounts for around 46 percent of the world’s urban population, or 1.8 billion people. Currently, around 60 percent of the region’s population live in urban areas; this is expected to reach 77 percent by 2050. By 2050, the urban population is expected to increase to 2.4 billion. Some economies are more than 80 percent urbanized; and many others are urbanizing rapidly. Fourteen of the world’s 37 megacities are in the Asia-Pacific region. Table 1.1 shows urban population growth and expected trends to 2050 for APEC member economies. The population growth rates of cities across the region’s economies vary significantly. The current average urbanization growth rate for APEC member economies is around 1.8 percent per annum. This is projected to fall to 0.3 percent by 2050. Urban growth rates of APEC member economies in North and South America are generally much lower than those in Asia, Oceania, and Australasia. Economies like Japan have a negative urbanization rate, with their population in decline. Many of the developed economies of the region will continue to grow at over 0.6 percent per annum due to high levels of international migration. The Asian APEC member economies’ urban growth rates will expand at much higher rates, generally over 2 percent. This will challenge their ability to provide services.
3
Table 1.1 Urban Population of APEC Member Economies, millions, 2000–2050 APEC economies
2000
2005
2010
2015
2020
2025
2030
2035
2040
2045
2050
Australia
16.8
18.1
19.9
21.4
22.9
24.4
25.8
27.2
28.6
30.0
31.3
0.2
0.3
0.3
0.3
0.4
0.4
0.4
0.4
0.4
0.4
0.5
Canada
24.4
25.8
27.6
29.4
31.1
32.8
34.3
35.7
37.1
38.3
39.6
Chile
13.3
14.3
15.2
16.0
16.8
17.5
18.1
18.6
19.0
19.2
19.4
China
459.4
560.5
669.4
779.5
874.4
947.5
998.9
1,030. 0
1,044. 4
1,050. 8
1,049. 9
6.8
6.9
7.0
7.3
7.5
7.7
7.9
8.0
8.0
8.0
8.0
Indonesia
87.8
103.1
120.2
137.4
154.2
170.1
184.9
198.0
209.2
219.1
227.8
Japan
98.9
109.2
115.3
118.6
119.4
118.7
116.9
114.4
111.5
108.6
105.8
Korea
36.6
38.3
39.7
41.0
42.2
43.2
44.1
44.7
45.0
45.0
44.7
Malaysia
14.5
17.2
20.1
22.9
25.5
28.0
30.2
32.0
33.5
34.9
36.2
Mexico
77.6
84.5
91.7
99.2
106.3
113.0
119.0
124.2
128.6
132.1
134.8
New Zealand
3.3
3.6
3.8
4.0
4.2
4.4
4.5
4.7
4.9
5.0
5.2
Papua New Guinea
0.7
0.8
0.9
1.0
1.1
1.3
1.5
1.8
2.1
2.5
3.0
Peru
19.0
20.8
22.5
24.5
26.5
28.4
30.2
31.7
33.1
34.4
35.4
The Philippines
37.2
40.0
42.3
45.2
48.9
53.5
59.2
65.9
73.3
80.8
88.4
107.7
105.7
105.8
105.2
104.4
103.2
101.9
100.9
100.0
99.1
98.0
3.9
4.5
5.1
5.6
6.1
6.3
6.6
6.8
6.9
7.0
7.1
Chinese Taipei
15.3
16.4
17.3
18.0
18.6
19.0
19.2
19.3
19.1
18.8
18. 3
Thailand
19.6
24.6
29.3
34.0
37.9
41.0
43.1
44.3
44.7
44.7
44.3
225.0
238.3
252.2
265.4
278.8
292.2
305.4
317.7
329.0
339.8
350.3
19.7
23.2
27.1
31.4
35.7
39.9
43.7
47.2
50.4
53.3
55.7
1,287.7
1,456.0
1,632.6
1,807.2
1,962.9
2,092.6
2,196.0
2,273.6
2,328.9
2,372.0
2,403.8
Brunei Darussalam
Hong Kong, China
Russia Singapore
United States Viet Nam Total urban population
Source: United Nations, Department of Economic and Social Affairs, Population Division, World Urbanization Prospects: The 2014 Revision (New York: United Nations, 2015).
4
Table 1.2 Urban Population Growth Rates in APEC Member Economies, percentage, 2000–2050 APEC economies
2000– 2005
2005– 2010
2010– 2015
2015– 2020
2020– 2025
2025– 2030
2030– 2035
2035– 2040
2040– 2045
Australia
1.5
1.9
1.5
1.4
1.3
1.1
1.1
1.0
0.9
0.9
Brunei Darussalam
2.7
2.3
1.8
1.5
1.3
1.1
0.9
0.7
0.5
0.4
Canada
1.2
1.3
1.2
1.2
1.0
0.9
0.8
0.7
0.7
0.7
Chile
1.4
1.2
1.1
1.0
0.8
0.7
0.5
0.4
0.3
0.2
China
4.1
3.6
3.1
2.3
1.6
1.1
0.6
0.3
0.1
0.0
Hong Kong, China
0.2
0.4
0.7
0.6
0.5
0.4
0.2
0.1
0.0
0.0
Indonesia
3.3
3.1
2.7
2.3
2.0
1.7
1.4
1.1
0.9
0.8
Japan
2.0
1.1
0.6
0.1
-0.1
-0.3
-0.4
-0.5
-0.5
-0.5
Korea
0.9
0.7
0.7
0.6
0.5
0.4
0.3
0.1
0.0
-0.1
Malaysia
3.5
3.1
2.7
2.2
1.9
1.5
1.2
0.9
0.8
0.7
Mexico
1.7
1.7
1.6
1.4
1.2
1.0
0.9
0.7
0.5
0.4
New Zealand
1.5
1.1
1.1
1.0
0.9
0.8
0.8
0.7
0.6
0.6
Papua New Guinea
2.4
2.2
2.1
2.5
2.8
3.2
3.5
3.7
3.5
3.3
Peru
1.8
1.6
1.7
1.6
1.4
1.2
1.0
0.9
0.7
0.6
The Philippines
1.4
1.1
1.3
1.6
1.8
2.0
2.2
2.2
2.0
1.8
-0.4
0.0
-0.1
-0.1
-0.2
-0.2
-0.2
-0.2
-0.2
-0.2
Singapore
2.8
2.5
2.0
1.5
0.9
0.8
0.6
0.4
0.3
0.2
Chinese Taipei
1.4
1.0
0.8
0.6
0.4
0.2
0.0
-0.2
-0.4
-0.5
Thailand
4.7
3.5
3.0
2.2
1.6
1.0
0.5
0.2
0.0
-0.2
United States
1.2
1.1
1.0
1.0
0.9
0.9
0.8
0.7
0.6
0.6
Viet Nam
3.3
3.2
3.0
2.6
2.2
1.9
1.6
1.3
1.1
0.9
Average growth rate
2.5
2.3
2.1
1.7
1.3
1.0
0.7
0.5
0.4
0.3
Russia
Source: United Nations, Department of Economic and Social Affairs, Population Division, World Urbanization Prospects: The 2014 Revision (New York: United Nations, 2015).
5
2045– 2050
Canada and the United States of America are among the most urbanized economies in the world, with almost 80 percent of the population living in urban areas (Table 1.2). Many of the cities in North America have experienced rapid urban growth in the past, but population growth has stabilized, forcing the cities to undergo dramatic transformations. The previous rapid transformation and growth of cities in Latin American APEC member economies were accompanied, at times, by violent conflicts over land, marked environmental deterioration, and deep social divides. While growth rates in those economies have reduced, a substantial deficit remains in the provision of infrastructure. By 2050, APEC member economies in Latin America will reach urbanization levels of almost 87 percent. By 2050, it is expected that the annual rate of urbanization will slow to 0.3 percent.6
1.2
A REGION WITH MORE, BIGGER AND GREYING CITIES
The APEC economies have more than 825 cities with populations greater than 300,000 people.7 The pattern of development, the rate of growth and the age of cities vary widely across the region. Cities like Luoyang and Beijing in China date back thousands of years. Most of the region’s cities, however, are less than 100 years old. During the late nineteenth to the latter half of the twentieth century, North and South American and Japanese cities grew very rapidly, as urbanization rates peaked. Australasian cities have continued to grow steadily, as the economies in that part of the region continue to absorb growing numbers of migrants, increasingly from Asia.
6
Photo 1.1 Expansion of Chinese Cities: Tianjin South
Credit: John Courtney.
For the next three decades, most urban populations in the APEC region are expected to live in cities of less than 500,000 people. The population of larger cities will grow faster than small cities. Many of the smaller cities will have fewer financial and physical assets, and skilled resources to plan, manage and accommodate urban growth. Most will struggle to attract investment.
Figure 1.2 shows the expected increase in the number of cities by population size in the region. An additional 64 cities with populations between 1 and 5 million, and 67 cities of between 500,000 and 1 million people, are expected to be added to the region by 2050, most of them in China. The dominant feature of the region is its megacities. There are 15 megacities, and it is predicted that a further 17 will be added by 2025. Collectively, these megacities are home to 7 percent of the region’s population and 15 percent of the urban population. These cities are emerging along corridors to form supra cities, as has occurred along the Pearl River Delta between Guangdong and Hong Kong. Other corridors of cities are developing in North and South America, and several Southeast Asian economies. These patterns of development can be seen clearly in the night imagery of the South American and Southeast Asian part of the APEC region (Photo 1.2).
7
Figure 1.2 Expected Growth in Cities by Size in APEC Member Economies, 2015– 2025
400
353
350 284
300 No.
249
250 185
200 150 100 50
14
17
22
33
— 10 million or more
5 to 10 million
1 to 5 million
2015
500,000 to 1 million
2025
Source: United Nations, Department of Economic and Social Affairs, Population Division, World Urbanization Prospects: The 2014 Revision (New York: United Nations, 2015).
Photo 1.2 Lights Showing Emerging Corridors of Cities in South America (left) and East Asia (right)
Credit: NASA (2015).
In some APEC economies, such as Australia, Canada, the United States, Thailand, Japan and China, city populations are quickly ‘greying’. Other economies in Asia, such as the 8
Philippines, continue to grow relatively rapidly, and their cities’ populations are correspondingly younger. This difference in population age is not mirrored in APEC Latin America, where, in most economies, the proportion of the economically active population is higher than in the past. This situation is expected to last for at least 30 years before the phenomenon of ageing sets in, as is currently occurring in Chile.8 There are significant challenges for economies with ageing populations, such as the proportionally higher expenditure required for social services and health. In Japan, Korea, Canada and Australia, the percentage of persons active in the workforce is expected to fall dramatically as the post-WWII baby boomer populations retire. This will place enormous burdens on these economies’ taxation systems. Table 1.3 shows the distribution of the urban population in APEC member economies for cities of different sizes. In 2015, an estimated 54 percent of the population of APEC member economies live in cities or towns of less than 1 million people, while 14 percent live in megacities. By 2025, the urban population is estimated to increase to 2.4 billion, with a rising proportion of the urban population living in medium-sized cities of between 1 and 5 million.
Table 1.3 Population in APEC Member Economies by City Size as a Percentage of the Total World Urban Population, 2015 Cities’ populations
No. of cities in the world
No. of
Percent
Pop. of
Pop. of
Percent
Percent
cities in
world
cities in
APEC
world pop.
APEC
APEC
cities (%)
the
cities
(%)
urban
world
(‘000s)
economies
pop. (%)
(‘000s) 10 million or more
29
14
48
451,145
227,692
50
14
5 to 10 million
40
22
55
281,226
149,617
53
9
1 to 5 million
449
185
41
887,590
376,993
42
23
500,000 to 1 million
587
284
48
403,053
198,409
49
12
Less than 500,000
1,903,779
681,654
36
42
Total
3,926,793
1,634,365
42
100
Source: United Nations, Department of Economic and Social Affairs, Population Division, World Urbanization Prospects: The 2014 Revision (New York: United Nations, 2015).
The proportion of the population living in megacities will remain stable at around 14 percent. Population growth in cities of less than 1 million is expected to be slower. Their populations will account for less than 42 percent of the urban population of APEC member economies by 2050. Secondary cities, with populations of between 1 million and 5 million, are expected to experience the strongest growth pressures over the next 30 years.9 Many such cities are likely to be components of a cluster of cities in metropolitan regions or larger urban development corridors. Significant differences exist in the population growth rates of secondary cities in APEC member economies. 9
In Asia, APEC member economies that are relatively less urbanized – China, the Philippines, Viet Nam and Indonesia – will see their secondary cities experience the highest urban growth rates. In China, this is predicted to exceed 6 percent annually for cities of between 5 and 10 million people. In most other APEC member economies in Asia, urban population growth rates will be highest in cities with populations of between 1 and 5 million. In the Philippines, the figure is projected to be 10.8 percent. In smaller cities, the range will be between 2 and 3 percent for cities of less than 1 million and around 1.2 percent for cities with populations of less than 500,000. Small cities of 50,000 or less are likely to experience little or no population growth. In Japan and Korea, urban growth rates will remain stable but are predicted to decline in cities with populations of less than 500,000. In Canada, the United States, Mexico and Australia, cities are expected to grow by 1 to 2 percent per annum. Many smaller cities will experience population growth rates of less than 1 percent. In the Latin American region, the number of cities has increased six-fold in 50 years. Almost half the population live in cities with over 500,000 inhabitants. About 14 percent of cities have populations greater than 10 million. Mass rural–urban migration has lost its growth-propelling role. Migration has become more complex: between cities, or between economies, and from city centres to the periphery, and between secondary urban centres. Urban expansion has caused an increase in administrative burdens, and large conurbations have come into being, sometimes including large urban territories consisting of multiple municipalities. Lima, Mexico City and Santiago de Chile are examples of newly emerging city regions. A distinctive feature of urbanization in Latin America is the rapid growth of secondary cities, which are already home to nearly 40 percent of the region’s urban population.10
1.3
CITIES ARE THE REGION’S DRIVERS OF ECONOMIC GROWTH AND PROSPERITY
The 21 member economies of APEC comprise around 40 percent of the world’s population and produce more than 53 percent of global GDP. This was estimated in 2012 at USD 35.8 trillion based on purchasing power parity (PPP). APEC member economies include half the world’s megacities; 22 (55%) of the world’s cities with populations of 5– 10 million, 185 (41%) of the cities with populations of 1–5 million, and 284 (48%) of the cities with populations of 0.5–1 million. These percentages are expected to increase only slightly over the next three decades as population growth and urbanization rates rise. Cities in the APEC region are transforming rapidly. In general, cities in East Asian and Latin American economies contain some of the largest megacities and metropolitan regions in the world. Along the Pearl River Delta between Hong Kong, China and Guangzhou, the world’s first supra city is emerging, with a population of 50 million people. Further expansion of this city is planned, for the creation of an agglomeration of networked city clusters of between 10 and 25 million people.11,12 The growth and development of these cities are being driven by rapid industrialization, accompanied by high levels of rural–urban migration. In the more advanced member economies, cities are going through an enormous transition from manufacturing, to the services, knowledge, 10
and advanced manufacturing sectors. Urban regeneration and the revitalization of city centres in these economies have brought about resilience in new economic activities and socio-demographic changes. In most APEC member economies, urban areas contribute more than 75 percent of GDP. In 201, the 100 largest cities in the region produced an estimated USD 1,759 billion or 29 percent of global GDP.13 Globalization, free trade agreements, improved communications, and exchanges have been responsible for the region’s remarkable growth, which has led to borderless systems of cities.
1.4
CHALLENGES FACING THE FUTURE DEVELOPMENT OF APEC CITIES
Cities in APEC member economies are transforming rapidly. The growth of many cities in middle-income economies has been driven by forces of rapid industrialization and the agglomeration of economies, but also by progressive reforms to various levels of governance and structural changes designed to make economies and cities more efficient and competitive. These changes have boosted growth; but they have often been associated with high levels of environmental damage and social dislocation associated with rural– urban migration, including cross-border and international migration. In the developing economies and cities of the region, economic development and employment have grown rapidly. However, backlogs in strategic infrastructure and poor planning and urban management are affecting both the productivity and liveability of cities in the region. These costs and delays threaten the future competitiveness of APEC cities. In advanced APEC member economies, many cities have experienced a very difficult transition from manufacturing to advanced services based economies. A significant range of economic activities and employment has been generated in the advanced services sector, the knowledge economy, and technology-based manufacturing industries. However, unemployment and under-employment rates, income disparities, and social disadvantage remain stubbornly high. Urban regeneration is bringing about the revitalization of old city centres, resulting in new economic activities and significant socio-demographic changes. These inner-city centres are beneficiaries of proactive responses to change, increasingly involving partnership arrangements with business and local communities.
11
Photo 1.3 The Greying of Cities: Hunter’s Point Naval Shipyard Buildings, San Francisco
Credit: Shaping San Francisco Digital Archive.
Globalization, free trade agreements, improved communications, and exchanges are leading to a more borderless system of engagement in trade, investment, knowledge and people flows between cities in the region. These flows are increasing in the more prosperous and rapidly growing cities of Asia and Latin America, creating some enormous development challenges for city governments. These challenges include shortfalls in planning capacity, physical infrastructure, investment capital, environmental management and the provision of housing. Addressing these shortfalls, along with improvements in urban governance, liveability, competitiveness, and support for local economic development, trade, and urban management, are essential if sustainable urbanization and development is to be achievable for many cities in the region. Globalization has led to significant shifts in the location of production, with Asian APEC economies being the major beneficiaries. While all economies within the APEC region have benefited, several have experienced massive losses of industrial jobs and the closure of hundreds of industrial areas (Photo 1.3). Inner-city residential and industrial areas, especially in the USA, have greyed, falling into decline and/or dereliction. Older innercity areas, until recently, have become homes for the migrants and poor. Returning grey areas to green and prosperity is a major challenge for developed economies like the USA; Australia; Canada; and Japan. These forces of change have a broad impact on the region. Technological change is threatening the ‘cheap labour’ export-led growth model. Demographic change, particularly the greying of cities, both in advanced and some Asian member economies such as Korea and Japan, will have a profound impact on consumption and savings patterns and on the way people live in cities. These changes call for more proactive and responsive approaches to the management of urbanization to address the challenges facing cities in the region and to maximize the gains from more sustainable and green forms of economic growth. Governments at all levels play a significant role in shaping the economic and physical development of cities and metropolitan regions. With the removal of tariffs and other 12
trade barriers as a result of globalization and free trade agreements, economies, cities and rural regions are exposed to greater competition. While governments in Asia have sought to encourage competition, most have tended to protect local economies and businesses from competitors – to foster the growth of local firms and employment. In many economies, these policies have resulted in markets underperforming, low levels of productivity and significant labour inefficiencies. 1.4.1 Women and Development Inequities between men and women in their rights, roles and recognition, and the impact of this on the development of APEC cities, remain a significant issue for the region. Median female (+15 years of age) participation in employment in the region has risen from 50.45 percent in 1990 to 56.7 percent in 2014.14 However, this compares to 76 percent for men. In some APEC member economies – e.g. Chile; Mexico; Peru – this gap has reduced significantly in recent years. In Thailand; China; Japan; and the USA, the gap is narrowing as their populations age. In Korea and Chinese Taipei, it is declining. The employment participation rates of women across the APEC region fell slightly after the global financial crisis and have changed little since. The gender inequality index (a Human Development Index based on three dimensions of inequality, namely, reproductive health, empowerment, and labour market participation) across APEC member economies has improved markedly from a median of 0.71 in 1990 to 0.81 in 2014. However, significant gender differences in income and poverty levels remain.15 Women in APEC cities are more severely disadvantaged than men, with those who are heads of single-parent families being particularly affected by the high rents and cost of living. Women experience a higher rate of urban poverty than men in APEC cities.16 Women’s participation in senior management or government and business varies between APEC economies but remains low. The role of women and their contribution to the development of APEC cities need to be more fully recognized. According to the 2007 Economic and Social Survey of Asia and the Pacific, restrictions on women’s access to employment are costing the Asian region USD 42–47 billion per year. Another USD 16–30 billion per year is lost in economic development opportunities because of gender gaps in education.17 These losses have risen significantly since 2007, even as female participation rates in the urban workforce remain relatively stable. Added to the above are the social and personal costs of inequitable access to housing, capital markets, and social services. In the Latin American member economies of APEC, the contribution of women to the economy has improved due to higher workforce participation rates, but could be enhanced substantially. Greater opportunities must be given to women in the leadership, management and development of cities, especially in economic development. There remain persistent barriers hindering women from making a greater economic contribution to the development of cities. This needs to be addressed through innovative and creative policies and programmes. APEC could work with its member economies to recognize (through trade agreements, legislation and advocacy) the right of women to participate more actively in the sustainable development of urban economies in APEC and to promote women’s equal rights in the city, as agreed under UN-Habitat’s New Urban Agenda initiative.18 13
1.5
THE NEW ECONOMIC GEOGRAPHY OF CITIES IN THE REGION19
In the aftermath of the global financial crisis, questions began to be raised regarding the sustainability of a model of development that places emphasis on pursuing economic gains without accounting for the associated environmental and social impacts.20 Many natural resources are finite and are becoming harder to recover. Congestion, air and water pollution are adding to the transaction costs of business and government. These challenges are leading to a growing interest in green cities21,22 as a way of merging the need for cities to be competitive and productive but less wasteful of resources and energy. The impact of urbanization on the economic, social and physical environments have created a global debate on sustainable versus competitive cities, and how to harmonize the two. Could these powerful forces be made to complement, rather than oppose, each another? Could there be collaboration and competition, or co-opertition,23 in the ways business and cities compete for and do business? 1.5.1 NEG Trends These challenges and questions are shaping a new economic geography of cities (NEG)24 – changing the spatial development of cities, driving efficiencies in urban economies and increasing the urgency of implementing sustainable resource management and production systems. This has seen a trend toward more creative and specialized industries, clusters and innovative societies. Service industries are becoming more dispersed, and manufacturing more concentrated, in cities.25 There is increasing focus on reducing externalities and transaction costs to create competitive advantage as well as liveable and prosperous cities. 1.5.2 Responding to the NEG Because of their preeminent position in the economies of the APEC region, cities must be the focus of the response of member economies to the NEG model of economic development. To benefit from the disruptive innovations emerging within, and forming, the context of the NEG – and increase their wealth base while paying attention to the common good – cities would have to explore ways to stretch and leverage common resources to reduce transaction costs for governments and business.26,27 To successfully do so, cities would need to recognize the importance of transparent and flexible governance systems, and integrated urban planning and logistics systems. To use resources efficiently both for the common good and to reduce business costs, cities need to develop shared strategic infrastructure; a diversity of human capital and culture; and creative and innovative industries. The NEG also suggests the increasing relevance of pursuing collaborative advantage. Traditionally, economies competed for trade, investment and economic development activities based on comparative advantage. However, economies and cities are losing control and influence over where investment occurs; with the opening up of economies, the proliferation of bilateral and multilateral free trade agreements and greater freedom of movement between economies, cities are having to compete much more vigorously for trade and investment, much of which is controlled by large domestic and multinational 14
corporations. Learning how to create and apply collaborative advantage is particularly important for secondary cities, given that they have to overcome the economies of scope and scale enjoyed by large metropolitan region cities. Cities must proactively address the implications of the NEG: ‘If governments responsible for the management and development of cities do not align and maintain their spatial and economic planning and systems with the emerging NEG of economies and cities, their prospects for ever achieving strong, sustainable and liveable cities are very limited.’ 28 Partnerships and collaborations are essential – across different levels of government and between the public and private sectors. It is also crucial that this message be heard by city leaders, especially those in less developed regions. 1.5.3 The Main Debates Understanding the NEG and the forces shaping it will be key to effective city planning and management in the future. An important question relates to the spatial economics of cities. Many large cities are made up of a loose federation of smaller local governments (e.g. Jakarta, Lima, San Francisco), which creates healthy competition for jobs and investment. However, this often leads to dispersal and dilution of the competitive power of clusters, and subsequent loss of competitive advantage for metropolitan regions. Congestion, rents and land costs often drive firms to the periphery of cities as part of a process of de-industrialization, as is occurring in Bangkok and Manila. The NEG is thus leading to debates about the merits and costs of clustered (or agglomerated) versus dispersed production systems. It has also been observed that economic activities, especially in the major cities, are unevenly distributed across urban areas, with multiple centres of concentrated economic activities surrounded by lower-density ‘peripheral’ cities. This raises further questions: ‘what economic interactions there are between these different geographical areas and how do these shape income levels in urban areas, and how does the spatial organization of economic activities respond to various shocks, such as global recessions, technological change or policy measures?’29 Further to the above, the spatial nature and flow of supply chain transactions occurring within cities is still not well understood. As cities and their industrial supply chains become more networked, not much is known about how to make the inter-modality and seamlessness of spatial infrastructure supply chains more efficient. Knowledge about the interaction and spatial dependency of logistics systems, hubs and nodes, and the utilization of connecting systems in cities, is very poor. How can these be improved? And how can city-to-city infrastructure and supply chain linkages be made more efficient and integrated? The NEG is less concerned with nation-to-nation trading and investment, than with strengthening the linkages to support city-to-city trading, co-investment, and economic development opportunities. The NEG raises the urgency of understanding ‘what drives the development of cities, how city economies are different, what makes a city competitive, and how a city can align itself in a new global, and more competitive, system of trade and development’. 30 The consequences of getting this wrong are significant. Recent work on the impact of inefficient land markets on US cities has estimated that, as a result of this factor alone, 15
US GDP was some 13.5 percentage points less in 2009 than what it would have been had more effective land markets been operating over the previous 45 years.31 The resultant implied losses are in the millions of jobs and tens of billions of economic products. Considered responses to these questions are vital for the future planning and management of cities. With the lack of data on aspects of the NEG, there remain diverging views on the form the NEG of cities should take,32 especially in the context of lesser developed economies. For example, there is still no clear answer on whether it would be more efficient for cities to focus on developing metropolises or whether they should promote a more dispersed human settlement and employment pattern .33
1.6
CHANGES IN THE TYPOLOGY OF CITIES
The effect of the internationalization of economic activities under free trade and structural adjustment programmes is that many industry clusters, especially in the region’s developed economies, are no longer competitive and they have either died, scaled down and become more specialized, or relocated offshore. At the same time, with the advances in information technology and computer-based manufacturing and robotics, capitalintensive production is gaining ground over labour-intensive production. These trends have seen cities undergo a metamorphosis, which is reflected in recent transformations in their skylines, especially in the central business, regional commercial and industrial districts. Such changes imply that we need to review how cities should be classified and understood. Historically, cities were defined hierarchically based on population size. Globalization has rendered this problematic. Bangalore, for example, is a secondary city in India in terms of the population hierarchy but holds a primary position when considered in terms of its function in global information and communications technology (ICT). Kuala Lumpur is a primary city of Malaysia, but a secondary city globally in terms of trade and investment. Functionality, not just population and scale, is increasingly relevant in classifying cities. Insights into how various APEC primary and secondary cities fit into an emerging global typology of cities are needed. Such analyses could enable cities, particularly those in the lesser developed economies, to be more strategic in deciding on which sectors to focus on to compete more effectively for trade and investment within their domestic economy and internationally. This would be particularly important for diversifying the economic base of cities in Asia. Functional classification and competitiveness assessment of cities’ industrial clusters provide new opportunities for understanding urban systems.34 By classifying cities based on functional specialization, spatial regularities in the distribution and structure of urban functions may be identified, and hypotheses about the resulting patterns formulated. This makes it possible to ascertain, for example, whether cities with a more diversified economy grow at a faster rate than those with a more specialized economic base. There is evidence suggesting that cities that foster the development of industry clusters as a means of enhancing their competitiveness perform better than those that are less 16
specialized and put greater focus on developing more broad-based, consumption-driven economic activities.35,36 Together with the functional changes occurring in APEC cities, there is a new type of geographic typology change taking place. As the larger cities in the APEC region have grown, the spatial development pattern of emerging metropolitan regions has tended towards becoming more polycentric. This takes the form of a large primate city urban centre with a peripheral ring of clustered secondary and intermediate cities. This pattern is beginning to change in response to growing problems of congestion and accessibility. With the development of freeways and the upgrading of national highways between large primary and secondary cities urban economic development corridors are emerging comprised of a network of linked or chained clusters cities spread along these main arterial transport routes. The phenomenon of urban economic development corridors, linking new and expanded urban centres is becoming wide spread. Some of these, like the corridor between Jakarta and Bandung are becoming very large. A good example of an emerging corridor development city is Ho Chi Minh City in Viet Nam. Figure 1.3 shows the development pattern of the urban corridor and the clustered pattern of cities which are emerging. These urban corridors and cluster of cities extend more than 70 kms in the case of the Ho Chi Minh City, Biên Hòa to Vung Tau urban development corridor. This corridor has become a long linear city, speared out 2-3 km either side of the highway. More and more cities in the region are developing along highway corridors. In some cases, this pattern of development is being fostered by PPP toll ways projects where developers are given rights to develop new towns along the corridor route.
Figure 1.3 Emerging Urban Economic Development Corridors HCMC, Viet Nam
17
1.7
THE SUSTAINABLE CITY DEBATE
The increasing drift of the rural poor to cities is viewed by many in the region as a factor preventing the sustainable development of cities. However, no nation has achieved any level of economic development without urbanization.37 Urbanization has boosted productivity in the region, driven by the liberalization of world trade, and capital and labour markets. Urbanization in the region has been a very significant factor underpinning the growth of the global economy for more than four decades. The economic gains have come at a cost. In the race to achieve middle-income status, social and environmental problems have been given a lower priority in public policy and the budget allocations of member economies. The attitude of some developing economies in the region is that the more advanced economies deferred these costs when they were developing, so there is no reason for developing economies to be prevented from pursuing the same strategy. However, such an approach to development, which was recognized more than 60 years ago by the economist Kuznets,38 is no longer viable given that most of the world’s population now live in cities, and most cities are consuming resources beyond the capacity of natural and social systems to replenish or supply. There is little doubt that cities in the APEC region are experiencing significant development challenges. These are not insurmountable, but substantial changes in the development models used will be needed if the growth of cities is to become more sustainable. The sustainability debate begins with the recognition, by governments, business and communities, of the need for change. The major challenge is how. Few answers have been forthcoming. One certainty is that if the change is to occur, multiple strategies and solutions by a broad range of interest groups and partners will be required. In many cases governments and cities in the region will have to cooperate and collaborate in partnerships and other collective efforts. Rapid urbanization and development of cities has always been problematic. Few fastgrowing cities have the resources, capacity, and governance systems to manage development and keep ahead of infrastructure and housing demand. Cities in the region face similar challenges. Climate change-related issues, better urban management, greater choice and range of housing, and the challenges of traffic congestion and pollution are sustainability problems common to all cities. However, solutions to these issues will require localized initiatives and the development and application of local technologies and practices. It is essential that these be linked to the level of urbanization, to geography and customs, and to the physical and economic state of a city’s development. All cities go through technological, economic and physical lifecycles of development. Some cities in the more developed economies of the region are experiencing urban decline, decay, and employment loss. Some of these cities are regenerating through urban renewal projects. Urban revitalization is attracting jobs, creating growth and improving security in inner cities. However, large parts of these cities still have inadequate quality housing, vacant industrial land and fragmented land ownership patterns that make the consolidation of land for redevelopment expensive and time-consuming. Another way of achieving sustainable city development is by fostering more polycentric cities, with multiple nodes of employment and activity centres distributed across 18
metropolitan regions. This helps to balance employment, provide choice and reduce the need to build, operate and maintain large public transport and infrastructure systems. Both development approaches – urban revitalization and polycentric cities – have merit and support sustainable development. However, other creative solutions for urban development, design and management must be adopted if cities in the region are to become truly more sustainable. To bring greater clarity to the sustainability debate, it is essential that common shortfalls in the management and development of the region’s cities are analysed more rigorously. Across the income spectrum of APEC member economies urban governance, the basis of effective urban management and development, is relatively weak and sometimes corrupt. Urban planning has proved ineffective and, in many cities, planning systems have become devices for rent-seeking. The poor delivery and management of infrastructure and ICT systems significantly reduce the efficiency of logistics systems. Shortages of investment and public capital from taxes lead to severe shortfalls in public and private services. Poor environmental management affects public health and the productivity of urban workers. For the disadvantaged and poor, urban poverty and the shortage of housing add to the stress of living in cities. These are priority areas in the sustainability debate for improving the competitiveness, efficiency and liveability of cities. Improvements in urban governance, liveability, competitiveness, and support for local economic development, trade, and urban management are needed to improve the functionality and efficiency of cities in the APEC region. The above discussion illustrates the many dimensions and complexities of the debate on how to make urbanization and the development of cities in the region more sustainable. Issues such as climate change, the third industrial revolution, refugees and food security add variables to an already complicated equation in developing an urban metabolism for cities in the region that is more balanced and stable. The debate about urbanization and the sustainable development of cities in the region cannot be settled by short-term thinking and regulation. Nor can new technologies provide quick solutions to the many development challenges facing the region.
1.8
DEFINING SUSTAINABLE CITIES
The sustainable cities debate requires a new economic development model for cities. This must be underpinned strongly by a set of sustainability principles agreed by the region’s economies. First, however, there must be wider debate on how cities can be made more sustainable. Secondly, a framework is needed from which cities can progressively work toward greater sustainability. That framework must include mechanisms for collaboration and partnerships for sustainable urban development. Development experts agree that sustainability can be defined as the ability of people and societies to meet present needs without sacrificing future generations’ ability to meet their needs.39 Most cities are consuming resources at rates substantially beyond the capacity to 19
replenish them. The debate on sustainable cities, therefore, must focus on decoupling the relationship between energy and resource consumption, and economic output.40 Urban sustainability is centred on the goal or idea that cities can be organized without excessive reliance on the importation of resources and capital and should be selfsustaining. However, no city can be said to be sustainable unless potentially, as in China, the boundaries of the ‘city’ encompass an urban economic region and its hinterland. City self-sufficiency for most economies, therefore, is not achievable in a strict sense; nor is it ever likely to be. Cities were born from the need of agricultural societies to have permanent marketplaces for trade and the exchange of goods and services, and from the need to have bases for resource extraction and trade. Thus, many of the region’s very old cities have their origins as market cities. Given their isolation, they had to be ‘sustainable’ in relation to their context. It was only much later, as rural populations grew, that manufacturing and trade services were developed. Without the expansion and development of trade and other exchanges between cities and between regions, and the resulting increase in per capita income, urbanization would not be the unsustainable phenomenon we know today. The aim of sustainable city development is to optimize production and output to create the smallest possible ecological footprint; produce the lowest quantity of pollution possible;41 make the most efficient use of land; reuse materials; recycle or convert waste to energy; and minimize the city’s overall contribution to climate change. Sustainable cities also have environmental, governance, physical development and social dimensions. Equity, social justice, distribution of wealth, prosperity, representation and accountability are equally important dimensions of sustainable cities and regions. How to balance these multiple dimensions of sustainability to create better places for people to live, work and enjoy, now and in the future, are core principles underpinning the development of sustainable cities. The application of these principles in supporting the sustainable development of cities in the region will be addressed throughout this book.
1.9
A FRAMEWORK FOR SUSTAINABLE CITY DEVELOPMENT
Throughout the region, there are increasing limitations on the availability and use of natural resources to support the needs of people and urban systems of cities.42 Globally, natural resources and capital are being depleted at an alarming rate. In Asian economies especially, there is excessive drawdown – beyond natural replacement levels – of nonrenewable resource stocks such as water, forests, soils and marine environments. This could have a severe impact on food security, health, material supplies and, in the northwestern Pacific economies, in particular, on flooding. For cities throughout the region to become more sustainable, maintaining the balance of natural-capital stocks on which they depend to produce consumables, for building other types of assets, and for waste sinks, requires a better system of management than exists at present. Underlying their economic output, cities depend not only on natural-capital stock – environmental assets – but also on three other interacting asset classes: social capital (mainly human capital), community capital (mainly physical infrastructure) and 20
economic capital (the assets of enterprises). Cross-cutting these domains, and providing the means of integration, are the governance systems of the city. Figure 1.4 Five Key Transactional Elements of a Sustainability Framework for Cities
Physical Environment
Natural Environment
Governance Environment
Economic Environment
Social Human Environment
Source: Authors.
Five key elements of sustainability shape the framework for sustainable development of cities (). The governance environment is core to the framework. Governance strongly influences the natural, social, physical (community strategic infrastructure) and economic environments. The governance environment shapes the way cities, societies, communities and groups make rules and decisions about the allocation and use of resources. A wide range of governance processes is used throughout the region to shape the way we use, convert and transform natural, physical, social and economic capital. By and large, it is the decisions of individuals who live and work in cities that determine how these different forms of capital are used and transformed; and it is this that is causing the imbalance in the sustainability balance sheet. Cities in the advanced economies are consuming at rates more than double the capacity to replenish natural resources. For example, Canadian cities have an ecological footprint (a measure of resource consumption of populations) that is almost twice that of Korean cities.43 The challenge is to adopt a development model that will allow for the progressive transition of the current consumption patterns of the region’s cities to a level where natural-capital stocks can be restored or balanced without jeopardizing the ability of future generations to enjoy a quality of life, education, employment and necessities similar to that enjoyed by people living in the region’s cities today. To make cities more sustainable, policymakers must understand that development decisions involve trade-offs in the use of resources and the way these are used for 21
consumption, exports, and asset creation. National accounting systems measure these factors, including GDP and other economic data. Governments and business rely heavily on this data for planning, budgeting and expenditure outlays. Accounting for social and environmental capital was introduced by the United Nations (UN) National Accounting Integrated Environmental and Economic Accounting system in 2000.44 Most economies in the region use the UN system for reporting in the national accounts. Cities are also beginning to use the UN system, making the expenditure of public funds more environmentally, economically and socially accountable. Two APEC cities that have adopted the UN system of environmental or green accounting are Yokosuka City in Japan and Melbourne in Australia.45 The UN accounting system offers a good way to measure the balance and flow of the stock of economic, social and environmental capital of economies and their cities.46 Given that more than 75 percent of the region’s labour force, economic production and capital formation occurs in cities – a figure that will increase in future as more people move to or end up living in cities – the region’s urban governance frameworks will have a very significant impact on the formation and use of natural capital. To enable them to understand and influence such investment in a more sustainable direction, cities in the region will need to adopt localized sustainability accounting systems, including the preparation of city capital flow statements and balance sheets. These will become important in the planning, development and management of cities and metropolitan regions. This change will be very challenging for many cities in the region, given their poor traditional accounting systems. Few cities know the current value of their public and private assets; many have no reliable estimates of GDP; and most know little about the levels of carbon emissions, or the extent of knowledge capital. Systems of sustainability accounting could be adapted readily to the development and management of cities. Their use will have a significant impact on shaping the outcomes of sustainability efforts in the region. They provide a sound quasi-empirical basis for negotiations aimed at more sustainable development outcomes at member-economy as well as local levels. More data and information are needed to inform how the governance, environment and systems of economies at various levels can be changed to achieve more sustainable development outcomes in cities. It is in the systems of cities where the problems of climate change, pollution, poverty, income disparity and inequity are now most apparent and have the potential to become much more severe. The problems of climate change, in particular, will not be resolved without reform of the urban governance arrangements that determine the allocation of resources and consumption patterns at the local level. Improvements in trade, investment, and economic development will not occur without reforms to urban governance. Problems of equity, poverty, housing and environmental health will not improve without changes to urban governance. The interaction and tradeoffs between consumption of resources and the production, or loss of capital, between the five environments shaping sustainability () will not be the same for all cities. Each city in the region is different, and the approaches to sustainability will need to be tailored to each city. However, many of those decisions will need to be cognizant of the consequences of local actions on the wider system of cities in the region, each of which will become increasingly reliant on others for their future development and prosperity. 22
1.10 CHALLENGES TO ACHIEVING SUSTAINABLE URBAN DEVELOPMENT IN THE REGION Future development and management of cities in APEC member economies must be put on a more sustainable, equitable and inclusive development footing if the region is to prosper; and the problems associated with rapid urbanization are to be managed better. As discussed earlier, cities of the region are made up of complex structures and interacting systems that have enabled those cities to thrive and develop. The structures include the physical infrastructure, assets and buildings that mould the physical system and form of cities. The systems are the economic, social and governance arrangements and the networks of infrastructures that enable cities to function. Many aspects of urban systems in APEC member economies’ cities are overloaded and function poorly. This is manifest in problems of congestion, distorted land and property markets, environmental hazards, crime and low levels of productivity. In this complex environment, applying the framework for sustainable city development () to the analysis of current systems could help establish clear priorities for development. This section summarizes the issues based on an analysis previously conducted for the region.47 It describes the key social, environmental, economic, physical, and governance challenges. 1.10.1
Poverty
While there have been many successes and considerable improvements in living standards and working environments for the region’s poor, in many cases, the absolute number of people living in urban poverty has not reduced, but is in fact rising.48,49 Indonesia, Mexico, Papua New Guinea, Peru, the Philippines, and Thailand have all experienced increased absolute numbers of urban poor.50
23
Photo 1.3 Slum Settlements: A Major Challenge to Improving Living Conditions in Some APEC Economies
Credit: B.H. Roberts.
Urban poverty is linked to the inability of cities to provide essential infrastructure and services. Following the slowdown in growth resulting from the 2007 global financial crisis, job creation in cities has become increasingly important. Without new jobs, continuing knowledge-building and better information systems, there is a risk that some of the region’s cities will experience a depreciation in their economic, social and environmental capital. Cities in the region that are experiencing a high level of urbanization cannot afford to let this happen. APEC member economies, G20 members and local governments in the region recognize this problem, and are focusing on policies to mobilize capital and resources more effectively and efficiently, but within a framework of sustainable city development. 1.10.2
Social and Environmental Costs
The social and environmental costs associated with production and consumption of goods and services, particularly costs arising from pollution, should no longer be transferred from one city in the region to another so that one enjoys a higher quality of life than another. This simply denies the true costs of production and consumption. Governments and consumers have willingly ignored the cost of pollution and public health on people living in the cities of developing economies. As a result, many developing cities, particularly in the Asian region, have very high pollution rates, while cities in the advanced economies have cleaner air. This is not an equitable distribution of the full costs of producing goods and services across the region. This inequity could be addressed if governments and consumers in the region were prepared to accept full environmental and social costs by introducing greater transparency and accountability into their national accounting systems.
24
1.10.3
Governance
Changing the direction of city development requires new governance systems. All cities operate and function in response to a complex set of interacting flows and forces that shape the dynamics of urban systems and their impact on the environment. Urban governance provides the overarching structure that guides and manages these flows and forces. Urban governance is the strategic architecture51 or blueprint for decision-making concerning a city’s development goals. It includes the use of capital and other resources; the laws, rules, plans and policies that govern society; and the delivery of urban development, infrastructure and community services, investment and the desired image of cities. The causes of urban governance and management failure in Asian and other cities have been extensively documented. The United Nations Development Programme (UNDP) Strategy Paper on Sustainable and Inclusive Urbanization in Asia,52 the UN-Habitat report on The State of Asian Cities and the Asian Development Bank (ADB) study on Managing Asian Cities provide a comprehensive review of why urban systems are failing to deliver more sustainable city development outcomes. Other reports and studies have explored similar themes.53 While there are compelling arguments about the need to reform urban governance systems in the region, the ways to do this are by no means clear or easy. Recent structural adjustment programmes, while reforming major institutions and industries, have not led to notable change at the local government level, especially in secondary cities. Traditional management models proposed for restructuring local governments based on consultative and western corporate business practices often do not align well with cultural values and workplace practices. If reforms are to occur, new urban governance systems and practices are required to guide Asian cities towards a more competitive and sustainable development future. A key challenge in addressing the causes of poor urban governance lies in determining which causes of failure or weakness should be addressed first, and this requires extensive research and consultation with stakeholders who play a significant role in decisions that shape the development of cities. The research conducted for this book included a series of workshops, an expert panel, desktop research and consultations with government officials to focus on specific aspects of urban governance that are proving particularly problematic. Areas of concern identified as having a significant impact on the failure of urban governance were governance arrangements, strategic planning, and resource management. These areas are covered in many of the book’s case studies. 1.10.4
Managing External Factors and Risks
Cities in the region must also recognize the importance of managing a range of external factors (especially risks) that affect them. Factors such as competition and globalization will require actions to boost competitiveness, foster local endogenous economic growth, adopt more inclusive and transparent governance, and create greener cities; this would require more collaborative approaches to the management and development of cities.54
25
While local governments can act on some of the external risks facing them, they have limited capacity to influence the impact of free trade agreements, exchange and interest rates, freedom of information, and global internet retailing. They must, however, find ways to adapt and compensate for these factors at the local level, and inform local communities about potential consequences. Job creation, initiatives to attract investment, improvements in the efficiencies of government and logistics systems, improved living wages and living conditions, and well-managed urban development will be essential priorities for cities seeking to manage external risks and competition. 1.10.5
Information Systems
To improve the management of cities and put them more firmly on the path to sustainability, better data and analytical methods are necessary to assess problems, monitor trends and model solutions. Establishing systems for data collection, and accounting for financial and resource flows, and for assets, are some of the most basic and difficult challenges in the development of cities in the region. All cities in the region should identify and value all public assets and prepare corporate balance sheets to enable better management of physical-capital stock.55 While time will allow the replenishment of some of the natural-capital stock, cities can ill afford to allow economic, physical, social and human capital to depreciate or become depleted. 1.10.6
Managing Stocks and Flows
The sustainability of cities will require the stabilization of the city’s total capital stock, usually requiring the rebuilding of its natural capital. This task is even more challenging because most of the damage or the depletion of the natural-capital stock has occurred in the hinterlands and corridor systems that supply the daily needs of cities. The restoration of environmental capital in cities is not just an urban problem, but a rural–urban problem associated with rural–urban linkages.56 For this reason, the sustainability of cities is a systems problem that will call for the development of frameworks for creating networks encompassing cities and their hinterlands that are underpinned by governance systems that are more cooperative and collaborative. A key element of cooperation and collaboration will be the formation of a wide range of new partnership structures between cities, their governments, businesses and communities. This is an area in which APEC could play a leading role. 1.10.7
Free Trade Agreements
For decades, many larger cities have engaged in sister city relationships. Most of these have involved agreements that encourage greater cultural and business exchange between the cities. Many cities are also involved in partnerships and networks. While networks and partnerships between cities appear to be a sensible way to boost economic outcomes for member economies and the region, as a whole. A study in New Zealand that reviewed cities’ international networks found little hard evidence of them doing so. 57 The study found: … that there are few common themes showing networks (especially sister city networks) have added value over time while others have folded before their effectiveness could be observed. Some networks are top down, central 26
government driven and others are bottom-up, local government driven. Some focus on contiguous regions while others are dispersed. Some focus on a specific task, such as lobbying central government, while others coordinate various back office functions and interventions.58 The research shows that in most cases the networks have not been particularly influential in bolstering trade and investment between cities because many economies still have trade and investment barriers embedded in their laws and regulations. The study also found that international city networks that focus on improving economic performance are more effective if they concentrate on improving institutional settings. But even these have had limited impact, as the drivers of economic growth (human capital, physical capital and technology) are usually addressed by central government policy, usually in a siloed manner (not integrated in ways useful to a city), and seldom in collaboration with cities. There is, therefore, a disconnect between local economic development and partnerships between cities, and trade and development initiatives under free trade agreements between economies. Central governments tend to forget that the machinery of trade and investment between economies is located mostly in cities. With the emergence of arrangements like the North American Free Trade Agreement (NAFTA) and the Trans-Pacific Partnership,59 which includes many APEC economies, cities will be in a better position to engage in city-to-city trade arrangements. The TransPacific Partnership between the USA, Canada and 10 other economies in the Asia-Pacific region is expected to eliminate tariffs on goods and services, remove a host of non-tariff barriers and harmonize many regulations among APEC members. These members account for 40 percent of the world’s GDP and 26 percent of the world’s trade. Other trade partnerships likely to develop in Asia under the Association of Southeast Asian Nations (ASEAN) will significantly open competition and increase the level of engagement between cities in Southeast Asia. In South America, the Pacific Alliance was established in 2011 to create a Latin American bloc of economies and a gateway into Asian markets.60 The bloc, made up of Chile, Colombia, Mexico and Peru, is engaged in commercial, economic and political integration among member economies. These economies account for more than one-third of Latin America’s GDP. The Southern Common Market (Mercosur) bloc, which includes Chile, accounts for 20 percent of Latin America’s GDP. Existing and new free trade agreements will bring significant challenges for cities. While the agreements will reduce many of the barriers that have prevented sister city relationships fully developing between economies, there are now significant constraints on investment and trade in cities themselves. Issues such as poor logistics systems, labour performance, corruption, lack of single window approval systems, and restrictive legislation and practices, will bring pressure upon cities in the region to undertake reforms and investments that may not be popular in local communities. Addressing how cities engage with communities in introducing changes that create new opportunities for trade, investment and economic development under a more open and competitive market will be challenging, particularly for cities that have been relatively protected from international competition.
27
1.10.8
The Third Industrial Revolution
Industrial revolutions have had a profound impact on shaping the way we produce things, where we live, and our progress toward more equitable and prosperous societies. The first and second industrial revolutions were driving forces in shaping modern-day society. Those revolutions witnessed significant changes over two and a half centuries – in ideology, social hierarchy, manufacturing and distribution, international relations, trade linkages and, most notably, technological advancements. The emerging third industrial revolution (TIR) will also have significant effects – changing almost every aspect of our society, especially the way we live and plan.61,62 There will be greater use of computer-aided manufacturing and three-dimensional (3D) printing, which will have the effect of reducing the marginal cost of production, eliminating economies of scale for many short-run manufacturing costs. The TIR will fundamentally change both the nature and spatial location of manufacturing processes; capital/labour cost ratios; and place a much greater focus on efficiencies and time delivery costs of manufacturers and distributors. It will increase demand and reduce unit costs in the production and supply chain for designer-driven products such as fashion, pharmaceuticals, construction and accessories. It will also provide equity of access to many goods and services in regions that are not able to create competitive advantage through economies of scope and scale. In essence, for many products and services (especially for simple manufactured goods and replacement parts), product supply chains will become more concentrated on the sourcing and delivery of materials for 3D printing and on materials recycling. The effects of the TIR will be a progressive reshoring and glocalization of many manufacturing activities, reinvigorating small-scale local manufacturing of personalized products. This is a response to technological changes toward more personalized medicine, home and consumer-designed products. The effect of this long-term in the APEC region is that cities with exogenous export manufacturing will face increasing competition from local TIR firms. These firms will have the advantage of minimal production transaction costs, minimal transport costs and almost no intermediary costs. One recent Australian study63 suggests that more than 40 percent of current labour-based costs will be replaced by TIR technology and robotics in the next 20 years. Cities in the APEC region that rely heavily on economies of scale or export-led growth will need to adjust their economic development models. They will need to focus on fostering endogenous growth, expanding domestic markets and enhancing local productivity and the per capita wealth base to ensure a sustainable economic model for development in the future.
1.11 A NEW SUSTAINABILITY AGENDA FOR CITIES IN THE REGION Cities are critical to the implementation of the sustainable urban development agenda. The document of the United Nations Conference on Sustainable Development (Rio+20), The Future We Want,64 reaffirmed the political commitment to addressing the persistent challenges related to sustainable development, including in cities, with a broad package of commitments for action. The UN’s Sustainable Development Goals, which replaced 28
the Millennium Development Goals, include a goal for the development of sustainable cities. Urban policies throughout the APEC region place a high priority on the sustainability of cities. APEC’s discussion paper on Shaping the Future through an AsiaPacific Partnership for Urbanization and Sustainable City Development (2014) provides a framework for the organization to support a strong policy agenda for sustainable cities. Many of the actions arising over the sustainability of cities need to be driven by political leadership and urban managers. Currently, however, there is no sustainability agenda defined for cities in the APEC region. Thus, many of the region’s cities have grown in a somewhat uncoordinated, haphazard manner, leading to very uneven development and excessive stress on urban systems. The need for sustainable city development in APEC member economies is becoming more apparent over time. Rising traffic congestion, poor metropolitan urban governance, and management, impacts of climate change, pollution, poverty, crime, low-income housing, liveability and job creation are challenges faced by almost every city in the region. The NEG paradigm carries with it its own set of challenges which are unlikely to be resolved using current approaches. Fujita cites the advantages of NEG generating centripetal forces fostering agglomeration, linkages and economies of scale, but also of the challenges of counter centrifugal forces of congestion, sprawl, commuting and other environmental externalities creating diseconomies and de-industrialization in large global cities.65 The framework for sustainable city development () is the basis for a new agenda to enable an integrated approach to support the sustainable development of cities in the APEC region. Such an agenda calls for changes in the management and development of cities, along with a strong focus on innovation, collaborative business and governance models, a focus on renewable energy and resources, efficiencies in transport, logistics and knowledge management systems, green building design, technologies, and finance. APEC, given the global significance of its economic position, its population, and scale of development, should have a leading role in shaping a new agenda for urbanization and sustainable cities – not only at the regional, but also at the global level. APEC’s efforts to support the sustainability of cities in the region will need to focus on better urban management and governance, job creation, innovation and investment initiatives that add value, and on developing the capital base of cities. These efforts will be particularly important for secondary cities, which are not receiving equitable investment. Jobs and economic growth opportunities in secondary cities are not being maximized; those cities often struggle to compete for trade, investment, skills and resources which are more abundant in the largest cities in the region. APEC is one of many organizations that recognize the importance of managing urbanization to achieve sustainable urban development. It can play a major role as a stakeholder and partner in support of real change toward this goal within the region. It could best do this by focusing on areas where it can exert influence and mobilize resources to support innovative programmes and initiatives for sustainable urban development in APEC member economies. The emphasis should be on building partnerships to foster economic reform, build strategic infrastructure, social and 29
environmental sustainability, and effective urban governance at the regional policy and urban systems level.
1.12 NEW MODELS FOR URBAN GOVERNANCE IN SUSTAINABLE CITY DEVELOPMENT Many local governments in the region, faced with managing rapid urbanization, will simply muddle through66 as best they can. Consequently, the development of these cities tends to be less sustainable. The quality and performance of city governance are the most significant factors in improving sustainability.67 Governments, international development assistance agencies and financing banks must identify better ways to improve the management and development of cities, including their peri-urban areas. For example, investment of substantial amounts of capital in infrastructure is not sustainable if those assets cannot be maintained, or the costs recovered. Similarly, failure to integrate transport, infrastructure, and land-use planning activities with appropriate governance should not be accepted. Developing dynamic, sustainable cities would require proactive and comprehensive action to increase economic, environmental and social sustainability.68 Solutions exist to address many of the problems in these areas, and it is up to the governance institutions and agencies involved to provide the leadership and will to implement those solutions. The challenges of managing urbanization across the region occur at different scales, scope, geography and levels of development. This section introduces some key concepts of governance that need to be fostered through APEC-sponsored partnerships to lay the basis for sustainable urban development in APEC member economies. 1.12.1
New Public Management
Most of the public-sector models used for governing and managing cities in the region were developed in the early part of the nineteenth century. Many were built on colonial administration models that were successful when cities were small. Urban governance was primarily driven by rules and regulations; the organizational arrangement for public sector institutions emphasized scientific method, efficiency, professionalism, structural reform and executive control.69 The duties of administrators were primarily planning, organizing, staffing, directing, coordinating, reporting and budgeting.70 Government agencies were organized according to a structured hierarchical system of departments. Employment was focused on a career for life, and promotion was based on experience and length of service. Throughout many of the developing regions that continues to be the model for urban governance. Unfortunately, the model is not particularly responsive when dealing with open market economies, open systems of government and merit-based employment and promotion arrangements.
30
In the late 1980s a new theory of urban governance called new public management (NPM) emerged. Rethinking the Approach to NPM was based on the idea that the public sector Urban Governance is Key to the could improve its efficiency and develop a more Sustainable Development of service-oriented culture by drawing on private-sector Cities management models. NPM argued for the need for greater accountability and transparency and consultation with relevant stakeholders on planning and budgeting. The NPM model led to ‘greater outsourcing of public functions to the private sector, the introduction of corporate planning, the flattening of management structures and a move towards partnerships for development’.71 Economies and cities also began to see public– private partnerships as a good way to finance infrastructure development. NPM was adopted widely in many market economies, with New Zealand; Australia; the UK; and the USA being some of the more enthusiastic. Elements of NPM have been adopted selectively in developing economies and cities, notably through the implementation of measures to introduce accountability, consultation and partnerships for development. NPM resulted in the division of large bureaucracies into small units and the privatization of some units, such as waste management and engineering services, as these were no longer considered core to the new streamlined functions of local government. Under NPM, competition was encouraged between different public agencies and between public agencies and private firms, using economic incentives based on performance bonuses or user-pay models. It had a philosophy of treating public users of services as ’customers’ or ‘clients’ rather than as citizen stakeholders.72 NPM governance is not widely understood or accepted by central and local governments in many Asian economies and cities. NPM can be threatening to institutions that have not previously experienced competition or pressure to become more efficient. It threatens bureaucratic power structures, nepotism, wage and working condition agreements, and opens up organizations and institutions to criticism and accountability. However, changes are now being forced on governments, particularly as a result of social media, which challenge almost every aspect of urban governance.73,74 Increasingly, all levels of government will need to move towards introducing e-governance systems in public policy, planning, community engagement and information sharing. 1.12.2
Collaborative Governance
Business and civil society, throughout the region, increasingly seek fresh ideas and thinking in approaches to urban governance. Many economies within the region have introduced changes for a range of decentralization processes that give local governments greater responsibility for the delivery and management of infrastructure and services. However, decentralized models of public sector management need to be built around governance principles, which are interdependent and mutually reinforcing and involve greater consultation, cooperation and collaboration between all sectors of society.75
31
Unfortunately, the NPM model has not provided universal success in improving urban governance performance in developing cities’ economies. Many indicators of urban governance reform inherent in NPM have not improved over the past decade. New thinking and models, therefore, must be developed, tested and adopted if cities in the region are to use their assets and resources better to improve the planning and institutional governance systems. Collaborative governance is a relatively new approach to the theory and practice of management. In the urban context, it involves a governance arrangement where one or more public agencies directly engage non-state stakeholders in a collective decisionmaking process that is formal, consensus-oriented and deliberative, and that aims to make or implement public policy or manage public programmes or assets.76 The approach shows considerable promise in overcoming the complexity and conflicts in decisionmaking that affect the management of cities. It has the potential to address all the key elements of the model for sustainable city development () and guide investment in the assets of a city in a greener direction. However, the approach needs to be further developed if it is to become more widely accepted and used. Organizations like the Asian Development Bank (ADB) and the United Nations Economic and Social Commission for Asia and the Pacific (UNESCAP) have begun to investigate the applications of collaborative governance models as a way of overcoming deeply ingrained structural shortfalls in many local government systems of cities within the region. Economies such as New Zealand, Canada, and Australia have moved substantially toward a collaborative governance model as a means of overcoming impediments to better planning, service delivery and maintenance of assets in larger cities. A key element of collaborative governance is the formation of partnership arrangements for a range of services delivery. 1.12.2.1 New Ideas for City-to-City Partnerships Some cities have recognized the significant opportunities created by international and regional free trade agreements and have reoriented their strategic infrastructure and governance systems to reap the benefits through innovative networks and partnerships. As with corporate business, a city’s political and business leaders need to examine new ways to ‘fashion strategic partnerships with their natural trading partners’ cities to expand the flow of ideas, investment, talent and goods and services between their markets’.77 Such partnerships could pave the way for sustainable growth by working together to, for example, remove barriers to trade and investment at local government level, and fostering collaborations between like and competitive clusters of industries that could take advantage of value adding to finished products and services at the local level to help reduce transaction costs. An example of such strategic partnerships is the Global Cities Economic Partnership agreement signed between Chicago and Mexico City in 2013. This was not a typical sister city partnership. The scope was ambitious, involving a series of joint initiatives in trade, innovation and education aimed at enhancing the two cities’ growth and their global competitiveness (see Section 10.6 for more on this partnership).78 This partnership is a good model for how cities can work together in the future. 32
Cities can foster a broad range of partnerships, both within their jurisdictional boundaries and hinterlands and with other cities. Using a systems approach, Table 1.4 shows the different kinds of partnerships that could be developed at a local level within cities to encourage greater value adding, and reduce transaction costs in gaining access to common user services and facilities. In so doing such partnerships could make a significant contribution to sustainability through the reduction of unnecessary duplication and better utilization of resources and infrastructure, thus reducing operational costs of business and governments.
Table 1.4 Potential for Developing Multilevel Partnerships within Cities in APEC Economic
Research and innovation
Technology
Governance
Infrastructure
Labour and skills
Environmenta l
Central government
Co-funding LED projects Funding support for green economy initiatives
Collaborative research to improve the efficiency of urban systems
Partnerships for development of regional technology and ICT services
Multilevel planning and resource sharing processes, truly inclusive of cities, for development projects and building capacity for collaborative competition
Co-investment in infrastructure for inner-city revitalization and redevelopment projects
Partnerships with labour, and professional and knowledge industries
Collaborative partnerships and funds for city and local environmental management projects
Local (city) government
LED partnerships with business, providing infrastructure and support for greener production and consumption
Collaboration on urban R&D with universities
One window and single porthole access to government services
Collaborative governance involving departments and other local governments
PPPs for infrastructure delivery and maintenance
Partnerships with unions and professional organizations on skills development
PPPs for integrated waste management services
Global business
Industry-cluster development partnerships on best practice in green development
R&D opportunities for small-scale research
Local technology partnerships on transfer programmes
Partnerships for assessing and mitigating economic risks
PPPs with GC for infrastructure delivery, operations, and maintenance
Partnerships for skills development based on demand
Local environmental charters and support for local environmental improvement programmes
Membereconomy level business
Support for micro-credit schemes and business support for sustainable development
R&D opportunities for small-scale research
Industry groups
Partnerships for business collaboration between cities
PPPs for smaller scale infrastructure delivery, operations and maintenance
Partnerships for skills development based on demand
Local environmental charters and support for local environmental improvement programmes
Local business
Local business and government networks for disseminating best practice in green industry
Collaborative localized research partnerships for SMEs
Technology partnerships for localized product adaptation
Collaborative marketing of local products and services
Local area services repairs and maintenance partnerships
Job experience, workplace partnerships with education facilities
Partnerships for application of industrial ecology and cogeneration
Public utilities and institutions
Low carbon investments, collaborative maintenance and revenue systems
Collaborative R&D partnerships
Collaborative partnerships for technology development
Collaborative governance agreements
PPPs
Job experience, workplace partnerships with education facilities
Cogeneration and waste recycling
33
NGO community
Budgeting and planning of LED projects, fostering awareness of green consumption
Monitoring and evaluation of local programmes
Localized technology transfer and development projects
Local community planning and budgeting
Local services delivery and maintenance
Labour training schemes for skills development
Local environmental management of drainage and waste
Green economy initiatives
Other
GC = Good coordination; LED = local economic development; NGO = non-governmental organization; PPP = public–private partnership; R&D = research and development; SME = small and medium-sized enterprise Source: Authors.
Many other opportunities exist for partnerships involving collaboration and resource sharing arrangements to minimize public and private transaction costs in the region’s cities. This book will explore good-practice examples of initiatives that cities have supported or adopted to facilitate partnerships for sustainable urban development. 1.12.2.2 City-to-City Partnerships City-to-city partnerships, like the one between Chicago and Mexico City, are a new dimension of collaborative advantage that has significant potential to enhance the sustainability of cities in the region (Table 1.5). APEC can foster such partnerships by focusing on the ‘Green and Sustainable’ aspects of practice. Such initiatives will also have strong synergies with ongoing low carbon initiatives.79
Table 1.5 Potential for Strategic Partnerships between Cities in the APEC Region City partnerships
City-to-city level
Regional and membereconomy level
International level
Economic and trade
Intra-regional trade and investment partnerships to foster development of clusters
City-to-city trade development partnerships
City-to-city economic and trade development partnerships
Infrastructure
Metropolitan collaborative partnerships between local government units (LGUs) on infrastructure development
Collaborative partnerships for infrastructure development between cities in a member economy or the region
Collaborative partnerships for infrastructure development between cities in a member economy or the region
Social
Regional skills, education and knowledge sharing and development partnerships between cities
Skills, education and knowledge sharing and development partnerships between cities in a member economy
International skills, education and knowledge sharing and development partnerships between cities
Environmental
Integrated resource management partnerships between metropolitan, regional governments
Integrated resource management partnerships between cities and subregional governments
Cross-border partnerships for conservation and natural resource management
34
Governance
Metropolitan economic and trade development corridor authorities
Economic and trade development corridor authorities of member economies
Multiple economic and trade development corridor authorities
Source: Authors.
1.13 FOCUS AND PURPOSE OF THE BOOK A primary objective of this book is to elaborate on examples of ‘good practice’ and develop a framework and agenda for the sustainable management and development of cities in APEC member economies. The book uses the model for sustainable city development derived from to examine the competitiveness and efficiency of economies; strategic infrastructure; governance arrangements; innovative practices; economic reforms; and collaborative mechanisms between agencies, organizations and networks. Case studies reveal how cities leverage common infrastructure and resources in support of sustainable development; examine why there are gaps in urbanization management and urban governance, and identify policies and initiatives that cities use to promote and facilitate sustainable economic growth, trade, business development and job creation. This book has been written to support the APEC initiative for an Asia-Pacific Partnership for urbanization and sustainable city development, and the implementation of relevant outcomes of the APEC Leaders’ Meeting held in Beijing in 2014. 1.13.1 Investigation into the Sustainability of Cities in the Asia-Pacific Region The approach used to analyse the sustainability of cities in the region involved an extensive literature review and case studies. Fourteen case studies are included, which examine two different typologies in the systems of cities. These are: ‘stand-alone’ cities and metropolitan regions; and urban economic development ‘corridors’. Each case study investigates the five elements for sustainable city development identified in : Economic Environment includes a profile of the economies of cities that looks at support for the investment environment, business support, and innovation. Support for the investment environment includes initiatives to attract capital and development to cities and trade development corridor areas, exploring such things as entrepreneurship, value-for-money infrastructure, labour, and property required for business. Business support and innovation involve initiatives aimed at building ‘local economic dynamism’ through financial and other support, e.g. through the development of green industry in local clusters and their supply chains. Physical Environment includes not just built infrastructure and assets, but also the quality of service delivery provided by them. It includes infrastructure that is important to add value and generate higher levels of efficiency and urban economies. Building green logistics systems and other infrastructure to support local industry clusters; and the knowledge, health and wellbeing infrastructure that make cities smarter, healthier and less risky places to do business, are crucial elements of strategic infrastructure. It also includes the importance placed on the maintenance of assets which are essential to run and maintain competitive, efficient and clean cities. 35
Social Environment involves initiatives fostering a good quality of life and more knowledgeable, creative, innovative and inclusive cities. It also includes building levels of trust, lowering levels of crime and corruption, improving human rights and workplace health and safety conditions, which affect the productivity and performance of workers, especially in low-paid services and manufacturing industries. Such citizens will also push for a better environment and greener economy. Natural Environment (Environmental Sustainability) is concerned with maintaining the environmental quality of cities and ensuring the replenishment of degraded natural resources. Environmental sustainability is linked to systems used to ensure clean air and water, soil, etc. It also includes reducing the use of non-renewable resources, cleaner energy and production, industrial ecology, and materials recycling. Urban Governance Environment is core to this model. It is concerned with building institutions that are effective in managing multilevel urban systems and producing outcomes which make the development of cities more sustainable. Urban governance is concerned with good urban management, integrated planning, participatory decisionmaking, accountability and sound financial management of cities and public institutions. The urban governance environment also extends to areas of collaborative governance, partnerships, and resource sharing. Using this framework, the case studies investigate different partnerships which have developed between the public and private sector within the various systems of cities. Several types of partnerships identified in the case studies are shown in Table 1.4 and Table 1.5. In some case studies, specific initiatives are elaborated upon further because of their significance regarding the contribution they make to the management of urbanization and sustainable city development. In formulating policies, strategies and initiatives for an Asia-Pacific Partnership for urbanization and sustainable city development,80 APEC should seek to focus its efforts on these five elements of strategic importance. 1.13.2 Case Studies with Insights into Best Practice To develop a deeper understanding of some of the challenges at a metropolitan city level, and at the suggestion of the APEC Secretariat, a number of case studies were undertaken of cities in the region. The case studies were selected after consultation with urban management experts familiar with the development of cities in the region. Case studies are a good way of gathering evidence of good practice; they provide valuable insights into the ways cities in the region are addressing sustainability issues. Each case study identifies attributes of the five elements of sustainable city development, and partnerships that illustrate good practices that could be applied elsewhere in the region. The case studies include a range of cities, from megacities to medium sized secondary cities; and include large polycentric cities, regionally networked cities and corridor development cities. While some of these are still emerging, the case studies provide useful insights into how sustainable development opportunities can be fostered in cities located in emerging economic trade development corridors. 36
The ‘stand-alone city’ case studies include Auckland, Bandung, Brisbane, Manila, Lima, Kitakyushu, Mexico City, Santiago de Chile, Seoul and Taipei. The urban development ‘corridor’ cities include the Pearl River Delta, the Ho Chi Minh–Bangkok trade corridor, the Jing-Jin-Ji Circle and the Seattle–Vancouver urban corridor. The practices outlined and lessons gained from the case studies could be adapted and applied to other APEC member economies to help shape the overarching strategies for the development of competitive and sustainable cities in the Asia-Pacific region. The lessons gained are expected to lead to a better understanding of how APEC could provide support for:
Enhancing the investment environment through improving the productivity of human capital, providing value-for-money infrastructure services, and minimizing the bureaucracy Fostering innovation through providing the R&D support appropriate to industry clusters in the urban area Building a solid framework of business support services and encouraging the establishment of a full range of financial services accessible to the spectrum of a city’s enterprises Planning, financing, and building resilient strategic infrastructure appropriate to a city’s industry clusters and the systems and institutions for managing that infrastructure efficiently Developing a good, healthy environment, educated, engaged and empowered citizens, and enabling frameworks conducive to knowledge and enterprise development Delivering the environmental infrastructure, healthcare, education, water, power supply, and management systems to the innovators and investors Building a community consensus on safety, social inclusiveness, and environmental objectives Building transparent, accountable and collaborative urban governance systems that can span the spatial scope of economic organization – from cities to economic corridors between economies Undertaking the required planning, programme and project development, financing and implementation oversight for inclusive, resilient and climate change responsive development Supporting partnership programmes for sustainable development of systems of cities in APEC member economies
The case studies demonstrate the varying approach to overarching urban spatial policies in APEC member economies. Spatial urban policies for sustainability need to be targeted according to the typology and functionality of cities. APEC cities which have a focus on enhancing the economic drivers of city competitiveness, such as business dynamics, economic governance, human capital development and liveability, offer more favourable locations for business development, innovation, and investment.
37
1.14 BUILDING MOMENTUM FOR AN APEC ASIA-PACIFIC PARTNERSHIP FOR URBANIZATION AND SUSTAINABLE CITY DEVELOPMENT This chapter outlines some of the challenges of urbanization and sustainable development facing the cities of APEC member economies. These challenges will need to be considered carefully by APEC as it develops initiatives under its Asia-Pacific Partnership for urbanization and sustainable city development. This book provides background information, examples and context for discussion among APEC member economies to develop a framework for an APEC Asia-Pacific Partnership for urbanization and sustainable city development, which supports the pillars of APEC’s Growth Strategy adopted in 2010. The framework will provide the foundations for establishing partnerships to help shape regional policies, strategies and initiatives; and will take time to shape. The good practices and lessons presented in the book will provide material for APEC to engage with its member economies in supporting partnership programmes engaged in activities that bring about more sustainable development of cities in the region. Sustainable development is not just concerned with economic development and infrastructure-building, although these are very important. Cities are social places. They fulfil a wide range of social needs that must be captured in APEC’s agenda for sustainable city development. Similarly, the environmental dimension of sustainable city development related to climate change and healthier cities must be given higher priority if the region’s cities are to become more liveable and prosperous places. The building, accumulation and management of physical, economic, social and environmental capital are critical to achieving sustainable urban development. These elements of sustainability must be incorporated into an integrated approach to city, and thus member-economy level, development. Support in the Asia-Pacific region for sustainable urban development by APEC, using partnerships, could encompass a range of activities. An agenda for developing such partnerships is presented in the last chapter. It is important for APEC member economies to target activities where cities could work collaboratively to leverage resources to support partnerships with member governments and organizations, international development banks, local governments, business and research and development sectors.
38
2. Auckland, New Zealand Brian H. Roberts and Simone E. Roberts
2.1
INTRODUCTION
Auckland is New Zealand’s largest city, with a population of 1.4 million. Located on a narrow isthmus between the Pacific Ocean and the Tasman Sea, incorporating an area of 1,102.9 square kilometres, the city has grown rapidly as the result of a strong and dynamic economy, and high levels of immigration, especially from the Pacific Islands and Asian nations. Called the ‘City of Sails’, as a legacy of it hosting the America’s Cup in the early 2000s, Auckland’s harbour regularly is filled with hundreds of leisure boats. Auckland is considered one of the top 10 most liveable cities in the world.81 The city has undergone significant changes to its economy, demography and governance arrangements over the last three decades. Although a modern, well-developed and prosperous city, Auckland continues to struggle with problems associated with managing urbanization and past local urban governance issues, especially dealing with regional traffic, housing, and social issues associated with its complex mix of migrant and indigenous cultures. However, significant recent reforms to local government and improvements in the New Zealand economy have seen the city make considerable progress toward its transformation and revitalization.
Photo 2.1 Auckland City
Credit: Richard Harris.
39
The city has a very strong focus on sustainable development. Auckland has been very active in fostering sustainability approaches to urban and regional planning, housing, urban ecology, climate change, green energy and infrastructure, smart transport and participatory governance. Judged one of the most innovative cities in the Asia-Pacific region, it is a leader in areas of human talent diversity, technology innovation ecosystems and global integration in moving towards the future.82 Many of the city’s initiatives are in line with international good practice. The following chapter outlines key economic, governance, social, natural, physical and environmental issues facing the city of Auckland, and presents examples of sustainable urban development initiatives that have been adopted to address the growing challenges of urbanization and growth management. Many of these initiatives have the potential for adaptation and application in other cities in the Asia-Pacific region.
2.2
THE ECONOMY
Auckland is New Zealand’s gateway city for trade, investment, transport and tourism. The city’s estimated GDP in 2013 was NZD 86 billion (USD 66 billion), which accounts for 35 percent of New Zealand’s GDP. GDP per capita in 2013 was approximately USD 46,600 compared to USD 41,500 for the economy as a whole. The city’s GDP in 2013 grew by 2.9 percent, compared to 2.5 percent for the economy overall. McKinsey’s predicts that GDP could increase to USD 83 billion by 2025.83 For many years, the Auckland economy was moderately competitive relative to other Organisation for Economic Co-operation and Development (OECD) developed cities, with its relatively low productivity and labour performance.84 However, the economy is now becoming more competitive, largely due to economic and governance reforms, and free trade agreements with Australia and economies in Asia. The reforms stimulated diversity and economic growth, creating new investment opportunities and jobs in a range of industry sectors, attracting innovators and entrepreneurs from around the world (Table 2.1 Key Economic Facts).
40
Table 2.1 Key Economic Facts – Auckland Auckland Regional Government Area Value of the economy (2013)
NZD 86.074 billion (USD 66 billion)
Area
Urban 1,102.9 km2 (23%) Rural 3,791 km2 (77%) Total 4,894 km2
Estimated residential population (2014)
Urban 1,413,700 (92.6%) Rural 113,300 (7.4%) Total 1,527,000
Urban density (2013)
1,280 people per km2
Economic growth (2013)
2.9%
GDP per km2 (2013)
USD 66 million
Employment participation rate (2013)
64.9%
Unemployment (2013)
5.4%
No. of businesses (2013)
163,582
Key export sectors
Dairy, meat, wool and wood products, fish and machinery
Source: Auckland City Council, Monitoring Research Quarterly 4(1) (2011): 4.
2.2.1 Key Industry Growth Sectors Auckland is a magnet economy, pulling in labour, resources and capital domestically and internationally. As New Zealand’s primary population centre and employment hub, it is a prime focus for investment, particularly in the real estate, finance and leisure industries. Figure 2.1 shows Auckland’s industrial mix. Property and business services, manufacturing, finance and insurance, are the largest economic sectors and make up 40 percent of the city’s economy.85
41
Figure 2.1 Breakdown of GDP (percent) of Auckland’s Economy
Source: Auckland Tourism, Events and Economic Development (ATEED), 2013.
The largest industry sector comprises service industries catering to the local market. The growth in the economy and employment has been in low value adding services, driven by domestic demand for housing and rising household consumption leading to a steep rise in the growth of imports. The city recognizes the importance of increasing value added manufacturing and the export base of the economy but acknowledges this will need to be in more advanced technology-based products and services.86 Auckland’s key industry growth sector strategies, therefore, have become more focused on the export of niche advanced services in recognition of the city’s growing competitiveness in the fields of yachting, computer graphics, and knowledge services.87 2.2.2 Trade 2.2.2.1 Trade Flows The Port of Auckland handles over NZD 26.4 billion (USD 19.8 billion) of trade annually, being 37 percent of New Zealand’s total seaport trade, and 31 percent of trade for all ports, including airports.88 Figure 2.1 illustrates the current contribution of key industry sectors to Auckland’s GDP. Auckland’s trade is dominated by the services sectors, with the information and communications technology (ICT), creative and tourism industries being significant service industry export sectors. The city’s economic development strategy places a sharp focus on the strengthening of tourism, construction, engineering and ICT services with the goal of increasing the city’s overall GDP.89
42
2.2.2.2 Trade Agreements New Zealand currently has free trade agreements with many economies in and around the Pacific region including Australia; Hong Kong, China; Malaysia; China; Thailand; and Singapore. Negotiations are currently under way with Russia; Belarus; Kazakhstan; India; Korea; and the Gulf Cooperation Council, which manages trade agreements to the Middle Eastern market.90 As one of the largest international cities in Oceania, Auckland maintains formal relationships with a host of cities worldwide. Most notable are Auckland’s relationships with Australia and China. New Zealand’s top five export destinations include Australia (19%), China (15%), the United States (9%), Japan (6.5%), and the United Kingdom (3.3%). The top five products are concentrated milk (15%), sheep and goat meat (5.7%), butter (4.4%), rough wood (3.9%) and frozen bovine meat (3.8%).91
43
Figure 2.2 Key Economic Growth Sectors of Auckland Economy, million NZD, 2010 $4,000 $3,500 $3,000 $2,500 $2,000 $1,500 $1,000 $500 $0
Key Economic Growth Sectors $4,000 $3,500 $3,000 $2,500 $2,000 $1,500 $1,000 $500 $0
Key Economic Growth Sectors
Source: Based on data from Auckland Tourism, Events and Economic Development (ATEED), 2013.
2.2.3 Economic Competitiveness The Economist Intelligence Unit’s Hot Spots 2025: Benchmarking the future of competitiveness of cities (2013) ranked Auckland 42nd on the overall 2025 city competitiveness ranking of 120 cities. Auckland’s overall ranking was marginally higher than the average for the 120 cities surveyed, reaching an overall score of 56.7/100. The city demonstrated above average strength in ‘institutional effectiveness’, ‘physical 44
capital’, ‘social and cultural character’ and ‘human capital’. It ranked average for ‘financial maturity’ and below average for ‘global appeal’ and ‘economic strength’. In two categories, ‘institutional effectiveness’ and ‘human capital’, it ranked higher than both Sydney and Melbourne (Table 2.2).92
Global appeal
hazards
Environment al and natural
Human capital
Social and cultural character
Institutional effectiveness
Financial maturity
Physical capital
Economic strength
Overall
Table 2.2 Economic Competitiveness of Auckland, Melbourne and Sydney, 2013
Auckland
56.7
28.8
90.2
50.0
95.9
75.0
76.4
75.0
6.5
Sydney
63.1
31.3
98.2
83.3
94.8
95
68.7
75.0
25.5
Melbourne
62.7
31.3
100
83.3
94.7
87.5
68.9
83.3
18.9
Average for 120 cities surveyed
49.1
35.9
77.3
50.0
63.3
63.8
63.7
66.7
9.0
Source: Based on data from Economist Intelligence Unit, Hot Spots 2025: Benchmarking the Future Competitiveness of Cities (London: Economist Intelligence Unit, 2013).
2.2.3.1 Local Economic Development Local economic development in Auckland is driven strongly by the desire of both government and business to grow the city’s economy to become an internationally competitive city. Auckland’s economic development plan93 strongly focuses on a combination of five key factors:
Regulations and policies that are simple, easy to navigate and have a realistic impact on business’s bottom line Urban and virtual infrastructure that is world-class and highly efficient, making it easier and faster to conduct business and connect globally with customers, suppliers and knowledge Timely access to capital and technology to grow ideas and develop products Skilled and ‘ideas’ people, created through education and training, alongside research–business partnerships that generate and showcase knowledge Virtual cultural events, a built environment and urban amenities that make Auckland a desirable place to live, work, visit and invest.94
Labour Markets and Human Resource Development Auckland’s labour market employs up to one-third of New Zealand’s workforce. Almost 50 percent of all wholesale traders are based in Auckland, and 43 percent of all overseas goods are processed via the city, both through importation and exportation. The majority of Auckland’s workforce are aged between 25 and 44 years, with the highest proportion being of European ethnicity. Seventy-nine percent of the city’s population are employed full-time, predominantly in the areas of finance, insurance and business services. 45
Auckland, on average, has marginally higher weekly income than New Zealand as a whole.95 Table 2.3 shows employment by Standard Industry Classification (SIC) sector for the subregional districts of Auckland.
Table 2.3 Employment by Sector for Auckland Subregions, 2010 Sectors (Standard Industry Classification)
North
West
Central
South
Total
Agriculture and mining
1,836
443
570
2,823
5,672
Manufacturin g
9,650
7,890
25,960
28,981
72,481
Utilities and construction
8,070
3,360
15,490
8,994
35,914
Wholesaling
9,950
2,080
26,910
12,470
51,410
14,880
6,970
22,810
16,167
60,827
Accommodati on, cafes and restaurants
6,220
2,370
21,540
7,524
37,654
Transport and storage
2,840
1,300
10,700
15,910
30,750
Finance and insurance
3,150
630
18,160
2,049
23,989
16,770
4,470
80,520
18,376
120,136
Government, health and education
28,980
13,790
62,480
36,015
141,265
Other services
5,780
2,730
16,080
6,868
31,458
108,126
46,033
301,220
156,177
611,556
Retailing
Other advisory business services
Total
and
Source: R. Paling and J. Williamson, Economic Linkages within Auckland: Final Report (Auckland: Ascari Partners Ltd and Richard Paling Consulting, 2013), 114.
New Zealand’s labour market follows global employment trends, rising and falling in line with trends in OECD economies. There is a high demand for skilled labour. However, the 46
pressure of labour demand has not adversely impacted the performance of the economy. Job creation in many employment sectors in Auckland has been steady, and positive growth is expected, despite a net loss of 12,350 jobs in 2014.96 Economic Development and Employment Centres Auckland’s metropolitan area is divided into four geographic and economic subregional districts (Figure 2.3). The metropolitan commercial centres are located in the North Shore (‘North’), Newmarket, Ellerslie and the Central Business District (CBD) (‘Central’), and Manukau (‘South’). The major contributing area to the city’s GDP is Central. The polycentric structure of the city is the product of its geography, historical development and the former local government system. Until 2010 Auckland was governed by seven local councils. These were combined in 2010 to create the present Auckland Council. As a result, there are strong economic linkages between regional industry, commerce, retail and local government centres of the previous structure.97
Figure 2.3 Employment Regions in the City of Auckland
Source: The Auckland Plan 2015.
47
Table 2.4 Employment Location Quotients (LQs) for Employment Regions, 2010 Sectors (Standard Industry Classification)
North
West
Central
South
Agriculture and mining
1.55
0.82
0.18
2.27
Manufacturing
0.75
1.45
0.73
1.55
Utilities and construction
1.27
1.24
0.86
1.00
Wholesaling
1.10
0.54
1.06
0.94
Retailing
1.39
1.53
0.77
1.03
Accommodation, cafes and restaurants
0.94
0.82
1.16
0.79
Transport and storage
0.52
0.56
0.70
2.00
Finance and insurance
0.74
0.36
1.54
0.33
Other advisory and business services
0.79
0.49
1.36
0.60
Government, health and education
1.16
1.29
0.90
0.99
Other services
1.04
1.18
1.04
0.86
Source: Adapted from R. Paling and J. Williamson, Economic Linkages within Auckland: Final Report (Auckland: Ascari Partners Ltd and Richard Paling Consulting, 2013), 114.
Table 2.4 shows employment location quotients (LQ) for the four employment regions of the city for 11 SIC industry sectors. Employment LQ is an indication of the level or concentration or specialization of employment and economic activities relative to the region as a whole. It provides an indication of competitiveness or relative advantages of economic activity. According to the LQ, in the South, the labour force is predominantly engaged in agriculture, manufacturing and transport, the latter two being significant employment sectors. In the Central region, employment is dominated by insurance, finance, and other business advisory services. The West is predominantly manufacturing and retailing, while the North is predominantly agriculture and retail services. The North is primarily a dormitory extension of the city, with more than 170,000 vehicle trips taken daily southbound across the Harbour Bridge. The enormous diversity of LQ in the employment pattern, especially in the primary employment sectors, is a significant contributing factor to the city’s traffic congestion problems. 2.2.6 Innovation, Creativity and Business Entrepreneurship Auckland’s economic development plan places great emphasis on the importance of innovation, creativity and entrepreneurial business. The plan argues that with better governance, nurturing and promotion of innovative businesses, improved infrastructure and investment in education and skills Auckland will become more attractive to international investors.
48
The seaport is adjacent to the CBD and has been expanded through an extensive programme of reclamation works. The CBD is the highest employment generator, contributing to 48 percent of the city’s jobs. Manufacturing, wholesaling and distribution occur more commonly in South Auckland around the area of Manukau and Auckland Airport. South Auckland provides the second highest employment levels.98 Auckland’s greatest global assets, knowledge and education, are mainly concentrated on the North Shore and Albany. This area hosts a broad industrial mix and is becoming the fastest-gentrifying locale economically and physically within the city.99 West Auckland houses a significant population of low income earners and has high levels of unemployment. The area is a significant regional service industry centre. It has some manufacturing, but does not have the strength in the smart industry and business activities that the central and southern areas do.
2.3
STRATEGIC INFRASTRUCTURE AND ASSETS
As New Zealand’s primate city, Auckland has a significant inventory of strategic infrastructure and assets which support its economy and its role as the logistics and trade hub for the Southwest Pacific Island economies. The city’s airport handles over 3.7 million passengers a year, and almost 75 percent of the nation’s air traffic movement. The main port is the principal departure centre for the Southwest Pacific cruise industry. The metropolitan area is well-connected by train and a network of roads to surrounding provinces. By international standards, the city has high-quality water supply, sewerage, storm water and wastewater management, electricity and telecommunications broadband internet systems. Table 2.5 lists the city’s primary strategic infrastructure assets. The city’s softer strategic infrastructure such as its universities, hospitals, and cultural and recreation facilities are of international standard. Its logistics systems are well-developed; however, the capacity of the existing road network infrastructure is often severely constrained as a result of underinvestment during the late 1990s and 2000s. The polycentric structure of the city has resulted in the development of a number of subregional logistics hubs, which offer reasonably high quality accessibility to services and infrastructure in support of industries and commercial employment nodes.
49
Table 2.5 Inventory of Auckland’s Strategic Assets Infrastructure Class
Existing Critical Infrastructure
Infrastructure Class
TRANSPORT
TELECOMMUNICATIONS
Roads
State highways and access points to and from state highways Northern busways The arterial road network
Railways
Rail Lines Britomart rail station Newmarket, Sylvia Park, New Lynn, Onehunga rail stations and the network of local stations
Ports
Airports and airstrips
Auckland Airport Ardmore Local airports, e.g. Dairy Flat, Kaipara Flats, Great Barrier, Waiheke and others Whenuapai Military Airbase
Broadband
Wastewater
Storm water
University of Auckland (includes marae and fale Pasifika) Auckland University of Technology (includes marae) Unitec (includes marae) Manukau Institute of Technology Massey University Secondary schools Primary schools Early childhood education centres
Health
Justice and corrections
Metropolitan wastewater treatment plants (Mangere, Rosedale, Army Bay, Pukekohe) Wastewater trunk mains over 300mm in diameter and those that serve critical infrastructure (e.g. hospitals) Wastewater pump stations on the trunk mains Non-metropolitan wastewater treatment plants, e.g. Warkworth, Beachlands and others
Defense
Whangaparaoa Military Training Area Whenuapai Military Airbase Devonport Naval Base Kauri Point Ammunition Depot Papakura Military Camp and Ardmore Military Training Area
Emergency
Mechanics Bay Marine Rescue (Coastguard etc.) Police, ambulance, fire headquarters
and rescue services
Pipe network Retention/detention ponds Swales Soakage pits
Gas and liquid fuel
Southdown generation plant Otahuhu B generation plant Otahuhu A generation plant Electricity transmission lines, towers and cables Electricity substations
Auckland Hospital: Grafton Auckland Hospital: Greenlane Middlemore Hospital North Shore Hospital Waitakere Hospital
High Court Southern Courts at Manukau Auckland Prison (Paremoremo) Mt Eden Prison and Mt Eden Corrections Facility Auckland Region Women’s Correction Facility
Community and cultural facilities
Auckland War Memorial Museum Auckland Art Gallery (Toi o Tamaki) Auckland Zoo Marae Library network
Recreation and sporting facilities
International-standard sports and events facilities including: Eden Park, Vector Arena, Mt Smart Stadium, North Harbour Stadium
Public open spaces
Auckland’s network of parks City parks Playgrounds
ENERGY Electricity
Southern Cross cable Australia–New Zealand cable Mayoral Drive exchange complex Telephone exchanges Radio DNR, CMAR links Wifi
Education
Port of Auckland Centre Onehunga Port Wiri Inland Port Metro Port
Sources include dams and abstraction facilities Raw water mains and water supply reservoirs Water transmission pipelines over 200mm in diameter and those that serve critical infrastructure (e.g. hospitals) Water treatment plants including Ardmore, Hula and Waikato
SOCIAL
WATER Water supply
Existing Critical Infrastructure
Wiri to Airport fuel line Marsden to Wiri fuel pipeline High-pressure natural gas pipeline Liquid fuels and gas storage, Wynyard Quarter (limited time)
Source: Auckland City Council, Asset Management Plans 2015–2025; Auckland Transport, ‘Asset Management Plan Update 2014’ (Auckland: Auckland Transport, 2014), 36.
50
There has been substantial, and continuous investment in knowledge, research and development to support business, but in many cases this has not been sufficient to keep up with demand and create the critical mass leading to competitive advantage. Business systems infrastructure which supports investment and development have improved significantly in recent years, but there is need for substantial investment in strategic infrastructure and other assets to make the city more competitive. 2.3.1 Physical Infrastructure and Assets Auckland is a corridor city; its urban form is shaped by its natural topography, landscape and infrastructure corridors. While its infrastructure meets most of the needs of a successful functioning city, significant issues are apparent if Auckland is to be competitive and continue to flourish. International and domestic migration to Auckland is predicted to increase the population by over 700,000 in the next 30 years. This places significant demand on existing infrastructure and creates need for quality management and maintenance of current, and integrated implementation of new, infrastructure. Population growth will also place pressure on housing demand and development and could have significant impact on housing affordability. Auckland residents have come to expect high-quality services, in line with the economy’s high standard of living. The increasing population growth is putting significant pressure on local services, specifically public transport, arts and community centres, playgrounds, sports fields and walking and cycling networks. Population growth will require increasing levels of investment to maintain and repair utility services; the changing demographics and growing intensity of development will require careful planning of infrastructure and community services assets for different areas.100 Environmental sustainability is a significant issue for the city’s land-use and infrastructure. Auckland has the potential to be severely affected by climate change. Current infrastructure is not capable of managing rising sea levels, sea surges and other coastal hazards, volcanic ash and volcanic activity, increasing air temperature, changes in agricultural conditions, drought, earthquakes, tropical cyclones, torrential rains, winds and storm surges, and potential health problems.101 2.3.2 Public Infrastructure Reinvestment Plans At the domestic level, New Zealand has a 20-year National Infrastructure Plan. The plan envisions that by 2030, New Zealand’s infrastructure will continue to be resilient, coordinated and contribute to economic growth and increased quality of life.102,103 New Zealand’s largest city has developed the Auckland Plan, which recognizes that infrastructure investment is not simply a response to demand; but a tool to shape growth within the urban system that will generate wider benefits.104
51
Figure 2.4 The Influence of Infrastructure in Auckland
Source: The Auckland Plan 2011.
Figure 2.4 demonstrates the role of different types of infrastructure in shaping the urban form of the city. The Auckland Plan, which is discussed in more detail in Section 2.6.2, has two key principles: better use of existing infrastructure, and better allocation of future investment. These principles also guide Auckland’s approach to infrastructure development contained in the draft Auckland 30 Year Infrastructure Strategy Long-term Plan 2015– 2045 (LTP).105 Public infrastructure plans for Auckland centre around growth, resilience and environmental sustainability and the LTP recognizes the following key elements of reinvestment and public infrastructure plans:
The importance of investing in the right infrastructure to best manage and shape growth and influence demand Encouraging investment in emerging technologies Holistic and horizontal planning and implementation of infrastructure to all areas.
Guidelines for planning infrastructure, consistent with the 30-year time horizon of the LTP, follow a sustainable development approach. A feature of the LTP is that it prescribes an integrated approach to the delivery of infrastructure guided by the availability of funds. It recognizes that priority should be given to meeting basic needs for urban services, but also the need to provide services to employment districts that will create jobs for the city. The LTP provides the basis for annual and medium term rollover plans that assure continued funding for projects and programmes so that these can be completed within specified time frames. The rollover provision avoids the problems facing many cities in the region that are working with annual budgeting that leave projects without funds for completion when delays occur at the end of a financial year.
52
2.3.3 Operation and Maintenance of Infrastructure Auckland has suffered several infrastructure failures. In 1998, a series of failures in old power cables left much of the CBD without electricity. It took five weeks to restore the power supply during which time about 60,000 of the 74,000 CBD workers were forced to work from home or were relocated to offices in the suburbs. The power failure had a cumulative effect on other utilities. The compensation cost to business and disruption to the CBD ran into hundreds of millions of dollars. The city has also faced cable failures, a water crisis and gas supply disruptions. The source of failure in the city’s infrastructure was not local, but resulted from events occurring both inside and outside of the region as a result of natural or technological hazards, human error, equipment failure or poor maintenance. The need for the city to future-proof against disruption to infrastructure supply and network systems resulted in a series of actions to improve the operation, maintenance and replacement of urban utility services. The city government learned first-hand that infrastructure failure can be significant and costly. As a risk management strategy, the utility service agencies have undertaken comprehensive asset management planning to reduce the possibility of future failure and ensure that services are re-established as soon as possible if failure does occur. The Auckland Engineering Lifelines Group (AELG) of utility companies was established to investigate and manage the risk of infrastructure failure.106
2.4
ENVIRONMENTAL SYSTEMS AND SUSTAINABILITY
Auckland is a city vulnerable to natural disaster and the effects of climate change.107 Land that was once covered with dense native forest, was cleared for urban development resulting in significant runoff, flooding and soil loss, and increasing concerns about air and water pollution. Auckland is adjacent to numerous volcanic cones. By international standards, the city’s environment is relatively clean, but there is recognition that much more needs to be done to restore and manage marine and land habitats, and to address the range of environmental risks facing the city. 2.4.1 Environmental Management and Sustainability: Policies and Measures The Auckland Plan places significant emphasis on environmental management and sustainability. Table 2.6 outlines the city’s strategic direction for environmental management leading up to 2040. The Auckland Plan has six underpinning environmental principles:108 1. The environment supports us – the natural resources provided by our environment have limits, and must be protected and restored to ensure our future wellbeing. 2. We need to consider environmental values in all that we do – the interaction between the environment and people is understood and considered in our everyday behaviour and choices. 53
3. Everything is connected – human activities affect the air, sea, land and freshwater systems. Understanding the connections between environments in the way we manage them is critical. 4. Biodiversity is everywhere – our flora and fauna and their habitats occur in both public and private spaces, and in urban, rural, freshwater and coastal areas. To maintain biodiversity values, we must all work together. 5. Natural hazards can affect our wellbeing – we need to ensure that Auckland and its people are resilient to the effects of natural hazards. 6. We are environmental stewards – future generations will depend on how well we manage the natural environment.109
Table 2.6 Targets for Emissions Reduction, Auckland City TARGETS Reduce gross per capita water consumption from 2004 levels by 15% by 2025
Ensure no loss in the area of significant landscape, natural character and natural features
Reduce the overall yield of suspended sediment to priority marine receiving environments from 2012 levels by 15% by 2040
Achieve approval from UNESCO for World Heritage status for the Auckland volcanic field by 2020
Achieve zero waste to landfill by 2040
Reduce air pollutant emissions (PM10) by 50% by 2016 (based on 2006 levels) in order to meet domestic and international ambient air quality standards and guidelines, and achieve a further 20% reduction by 2040
Ensure no regional extinctions of indigenous species, and a reduction in the number of ‘threatened’ or ‘at risk’ species from 2010 levels by 50% by 2040
Increase the proportion of residents who understand their risk from natural hazards and are undertaking measures to mitigate or reduce their risk from 2011 levels (baseline to be determined) to 80% by 2040
Establish by 2018, through the relevant statutory process, future marine-protected areas, including marine reserves, identified by the Hauraki Gulf, Kaipara Harbour, Manukau Harbour and West Coast marine spatial plans
Reduce the vulnerability of identified ecosystems by ensuring a 95% probability of each ecosystem type being in a viable state by 2040
Source: The Auckland Plan 2012.
2.5
SOCIAL INTEGRATION AND MULTICULTURALISM
Auckland has the fastest growing regional population in New Zealand, with a population of 1.57 million (2014) accounting for 34 percent of the nation’s population. That population is projected to increase to 2.3 million by 2033 and account for three-fifths of New Zealand’s population growth during this period. By 2028, Auckland is expected to be home to 37 percent of the nation’s population, increasing to 40 percent by 2043.110 These increases will have a significant impact on sustainability, and the city will have to pay close attention to social integration and the balance between immigration and natural population growth, and indigenous and international culture, as well as the provision of 54
affordable housing, employment, essential public and social services, education and governance. 2.5.1 A City of Immigrants Auckland is the most ethnically diverse and multicultural region of New Zealand. The city’s cultural diversity is due to high immigration rates over the past three decades. Successive New Zealand censuses indicate Auckland’s population comprises more than 180 different ethnic groups. Over 40 percent of residents are born outside of New Zealand. Table 2.7 shows the breakdown of Auckland’s ethnic groups according to the 2001, 2006 and 2013 censuses.111 One of the most significant changes to the city’s population has been the substantial rise in Asian immigration, driven by lifestyle, access to education and policies designed to encourage skilled migrants. In 2013 almost one quarter of Auckland’s population was of Asian origin or descent; by 2021 their numbers are projected to be 75 times greater than in 1990.112 The high levels of immigration are having a significant effect on the physical and cultural development of the city, including its cultural capital, skills mix, innovation, diversity and creativity. It has enabled Auckland to improve its position in the innovative cities index, although it lags behind Singapore and some Japanese and Australian cities.
Table 2.7 Population and Ethnic Structure of Auckland, 2001–2013 Ethnic Group
2001
European
755,967
68.5%
700,158
56.5%
789,306
59.3%
Māori
127,704
11.6%
137,304
11.1%
142,770
10.7%
Pacific Island
154,683
14.0%
177,951
14.4%
194,958
14.6%
Asian
151,644
13.8%
234,279
18.9%
307,233
23.1%
13,335
1.2%
18,558
1.5%
24,945
1.9%
99,474
8.0%
14,904
1.1% 0.1%
Middle Easterners / Latin Americans / Africans
Percentage
2006
Percentage
2013
‘New Zealanders’
n/a
Others
276
0.0%
648
0.1%
735
1,102,818
100.0%
1,239,054
100.0%
1,331,427
Total population
Percentage
Source: Statistics New Zealand 2014.
The city is expecting substantial population increase from immigration and natural population growth (which will contribute about one-third and two-thirds, respectively). The substantial increase in population will have a major impact on the city’s infrastructure, which is already experiencing significant capacity constraints. 55
2.5.2 Population and Urban Density The expected increase in population has raised considerable debate about the sustainability of continued urban sprawl. The density of Auckland’s population currently is low (less than 1,300 persons per square kilometre), and this is having a direct impact on the cost of providing and managing urban services as the city expands. The Auckland Regional Growth Strategy 2050 focuses on the need for greater intensification of urban development and density and places limits on further subdivision of peri-urban areas as key sustainability measures. The policy to limit urban sprawl is contentious. Low-density suburban living is a feature of the lifestyle of many New Zealanders. There is a realization by government that the business-as-usual model of urban development is no longer sustainable, and that Auckland’s future lies in a more compact city, with a mix of opportunities to encourage ethnically and culturally diverse activities. Land prices, however, are a significant factor in the ability to foster a greater concentration of urban population and density, and to make housing more accessible and affordable. 2.5.3 Protection of Indigenous Rights New Zealand is one of the few economies in the world where the rights of indigenous people are protected in legislation and a Treaty. In New Zealand, the Maori people are recognized in the Te Tiriti o Waitangi, or Treaty of Waitangi, which was signed in 1840. The treaty was the foundation document that set out the relationship between indigenous New Zealanders and the British government. The agreement ceded responsibility to govern to the British government in exchange for the protection of the local population and selective rights. The treaty had a significant impact: New Zealand’s development was guided by a colonial government, and thus was shaped by western principles and practices.113 The treaty, however, did not prevent a prolonged period of civil war that ended in 1872 between Maori tribes and government over land disputes. The loss of land and identity and the lack of respect for Maori culture led to a review of the Treaty of Waitangi in the 1970s, which resulted in the establishment of the Waitangi Tribunal, a government body created to moderate and investigate breaches by the government and to ensure that all laws and governments pay respect to and recognize traditional customs and traditions.114 Subsequent compensation claims and settlements have resulted in the emergence of a range of customary investment and development enterprises, many of which are located in Auckland. Some of these enterprises have been able to compete favourably in both domestic and international markets. 2.5.4 Multicultural Development Immigration and multiculturalism place significant pressures on New Zealand and its cultural identity. Maoris have been custodians of the land for over 700 years, and British immigrants have been the largest population group over the past 150 years. However, as other ethnic groups continue to migrate at an increasing rate, issues have arisen over how the economy’s cultural identity will evolve and the best means of managing it.115 New Zealand has taken significant measures to ensure that the culture and heritage of the Maori people, the traditional custodians of the land, are both respected and accounted for 56
in all planning initiatives. The government of Auckland has taken steps to ensure multiculturalism and social integration occur both efficiently and effectively. The issues of cultural harmony and integration remain challenging; but the approach to the recognition and identity of cultures embedded in both overall development and economic development could be adopted in other parts of the region with significant indigenous and migrant cultures. New migrants bring new ideas, values and multicultural activities. The city’s identity, through architecture, food, music, language and fashion design, is being shaped by multiculturalism.116
2.6
URBAN GOVERNANCE
New Zealand is a unitary state; it has a two-tier government system, with local government divided into regional and territorial authorities. Regional authorities are responsible for coordinating planning between local government authorities. The member economy has a long and impressive record of governance reform, with local governments given significant financial autonomy, including for sub-sovereign lending. This is underpinned by a well-managed system of accrual and asset-based management accounting across different levels of government. Auckland and several other cities have credit ratings. 2.6.1 Local Government Structure and Reform Until 2010, Auckland was governed by seven local city governments: Auckland, Manukau, Waitakere, North Shore, Papakura, Rodney and Franklin. In 2007, a Royal Commission was established in response to concerns about the lack of coordination between local governments, which was causing significant urban development and management problems, and adding significantly to externality costs for business and undermining the competitiveness of the city. In 2010, on the recommendation of the Royal Commission,117 the New Zealand government combined the seven local governments to establish one metropolitan area under an Auckland Council with a single mayor and several local boards. The Royal Commission sought to design the most appropriate governance system for Auckland, and produced a management structure capable of meeting the needs of the metropolitan region for the next 50 years. The Royal Commission was guided by four principles.118 These focused on the need for:
Collective identity and purpose: Auckland’s governance arrangements should encompass the interests of the entire Auckland city-region and foster a shared regional identity and purpose, which supports integrated planning and decision-making. Effectiveness: The governance structure should deliver maximum value within available resources, in terms of cost, quality of service delivery, local democracy, and community engagement 57
Transparency and accountability: Roles must be clear, including where decision-making should be regional and where local. Responsiveness: The structure should respect and accommodate diversity and be responsive to the needs and preferences of different groups and local communities.
The amalgamation of Auckland’s seven local governments into a single metropolitan council was one of the most significant public sector reforms in New Zealand’s history. The new Council is an organization with NZD 32 billion of assets, an annual budget of NZD 3 billion; and 8,000 staff brought together from the seven former councils and council-controlled organizations. The amalgamation was unprecedented in New Zealand’s public sector history and similar in impact and scale to the amalgamation of the city of Brisbane in Australia in 1924.119 The Council is among the largest and most complex entities in New Zealand, second in size only to the New Zealand government. It has complex and finely balanced governance arrangements, many of which seek to introduce collaborative governance arrangements to improve the efficiency of services delivery and reduce transaction costs both within the Council and for business. The Council’s strategy and further planning is expected to have a significant impact on economic and social prosperity in New Zealand, given that one-third of New Zealand’s population live in Auckland. Ironically, the amalgamation of local governments in Auckland led to the development of a single metropolitan authority responsible for the conduct of many of the activities of the former Auckland Regional Development Authority (ARA) in 1963. The ARA was the vision of a former Mayor, Dover Myer Robinson. In 1989, the ARA was replaced by an Auckland regional council that had an umbrella function covering all the cities and districts of the region. Stripped of many of the regulatory powers and funding abilities of the ARA, local governments sought to look after themselves, rather than work collaboratively on regional issues. Subsequently, Auckland underinvested massively on logistics and essential infrastructure, and other local services. Auckland Council was providing many regional services for the region’s population and business but was not recompensed for these. 2.6.2 The Auckland Plan Significant sustainability initiatives have flowed from the governance reform in Auckland. The most significant has been the Auckland Plan120. The Auckland Plan was developed under New Zealand’s key environmental planning legislation, the 1991 Resource Management Act, which is recognized as a world leader in integrated approaches to planning and sustainable development. The Plan has a clear vison and strategy to make Auckland an even better place than it is now, and to create the world’s most liveable city. It outlines how the city will prepare for a growth of one million people by 2040, and accommodate the additional 400,000 new homes and jobs needed to support the city’s growing population. It includes details on institutional and urban management arrangements, corporate planning, and financing for city development. The Auckland Plan is the city’s most significant urban development and management tool. It places clear emphasis on preparing the policies and measures to make Auckland 58
the most liveable city. The Plan focuses on making Auckland a city that people want to visit, move to or invest in. It outlines 13 key framework items, including: people, Maori, arts & culture, historic heritage, recreation & sport, economy, environment, response to climate change, rural Auckland, urban Auckland, housing, physical and social infrastructure and transport. It also outlines measures to assess its progress over a 30-year period. The Auckland Plan provides one of the best examples of an integrated approach to metropolitan planning and sustainability to be found anywhere in the world. A key factor in this has been the NZ Resource Management Act. The Auckland Council recognizes the importance of planning the future and has incorporated targets, and methods for reaching targets in every element of the Plan. The Plan acknowledges the need for flexibility and ability to change in response to events, risks, resources and circumstances that are outside the ability of the Council to control. Developers also acknowledge the importance of integrated and holistic planning.121 An example of this is the integration of transport planning and land-use development. This is a priority of the transport planning addendum which integrates physical and social infrastructure planning. Collaborative planning underpins the decision-making process of the Plan and is seen as the most effective means for achieving sustainable development as it eliminates unforeseen long-term problems such as accessibility, social and community development, and spatial elements. Apart from the strong emphasis given to sustainable and holistic planning, the Auckland Plan also places strong focus on climate change and environmental factors. The Plan caters to these futuristic planning matters and provides a long-term, sustainable guideline in preparation for potential environmental or climate change risks. Future issues recognized by the Plan include the need for innovation, smart urban design, new industry development and employment, transport and participatory governance. 2.6.2.1 Monitoring and Evaluation of the Auckland Plan To back up the long-term environmental goals and underlying principles, the Auckland Council heightened the importance of policy measurement. illustrates the monitoring and evaluation framework used to gain feedback from policy implementation to strengthen further the city’s governance.
59
Figure 2.5 Monitoring and Evaluation Framework of the Auckland Plan
Source: Auckland Plan 2011.
Measuring the progress of environmental actions within the Auckland Plan is done by measuring achievability, by audits and reporting. The assessment is conducted on an annual basis and reviews the Plan’s effectiveness on both short and long-term bases. In additional to citywide assessment, the Auckland Council also measures varying factors of the city’s efficiency on a global scale, including areas such as liveability, cost of living, income and expenditure, housing affordability, city governance index, employment, innovation and global competitiveness. Measures have been taken to ensure that all 13 framework items covered in the Auckland Plan are assessed effectively to ensure Auckland has the best opportunity to prosper. 2.6.3 Financial Management A significant outcome of local government reforms in New Zealand was the introduction of transparent financial and asset management, together with accrual accounting, and planning linked to financial planning and budgeting. Many cities in New Zealand, including Auckland, have credit ratings which enable them to leverage public assets through the issue of bonds, loans and other financial instruments to fund physical and social infrastructure. The Auckland Council’s credit ratings following the amalgamations and annual reviews are good, leaving it as the biggest local body in Australasia and one of the highest-rated entities in New Zealand. Local authorities in New Zealand are among the best managed in the world. The Auckland Council has well-established procedures for conducting audits and valuing public assets. Local governments are required to prepare cash flow and balance sheets listing and valuing public infrastructure and assets, including depreciation.122 In 2011, after its amalgamation, Auckland had over NZD 34.3 billion (USD 21 billion) of assets, including road and utility services networks, buildings and public facilities.123 It is one of a few cities in the world to have a complete inventory and valuation of publicly owned 60
assets, depreciation schedules for valuing assets, and a forward 10-year balance sheet showing debt to equity (Figure 2.6). Debt to equity varies between 24 percent and 27 percent. Figure 2.6 Ten-year Forecast for Assets and Liabilities, Auckland City $80,000,000 $70,000,000 $60,000,000 $50,000,000 $40,000,000 $30,000,000 $20,000,000 $10,000,000 $0 2013
2014
2015
2016
2017
Total assets
2018
2019
2020
2021
2022
Total liabilities
Source: Auckland City Council’s 2012–2022 Long-Term Plan.
2.7
PARTNERSHIPS FOR SUSTAINABLE DEVELOPMENT
Auckland has many different types of partnerships that support the development and management of the city. Some of the best-known partnerships that demonstrate strong commitment to sustainability are included in Table 2.8. These can be found on internet sites. Many of these involve the creation of formal structures, especially when they involve public–private sector partnerships between government and business. Others are less formal and involve networks and associations of professional, community and cultural interest groups.
61
Sister Cities
Core Cities
Global business
Global Business Network
National business
Regional Business Partner for Auckland
Auckland Regional Settlements
CityNext
Youth Development Partnership
Auckland Environmental Business Network
Technology
Social and environmental
Labour and skills
Research and innovation
Tamaki Redevelopmen t Company
Auckland Local Partnerships and Governance Group
Local business
Innovation Partnerships
SkyPath
Public utilities Public institutions Community
Infrastructure and development
Governance
Regional Business Partnerships
Governmen t
City
Economic
City
Table 2.8 Examples of Partnerships for Sustainable Development, Auckland City
Urban Research Network AU Community Economic Development
Community Programme; Partnership Programme
Community Renewal – Housing New Zealand Corporation, Talbot Park, Auckland
Auckland Environment Observatory Social Enterprise Auckland
The Onehunga Peoples Garden
Source: Authors.
2.7.1 Regional and International Partnerships Auckland maintains formal partnerships with a number of cities globally, with significant interactions with the 19 cities indicated in Figure 2.7. Each of these cities holds wellestablished business practices in areas ranging from education to tourism, cultural exchanges and trade agreements. The Auckland Plan places significant emphasis on improving international relationships with additional cities into the future.124
62
Figure 2.7 Auckland’s Formal Partnerships
Source: Auckland Council, Global Partnerships and Strategy Auckland (Auckland Council, 2015).
2.7.2 Core Cities Network The New Zealand Core Cities Network was initiated in April 2011 by Local Government New Zealand and the Ministry of Business Innovation and Employment. It is the first of its kind in New Zealand and involves its six largest cities; and is not unlike the British Core Cities initiative.125 Auckland has a key role in the Core Cities Network, which represents over half of the New Zealand economy. The initiative aims to develop a shared understanding of the economic contribution and core strengths of New Zealand’s largest cities. The Network provides a common baseline for councils and the New Zealand Government to remove barriers and enable businesses to grow, export and create high-value jobs. It is significant in offering opportunities for vertical and horizontal collaboration between city governments to overcome barriers of entry into markets and to enable economies of scale, by stretching and leveraging resources. Four shared principles to develop better connections were articulated. These include:
Cities offer opportunities for economic growth, now and in the future. There is a shared understanding that the competition is the rest of the world. City-region specializations are based on different comparative advantages. Councils will work together to improve the economic environment of all New Zealand cities.
The cities agreed on four focus areas for collaboration:126
63
Sharing best practice, for example, policies and processes that build businessfriendly councils. Collaborating on future mayoral-led delegations in China and other export markets. Continuing to invest jointly in the development of data about city-regions and using it to support economic strategy and planning. Using the research on city-regions as a tool to help focus and guide Councils’ investments to support economic growth.
The Core Cities Network has initiated two key projects which are investing in engagement with China and business-friendly guidelines.
2.8
EXAMPLES OF BEST PRACTICE PARTNERSHIPS
The following selected partnerships that support the management and development of Auckland have potential to be adapted and applied in other economies in the APEC region. The case studies seek to draw out principles of sustainable city development from economic, social, environmental, and land development and governance perspectives. 2.8.1 Wynyard Quarter – Waterfront Auckland127
Photo 2.2 Wynyard Quarter Rejuvenation Project, Auckland
Credit: Alistair Ray.
64
Wynyard Quarter is a good showcase of urban renewal, showing how to create sustainable urban waterfront living without disturbing the historical character and integrity of a site. This project maximizes efficient design, provides social amenities and is aesthetically pleasing. The Wynyard Quarter demonstrates an active re-development project that uses smart design elements to reconfigure and bring life back to an underutilized area of the city. This is a very simple best practice activity that can be modified to meet the needs of other cities. In some ways, the Wynyard Quarter project is an ordinary waterfront rejuvenation project – with production spaces being replaced by consumption areas, particularly through the well-resourced and integrated public transport. What makes it stand out as an example of good practice is the interaction between Waterfront Auckland (an Auckland Councilcontrolled organization) and Landcare Research (a Crown Research Institute run as a private-sector research company128) in the establishment of some very exciting and sustainable green spaces and water gardens on the site. This is an ongoing project. 2.8.2 Auckland Council’s North West Transformation Project Hobsonville is an area located approximately 20km northwest of the Auckland CBD. It was settled in the mid-1920s, primarily as an agricultural and horticultural area. Its proximity to the city made the area a prime location for an airport and it was later occupied by the Royal New Zealand Air Force (RNZAF) as the airfield base for Auckland. In 2006, the RNZAF sold the site back to the New Zealand government and plans were made to redevelop 435 hectares into a low density mixed-use town centre. The project is primarily led by the Auckland Council but involves many private stakeholders and investors.129 The transformation of the Hobsonville area will guarantee strong regional economic growth alongside community, recreational and environmental benefits. Stage 1 of Auckland’s North West Transformation Project aims to create:
20,000 new jobs 5,500 new homes, including public housing Schools, community facilities and open spaces A new town centre New roads and better transport links.
The first stage of this NZD 1 billion rejuvenation and transformation of Auckland’s northwest is underway. The plan provides for the allocation of land for marine industries, recreational and commercial uses, and advanced technology business services. A key development objective is to reduce the commuter dependent employment; nevertheless, provision has been made for fast ferry services to link the Hobsonville area to Auckland’s city centre and North Shore. The transformation of Hobsonville and its surrounding suburbs is a successful example of a public–private sector partnership for bold, large-scale rejuvenation of a historic area, geared to activate economic growth as well as provide infrastructure, public and private housing, education, employment, transportation and nature sensitive design into a new area of urban development, and create social and recreational opportunities for outer city suburbs. It is unusual in that it is an urban revitalization project on the periphery of an 65
urban area. This project, like Wynyard Quarter–Waterfront Auckland is an ongoing project. 2.8.3 Tamaki Regeneration Project – Low Income Housing Revitalization The conflict between indigenous people and Western culture is an unfortunate residue of development in New Zealand. It has resulted in tensions over land rights, cultural practices and discrimination. Unfortunately, this led to the New Zealand Maori becoming marginalized, losing their identity and being ghettoized in urban enclaves with poor housing, lack of access to good jobs, and a high incidence of crime, which adversely impacted the city’s reputation. Nowhere was this more prevalent than in the predominantly residential areas of Tamaki, 6km east of the CBD. Tamaki has a resident population of about 18,550. Some 57 percent of the existing 5,000 dwellings are owned by Housing New Zealand and rented to low income groups. The area has a significant Maori population, with parts of the area being ancestral land. Many of the dwellings are old, in poor condition and too small for the residents who now occupy them. The area has many social problems and is in urgent need of revitalization. The Tamaki Regeneration Project – a development partnership between the public sector and the private sector – was launched to address some of the problems. Driven by community desire for development, the project involves stakeholders at all levels but is mainly run by the New Zealand government, Auckland Council, the Tamaki Redevelopment Company (TRC) and Mana Whenua. In 2012, the New Zealand government and Auckland Council provided the TRC with a NZD 160 million (USD 115 million) loan facility as essential working capital for infrastructure and housing projects, many of which will be developed by the private sector. The draft blueprint sets out a vision to construct up to 6,000 additional homes in the area with a good mix of social, affordable and market housing.130 The TRC, which is jointly owned by the New Zealand government and the Auckland Council, is New Zealand’s first urban redevelopment company.131 It was set up to help transform Tamaki (including Glen Innes, Point England and Panmure) over the next 20 to 25 years. The scope is ambitious, encompassing economic, social and housing initiatives to improve education, employment, health, safety and the environment. It is envisaged that these initiatives will involve collaborations between local communities, government, businesses, educational institutions, social agencies, developers and financiers. Initial stages of the project involved the transfer of 2,800 houses from the Housing New Zealand Corporation to the TRC, after the expression of significant community interest. The initial exchange of housing ownership was welcomed, with the TRC committing to develop an additional 7,500 homes as well as to replace 2,500 existing homes within a 15-year timeframe. The project has three underlying outcomes:132
Lifestyle and Culture: Tamaki people are engaged, healthy and safe, and their cultural identity and diversity is celebrated. Talent and Creativity: Tamaki residents have good sustainable employment and education opportunities. 66
Places and Neighbourhoods: Connected, safe, attractive and well-used spaces with quality, healthy homes.
The Tamaki Regeneration Project is ongoing and will provide current and future residents of the area with a better standard of living by co-improving education and employment opportunities, social and recreational amenities, infrastructure and sustainable development as well as maintaining the cultural significance of the area and its ties to indigenous New Zealand. The Project has not been without controversy but it represents a multi-party collaborative approach to tackling a range of significant problems in Tamaki. It stands as an example of good practice because of its integrative ethos, illustrated by the involvement of different levels of government, the private sector and Maori and their willingness to tackle social, economic and environmental issues together.
2.9
CONCLUSIONS
Auckland is a dynamic and resilient city undergoing rapid change. In recent decades, several developments – structural reforms to government, including local government; the opening of the economy to greater competition; the adoption of integrated planning; and increased immigration, especially from Asia – have significantly changed the socioeconomic structure and governance of the city, mostly for the better. The city, however, still faces many challenges in addressing and managing urban development, transport, social and environmental problems. There is widespread recognition and understanding of these challenges and the need for collective action by government, business and communities to address them. Partnerships and other collaborative initiatives and efforts are part of a new model of sustainable development that the city has been very willing to embrace. Sustainability is a strong underlining principle of the city’s development. It permeates the policy and decision-making processes of government, business and communities. In the area of local economic development, the city has developed a wide range of partnerships between government, business, institutions and communities. As the New Zealand economy strengthens, unemployment rates have fallen, and investment capital has continued to flow into the city’s economy. A concern is that development will be driven by real estate and not long-term jobs in advanced manufacturing and services to boost the region’s GDP and exports. Urbanization is a major challenge to the sustainable development of the city. Detached dwelling construction dominates housing supply, but this is changing as more land is released for an increasing number of higher density housing types. The propensity of the CBD to be the dominant and highest income generating employment centre has a compounding impact on traffic congestion and services capacity. The need for the city to focus on greater decentralization of employment, investment and services through planning support for polycentric city development is essential, if the city is to develop more sustainable land-use, employment, transport and urban services delivery systems. 67
Social and environmental problems, although not severe compared to other cities in the region, are nevertheless a concern for the future sustainable development of the city. The dynamic relationships between cultures, and the misunderstanding and tensions, especially over issues of land rights, housing, customs and practices will require greater tolerance, education, understanding and mutual acceptance of ideas and solutions to resolve them. Similarly, more customary and collaborative approaches involving government, business and communities in partnerships for social development is needed to restore harmony, cooperation and the development of social capital to manage the region’s fragile natural environment. Auckland has shown leadership in local government and governance reform. The amalgamation of seven local governments into one Auckland Council was both bold and controversial. It was born out a frustration at the inability of the local bodies to act uniformly in the interests of the region, to improve the coordination of planning and infrastructure and to make the city’s economy more competitive. The amalgamation cost jobs, but it has led to savings and better spatial coordination of the projects and operational activities between agencies and departments. Identifying and valuing the city’s assets, the Standard and Poor’s (S&P) credit rating, and responsible financial management have been significant factors in raising recognition of Auckland as a wellrun and managed city. The progressive reforms to local government in New Zealand over two decades, and especially since the amalgamation, have enabled Auckland to make significant advances in the areas of planning, urban financial management, infrastructure development, operations and maintenance, and local economic and social development. The Auckland Plan is probably one of the most far-sighted, comprehensive, integrated and realistic plans developed for a metropolitan area in the region. It is a model that provides a pathway for collaborative approaches to sustainable metropolitan development planning and management. Partnerships for development and services delivery have been an important platform underpinning the sustainable development of the city. The partnerships range from the revitalization of inner and outer urban areas, social housing delivery and improvements through a partnership involving government, business and Maori groups, and innovative approaches to the management of coastal environments and wetlands. These would not have been possible under former sectoral and poorly coordinated local economic development and urban planning policies. Auckland provides many good examples of sustainable development practices that could be adapted and applied to other cities in the region. Its unique contributions to sustainable development are in metropolitan planning and governance. The amalgamation of local governments is seldom popular, but in Auckland’s case it was necessary to address some of the serious transport, planning and social development problems facing the city’s development. Auckland’s emblem as the ‘City of Sails’ is fitting in that it provides a strong visual image of a city whose citizens know how to enjoy themselves, but know also that they are in a race for the future. It is important for the city to monitor its progress and, where necessary, alter course when the winds of financial, social, political and technological change occur. 68
3. Bandung, Indonesia Wicaksono Sarosa, Wahyu Mulyana and Brian H. Roberts
3.1
INTRODUCTION
Bandung is the third largest city in Indonesia, and the capital of West Java Province. Located 150km southeast of Jakarta, the capital of Indonesia, it is a major centre for tourism, education and industry, and has played a significant role in the political, economic and cultural development of Indonesia. It has a population of 2.5 million, and forms part of the Bandung Metropolitan Area, which has a population of 8.2 million. The Bandung Metropolitan Area is administered by five local governments.
Photo 3.1 Pasupati Bridge, Bandung City
Credit: Hery Antasary, Bandung Planning Board.
Bandung was founded in 1488. The city was favoured by the Dutch as a settlement area because of its elevation, soils and climate, which is cooler than most Indonesian cities. The central area of the old city was planned by the Dutch in the nineteenth century for a population of 300,000 inhabitants. The city has far outgrown its original area and spilled over into surrounding districts. Over the past three decades, Bandung has experienced high rates of urbanization. This has placed enormous pressure on the capacity of the city and metropolitan region governments to meet the demand for basic infrastructure, housing, and urban services. 69
Traffic congestion, waste management and poor planning have compounded the management and development problems facing the city. In February 2005, the city’s Leuwigajah landfill was affected by a large landslide after heavy rain, killing 143 people.133 The effects of poor city planning, management, and sprawling development led to the realization that the city’s development practices were not sustainable.134,135 The community and academics called for improvements in the way the city was planned, managed and developed to make it more liveable, safe and sustainable.136,137 Partnerships have played a significant role in this change. This chapter discusses key economic, governance, social, natural, physical and environmental issues facing the development and management of the city of Bandung. It presents examples of best-practice sustainable urban development initiatives. 3.1.1 Population, Planning and City Development Indonesia has experienced a period of rapid urbanization since the 1980s. Currently, 53.7 percent of the population live in urban areas.138 It is predicted to be 66.6 percent urbanized by 2035.139 Between 1990 and 2015, Indonesia’s urban population grew from 55 million to 137 million. Urbanization growth reached over 3.3 percent per annum in the 1980s, but has subsequently fallen to 1.5 percent per annum and is continuing to fall. Rapid urbanization in Bandung has placed significant urban management pressures on planners, architects and local government officials. Bandung Metropolitan Area, also known as Greater Bandung,140 has seen rapid population growth over the past two decades. This has resulted in significant urban sprawl, with large agglomerations in suburban areas having higher populations than the civic centre. In managing the housing, commercial and industrial demand, the city has seen a significant reduction of green space and agricultural land. Table 3.1 shows the population, area and density of population for the Bandung Metropolitan Area. Between 1991 and 2012, its population increased from 5,079,348 to 8,199,892 at an average growth of 2.6 percent per annum. The built-up area also increased significantly during that period. According to one study in 2014, the physical growth rate of the urban area averaged 4.9 percent per annum.141 Urban densities continue to fall as the city sprawls in a northerly and southerly direction.142
70
Table 3.1 Area, Population and Urban Density for the Bandung Metropolitan Area Administrative Division
Area (km²) 2005
Population 2010 Census
Population 2014 BPS Official Estimate 2,575,478
Population density (/km²) 2010 14,125
167.27
2,394,873
39.27
541,177
581,989
13,134
Bandung Regency
1,767.96
3,178,543
3,418,246
1,801
West Bandung Regency
1,305.77
1,510,284
1,624,179
1,159
112.00
264,342
n.a.
2,359
3,392.27
7,889,219
8,199,892
2,325.65
Bandung City Cimahi City
Three Kecamatan in Sumedang Regency Metropolitan Area
Source: Based on data from Central Board of Statistics (BPS) Indonesia.
Figure 3.1 Growth of the Bandung Urban Area, 1991–2012
Source: V.S. Ardiwijaya et al., ‘Bandung urban sprawl and idle land: Spatial environmental perspectives’, APCBEE Procedia 10 (2014): 208–13, doi: 10.1016/j.apcbee.2014.10.040
During the Dutch colonial era, Bandung was a European-style city known as the ‘Paris van Java’; its urban atmosphere with its artisan shopfronts, cafes and parks attracted comparisons to Paris. Bandung gained international recognition in 1955 when it hosted 71
the Asia–Africa Conference attended by leaders of 29 emerging and ‘non-aligned’ economies. Since 1955, however, the planning and development of Bandung have been poorly managed. As a result, Bandung faces significant urban management and development challenges with serious water shortages, air pollution, inadequate waste management, severe traffic congestion, frequent flooding, urban sprawl and slum development, limited urban green spaces and a lack of business compliance with environmental regulations. In 2013, when the city of Bandung had a change of government, a range of measures were taken to revitalize and improve the management of the city, spanning urban planning, infrastructure and governance. However, in the metropolitan area significant integrated planning, development and governance issues are still to be addressed.143
3.2
ECONOMIC DYNAMICS
3.2.1 Key Economic Facts Bandung is one of the most important economic hubs in West Java Province, contributing 3.3 percent of Indonesia’s GDP in 2010. Table 3.2 shows key economic growth indicators. Between 2008 and 2012, the economy of Bandung city increased by an average of 8.53 percent, which was significantly higher than growth for Indonesia (5.8%) and growth in West Java (5.86%). The city’s economic activities contributed toward 23 percent of West Java province’s economy during this period. GDP per capita for the Bandung Metropolitan Area in 2012 was approximately USD 1,400 compared to the average for Indonesia of USD 3,223.
Table 3.2 Key Economic Facts – Bandung Bandung IDR 37.5 trillion Economic value (in constant (USD 3.89 billion) value, 2012) 2,455,517 Estimated residential population (2012) 1,064,167 Employment (2012) USD 1,585 GDP per capita (2012) 9.17% Unemployment rate (2012) 71,204 No. of businesses (non-formal, 2012) Trade USD 669.2 million Key export sectors (2012) Source: Based on data from Central Board of Statistics (BPS) Indonesia.
72
Bandung Metropolitan Area IDR 107.7 trillion (USD 11.17 billion) 8,002,462 n.a. USD 1,400 n.a. n.a. n.a.
3.2.2 Key Industry Growth Sectors The Bandung economy has been gradually transitioning from manufacturing and agriculture to a tertiary service sector economy (Figure 3.2).
Figure 3.2 Economic Structure of Bandung City, 2008–2012, based on current prices 3.20%
6.30% 6.30%
12% 24.20% 40.80% 2.30% 4.90% Finance, Rental Company Services
Agriculture
Manufacturing industry
Electricity, Gas and Water Supply
Building/Construction
Trade, Hotel and Restaurants
Transportation and communication
Other
Source: Based on data from Central Board of Statistics (BPS) Indonesia.
Hospitality and trade are the key economic sectors, contributing to approximately 41 percent of Bandung’s economy between 2008 and 2012. Manufacturing was previously the biggest contributor to Bandung’s economy; it now holds second place at 24.1 percent of GDP. Transportation and communication are the third and fourth largest sectors of the city’s economy. 3.2.3 Trade Industrial products and creative industries dominate export commodities. Most manufacturing occurs in five industrial and trade clusters. The main focus of production in the five industry clusters are Cihampelas (jeans), Suci (T-shirts), Cibaduyut (shoes), Binongjati (knitwear) and Cigondewah (textiles).
73
Figure 3.3 Export Commodities of Bandung City in 2012, percent Other products Tea Textile Drug Carpet Ceramic Wood Rubber product Gondorukem/terpentine Furniture Laboratory Music Household appliance Electronic devices 0.00
10.00
20.00
30.00
40.00
50.00
Source: Based on data from Trade, Industry, SME’s and Cooperative Agency, 2013.
The net value of exports has increased in relative terms from USD 512.2 million in 2009 to USD 603.2 million in 2014. Figure 3.3 shows the main export sectors for Bandung city. Textile products dominate 60–65 percent of total city-export products. Other export areas include electronic devices, home appliances, musical instruments, laboratory tools, furniture, turpentine, rubber products, manufactured woods, ceramics, carpet, medicines, and tea. These products are exported to Europe, the United States of America, Japan, Australia and New Zealand. The value of exports to those economies was 37.4 percent of the total export value of Bandung city. The contribution of the manufacturing sector to the development of the economy of the Bandung Metropolitan Area, particularly exports, has declined due to increased regional competition. Local manufacturers and the Indonesian government have been slow to respond to economic and industry reforms to make export manufacturing more competitive. The ASEAN–China free trade agreement (ACFTA)144 which came into effect in January 2016 will increase competition in the city’s manufacturing industry sector. The private and business sectors are not really aware of the implications of ACFTA on the ASEAN Economic Community and the impact it may have on the free flows of goods, services and employment in ASEAN economies. 3.2.4 Economic Competitiveness In a 2013 report, the Economist Intelligence Unit ranked Bandung 110 out of 120 global cities in overall competitiveness.145 Table 3.3 shows the competitiveness ranking for Singapore (ranked 3rd most competitive city in the region) and the three largest Indonesian cities. Bandung ranked the lowest of the Indonesian cities surveyed with a score of 49.1/100. The city’s highest overall competitiveness ranking was for physical capital (77.3%). Bandung’s low international competitiveness ranking is explained by a range of factors. Transport transaction costs are high because it is an inland city; most materials must be 74
imported and freighted by road from Jakarta International Port. The impact of environmental factors on water quality, questions of public health and institutional effectiveness, poor planning and development, and issues of urban governance are influencing the productivity of business.146
Physical
Financial maturity
Institutional effectiveness
Social and cultural character
Human capital
Environmental and natural hazards
Global
70.0
46.0
100.0
100.0
87.8
77.5
69.8
87.5
43.2
Jakarta
63.1
31.3
98.2
83.3
94.8
95
68.7
75.0
25.5
Surabaya
62.7
31.3
100
83.3
94.7
87.5
68.9
83.3
18.9
Bandung
49.1
35.9
77.3
50.0
63.3
63.8
63.7
66.7
9.0
appeal
Economic strength
Singapore
capital
Overall
Table 3.3 Economic Competitiveness of Singapore, Jakarta, Surabaya and Bandung, 2013
Source: Based on data from Economist Intelligence Unit, Hot Spots 2025: Benchmarking the Future Competitiveness of Cities (London: Economist Intelligence Unit: 2013).
3.2.5 Industry Clusters Table 3.4 presents a Location Quotient (LQ) analysis to identify the comparative advantage of Bandung city compared to West Java Province for the period 2008–2011. The LQ provides a good indication of the levels of industry concentration and is a good measure of the presence of industry clusters.
75
Table 3.4 Location Quotient (LQ) of Economic Sectors in Bandung City, 2008– 2011 Sector
2008
2009
2010
2011
Average
Agriculture
0.02
0.02
0.02
0.02
0.02
Manufacturing industry
0.57
0.60
0.64
0.63
0.61
Electricity, gas and water supply
0.80
0.81
0.84
0.90
0.84
Building/construction
1.33
1.31
1.24
1.16
1.26
Trade, hotel and restaurant
2.10
1.90
1.81
1.83
1.91
Transportation and communication
1.94
1.94
1.69
1.61
1.80
Finance, rental and company services
2.24
2.30
2.27
2.24
2.26
Services
1.25
1.14
1.09
1.02
1.13
Source: Based on data from Central Statistical Board (BPS) West Java Province, 2008–2011, calculated by comparing GRDP Bandung and GRDP West Java Province.
There are five significant industry sector concentrations in Bandung. These are building and construction; trade and hospitality; transportation and communication; finance, rental and company services; and trade services. The sector with the highest score was the finance, rental and company services sector, with an average LQ of 2.26. The general services sector had the lowest average LQ of 1.13. Four sectors have LQ scores below 1; these are non-basic sectors that serve only local needs. This LQ analysis highlights the need for the city to focus on synchronizing basic services with non-basic sector services.
76
Figure 3.4 Industries and Universities in Bandung
Source: R. Kamil, Bandung Economic Review: World Cities Summit Mayors Forum 2014. Singapore: World Cities Summit Mayors, 2014).
In terms of economic and business clusters, Bandung is home to the headquarters of many on Indonesia’s major corporations, including Indonesia’s largest telecommunication company (TELKOM), the National Post Office, the National Energy Institute (LEN), the military strategic industry (PINDAD), the telecommunication industry (PT INTI), the domestic aircraft industry (PT DI) and the pharmaceutical industry (Bio Farma). These companies and others contribute to the creation of more than 876,000 jobs. Various universities and/or higher education institutions are also located in Bandung, contributing to the growth of creative industries within the city. There are more than 78 higher education institutions with approximately 227,000 students. Universities located in the area include Bandung Institute of Technology (ITB), Padjajaran University and Parahyangan University. The presence of universities and higher education is highly beneficial to the increasing art and designer community in Bandung. 3.2.6 Local Economic Development Bandung has performed less well in local economic growth and development in recent years. A report by AusAID, the Swiss Development Corporation and the World Bank noted that: some of Indonesia‘s major second tier cities, including Bandung, Yogyakarta, Cirebon and Semarang, have not experienced increases in real per capita Gross Regional Domestic Product (GRDP) over the last 15 years. In the period from 1993 to 2007, productivity in the cities declined by an average of 10 percent, which is equal to 0.7 percent Compound Annual Growth Rate (CAGR).147 77
The economy of the city of Bandung and the rest of the Bandung Metropolitan Area showed some resilience through the 2007 global financial crisis but it has not been performing as well as it could. Bandung’s local economic development and growth have continued, influenced by the contribution of export-oriented local commodities and the tourism industry. During the global financial crisis, Bandung became an attractive regional travel tourist destination for visitors from other cities, especially from Jakarta, during weekends. Shopping outlets, restaurants and the hospitality industry were the main drivers attracting tourists and visitors to the city. To increase private and public investment, the Bandung city authority improved the enabling environment for civic investment. In 2008, the city government established a One Stop Service Unit – the Integrated Permit Services Board (BPPT). The city also introduced an online permit system, which applicants can access remotely.148 These efforts have improved the service quality and reduced the time taken to obtain permit approvals. In a local economic governance study of 243 cities/districts in Indonesia,149 Bandung ranked 143rd with an index value of 60.7. Blitar City (in East Java province) had the highest ranking with an index value of 76.0. Bandung had a high score for the indicators of local regulation quality and local infrastructure policy. Lower scores were in the following indicators: access to land; interaction between local government and the business sector; and security and conflict resolution. The study indicates there is a need for significant improvement in the development of the local economy. 3.2.6 Innovation, Creativity and Business Entrepreneurship Bandung has traditionally had a strong focus on the creative industries, which developed from its garment manufacturing, arts and design industries, and a vibrant, educated population. The textile and garment industry and various other creative activities have contributed significantly to local economic development. Factory outlets in Bandung are popular with tourists from neighbouring economies and cities. Bandung has also acquired a reputation as an emerging creative city,150,151 building on its communities’ traditions of innovation, progressive arts and music as well as cultural performances. In 2007, Bandung was internationally recognized as a creative city. The city of Bandung is seen as a leader in creative industry development within Indonesia.152 In 2007, the city was selected for a pilot project of creative cities in the East Asia region. The fast growth of the city’s creative industry was a spinoff from its cultural environment, location and local economic factors.
78
Despite a gradual decrease in the manufacturing industry, the creative industries continue to experience growth and contribute significantly to the city’s economy. The creative industries include 15 sub-sectors, including: fashion design, handcrafted goods, architecture, publishing, printing, film and research, and development. These creative sectors contributed to around 14.4 percent (USD 400 million) in 2007 and are projected to grow further. The creative economy is not explicitly classified as its products include inputs from other sectors.
Table 3.5 Contribution of Small- and Medium-sized Enterprises (SMEs), Bandung Value in trillion IDR SMEs
20.0
Micro
6.3
Small
4.3
Middle
9.4
% 59.6
Large
13.9
40.4
GRDP
33.9
100.00
GRDP = gross regional domestic product; SME = small- and medium-sized enterprises. Source: R. Kamil, ‘Bandung economic review’ (presented at the World Cities Summit, Singapore, 2014), http://www.worldcitiessummit.com.sg/sites/sites2.globalsignin.com.2.wcs2014/files/Bandung_Economic_Review.pdf
Small- and medium-sized enterprises (SMEs) contribute almost 60 percent to the trade sector of the city’s GRDP, while large enterprises contribute 40 percent to the city’s trade sector (Table 3.5). SMEs – defined by the Central Board of Statistics (BPS) as micro-, small- and medium-sized enterprises employing between 4 and 99 people153 – thus play a significant role in the city’s economy. Bandung’s development strategy emphasizes strengthening the city’s creative industry.154 A roadmap for Bandung as a Creative City was prepared by the city government in close collaboration with key stakeholders and has become the key reference point for implementation of creative city programmes. It consists of five strategic programmes: creative city infrastructure projects; Bandung creative investment projects; creative human resources projects; Bandung hi-tech creative projects; and creative evaluation of regulation projects. The Bandung Creative City Forum (BCCF) was established in 2008 as a vehicle to share ideas and bridge communications between creative communities. This platform brings together representatives from traditional arts, clothing and fashion, music and visual arts, urban enthusiasts and the urban heritage society. It has also seen support from journalists, intellectual property lawyers and urban planners.155 79
Within the classification of the creative economy, tourism is another sub-sector that could potentially strengthen the competitiveness of Bandung, since the city is a popular weekend destination for visitors from Jakarta and other cities. Creative tourism activities encompass cultural and arts performance, food, shopping and education. 3.2.7 Economic Development Partnerships Bandung city aims to become a service city that is clean, prosperous and friendly. To accomplish this, the Bandung city government formulated strategic programmes to develop a balanced economy that includes: industry development and business development; trade and business development; cooperative and business development; for small and medium enterprise development; city investment; development of tourism marketing and tourism products; and agribusiness development.156 Bandung city government has been active in developing inter-municipality cooperation with other cities and provinces, both within Indonesia through bilateral and multilateral modes of cooperation, and with international cities and organizations. Table 3.6 summarizes some of the partnerships and cooperation arrangements with other cities and districts in Indonesia. There are currently 24 sister cities including Cebu, Fort Worth, Suwon, Bari, Hangzhou, Liuzhou, Yingkou, Almaty, Braunschweig, Kuantan, Petaling Jaya and Seremban. In addition to these partnerships, Bandung has been active in developing cooperation with various local and international corporations – including information technology-related companies – that can aid the development of the city. The Mayor of Bandung’s intention is to make Bandung a smart city and the centre of information technology industries in Indonesia. Table 3.7 lists some of the cooperative agreements and partnerships developed with international organizations and cities.
80
Table 3.6 Inter-municipality Cooperation, Bandung Year
City/District
Scope
Output
2008
District of Batanghari Jambi
Transmigration programme
Resettlement of 10 households in Batanghari District
West Java Province
Joint cooperation on Gede Bade Stadium
The mutual agreement to finance the construction of the stadium with a 40% contribution from Bandung city
Surabaya City
Inter-Municipal Development Cooperation
Technical assistance for the procurement of Bandung Electronic Procurement (BeP)
Batam City
Economic Cooperation
Establishment of Bandung Business Centre in Batam in collaboration with the Chamber of Commerce
Greater Bandung Metropolitan Area
Solid waste management
Cooperation in composting of solid waste in TPK Sarimukti
2010
Surabaya City
Information Technology
Development of Bandung integrated resource management and electronic procurement system
2011
Pohuwato District in Gorontalo
Transmigration
Resettlement of 10 households in Pohuwato District
Greater Bandung Metropolitan
Solid waste management
Fund allocation for charged services, compensation, and negative impact compensation
Kayong Utara District
Transmigration
Resettlement of 10 households in Kayong Utara District
Kubu Raya District
Transmigration
Resettlement of 10 households in Kubu Raya District
Surabaya City
All development sectors
Learning and sharing experiences on environmental management, food security, information and communication, trade, industry and tourism
2009
2012
Source: Compiled from data in Akhir Masa Jabatan AMJ 2009–2012 [Mayor Completion Report].
81
Table 3.7 International Cooperation, Bandung No
City/District
Scope
Output
1.
Education Attaché (German Government)
Education
Partnership to develop a school on culture and language
2.
French government
Transportation
Grants for technical consultant in formulating a Transportation Master Plan for Greater Bandung
3.
Petaling Jaya, Malaysia
Economy, trade, tourism, culture, and education
Letter of Intent and Memorandum of Understanding on cooperation on economy, trade, tourism, culture and education
4.
Shenzhen, China
Business, trade, science and technology
Joint declaration on a partnership between private and research institutions on tourism, culture, the textile industry and the Meetings, Incentives, Conventions and Exhibitions (MICE) industry
Source: Akhir Masa Jabatan AMJ 2009–2012 [Mayor Completion Report].
3.3
STRATEGIC INFRASTRUCTURE AND ASSETS
3.3.1 Physical Infrastructure Bandung has a broad range of strategic infrastructure and assets which supports the city’s and the Bandung Metropolitan Area’s economies. Bandung is an important logistics collection and distribution centre, and the city is well-connected by road networks and train to cities and regions in Java. Toll roads connect Bandung to Jakarta and other cities in West Java Province. The train is a reliable transport mode connecting Bandung with other cities in Java. In 2012, Bandung airport handled more than 1.8 million passengers; 1.2 million of these were domestic passengers. The dry port of Gedebage serves as the logistics hub for export-oriented commodities and transportation to Jakarta International Port. 3.3.2 Logistics and Information Systems The city of Bandung is looking forward to achieving its smart city vision. The concept is to utilize ICT for monitoring and managing the various resources that exist within the city effectively and efficiently to maximize services to the citizens. Bandung is developing strategies to become a regional leader in the field. Two important application tools for 82
smart city development were created to enhance local governance: The Bandung Integrated Resource Management System (BIRMS) and the Bandung Command Centre.
Bandung Integrated Resource Management System (BIRMS)
BIRMS is an integrated local development and governance system that links the activities from planning, budgeting, implementation, monitoring and performance evaluation. BIRMS consists of several applications:
e-Project Planning includes a web-based application to facilitate detailed activity planning based on time, budget allocation and volume e-RUP consists of the procurement plan that will be carried out in the ongoing fiscal year e-Procurement allows service providers to make applications online e-Contract is a system to regulate contract arrangements and direct procurement from the contractual process through to financial disbursement e-Swakelola is a system to regulate procurement through the ‘self-management’ route e-Progress is a work documentation reporting system as a prerequisite for financial claims e-Performance is a performance web-based monitoring and evaluation system e-Asset is an asset information system based on e-Procurement and e-Contract
The implementation of BIRMS is an important partnership between agencies, which has helped to improve transparency and accountability of local government in conducting all local development and management processes.157
Bandung Command Centre
The Bandung Command Centre is a flagship project designed to achieve the vision of Bandung becoming a smart city. The centre was established early in 2015 in partnership with the Bandung Institute of Technology (ITB) to improve the delivery of public services.
83
Photo 3.2 Bandung Command Centre
Credit: Command Centre Beroperasi, (Command Operation Centre) Bandung Menuju Smart City.
The centre consists of a digital control board allowing city staff to remotely monitor traffic and manage crises in the city. It collects information from digital sources such as social media, online media, government data, short message services (SMS) and surveys to make informed decisions to improve delivery of emergency services. Bandung’s smart city vision and the projects being developed will help to enhance data production and management. More effort will be required, not only to improve data collection in the sectors covered by the Command Centre but also to receive other types of data such as air quality, and water and energy consumption, as well as data related to solid waste management. 3.3.3 Assessment of Physical Infrastructure and Assets The condition and level of physical infrastructure provision are vital to maintaining the city’s competitiveness (Table 3.8). Bandung has experienced rapid urbanization and the capacity of the city’s government to provide basic infrastructure has been very limited. Chronic infrastructure shortages have had significant negative impacts on the development of the economy and urban environment; and this has affected the quality of life and wellbeing of residents.158 To begin addressing these issues, the Indonesian government as well as local governments have given priority to infrastructure development in forward development plans and budgets. Water supply remains a critical problem. The provision of piped water to all areas of Bandung city is very limited. The city government is cooperating with cities and districts in the Bandung Metropolitan Area to increase water resources by using water from the 84
Citarum River. There is need for a single regional water authority for the Bandung Metropolitan Area to address inadequacies in water quality and distribution network systems. The availability of urban open space is important for improved air quality and quality of life. While Bandung has more open space per capita than other Indonesian cities, the city government is making efforts to increase the availability of public open spaces to 20 percent of the urban area, and for private open spaces, to 10 percent. Because of poor planning and urban management in the past, Bandung will have difficulty meeting these targets.
Table 3.8 Status of Physical Infrastructure and Assets in Bandung City Infrastructure Assets
Unit
2010
2012
2014
Length of road
km
1,185
1,236
1,236
Length of urban road in good quality
%
49.2
64.1
80
Number of vehicles
million units
1.21
1.35
1.53
Ratio of vehicle/length of road
unit/km
1,025
1,093
1,249
Coverage of HH with adequate water supply
%
65
69.2
n.a
Liveable houses
%
69.3
70.6
n.a
Number of transport passengers
people
5.8
6.1
n.a
Solid waste management
%
70
85
87.2
Access to water supply
%
67
72.4
n.a
Access of households to sanitation
%
70.9
n.a
n.a
Source: Rencana Pembangunan Jangka Menengah Daerah (RPJMD) [Local/Regional Medium Term Development Plan] 2014 and Rencana Kerja Pembangunan Daerah (RKPD) [Local/Regional Annual Development Work Plan] 2016.
85
Only 73 percent of the city has reticulated water supplies or access to safe deep-well potable water. As further urban expansion occurs, shortfalls in Bandung’s urban services infrastructure will widen unless municipal finances and budgets are increased. In the short term, securing additional resources or infrastructure is unlikely. Technical solutions are available to address some of the problems, but improvements in revenue collection for the use of services, and property taxes, are essential if the backlog of infrastructure is to be reduced. Reform of income tax collection systems and improved financial governance is crucial. 3.3.4 Public Infrastructure Reinvestment Plans The development of infrastructure plays a critical role in achieving Bandung city’s vision 2013–2018 toward excellence, comfort and wellbeing. One of the missions is to increase environmental quality supported by adequate carrying capacity for sustaining the productive activity of the Bandung community. The principle of spatial planning is to integrate, as sustainably as possible, the spatial planning of urban development with ecosystem landscape. The spatial policies of the city and the Bandung Metropolitan Area must consider the environmental carrying capacity to maintain environmental services and quality of life. The Medium-Term Development Plan (RPJMD) 2013–2018 outlines several important objectives to support spatial planning and infrastructure development.
Figure 3.5 The Focus on Infrastructure Development in Bandung’s Medium Term Development Plan (RPJMD) 2013–2018
Source: Kota Bandung, Rencana Pembangunan Jangka Menengah Daerah (RPJMD) [Local/Regional Medium Term Development Plan] 2013–2018.
86
Figure 3.5 shows the vision, mission and key elements of spatial and infrastructure development to be delivered under the RPJMD. The main objectives of the plan are to:
Improve the spatial planning processes Provide urban infrastructure, settlement and sanitation that are adequate and equitable in meeting the communities’ needs for urban services. The plans set targets for service delivery Implement a safe, comfortable, efficient, adequate, reliable and friendly public transportation system Improve environmental and disaster management.
The RPJMD 2013–2018 also includes specific proposals for infrastructure development for potential public–private partnerships between the Bandung government and investors. Specific proposals include: High-Speed Train Jakarta–Bandung This proposed project aims to increase connectivity between Jakarta and Bandung. The total cost is about USD 5.5 billion, which is being funded by a consortium of Chinese and Indonesian investors. The high-speed rail will reduce travel time from Jakarta to Bandung to 35 minutes. Construction was scheduled to commence in early 2016, with the system operational by mid-2019. This high-speed train will further strengthen economic growth and activities in the economic development growth corridor between Bandung and Jakarta. Bandung Urban Mobility Project (BUMP) BUMP outlines the vision for Bandung’s transportation and infrastructure projects until 2031.159 Bandung is experiencing rapid urbanization and, to meet housing demand and balance open space requirements, the city government supports higher density development and redevelopment. These factors cause significant transport and congestion problems due to vehicle growth (9.34%) increasing at a faster pace than road development (1.29%). This congestion will have an impact on the city socially and economically; it will also place significant pressures on environmental sustainability. BUMP consists of four principles:
An integrated strategy to fulfil human needs (life, work and play) through the creation of a Traffic Demand Management system. The most appropriate design in Transit Oriented Development (TOD) will be the redevelopment of the existing terminal and station Improvement of road networks as links between activity centres, not as a base for district development Public transport development (mass rapid transport) to include monorail, bus rapid transit, cable car, pedestrian lanes, bike sharing, school bus, etc.
87
Improved traffic management using technology including an Automatic Tracking Control System to control traffic patterns and a mass public transportation performance support system
Technopolis Gedebage
The Bandung Spatial Plan 2011–2031 outlines a development strategy for the eastern parts of Bandung to redistribute population and reduce the traffic burden in the city centre. The plan proposes to develop the Gedebage area into a new city centre and Technopolis (a technology city similar to Cyberjaya in Malaysia).160 The area to be developed will have a special economic zone featuring business and government centres, and science and technology parks. The supporting infrastructure will include integrated terminals, retention ponds for flood control, toll roads and basic infrastructure. Bandung city has scheduled these works for implementation in the period 2014–2018. 3.3.5 Operation and Maintenance of Infrastructure The cost of infrastructure operation and maintenance (O&M) is the responsibility of the Bandung city government. The key agencies responsible are: Road and Irrigation, Spatial Planning and Human Settlements, Transportation, and Environment. The central government’s Ministry of Public Works and Housing is responsible for the O&M budget for inter-regional infrastructure such as road networks and flood control. The Bandung city government contributes to intra-city road maintenance. 3.3.6 Infrastructure Partnerships The National Medium Term Development Plan 2015–2019161 states that infrastructure development should strengthen connectivity in Indonesia by achieving equitable development. The Plan encourages public–private partnerships (PPPs) in meeting budget requirements and encouraging economic investment. The government intends to use PPPs for sectoral and cross-sectoral infrastructure development. Since the local budget for infrastructure projects is limited, the Bandung city government is actively looking for private investors for future infrastructure projects. The National Development Planning Board (Bappenas) publishes a PPP book annually consisting of a list of public-private partnership projects planned in Indonesia.162 The list consists of three categories: potential projects; prospective projects; and ready to offer projects. Several large infrastructure projects for Bandung were listed in the 2015 PPP book. These include the Bandung Light Rail Transit, the Integrated Gedebage Multipurpose Terminal (Railway) and the Solid Waste Management Improvement Project.
3.4
SOCIAL AND ENVIRONMENTAL SYSTEMS AND SUSTAINABILITY
Bandung has and is continuing to experience rapid urbanization. In 2008, Bandung had a population of 2.3 million with an approximate growth rate of 0.8 percent per annum; the 88
city is expected to reach a population of 4.1 million by 2031. A recent study of Greater Bandung found that the city has the capacity to host only 3 million people with a density of 200 people per hectare. Should the population of Bandung increase as predicted, the city, as it exists, will face significant problems across all areas of governance, particularly in the social and environmental spheres. Four types of natural disasters threaten Bandung: volcanic activity, earthquake, flood and fire. Bandung city will also become more susceptible to extreme climate events, which increase the risks to property and public assets. Flooding risk is predicted to increase significantly due to the increasing intensity of rainfall runoff and vegetation clearance, particularly in the northern and southern parts of the city. Bandung city and the Bandung Metropolitan Area also have poor environmental management including wastewater and solid waste management control as evidenced by the Leuwigajah landfill disaster noted in the introduction to the chapter. 3.4.1 Labour Markets and Human Resource Development The quality of life in the Bandung Metropolitan Area is improving. The human development index (HDI) for Bandung city showed an increase from 77.51 in 2006 to 79.47 in 2013. Table 3.9 shows the overall education, health and purchasing power HDI indicators for Bandung for the period 2006–13. The Bandung HDI is relatively higher than the HDI levels for Indonesia as a whole or its provinces. The education index in Bandung is relatively high because of the high literacy rates and generally good education systems in the province. The purchasing power index is lower than other secondary cities in Indonesia because of lower per capita wages and GDP.
Table 3.9 Human Development Index (HDI) for Bandung City, 2006–2013 Year
HDI
Education
Health
Purchasing Power
2006
77.51
89.26
79.28
63.99
2007
78.09
89.56
80.65
54.04
2008
78.33
89.71
80.97
64.27
2009
78.71
89.83
81.08
65.22
2010
78.99
90.09
81.22
65.66
2011
79.12
90.14
81.32
65.90
2012
79.32
90.25
81.35
66.35
2013
79.47
90.44
81.38
66.59
Source: Central Board of Statistics (BPS) 2006–2013.
89
Table 3.10 Employment Conditions in Bandung City, 2008–2012 Indicator
2008 2012 (%) (%) 60.06 63.14 Labour participation rate 11.20 45.77 Job seekers placement rate 15.27 9.17 Open unemployment rate 82.99 86.32 Labour safety and protection rate 84.43 67.78 Industrial-relations conflict resolution Source: Kota Bandung, Rencana Pembangunan Jangka Menengah Daerah (RPJMD) [Local/Regional Medium Term Development Plan] 2013–2018.
In Bandung city, labour participation rates increased between 2008 and 2012 (Table 3.10). The unemployment rate for the city of Bandung is relatively higher (9.17%) than West Java Province (9.08%) and the average for Indonesia (6.14%). This is explained by the decentralization of manufacturing employment to other parts of the Bandung Metropolitan Area. The trade industry is the leading employment sector and contributes to 36.4 percent of employment, equating to 387,828 workers. Manufacturing ranks second and contributed 24.1 percent of jobs or 256,452 workers in 2012 (Table 3.11). Data on informal sector employment is difficult to obtain for Bandung and many secondary cities in Indonesia. Informal sector employment exceeds 70 percent 163 and is probably much higher.164
Table 3.11 Employment by Sector of Persons Age 10+, Bandung City, 2012 Employment by Sector
No. of People
Contribution (%)
9,012 Agriculture 1,954 Mining 256,452 Industry 3,953 Electricity, gas, water supply 41,904 Building 387,828 Trade 63,222 Transportation 57,818 Bank and financial service 242,024 Services 1,064,167 Total Source: Central Board of Statistics (BPS), Labour Planning in Bandung 2012–2017.
0.85 0.18 24.10 0.37 3.94 36.44 5.94 5.43 22.74 100.00
3.4.2 Environmental Management and Sustainability: Policies and Measures Bandung city recognizes the urgent need to address solid waste management, water supply provision and wastewater treatment management. Identifying solid waste disposal sites is a significant issue, following the Leuwigajah landfill disaster.165 The debate between using landfills or advanced incineration technology to convert waste to energy remains unresolved with community groups protesting against the pollution caused by 90
combustion. The city and the Bandung Metropolitan Area governments are examining new clean technology options for managing solid waste. At the community level, the city has encouraged communities to implement a 3R (reduce, reuse, recycle) system that applies to five temporary disposal sites. A waste bank to collect non-recyclable waste has been introduced in some communities. 3.4.3 Partnerships In recognition that Bandung must become a competitive and smarter city, the city government has begun to focus its efforts on improving the quality of human resources to support the development of the local economy. The city government is pursuing partnership programmes for capacity development to improve the skills and capabilities of the labour force, including a business plan with the Chamber of Commerce for Small and Medium Enterprises; vocational training with the automotive and engineering sectors, and knowledge sharing exchange programmes with other Indonesian cities.
3.5
URBAN GOVERNANCE
Bandung is an autonomous city governed by two main bodies: The Executive (Mayor and Vice Mayor) and the legislative (local parliament). Both are elected by the community to serve five-year terms. At the Executive level, the Bandung city government comprises the office of the Mayor and Vice Mayor, the city secretariat and the city agencies/boards. There are 17 local agencies and 7 technical boards responsible for a range of activities mandated by local governance law. At the lowest level, the city has sub-district and village officers who are responsible for providing public services to the community. The city government has more than 25,000 employees. 3.5.1 City Vision The Bandung city government has a responsibility to plan for and deliver a broad range of services. Local government laws mandate the preparation of spatial, physical, social and financial plans. Unfortunately, like many cities in Indonesia, there are enormous challenges in integrated planning and budgeting, especially in integrating different plans vertically and horizontally at the Bandung Metropolitan Area level. As part of the planning and development process, the city has developed a vision to guide its future development. The vision provides the focus for the city’s spatial plan and its development plans. The City Spatial Plan consists of spatial utilization plans and city structure plans. The Development Plans are socioeconomic plans for the long term (20 years) and medium term (5 years). Figure 3.6 shows the relationship between the city’s vision on the City Spatial Plan and the Local Development Plans. The Local/Regional Medium Term Development Plan (Rencana Pembangunan Jangka Menengah Daerah, or RPJMD) 2013–2018 is an explicit policy document that reflects the vision and mission of the elected Mayor during the five-year term. The main agendas of the Mayor indicated in the plan’s mission and objectives include: 91
Making Bandung a liveable city through spatial planning and infrastructure development. Targets include better waste management (to be achieved within two years); a flood-free city (two years); organized public street lighting (three years) and a congestion-free city (three years). Improving local governance. Strengthening the self-sufficiency, capacity and competitiveness of communities through the creation of business incubators; new job opportunities; scholarships for students; incentives for teachers; and local food subsidies. Building a resilient and equitable economy.
Figure 3.6 Bandung City Vision – City Spatial Plan and Local Development Plans
Source: Authors.
3.5.2 Institutional and Urban Management Arrangements Bandung city faces several issues and constraints in relation to institutional and urban management arrangements:
A need for cooperation, partnership and networking among civil society organizations, local parliament and local government in dealing with local development problems The low capacity of the government apparatus based on the competency, technical skills and bureaucracy mechanism in development and financial management Inadequate transparency on government management The need for inter-regional coordination and cooperation among the local governments in Greater Bandung, particularly on regional issues such as solid waste management, water resources and water supply. 92
3.5.3 Public Finance Bandung faces significant financial hurdles to achieve its desired development goals for the 2013–2018 Medium Term Development Plan. Its main source of public finance comes from central–local financing sources (70%) in the form of the General Allocation Fund (DAU) and Special Allocation Fund (DAK). Locally owned revenues (PAD) contribute to 30 percent of the city’s revenue. Most of this comes from local taxes and user charges. The DAU is allocated mostly to salaries. The DAK funds capital works and other development programmes; and the PAD is limited to financing other development needs. In 2013, the local budget was IDR 4.76 trillion (USD 39.5 million) with an average annual growth of 16 percent. The capital expenditure for the city was approximately IDR 1.3 trillion (USD 10.8 million). To achieve the city’s development goals, the estimated investment needed in infrastructure is approximately IDR 84.5 trillion (USD 700 million). Given this, the city faces an impossible situation when it comes to raising the necessary capital, through public sources, to meet the backlog of demand for infrastructure. It is crucial that the city improves its revenue collection and mobilizes other financial sources to fund desperately needed municipal services to support the development of the city. Figure 3.7 shows the revenue projection in 2014–2018 for the three primary income sources. The challenge for Bandung city is that central and provincial government sources of revenue are rising faster than the PAD, leaving the city vulnerable to changes in Indonesia’s revenue-sharing arrangements. The reliance on government funding is not sustainable. The capacity to run budget deficits is very limited unless forward estimates in revenues streams can be shown to improve.
Figure 3.7 Revenue Projection for Bandung City, 2014–2018, in billion IDR 8,000
7,594
7,000
Rupiah (Billions)
6,000
6,240
5,656
5,137
5,886
5,000 4,000 3,000 2,000
1,763
2,011
1,989 1,363
2,240
2,205 1,462
2,845 2,890
2,642
2,413 1,587
1,522
1,722
1,859
1,000 -
2014
2015
2016
2017
2018
Local own revenues
Central government transfers/balancing funds
Other legal revenues
Local revenues
Source: Reproduced from data RPJWR 2014–2015.
93
The city does not have a credit rating. Nor does it have an accounting system that enables assets and liabilities to be recorded on a balance sheet to establish a basis for achieving a credit rating. Some public assets are underperforming, and because of the failure to depreciate assets and operate sinking funds for their replacement, they are net liabilities to the city. Reform of the city’s financial management, accounting and revenue collection systems is a high priority. These include the introduction of a market value tax rating system, accrual based accounting, the right to issue notes and bonds, and greater access to sub-sovereign lending through commercial and international development banks. The latter will require legislative changes at central government level, but is essential to creating greater competition in local government financial markets.
94
Table 3.12 Local Partnerships for Sustainable Development in Bandung City
Government
City
City
Economic
Governance
Infrastructure
Research and innovation
Indonesia: Urban renewal for slum areas (rental flat housing)
West Java Province: Gelora Bandung Lautan Api (BLA) Stadium
Singapore: Capacity building for local officers
Indonesia: Bus rapid transit
OECD: Green growth
Sister Cities Programme
Batam: Bandung Business Centre
Citynet
Surabaya: Bandung Integrated Resource Management System (BIRMS)
Bloomberg: Road safety
Membereconomy level business
PT BPJS: Health insurance
PT BPJS and bank: Employment opportunities
High-speed train (Jakarta–Bandung)
Local business
Technopolis development
LED Org
Cable car (sky bridge) School buses (CSR) Public–private partnerships (PPPs)
Public utilities Public institutions
Community
Social and environmental
Technology
US: Road safety
Japan: Smart city and bio digester
Greater Bandung: Solid waste management
Surabaya: Information Technology
France: Cable car
UCLG ASPAC
Global business
Labour and skills
JSCA: Research on smart cities
Other districts in Indonesia: Transmigration programmes
Companies from the Netherlands: Water supply
Thematic parks (CSR)
Local higher education – community empowerment programme
CDM
Community Empowerment Programme
Biopori
Village Wifi Development
ASPAC = Asia Pacific Network of Science and Technology Centres; CDM = Clean Development Mechanism; CSR = Corporate Social Responsibility; JSCA = Japan Smart Community Alliance; LED = Local Economic Development; OECD = Organisation for Economic Co-operation and Development; PT BPJS = Badan Penyelenggara Jaminan Sosial Kesehatan (Social Security Agency of Health); UCLG = United Cities and Local Governments; Source: Authors.
95
3.6
PARTNERSHIPS FOR SUSTAINABLE DEVELOPMENT
Bandung city government has engaged in many types of partnerships to support the development and management of the city. Some existing and emerging partnerships occurring in the city between organizations and interest groups that have strong commitments to sustainability are shown in Table 3.12 and Table 3.13. Many of these involve formal arrangements; especially those associated with PPPs between government and business.
Table 3.13 Partnership Opportunities for Sustainable Development in Bandung City City partnerships
Local level
Regional and member-economy level
International level
Economic and trade
Cooperation with other cities/districts on issues related to business and local commodities
Cooperation with the central government in promoting exports, e.g. participation in international expos
Cooperation with public and private companies in promoting exports, e.g. opening Little Bandung in Paris
Infrastructure
Inter-municipal cooperation among cities/districts on regional issues (solid waste, water resources, transportation)
Collaboration on infrastructure development with provincial and central governments (prefeasibility study feasibility study, market sounding, etc.)
Collaboration with and mobilization of potential foreign investors in infrastructure development projects
Social and environmental
Mobilization of local business and community to improve city conditions as part of corporate social responsibility agendas
Mobilization of the central government and the private sector to improve city conditions
Collaboration with international organizations on research, feasibility studies, etc.
Governance
Use of information technology to monitor city conditions and complaint mechanisms
Collaboration with provincial and central governments to implement bureaucratic reforms through information technology and capacity-building programmes
Collaboration with international organizations to build the capacity of local government officers
Source: Authors.
96
3.6.2 Examples of Best Practice Partnerships The following describes two successful partnership and cooperative arrangements. Not all of these are best practices in sustainability, but they are management arrangements designed to support sustainability, resource leveraging, and value adding to development and services delivery. 3.6.2.1 Sister Cities Programme: Bandung–Suwon In 1960, Bandung established its first sister city relationship, with Braunschweig, Germany. Since then, its international city alliances have expanded to include Fort Worth, Texas, USA; Yingkou and Liuzhou, People’s Republic of China; and Suwon City, the Republic of Korea. Activities undertaken through the Sister City Programme include the construction of the Bandung City Chamber of Commerce building as the business centre for traders and private businesspersons from those cities. Bandung has participated in cultural events in Suwon, including the Food Festival in 2010 and 2011. In 2011 and 2012, Bandung and Suwon developed a youth and sports exchange programme. Suwon City has provided financial support in the form of a grant for the development of pre-elementary schools, materials, and tools for Bandung’s sub-districts and villages. Additional support is provided by local universities in Bandung, which provide language classes. 3.6.2.2 Corporate Social Responsibility and Parks Improvement in Bandung In line with the vision to improve the city’s amenities, the Bandung city government plans to develop and improve 607 parks – including 60 thematic parks – to enhance further social and environmental sustainability. The city has introduced a policy of corporate social responsibility (CSR) for state-owned companies and encouraged private companies to do the same to improve public parks in Bandung. An additional feature of these upgrades includes the installation of wireless internet in these public spaces. To date, 10 parks have been rehabilitated. Public awareness of cleanliness has improved significantly. Community initiatives have seen residents volunteering to keep the city clean. These volunteers monitor the condition of the parks and report to the authorities if they see any plants that need maintenance. 3.6.3 Initiatives to Promote PPPs To speed up local infrastructure development, the Bandung city government established a special body to promote potential PPPs and attract private investors. This is a principal interest for the Mayor; and a major agenda for the Bandung government, which has called publicly for innovative ways to attract more private sector investment. The initial stage of the initiative has been the establishment a technical service unit focusing on PPPs.
97
3.7
CONCLUSIONS
Bandung is a city that has failed to manage the effects of rapid urbanization. A long running history of poor governance has seen the rise of suburban slums, inadequate infrastructure and poor access to services, lack of environmental management, significant traffic congestion, unconventional high-density development and poor planning. As a result, the city lost its competitiveness edge and is struggling to revitalize its economy and become a more dynamic and creative city. While the city recognizes that it has significant challenges ahead, it has started to address these matters. It will take many years for past failures of poor urban planning, weak urban governance and environmental management problems to be overcome, but the changes in government and strong political leadership are beginning to turn Bandung into a smart and creative city. There are still wider challenges at hand and these must become part of a broader agenda to improve the sustainability of the development and management of the city. Integrated metropolitan planning, management and development to deliver essential services are critical. The Bandung development problems will not be solved until they are addressed systematically at the Bandung Metropolitan Area level. Second, the city must embrace more collaborative and inclusive means of urban governance. Vertical and horizontal governance administration, finance, resource and information sharing arrangements between the Bandung Metropolitan Area and local governments are weak. This, in turn, weakens the enabling environment for business, creates division over how the region’s resources should be used, undermines the city’s competitiveness and adds to the transaction costs of business and government. There is widespread recognition and understanding in the community, and to a lesser extent government and business, of these challenges, and of the need for public, private and local collaborations to overcome them. Partnerships and other collaborative initiatives are part of a new model of sustainable development that the city has willingly embraced. Research for this case study identified some valuable lessons on development sustainability and the use of partnerships to foster sustainable development. First, a recent change in government shows the importance of leadership and the need for government to create a vision and take action to restore confidence in Bandung as a good place to live, work and invest. The preparation of long-term infrastructure and upgrading plans and the encouragement of local community development initiatives have been critical in building resilience and confidence to help the city as a whole to become more confident about its future. Recent government initiatives to support CSR to encourage partnerships for the redevelopment of green spaces have been crucial to improving social amenities. The Bandung economy is driven by trade, hospitality, and manufacturing. It is transforming rapidly from a manufacturing to a service-oriented economy. While it will continue to make a strong contribution to international exports, the transformation of the economy through a focus on creative, innovative and niche industry clusters is essential to ensure sustainable economic growth and development. Bandung, through its smart city
98
initiative, is beginning to develop as an economic hub and to attract small and larger businesses in the technology and telecommunication service sectors. Finally, Bandung city recognizes that it cannot operate as a lone competitor. It is part of an emerging and fast growing urban economic development corridor connecting the major cities in Java with the rest of the Indonesian archipelago. Its future depends on collaborating with other cities and regions to secure significant infrastructure investment for projects such as the Jakarta–Bandung fast train project. The city also recognizes that it is part of the ASEAN region and that the development of city-to-city regional partnerships will be crucial to securing new markets, business development opportunities and tourism. Bandung is no longer simply part of the system of cities in Indonesia but part of a larger network of competing cities in the APEC region. Its future sustainable development lies in developing stronger economic, social, governance and logistical ties with other cities in the region through partnerships and other collaborative initiatives involving government, business and the Bandung Metropolitan Area communities. Such partnerships will need to be negotiated between many local and regional stakeholders in an inclusive and open manner if Bandung is to realize its vision of a safe, liveable, productive, effective, efficient, well-planned and well-managed sustainable city.
99
4. Bangkok–Phnom Penh–Ho Chi Minh Corridor, Greater Mekong Sub-region Alain Maulion, Florian Steinberg and Michael Lindfield
4.1
INTRODUCTION
Cities and towns in the Greater Mekong Subregion (GMS) are becoming engines of economic growth, and centres of culture and innovation. They currently account for about 70–80 percent of the subregion’s economic production. The subregion’s urbanization forms a pivotal part of the paradigm shift from predominantly agriculture to manufacturing, service and knowledge-driven economies. These rapid developments raise a whole range of issues such as transport, water supply, infrastructure, waste management, sanitation, environmental sustainability, poverty, shelter and a new framework for urban development. The Asian Development Bank (ADB) and other international finance institutions and development assistance agencies are focusing on corridor growth development within the GMS, as a corridor approach provides the opportunity to take an integrated approach to economic development. To date, the overwhelming focus of support has been on logistics and border crossings, but attention is now shifting to broader development issues such as catalysing private sector development along the corridor. There is also increased emphasis on the areas outside the megacities bracketing the corridor as there is a perception that those megacities have benefited disproportionally from investment thus far and that the private sector has not taken up investment in areas other than major centres.166 This case study focuses on the Southern Economic Corridor of the GMS linking Bangkok and Ho Chi Minh City (HCMC). The corridor has a ‘spur’ to Dawei in Myanmar and transits Prachin Buri in Thailand, and Poipet, Battambang, Phnom Penh and Bavet in Cambodia. It also has spurs to Vung Tau and Can Tho in Viet Nam. 4.1.1 The Southern Economic Corridor The Southern Economic Corridor (also often referred to as the SEC) supports three of the five strategic thrusts of the GMS Strategic Framework:167 (i) strengthening infrastructure linkages through a multisector approach; (ii) facilitating cross-border trade and investment; and (iii) enhancing private sector participation in development and improving its competitiveness. The corridor comprises the following connections between major towns and cities in the southern GMS: (i) Central Subcorridor: Bangkok–Phnom Penh–Ho Chi Minh City–Vung Tau; (ii) Northern Subcorridor: Bangkok–Siem Reap–Stung Treng–Rattanakiri–O Yadav–Pleiku–QuyNhon; (iii) Southern Coastal Subcorridor: Bangkok–Trat–Koh Kong–Kampot–Ha Tien–Ca Mau City–Nam Can; and (iv) Inter-corridor Links:Sihanoukville–Phnom Penh–Kratie–Stung Treng–Dong Kralor (Tra Pang Kriel)–
100
Pakse–Savannakhet, which links the three subcorridors of the Southern Economic Corridor with the East–West Economic Corridor. Policies and regulations along the corridor are vital to its development, as they determine the form, level and use of infrastructure investments. The public sector plays a key role in developing policies and conducive regulatory environments to facilitate private sector investment. The GMS flagship initiative on Facilitating Cross-Border Trade and Investment is a key step in this regard. The agreement simplifies customs procedures, facilitates cross-border travel, and minimizes the need for trans-shipment, among many other advantages; it also includes a human resource development programme for the transport sector. This interaction between regulation and investment is demonstrated by the results of a pilot test involving single-stop customs procedures that would reduce transportation time and other transaction costs along the corridor at the Cambodia–Viet Nam border at Bavet– MocBai. Cambodia and Viet Nam increased their border trade by 40 percent and crossborder passenger traffic by 53 percent yearly. Cross-border tourism rose. The pilot test also led to the setting up of special economic zones (SEZs) in the border areas, such as the Bavet–MocBai SEZs.
101
Figure 4.1 The Southern Economic Corridor (SEC) of the Greater Mekong Subregion (GMS)
Source: J. Yuen, ‘Thailand: ASEAN’s Key Logistics Hub’ (Hong Kong Trade and Development Council Research, 2015).
4.1.2 Development of the Corridor The development of the Southern Economic Corridor (Figure 4.2) is embedded in the regional integration efforts of the ADB. The ADB’s main objectives in developing economic corridors in Asia include trade facilitation, movement of goods and people, and poverty reduction.168 In the Greater Mekong, sub-regional cooperation on corridor development started through a ministerial conference attended by Cambodia, Laos, Myanmar, Thailand, Viet Nam and the Yunnan Province of the Peoples’ Republic of China (PRC) held in Manila in October 1992. The transport, telecommunication, energy, human resources, environment, and trade and investment sectors were represented at the conference. However, the improvement and construction of cross-border sections of major roads facilitating trade and investment among economies along the GMS corridor had the highest priority. The Subregional Transport Forum, a working group under the GMS senior officials’ meetings, played a key role in mapping out the GMS Transport Sector Strategy Study as the subregion’s 10-year blueprint. This was approved in 2007
102
and updated by the new GMS Economic Cooperation Program Strategic Framework, 2012–2022. South and Central Asia also have such corridors under development each with their own subregional frameworks.169 In Central Asia, the ADB’s Greater Silk Road Initiative promotes the economic growth of Central Asian economies and beyond, through traditional trade links and regional economic cooperation.170
Figure 4.2 Connecting Bangkok, Phnom Penh and Ho Chi Minh City – The Southern Economic Corridor (SEC): The Viet Nam and Cambodia Connection
Source: ‘Promoting intra-regional connectivity for economic growth: Cambodia and ASEAN in 2012’, Cambodia Outlook Brief, No. 3 (Phnom Penh: CDRI, 2012); See also: A. Maulion and F. Steinberg, ‘Bangkok to Ho Chi Minh: Competitiveness of cities along corridors in South East Asia’, in F. Steinberg and J. Hakim, Urban Development in the Greater Mekong Subregion (Manila: ADB, 2016).
4.1.3 The Greater Mekong Subregion The GMS Framework 2012–2022 provides a spatial and thematic focus for trade and investment development. It expands the conventional infrastructure development approach to multisector investments designed to foster both economic corridor and urban development. The ADB’s strategy for corridor development highlights the need for carefully planned investments aimed at strengthening urban development, upgrading logistics, improving the network of feeder and rural roads, and developing other transport modes.171,172 Stronger cross-sector linkages, better consideration of the spatial aspects of regional economic development, greater local and private stakeholder involvement in
103
developing new markets and investments, and more effective monitoring and evaluation of development practices and prognosis are other important aspects of the strategy As part of the strategic framework, the GMS economies agreed to pursue several flagship programmes: (i) build a telecommunications backbone; (ii) develop regional power interconnection and trading arrangements; (iii) facilitate cross-border trade and investment; (iv) enhance private sector participation and competitiveness; (v) develop human resources and skills competencies; (vi) develop a strategic environmental framework; (vii) enhance flood control and water resource management; and (viii) develop GMS tourism. The ADB is the primary support agency for the development of the economic corridor. The corridor concept links production to market, fostering trade, through the provision of infrastructure within a specific geographical framework. While the focus is on urban centres, rural areas also benefit from the expansion of markets for agricultural produce and access to employment opportunities. The cities and towns in the Southern Economic Corridor are receiving major support from the ADB as part of its regional cooperation and integration initiatives. The ADB’s current support for towns along the GMS transport corridors represents an effort to deepen development efforts along these corridors and emphasizes the conversion of transport corridors into viable economic corridors fostering the sustainable development of the region. Assistance needs to focus particularly on environmental and social inclusiveness issues.173 The three major cities in the corridor – Bangkok, HCMC and Phnom Penh– are described briefly in the next sections, with focus on their competitiveness. A more general discussion of the issues follows, relating to cities in the remainder of the corridor, including Poipet, Battambang, Bavet, MocBai and Dawei.
104
4.2
MAJOR CORRIDOR CITIES Photo 4.1 Bangkok’s Old City Centre
Credit: Florian Steinberg.
4.2.1 Metropolitan Bangkok Bangkok – the capital city of Thailand – occupies 1,568.7 square kilometres in the Chao Phraya River delta. The city shares borders with the provinces of Nonthaburi, Pathum Thani, Samut Prakan, Samut Sakhon and Nakhon Pathom. These five provinces, along with Bangkok, form the conurbation known as the Bangkok Metropolitan Region, a highly-urbanized triangle in central and eastern Thailand stretching from Nakhon Ratchasima to the heavily industrialized eastern seaboard. Bangkok is home to over 8 million people, or 12.6 percent of Thailand’s population. The Bangkok Metropolitan Region has over 14 million people (22.2%), making Bangkok an extreme primate city, dwarfing Thailand’s other urban centres in terms of importance. 4.2.1.1 Economic Environment In 2010, Bangkok’s economic output was approximately USD 98.34 billion, or 29.1 percent of Thailand’s GDP. This amounted to a per capita GDP value of THB 456,911 (USD 14,301), almost three times the average for Thailand of THB 160,556 (USD 5,025). The Bangkok Metropolitan Region had a combined output of THB 4.773 trillion (USD 149.39 billion) or 44.2 percent of Thailand’s GDP. Bangkok’s economy, which is focused on high-level services, finance and tourism, ranks 6th among Asian cities in terms of per capita GDP, after Singapore; Hong Kong, China; Tokyo; Osaka–Kobe; and Seoul.174 A major centre of industrial activity in the Bangkok Metropolitan Region is the eastern seaboard area, around Chonburi.
105
Thailand advocates a free market economy. The government retains control over certain core services, such as power generation, some transportation and communications. The majority of industrial and economic activity however is in the hands of the private sector. The agricultural sector remains significant in terms of exports and employment. Manufacturing is also important, with a diversified base that includes steel, electronics and computers, electrical appliances, processed food, garments, footwear, toys, plastics, gems, jewellery and furniture. The government strongly encourages foreign investment in knowledge-based and hightechnology industries such as electronics and automobile manufacturing. The economy has already attracted auto heavyweights such as Toyota, Ford and Mercedes to manufacture there. Such foreign investments have important knock-on effects. For example, the economy’s rise as a hub for automobile manufacturing has created higher demand for steel, which has led to opportunities in steel production.175 4.2.1.2 Business Environment Bangkok is highly connected with the import and export trade. The city rates 61st overall in the Economist Intelligence Unit’s Hot Spots index, which assesses the competitiveness of 120 global cities,176 and 60th in the ‘economic strength’ component, a creditable performance. The Hot Spots Index cited Bangkok’s dynamism as the most important factor in its competitiveness. The 2011–2012 World Economic Forum (WEF) Global Competitiveness Report ranks Thailand 4th in terms of ‘macroeconomic environment’ and 3rd in ‘goods market efficiency’ among eight ASEAN members.177 The capital is an important venue for the regional headquarters of transnational corporations as well as multilateral and regional organizations. There are 27 banks headquartered there, and about 300,000 SMEs, with 73 shipping companies and 88 airlines servicing the city. Within the Bangkok Metropolitan Region, there are 11 companies on the 50 Southeast Asia Challengers list: Banpu, Central Group, Charoen Pokphand Group, Indorama Ventures, Minor International, Mitr Phol Corp, Pruksa Real Estate, PTT, Siam Cement Group, Sri Trang Agro-Industry and Thai Union Frozen.178 Their revenues range between USD 500 million and USD 63 billion annually. The Bangkok Metropolitan Region is a major transport hub. It features large port facilities; and the Suvarnabhumi International Airport. The airport’s two runways, two taxiways and a 76-flight-per-hour handling capacity make it one of the 50 busiest airports in the world.179 Suvarnabhumi International Airport registered 47,910,744 passengers in 2011, a 12 percent increase from 2010.180 Bangkok is also home to some of Asia’s largest convention centres and has superb hotel accommodation with their own meeting facilities. The city has a growing reputation for hosting Meetings, Incentives, Conventions and Exhibitions (MICE). Major international events in the city include the Asia-Pacific Economic Cooperation (APEC) Summit and the Miss Universe Pageant. The International Congress and Convention Association (ICCA) ranks Bangkok as one of the most popular destinations for international meetings.
106
4.2.1.3 Cross-Border Trade Thailand exports a diverse range of products. It is considered the regional centre of the East Asian automotive industry with engines and automobile components and spare parts among its major export items. Other exports are motorcycles and their spare parts, cement, livestock, feeds, petroleum, woven fabrics and chemical fertilizers. Active cross-border trade between Thailand and Cambodia, including Viet Nam, has spurred significant urban development in Thailand, especially along the Aranyaprathet– Poipet border.181 Data on formal cross-border trade between Cambodia and Thailand show that total cross-border exports from Thailand to Cambodia rose from THB 53.9 billion (USD 1,618,187) in 2009 to THB 74.3 billion (USD 2,460,735) in 2010, representing an increase of 37.8 percent. In 2009, the Aranyaprathet border checkpoint (Central Subcorridor) accounted for about half of the total cross-border exports of Thailand to Cambodia, followed by the Klong Yai border checkpoint (Southern Coastal Subcorridor) with about one-third. Around two-thirds of the total cross-border exports of Thailand to Cambodia have taken place in the Central and Southern Coastal Subcorridors of the Southern Economic Corridor. In 2011, the economy’s total export turnover (up to November) amounted to nearly USD 87.36 billion, up by 35 percent year on year, surpassing the 25 percent full-year target. Import turnover stood at USD 96.2 billion, a 26.5 percent increase year on year, while the targeted figure was 23.6 percent. Goods imported from Cambodia rose from THB 2.66 billion (USD 79,831,932) in 2009 to THB 6.86 billion (USD 227,302,849) in 2010, an increase of 158 percent. 4.2.1.4 Innovation and Business Support The ‘smart economic policies’ implemented by the Thai government led the World Bank to upgrade Thailand’s status as a middle-income economy in July 2011. Well-defined investment policies focusing on liberalization and free trade encourage industries to establish themselves in the city. The government actively promotes foreign investment that contributes to the development of skills, technology and innovation. In the automotive industry for example, one of the major steps taken by the Thai government to promote industrial development and the specialization of domestic manufacturing was to allow foreign capital to dominate investment in car assembly plants while local players focused on developing supply and production chains for related components. In the beginning, factories established by local Thai investors produced lowpriced, usually low-tech, items, such as those related to exterior modification. The firms mainly served local price-conscious customers or budget auto repair shops. In order to establish industrial scale, the government helped local industry build its supply chain, set rules for foreign automobile manufacturers, implemented local content requirements via import substitution and spurred production localization of key components. Two main categories of industrial estates are available to investors. The General Industrial Zone is reserved for industries manufacturing for domestic and/or export consumption; while the Export Processing Zone is for industries manufacturing for export only. The Board of Investment provides a range of incentives to investors in such zones. Investors
107
enjoy tax incentives, support services, and import duty exemptions or reductions to an extensive list of promoted activities. Companies receiving investment privileges from the Board of Investment are not subject to foreign equity restrictions in the manufacturing sector, and there are neither local content requirements nor export requirements, as Thailand’s investment regime is in total compliance with WTO regulations. In line with such policies, the Bangkok Metropolitan Region has established a one-stop service centre, which enables foreign staff of Board of Investment-promoted companies to obtain work permits and long-term visas within three hours or less. There is also a ‘one start one stop investment centre’, which facilitates a range of services and streamlines investment procedures by bringing representatives from more than 20 government agencies under one roof. The results of existing policies are seen in the Economist Intelligence Unit’s Hot Spots index, where Bangkok ranks 38th in terms of ‘global appeal’. Its business services infrastructure, particularly finance, is relatively well-developed; Thailand has a large and deep capital market. It ranks 32nd in the ‘financial maturity’ component of the Hot Spot index. However, other issues could affect Bangkok’s business climate, like the 2011 floods. The need is seen for policy reforms that focus on mainstreaming climate change adaptation into the city’s development initiatives. 4.2.1.5 Human Resource Development Bangkok is the centre of higher education, research and development. It has a high number of educational and vocational/technical institutions, and a large labour pool with an unemployment rate of only 0.95 percent (2010 survey).182 The Office of the Vocational Education Commission (OVEC) of the Ministry of Education administers 415 public colleges and 427 private vocational schools and colleges throughout Thailand.183 Technical and vocational education and training in Thailand is relatively well developed, with clear pathways from certificate to diploma levels, and provision for progression to bachelor’s degree programmes.184 In a labour market efficiency survey conducted in 2011–2012 and published by the World Economic Forum (WEF) in its Global Competitiveness Report, Bangkok ranked 30th out of 142 cities. Bangkok rates 42nd in the ‘human capital’ component of the Economist Intelligence Unit’s Hot Spots index, substantially above Manila and most other developing-nation cities. However, the WEF Global Competitiveness Report 2011–2012 ranking of Thailand in terms of higher education and training was 62nd out of 142 economies, a less satisfactory performance. 4.2.1.6 Cost of Doing Business At USD 26 per square metre for rental of commercial space and USD 0.40 per kilolitre for water, Bangkok is comparable with other cities and towns in the Southern Economic Corridor. It has a lower average cost for fixed line international calls at USD 0.16 per minute. However, the city has few fixed line providers, limiting the options available to business enterprises.
108
In terms of raw materials for its industries, Thailand has access to agricultural products and to the high-technology component inputs needed to produce higher value-added goods, which lowers production costs. However, labour cost in Bangkok is higher compared to other towns and cities along the Southern Economic Corridor. In 2005, the minimum wage rate was already USD 4.84 per day; and in 2012, the Thai government raised the minimum wage to THB 300 per day (USD 9.60) per day. The introduction of a minimum wage is in line with the government’s plans to promote knowledge-intensive industries and services (cheap labour is a significant factor in labour-intensive industries, but less of a comparative advantage for skills- or knowledge-intensive industries). This policy shift could lead to the relocation of labour-intensive industries such as garments and shoes to other GMS economies. Thailand ranks 17th in 2011 in overall ‘ease of doing business’ according to the International Finance Corporation (IFC); and it has consistently been in the top 20 over the previous eight years.185 Thailand also ranks in the top 20 in ‘dealing with construction permits’, ‘protecting investors’ and ‘trading across borders’. The Bangkok Metropolitan Region, as the commercial centre of Thailand, is the primary beneficiary of this conducive business environment. 4.2.1.7 Infrastructure Assessment Growth and development in Bangkok could be attributed in large part to the infrastructure in the city. The city ranks 75th in the ‘physical capital’ component of the Economist Intelligence Unit’s Hot Spots index. Generally, the water system is good (although Bangkok still lacks a sewerage system). However, Bangkok is prone to flooding. The 2011 floods, the worst in seven decades, raised concerns over the resilience of city in the face of climate change-related disasters. The flood affected industry, disrupting supply chains and increasing the cost of doing business. Among various impacts, the flooding led to a global shortage of computer hard disk drives. The significant consequences to business and industry prompted the government to rethink its policy on climate-resilient structures and to look at adopting green practices. Bangkok also has a developed road network, despite the dominance of water transportation for much of the city’s history. For 60 years after the city was established in 1782, water transportation dominated, and the city grew along the Chao Phraya River and the canals branching from it. The consequent urban forms restricted the development of road transportation. The role of water transportation has declined since the 1950s, and land transportation has become the main transport mode. The development of the city’s road network has generally been limited to capacity expansion, for example, the widening of highways to a minimum of four lanes, and road safety. In terms of road networks, the Bangkok–Chon Buri (81.75km) and the Eastern Outer Ring Road (64km) motorways link Bangkok and the surrounding industrial areas, serving as a commodities transport route from the northern part of the region to Laem Chabang Port. The expressway network is limited to Bangkok and its vicinity comprising
109
a total distance of 150km. Due to unclear regulations and weak enforcement of load limits for trucks, road quality has deteriorated in recent years. Traffic has become a serious issue. In 2007, Bangkok had 5.6 million registered vehicles, contributing to the city’s worsening air pollution. The challenge is to reduce congestion on the city’s arterials by improving public transport. Buses are the backbone of the passenger transportation system in Bangkok, accounting for more than 50 percent of all passenger trips, and 75 percent of trips during the peak period. To address worsening traffic congestion and pollution, Bangkok has also invested heavily in rail-based public transport (Figure 4.3). Figure 4.3 Bangkok Regional Plan 2057
Source: Bangkok Regional Plan 2057, in Ministry of Land, Infrastructure, Transport and Tourism, Japan, ‘An overview of spatial policy in Asian and European countries’, accessed 28 May 2016, http://www.mlit.go.jp/kokudokeikaku/international/spw/general/thailand/index_e.html
Bangkok also has air and seaport facilities capable of handling large passenger and cargo traffic. The seaport has a capacity of 47,050,000 TEUs (twenty-foot equivalent unit). Total international air freight stood at 12,792,000 tons in 2008. Bangkok Port’s international sea freight (outbound and inbound) in 2010 reached 1,453,000 TEUs with 2,681 vessels from 1,310,000 TEUs in 2009, an increase of 10.9 percent. To further increase connectivity, the Thai government, together with the government of China, plans to build a high-speed train as part of the proposed transnational railroad network linking the eastern end of the Southern Economic Corridor to China in the north and Malaysia in the south. The train’s top speed is planned as 200km/hr. This link will
110
run from Kunming, in China, to Bangkok and Rayong and connect to the border with Malaysia. Links to Lao PDR and Cambodia are also envisaged. 4.2.1.8 Social and Environmental Quality Quality of life. Bangkok has 138 private and public hospitals, the most among the cities and towns along the Southern Economic Corridor. Though Bangkok has a good number of hospitals, its population to hospital bed ratio is 478:1, indicating the need for more investment in health services. Given its vulnerability to floods, its ranking of 38th in the ‘environmental and natural hazards’ component of the Economist Intelligence Unit’s Hot Spots index is very creditable. Local authorities have often overlooked the possibility of incorporating environmental assessment as a legal requirement in their by-laws. Thailand does not have an environmental assessment requirement for small and medium scale infrastructure development projects in municipal by-laws, even though such projects, particularly roads, could create adverse impacts on the environment if not planned, designed and constructed properly. A main concern for Bangkok is the high level of car use, and the associated air pollution and traffic congestion.186 The improvements in the transport system like the sky train and the underground metro have made movement within the city core more efficient; but worsening traffic conditions still affect the city’s productivity. Air pollution remains a problem, although the situation is improving. The Department of Local Administration (DoLA) has recommended the local authorities to set up committees to oversee local development work. One of the tasks of such a committee is to develop an Environmental Management System (EMS) suitable for use at the local government level. However, this task is quite challenging for most local authorities since there is an absence of a separate unit in charge of environmental management at the local-authority level. Inclusiveness. Bangkok is the nexus of competing political forces in Thailand, and the current conflicts focus on Bangkok. The consequent disruption is adversely affecting the economic competitiveness of the city. Its ranking in the ‘social and cultural character’ component of the Hot Spots index is 56th. 4.2.1.9 Urban Governance The Thai administration is relatively effective. It rates quite well among developing nation cities in the Economist Intelligence Unit’s Hot Spots index, at 70th with a score of 54 out of a possible 100.187 The city of Bangkok is governed by the Bangkok Metropolitan Administration.188 The area is considered a province (changwat) but unlike other provinces in Thailand, Bangkok is a special administrative area headed by a directly elected governor. Policymaking functions are held by an executive body made up of the governor and four appointed deputies; while legislative functions, including municipal ordinances and the city’s budget, are the responsibility of the Bangkok Metropolitan Council. This council is made
111
up of city councillors elected at district level. Bangkok is subdivided into 50 districts (khet), which are further divided into 169 subdistricts (khwaeng). Each district is managed by a district director appointed by the governor. The Bangkok Metropolitan Administration is divided into 16 departments, each overseeing different aspects of the administration’s responsibilities. Most of these responsibilities concern the city’s infrastructure, and include city planning, building control, transportation, drainage, waste management and city beautification, as well as education, medical and rescue services. Many of these services are provided jointly with other agencies, and this sometimes causes coordination problems. The urbanisation process is a challenging task as the city grows beyond administrative limits without adequate backbone support from infrastructure networks, land-use planning guidance or development control. As a consequence, it is commonly seen that environmental problems arise in the city and the fringe areas of the city where urbanisation is allowed to spill over the city limits. In this context, the local authorities of the Thai cities need to transcend their conventional role of urban management to embrace urban environmental management and promote sustainable urban development. 4.2.2 Phnom Penh Metropolitan Area Located on the banks of the Tonlé Sap and Mekong River, the Phnom Penh metropolitan area is home to about 2.2 million of Cambodia’s population of over 14.8 million. Phnom Penh is Cambodia’s economic centre. The main economic activities are services, commerce, garments and tourism. Photo 4.2 Phnom Penh – City Centre near the Tonle River
Credit: Florian Steinberg.
112
4.2.2.1 Economic Environment Phnom Penh has been the capital of Cambodia since French colonization. It was considered to be an exceptional example of French colonial cities in Indochina in the 1920s. Founded in 1434, Phnom Penh was the royal capital from 1434 to 1505, but was then abandoned for 360 years – until 1865 – due to internal fighting between competing royal factions. It was not until 1866, under the reign of King Norodom I, that Phnom Penh became the permanent seat of government and the capital of Cambodia. Starting in 1870, the French turned a riverside village into a colonial city with modern infrastructure and buildings such as hotels, schools, prisons, barracks, banks, public works offices, telegraph offices, law courts, and health centres. In 1872, its first concrete housing project was constructed by a French contractor, Le Faucheur, for sale and rent to Chinese traders. By the end of the 1920s, railways to Sihanoukville and the Pochentong International Airport (now Phnom Penh International Airport) were built. Phnom Penh’s infrastructure saw major modernization under the Sihanouk administration. During the Viet Nam War, thousands of refugees flooded the city to escape the fighting between their own government troops, the North Viet Namese army, the South Viet Namese army and its allies, and the Khmer Rouge. In 1975, the city fell to the Khmer Rouge. Pol Pot, its leader, sought a return to an agrarian economy; and the city’s residents were forced to work in rural farms. Those perceived as educated or ‘lazy’, or as political enemies, were killed. Infrastructure was seriously damaged and within three and a half years, Phnom Penh was a ghost city. The Khmer Rouge was deposed in 1979 and the city was rebuilt. Phnom Penh is now the capital of Cambodia and its largest city; and it has evolved to become the centre of the nation’s economic and industrial activities, as well as the hub of security, politics, economics, cultural heritage and diplomacy. The city is located in the south-central region of Cambodia, at the confluence of the Tonlé Sap, Mekong and Bassac rivers. These rivers provide fresh water and are important river ecosystems providing marine resources. Phnom Penh is the wealthiest and most populous city in Cambodia. The city’s economy is based on commerce and trade. Industry includes a range of small and medium enterprises, in particular in the garment trade. In the past 3 years, the real estate sector has boomed. With tourism becoming a major contributor to Cambodia’s economyin general, and the city’s growth in particular, more investors have been building hotels, and shopping and commercial centres. According to the World Travel and Tourism Council, tourism made up 17.5 percent (USD 2.1 billion) of Cambodia’s GDP in 2009 and accounted for 13.7 percent of total employment. Phnom Penh’s disposable income was the highest in Cambodia; three times the Cambodian average.189 4.2.2.2 Business Environment Phnom Penh’s location between Bangkok and Ho Chi Minh City puts it at the centre of the Southern Economic Corridor. Cambodia’s integration in ASEAN and the WTO will mean greater market access for both goods and services including tourism. Phnom Penh has more than 50 percent of the hotel rooms, 30 percent of the guest houses and 60 percent of the travel agencies in Cambodia, making it the most important in terms of tourism activity in Cambodia, ahead even of Siem Reap, the site of Angkor Wat.
113
To compete in a highly competitive global business environment, the government of Cambodia has liberalized export policies and licensing and implemented tax reforms, providing various incentives to investors. Its fully serviced Phnom Penh Special Economic Zones, including free trade zones, are considered engines of growth to boost manufacturing and exports, and generate employment. According to the Provincial Business Environment Scoreboard in Cambodia, Phnom Penh, though the wealthiest and with the highest per capita income, is weak in governance. However, it has one of the lowest entry costs, informal charges and taxation. Phnom Penh is the largest market in Cambodia, with UN-Habitat predicting that its population will more than double between 2005 and 2025.190 It has the highest number of fixed telephone and internet service providers in the GMS, providing residents and businesses with the luxury of choice. It is second to Bangkok in the number of commercial airlines and shipping lines serving it. This facilitates mobility of goods and people. But the city has low per capita income and few banking institutions. Credit is available but not affordable or accessible, especially to SMEs. 4.2.2.3 Cost of Doing Business Phnom Penh has one of the lowest minimum wages and costs for roaming calls, an attraction for labour-intensive industries. But it has one of the highest electricity tariffs in the region and the highest cost of international calls on a per minute basis. The high electricity rate increases the cost of transport and goods. 4.2.2.4 Cross-Border Trade Cambodia became the sixth largest garment exporter in the world in 2007.191 The garment industry, which is centred in Kandal Province, created half a million jobs in Cambodia and generated some USD 0.3 billion in monthly payments for the employees. Agricultural exports, many processed in the Phnom Penh area, are increasingly important, as palm oil, peanuts, rice, pepper and other rural products become more popular in the international markets.192 The handicrafts industry is one of the fastest-growing sectors. There are several reasons for this: a large and relatively stable market with opportunity for export-driven expansion; demand from tourists, particularly those visiting Siem Reap; and high levels of donor involvement at all levels of the handicrafts value chain. The production of handicrafts is easily outsourced; this allows household-based employment and income generation, which benefits the disadvantaged and vulnerable who have limited or no education, few marketable skills and who wish to avoid urban migration. The export demand for Cambodian handicrafts currently exceeds the amount that local producers can supply. There are an estimated 100 to 150 organizations involved in handicrafts production in Cambodia, from private sector firms to not-for-profit organizations and nongovernmental organizations.
114
4.2.2.5 Human Resource Development The city has a labour force of around 600,000. The skilled employment rate is low as the city has few higher and vocational/technical institutions. The low skill base is a key factor in attracting investment and businesses. Boosting educational investment and the number of institutions is vital to improving the competencies and skills of the labour force. 4.2.2.6 Infrastructure Assessment As a major Asian hub, Phnom Penh benefits from the service of significant transport infrastructure. The city’s main forms of transport include taxis, pick-ups and minibuses, most of which are used within the city and for both entering and exiting. The city has the use of a significant 27 bridges; and several highways connect Phnom Penh to other economic and tourist centres in Cambodia. Of most importance, Phnom Penh is linked through two transportation networks: (i) Bangkok to Mekong Delta: NR5NR6-NR1 rail, and the sea–Lao boat route; and (ii) Phnom Penh to Sihanoukville: NR4NR1 rail, NR6 and additional rail services. The city also has an international airport, strategically located 7km north of the city, as well as a seaport providing fast and reliable storage and loading facilities for both import and export of goods and services. Phnom Penh has a Special Economic Zone (SEZ) which is equipped with modern infrastructure, including backup water and power. It has a dry port providing fast and reliable loading and storage facilities, wastewater treatment and good access to telecommunication services. However, major roads are in poor condition, including National Highways No. 1, No. 5 and No. 6 connecting Viet Nam and Thailand. Many of the roads remain unpaved. This is despite 70 percent of the economy’s total freight going through Phnom Penh’s road network. Additionally, trucks cannot enter Phnom Penh during daytime hours; and there are no facilities to transfer cargo between large trucks and small to medium trucks. 4.2.2.7 Responsiveness of City Government to Business Needs Phnom Penh has a Master Development Plan and a City Development Strategy to address the infrastructure challenges facing the city, including its electricity and water requirements. The Stock Exchange was launched as a ‘full-time’ exchange in February 2015, with the Phnom Penh Water Authority the first listing. The promulgation of globally and regionally compatible regulatory frameworks, e.g. the 2001 Land Law, and the ADB-GMS initiatives, have boosted foreign direct investment (FDI) and integration into regional supply chains, and led to the formation of knowledge transactions with transnational firms, research institutions, and other knowledge networks. The length of time for registering a business is still long by international standards. There is a need to further streamline business registration and lower transaction costs, both formal and informal. Though the solid waste management system in Phnom Penh city, in general, has been upgraded since the waste collection service was franchised out to the private sector, the performance of the existing system is still low. Unreliable and irregular collection services still exist. These shortcomings need to be corrected.
115
4.2.2.8 Quality of Life Travel time to and from work within the city is shorter compared to other cities studied. This may be due to fewer vehicles on the road, as the city has a road density of only 1.62. Phnom Penh SEZ achieved both ISO 9001 and ISO 14001 certificates in early 2010. It follows professional and transparent international corporate standards while espousing corporate social responsibility. The city lacks health services like hospitals and adequate hospital beds for its growing population. It also needs to institutionalize international standards and conformance, e.g. ISO, HACCP, etc. Its sewage and drainage system requires upgrading to address flooding. 4.2.3 Ho Chi Minh City Metropolitan Region The metropolitan area, which consists of the Ho Chi Minh City metropolitan area, Thủ Dầu Một, Dĩ An, Biên Hòa and surrounding towns, has more than 9 million people, or over 8 percent of Viet Nam’s population, making it the most populous metropolitan area in Viet Nam. The area accounts for 20 percent of Viet Nam’s GDP, 28 percent of its industrial output and 34 percent of its FDI projects in 2005.
Photo 4.3 Ho Chi Minh City – Central Area
Credit: Florian Steinberg
The economy of Ho Chi Minh City consists of a wide range of industries ranging from seafood and agricultural processing, to construction, tourism, finance, trade, and industry
116
– in particular, garments and electronics. The state-owned sector makes up 33.3 percent of the economy, the private sector 4.6 percent, and the remainder comes from foreign investment. The service sector accounts for 51.1 percent, and industry and construction account for 47.7 percent, with almost no primary industry. 4.2.3.1 Economic Environment Ho Chi Minh City (formerly Saigon) started as a small fishing village known as Prey Nokor. Originally swamp land, it was an important Khmer seaport for centuries before annexation by the Viet Namese in the seventeenth century. In 1698, Nguyễn Hữu Cảnh, a Viet Namese noble was credited with expanding Saigon into a significant settlement area. Under French colonial rule, Saigon was the capital of the Cochin-China. A number of classical Western-style buildings and French-style villas were built in the city. In 1976, after Viet Nam was reunited, Saigon merged with the surrounding Gia Dịnh Province and was officially renamed Ho Chi Minh City. Ho Chi Minh City has an area of approximately 2,094 square kilometres. Crucially, it is the transport hub of the southern region and the main gateway of Viet Nam to the world. It has the largest port system and airport in Viet Nam. The city is 1,730km from Ha Noi by land and is at the crossroads of international maritime routes. Ho Chi Minh City is at the centre of the burgeoning Viet Nam economy and the economy’s industrial heart. The Southern Key Economic Zone accounts for 50 percent of Viet Nam’s GDP, and 60 percent of its FDI. The city’s total export turnover between January and October 2011 reached USD 22.2 billion, a tremendous increase of 18.9 percent over the same period in 2010. 193 Crude oil and gold were the city’s main exports, amounting to a third of the city’s total export earnings. Garments and textiles accounted for more than 16 percent of the city’s total export value in the first 10 months of 2011, and fetched nearly USD 1.8 billion, up 18.9 percent over the same period in 2010. The City Statistics Office reports that with shipments of approximately 2.4 million tons in 10 months, rice contributed USD 1.14 billion to the city’s total export turnover, up 10.8 percent from 2010. Export of footwear surged 18.2 percent to nearly USD 500 million while seafood exports rose 13.5 percent to nearly USD 339 million. The city itself, in contrast to the broader region, plays a strategic role in Viet Nam’s development, accounting for 20 percent of the economy’s GDP, 30 percent of the industrial output, 29 percent of the total retail sales and services, 40 percent of the export turnover and 33 percent of the State budget in 2010. The capital hosts one high-tech park, two software parks, three export processing zones, and eighteen industrial parks (collectively SEZs). These SEZs provide one-stop shops for investors. Services include online processing of business registration and online inquiry to the 42 government agencies linked. They also facilitate face-to-face meetings between and among foreign investors, business consultants and lawyers. The central government provides city governments with State credits for investment development, policy support, and incentives for the development of key industrial sectors such as garments and engineering products. Among the incentives are financing mechanisms for shipbuilding, and exemption of land rent and land-use fees for businesses
117
engaged in software development. The Ho Chi Minh City People’s Committee has issued a directive to implement a programme supporting business modernization at low cost, with the aim of improving the city’s competitive edge and promoting exports. In addition, investors enjoy a set of incentives that include corporate income tax of 15– 20 percent (depending on localities), exemption from corporate income tax over four years, incentives on value-added tax, and exemption from import tariffs for materials used to produce software for export. The individual income tax rate for foreigners with resident status is also the same as that of a Viet Namese. 4.2.3.2 Business Environment Ho Chi Minh City is the second largest market and most densely populated area in the Southern Economic Corridor. It has the second largest number of commercial banks and hosts 15 economic zones, the largest of the studied areas. Ho Chi Minh City has 92,000 registered SMEs and the second highest per capita income in the Southern Economic Corridor. Overall, Ho Chi Minh City rates 109th in the Economist Intelligence Unit’s Hot Spots index, but 36th in the ‘economic strength’ component. Despite its strengths, the city has the highest inflation rate in the Southern Economic Corridor at almost 19 percent at the end of 2011. It also offers only limited telecommunication services in fixed-line, mobile and internet access. This may be due to the strict regulations implemented in the economy as a whole. Commercial banking has developed rapidly, and now contributes significantly to the economy. Much more could be done to facilitate its growth, particularly in terms of improving the legal framework for the sector and enforcing policies and regulations related to such issues as charter capital expansion, risk management, human resources and minimum technical capabilities in the banking system.194 Institutional reforms must hinge on a thorough grasp of existing problems, reflect on the sector’s need to adapt to a new economic landscape, and the numerous enhancements required to improve enforcement efficacy. 4.2.3.4 Cost of Doing Business The city has low electricity and water supply tariffs due to government price controls. In addition, industries, especially shoe makers, source 60 percent of their raw materials locally. The availability of air and sea access also decreases transport costs. Disincentives for potential investors include high rental and lease costs for commercial space and industrial land; and the high minimum wage. 4.2.3.5 Cross-Border Trade Ho Chi Minh City registered USD 24.45 billion of exports in the January–November 2011 period, up 18.9 percent year on year, and spent USD 24.57 billion on imports, a 26.2 percent year-on-year increase. Based on a study by the Cambodia Development Resource Institute, vegetables exported to Cambodia via MocBai provide almost 70 percent of Cambodia’s vegetable demand. The last few years witnessed an increasing share of vegetables from Viet Nam, displacing Thailand as the major supplier. Vegetables from
118
Viet Nam are highly traded during the months of April to November, with the volume of daily imports ranging between 40 and 160 tons, depending on the season. There are six groups involved in the vegetable trade: Viet Namese suppliers based in Ho Chi Minh City, Viet Namese importers, Viet Namese ethnic traders, Cambodian sellers at Phnom Penh wholesale markets, provincial or Phnom Penh wholesalers, and provincial or Phnom Penh retailers. The trade flow shows that the Viet Namese importers buy their vegetables from Viet Namese suppliers at the source markets and directly supply to the Cambodian sellers at Phnom Penh wholesale markets.195 The Cambodian sellers have their own agents or sell to ethnic Viet Namese traders who are based in Cambodia. These traders supply to the wholesale markets. Then the wholesale market sells to provincial wholesalers and/or retailers. 4.2.3.6 Human Resource Development The city has a high employment rate and a well-educated and skilled working age population. The tourism sector has grown rapidly, resulting in micro and small businesses such as vending and transport businesses. Overall, Ho Chi Minh City needs to upgrade its human resource development and training, as the city does not have enough quality technical and tertiary schools to match industries’ dynamic and changing requirements. Ho Chi Minh City rates 91st in the ‘human capital’ component of the Economist Intelligence Unit’s Hot Spots index, again above Manila. 4.2.3.7 Responsiveness of City Government to Business Needs Of the three core cities of the Southern Economic Corridor, Ho Chi Minh City has the shortest time for processing investment registration. It has a set of incentives for investors and a one-stop service centre to facilitate business registration. However, it also has the most onerous documentary requirements for starting a business or investing in the city. This is reflected in the ranking of Ho Chi Minh City in the ‘global appeal’ category of Economist Intelligence Unit’s Hot Spots Index – at 80th. Its business services infrastructure, particularly finance, is also relatively weak with a rank of 90th in the ‘financial maturity’ component of the Hot Spots index. 4.2.3.9 Infrastructure Assessment In general, Viet Nam’s transportation system is outdated and dominated by small-scale enterprises.196 Viet Nam does not have enough deep-water seaports, and its highways largely do not meet international standards. Also, the road systems in major cities have not been fully integrated into the highway system. However, many current projects are designed to address these deficiencies. In Ho Chi Minh City, the city is rapidly outgrowing its old infrastructure system. According to the Deputy Chairman of the Ho Chi Minh City People’s Committee Nguyen Trung Tin: ‘Roads are being developed by two per cent while the number of vehicles grows by 10 percent per year, leading to the overload on the City’s infrastructure facilities’.197 This suggests the need for new models of urban renewal.
119
Most inner roads in Ho Chi Minh City are narrow. Only 14 percent of them are over 12m wide and suitable for bus transport; 51 percent are 7m to 12m wide, suitable for cars and microbuses; and the remaining roads are less than 7m in width, allowing only motorbike and cycle access. As of 2008, the number of registered vehicles was 3,926,730, comprising 361,411 cars (10.63 percent higher than in 2007) and 3,565,289 motorbikes (6.8 percent higher than in 2007). The 17.8km Bac Nha Be–Nam Binh Chanh Highway (also called Binh Thuan Highway) is a major development.198 It stretches from Tan Thuan Export Processing Zone to Binh Chanh District and links with National Highway 1. The 120m wide, 10-lane road facilitates the transport of goods to Saigon Port. The highway, also an important beltway of the city, runs parallel to the Te and Doi canals (east–west from Saigon to Cholon).199 The city’s location on the Saigon River makes it a significant port for cargo as well as passengers. There are regular cargo and passenger services to and from various destinations in southern Viet Nam and Cambodia. Over the years, traffic along these routes have increased.200 The Doi and Te canals, the main routes to the Mekong Delta, are traversed by 100,000 waterway vehicles every year, representing around 13 million tons of cargo.201 Links with the deep-sea port at Vung Tau have also improved. The city provides quality telecommunications and internet services, including high-speed access, with charges either lower or the same as economies in the region. IT parks are allowed to connect their own gateways to the international internet system so that they can have convenient web access at competitive prices. Internet usage has been growing rapidly, with more than 2 million subscribers and 5 million frequent users. Internet access is regulated, and websites containing sensitive political or religious content are routinely blocked. Logistics is facilitated by its airport and seaports. Tan Son Nhat Airport is not only an important gateway to the main economic regions of Viet Nam but is also a major international airport hub in Southeast Asia. The airport counts nearly 100 flights to and from other capitals and large cities all over the world. Twenty-two international airlines operate regular flights to and from the airport, with connections to 20 economies. There are plans to move the international airport outside the city, with projected capacity of 100,000 passengers a day by 2030. Ho Chi Minh City also has the biggest port system in Viet Nam. The container capacity of its seaport is second only to Bangkok; there are also plans to move it outside the city. 4.2.3.10 Social and Environmental Quality Quality of life. The city has 100 hospitals, and there are many open green spaces such as parks in and around the city with recreational and wellness facilities. In terms of standards and certifications, ISO certification in Viet Nam was still low in 2009, at 16.72 percent of all firms. With increasing wealth and industrial activity, the city is becoming more congested and polluted. As a city at risk from climate change impacts, the government needs to integrate climate-change mitigation and adaptation policies into its urban development plans. The city is highly vulnerable to typhoons and floods, as reflected in its ranking of 108th in the ‘environmental and natural hazards’ component of the Economist Intelligence Unit’s Hot Spots index.
120
Inclusiveness. Although inequality is worsening, the city is relatively prosperous within Viet Nam, and public services are generally available, in some measure, to all its citizens. Poverty remains a pressing issue, however. Its ranking in the ‘social and cultural character’ component of the Hot Spots index is 109th. 4.2.3.11 Urban Governance Ho Chi Minh City has the administrative status of a province. The city is divided into 24 administrative divisions (districts). Five of these (area totalling 1,601km2) are designated as rural. The remaining districts (494km2) are designated urban or suburban. Each district is subdivided into wards. The city has 259 wards, 58 communes and 5 townships. It could be seen therefore that the city administration controls the majority of the urban areas. However, some economically significant areas, including the port of Vung Tau, fall beyond its boundaries; and coordination between provinces is the responsibility of the central government – an arrangement that is not always as efficient as it could be. The city’s administration falls short in comparison with other cities in the Economist Intelligence Unit’s Hot Spots index, at 103.
4.3
INTERMEDIATE CORRIDOR TOWNS
With the exception of the two ports, Vung Tau and Daxin, the intermediate towns in the corridor, including Phnom Penh, must focus on tourism, agricultural processing and highly land-intensive or very labour cost-sensitive manufacturing (the latter in Cambodia and Myanmar). Border towns, particularly in Cambodia, take advantage of regulatory and/or factor-cost differentials, and the potential of ‘casino tourism’. The tourism and agro-processing industries are mainly dependent on the natural capital of the areas surrounding the corridor. Secondarily, there is a need to support the private sector in the areas of human capital development, business support, infrastructure and finance. Such support needs to be given in the context of the environmental carrying capacity of the land and of the traditional communities that occupy the land. The economic characteristics and zoning of the Southern Economic Corridor, as assessed by a regional multi-sector investment framework transport study, is summarized in Table 4.1.
121
Table 4.1 Features of the Southern Economic Corridor Factor Demographic Situation
Infrastructure Connectivity
Assets
Indicators Population profile
Ethnic minorities Current traffic volume Number of airports along the route Proximity to railroad Access to seaports Forest resources (timber and wood processing) Agriculture potential
Plantations Tourism potential
Processing, markets, and export nodes
Processing
Examples Urban (Ho Chi Minh City and Vung Tau in Viet Nam; Bangkok, the eastern seaboard and Prachin Buri in Thailand; Dawei in Myanmar), otherwise largely rural. Particularly in Viet Nam, Cambodia and Myanmar. Strongest toward the end points. Agricultural produce might divert to Bangkok, Thailand. 8 (3 international). Most major urban centres have railways, but with limited feeder infrastructure. Vung Tau (Viet Nam) and Dawei (Myanmar). Corridor crosses large forest areas.
Rice paddy in Chao Phraya basin and Isaan (Korat Plateau); fish in Tonlé Sap Lake; timber and high-value agriculture in Cambodia; high-density paddy in coastal Quang Tri to Da Nang (Viet Nam). Eucalyptus, growing amount of rubber in Central Annamites (central and southern Lao PDR). Casino tourism in Cambodia (Bavet, Phnom Penh, Poipet); eco- and/or ethno-tourism; history tourism (Indochina war). Large tourism potential in Myanmar as a newly opened economy. Medium concentration of economic zones in Da Nang around Ho Chi Minh City (Viet Nam); border economic zones (BEZs) at border crossings; concentration of economic zones is expected to increase along Andaman coast (Yangon–Mawlamyine–Dawei, Myanmar). Bangkok and its eastern seaboard, Ho Chi Minh City, Vung Tau (airport, port).
Export nodes and/or market access capabilities Industrial Electronics, car and car parts, food and food products, composition of chemicals, food and food products, timber exports Source: Based on Asian Development Bank, Economic Corridor Development for Inclusive Asian Regional Integration: Modeling Approach to Economic Corridors (Manila: ADB, 2014).
Responding to the potential conflict between corridor development and natural-capital depletion, the ADB and GMS economies designed the Core Environment Program and Biodiversity Conservation Corridors Initiative (CEP-BCI). The aim is to ensure sustainability in the GMS, including environmentally sound economic corridors: The main goal is to embed environmental considerations into all steps of the planning cycle, in particular through introducing environmental assessment and evaluation techniques to strategic and investment planners, piloting green investments, exploring links to market mechanisms, and promoting monitoring and performance assessments.202
122
The significant external support to the Southern Economic Corridor has played an important role in boosting the competitiveness of cities and urban areas along this transport/economic corridor. The corridor shows forces both of agglomeration and fragmentation, characteristic of production and distribution networks in Asia. Some economies and cities may attract more firms and population, such as Bangkok and Ho Chi Minh City; others, such as peripheral towns in Cambodia like Poipet, may be less attractive to investors due to lack of education and training, poor inter-modal transport systems, and undeveloped financial services. To obtain the full benefits of economic integration, cities and urban areas need to promote appropriate support to local industrialcluster development. Bangkok–Ho Chi Minh City: Complementary Cities. The Bangkok–Phnom Penh–Ho Chi Minh City Corridor, the largest and most developed region among the four subcorridors, is part of the Southern Economic Corridor. It offers both markets and resources by linking three major populations and economic and trade hubs (Table 4.2). The competitiveness of this corridor can be attributed to the rapid development in Bangkok and Ho Chi Minh City. This was the subject of a study on Competitiveness of Cities along Corridors in South-East Asia: Bangkok to Ho Chi Minh City.203 The corridor integrates the social, commercial and economic/natural resources of the three cities and urban areas along the corridor, such as Poipet, Battambang, Phnom Penh, Bavet and MocBai. These rapidly urbanizing towns are part of a major growth corridor in Southeast Asia. As part of the Southern Economic Corridor, these cities and towns receive major support from the ADB as part of its regional cooperation and integration initiatives. The emerging urban centres between Bangkok and Ho Chi Minh City have yet to demonstrate the benefits of corridor development or show increased competitiveness with tangible data.
123
Table 4.2 Key Economic Facts – Bangkok, Phnom Penh, Ho Chi Minh City Bangkok
Phnom Penh
Ho Chi Minh City
Population
11,190,037 (2012)
2,301,725 (2012)
7,521,138 (2011)
Area (km2)
1,568.7
678.46
2,094
GDP (USD, billion)
129.38 (2013)
2.053 (2009)
71.1 (2015)
Nominal GDP per capita (USD)
15,192 (2013)
1,130 (2014)
5,538 (2014)
30.8 (2013)
25 (2014)
38 (2014)
4.3 (2012)
6.1 (2012)
9.2 (2012)
Share of Economy’s GDP (%) GDP growth (%)
Sources: ‘Bangkok statistics’, Bangkok, accessed 28 May 2016, http://www.referbangkok.com/bangkok/bangkok-statistics.php; Organisation for Economic Co-operation and Development (OECD), ‘Structural policy country notes: Thailand’ (OECD, 2013); Economic Institute of Cambodia, accessed 12 April 2012, http://www.eicambodia.org/; ‘Asia/Cambodia (Phnom Penh)’, Getamap.net, accessed 12 April 2012, http://www.getamap.net/about/cambodia/economy.html; Statistical Office in Ho Chi Minh City, accessed 29 May 2016, http://www.pso.hochiminhcity.gov.vn/web/guest/home;jsessionid=245FFBFF45D3CF060FFBBDDDE71 4F0C4; ‘Phnom Penh City, The Charming City’, Phnom Penh Capital Hall, accessed 29 May 2016, http://www.phnompenh.gov.kh/phnom-penh-city-facts-99.html; Viet Nam Briefing, ‘Ho Chi Minh City’, accessed 15 April 2012, http://www.Viet Nam-briefing.com/ magazine/article/ho-chi-minh-city-21.html; VN Express Tin Nhahn Viet Nam, ‘TP HCM đặt mục tiêu thu nhập bình quân 4.000 USD mỗi người’, accessed 12 April 2012, http://vnexpress.net/gl/kinh-doanh/2012/12/tp-hcm-dat-muc-tieu-thu-nhap-binhquan-4-000-usd-moi-nguoi/; ‘Viet Nam, Population fun’, accessed 29 May 2016, http://www.populationfun.com/Viet Nam-population/; Council for Development of Cambodia, CDC, Cambodian Investment Board, CIB & Cambodian Special Economic Zone Board, CSEZB, accessed 29 May 2016, http://www.cambodiainvestment.gov.kh/investment-enviroment/economic-trend.html
Metropolitan cities generate stimulus for small corridor towns. The cities and urban towns along the Bangkok–Phnom Penh–Ho Chi Minh City Corridor have the following economic drivers that help them attract investments:
Special economic zones Favourable investment climate Stable political climate and good governance Positive macroeconomic conditions Predictable legal systems Inclusive social development policies Relatively good infrastructure that links production, operations and market, multimodal transport facilities, and logistical support to the existing road networks Fiscal and non-fiscal incentive policies Location advantages.
124
The firms located along the GMS corridor, especially in the BEZs and SEZs, attach great importance to strategic geographical location (e.g. GMS Transport Corridor, TransASEAN Highway, airports and sea ports, lower cost of living, and resource availability). The GMS Economic Corridor, under the GMS and ASEAN Frameworks and its complementarities, enhances the competitiveness of the cities and urban areas from Bangkok to Ho Chi Minh City:
Thailand is now the regional centre of the East Asian automotive industry. In addition, its major exports include motorcycles and parts, cement, engines, livestock feeds, petroleum, woven fabrics, textiles, and chemical fertilizers. Cambodia currently exports labour, garments, scrap metals, second-hand clothes, handicrafts, fresh and processed fish rubber, and other agricultural products. Viet Nam’s key exports include shoes, cereals, steel and iron, soap, organic active agents, plastics, mineral fuels, oils and derivatives, and vegetables. Viet Nam is a rising manufacturing centre, with significant agro-processing potential.
Linked to the Southern Economic Corridor are other economies:
Lao PDR’s exports lie in agriculture and agribusiness, such as eucalyptus, rubber, sugarcane, soybeans, cassava, jatropha, maize, okra, cabbages, bananas and coffee; hydropower; and mining (tin, lead, zinc, iron, ore, copper, gypsum, lignite and sapphires). Tourism, services, manufacturing and construction are also expanding fast. Myanmar’s comparative advantages lie in aquatic products, fresh vegetables, dried fruits, natural rubber, minerals, wood and beans. Most of the PRC’s exports to East and Southeast Asia consist of manufactured goods, such as textiles, electronic equipment, and agricultural and chemical products.
The following shared regional public goods have also made the corridor more attractive to FDI:
4.4
Access to resources and skills, e.g. Cambodians employed in Thailand Location relative to markets, e.g. Poipet, Cambodia’s access to the Thai market Public–private partnership (PPP) modalities in the SEZs More efficient public services, e.g. customs clearance Improved quality of life in corridor towns Lower cost of doing business due to investment in urban infrastructure such as transport and water corridors, reliable electricity, and water supply. CORRIDOR DEVELOPMENT GOVERNANCE
High-level policy for the GMS is set at GMS Summits, while oversight of GMS programme content and implementation progress is addressed at GMS Ministerial Conferences held annually.204 Senior officials from GMS member economies meet two or three times a year to review sectoral programme implementation and identify issues to be brought up at the Ministerial Conferences.
125
To operationalize the various initiatives approved at ministerial level, the GMS has a secretariat at the ADB and a number of working groups and sector forums. The secretariat provides technical and logistics support; and the working groups and sector forums guide and monitor the implementation of GMS projects. There has been increasing ownership within the region of forums and working groups engaged in diverse areas:
Environment: The Environment Operations Centre based in Bangkok provides secretariat support for the Working Group on Environment. Tourism: The Mekong Tourism Coordination Office based in Bangkok provides secretariat support for the Tourism Working Group and drives the promotion of the GMS as a single tourist destination. Energy: The Regional Power Trade Coordinating Committee is developing a framework for regional trade in power. Transport: The Subregional Transport Forum oversees a number of projects. The National Transport Facilitation Committee and the Cross-Border Transport Agreement (CBTA) Joint Committee provide the institutional support for the CBTA negotiations, finalization and implementation, among others. Trade: The Subregional Trade Facilitation Working Group is addressing barriers caused by customs procedures.
The structure of governance of the GMS is thus relatively comprehensive. It has catalyzed significant investment but is not yet fully responsive to the needs of sustainable development across the region, as witnessed by the continuing environmental problems and poverty in the subregion.
4.5
CONCLUSIONS
Two central economic development priorities have emerged from the GMS economies: tourism and the manufacturing industry. Tourism activities capitalize on the combination of natural resources and services in the region, offering an economic activity that is environmentally sustainable and potentially socially inclusive. In the case of industry, cities and towns along the GMS corridor have drivers that attract investment such as: (i) SEZs; (ii) favourable investment climate, including the presence of one-stop-shop business process centres; (iii) a stable political climate, including good governance; (iv) favourable macroeconomic conditions; (v) a predictable legal system; (vi) good social relations; (vii) good infrastructure linking supply and production chains; (viii) proinvestment policies such as fiscal incentives (i.e. tax holidays and exemptions), support for expansion of business (asset depreciation) and other non-fiscal incentives (financial policy support and investment facilitation); (ix) start-up grants or free land lease; (x) locational advantages (i.e. proximity to other established SEZs and air/seaports, lower cost of living than established centres and lower wage rates); and (xi) availability of resources, market, and other product and trade linkages.
126
Several common characteristics of GMS SEZs are relevant to their ability to attract investment, drive local development and enhance regional integration:
Most firms in the GMS corridors, especially in the SEZs, are involved in foreign trade (export). However, they have weak local supply chains, particularly in Cambodia, where local firms source 60 percent of their raw materials from Viet Nam. There is need for a holistic approach that is inclusive and sustainable to make sure that the emerging corridor cities can cope with current threats to their long-term future, such as climate change. There is a need for continuous innovation in institutions and a change in attitudes on the part of governments to promote participation and partnerships with both civil society and private companies. SEZs are highly dependent on foreign expertise, capital, demand and technology. For regional integration, the SEZs reflect important outcomes of ADB-funded infrastructure projects linking the GMS economies. While connectivity is established in a basic sense – through roads and cross-border trade agreements – it should be strengthened and deepened to provide genuine incentives for investment, trade and development along the corridors, and for greater competition and cooperation to be achieved. Lack of available public infrastructure prompts SEZs to build their own infrastructure.
To ensure that these issues are resolved in a positive way to achieve more sustainable development, there is a need to better coordinate ongoing GMS initiatives. This applies particularly to programmes aimed at enhancing the environmental performance of the towns in the Southern Economic Corridor, to enable them to become more competitive, cleaner and greener locations for the newly evolving industries and tourism within the GMS. The Southern Economic Corridor, by its nature, represents city-to-city economic cooperation. Bangkok–Phnom Penh–Ho Chi Minh City represents the high point of achievement among the GMS economic corridors. It is the most travelled and busiest corridor and has the biggest flow of goods. The flow of goods is biggest between Bangkok and Phnom Penh, and between Ho Chi Minh City and Phnom Penh, with a lesser flow of products in the reverse direction. Interestingly, Thailand uses the Southern Economic Corridor as an alternative access route to the sea for many of its products, since the Bangkok port is often clogged, and harbour processing can be done more efficiently and at lower cost in Viet Nam. The key learnings about the sustainability and viability of such developments are that institutions need to be strengthened at each level of corridor operation. At the regional level, it is vital to focus on trade facilitation and cross-border processes. At the domestic level, there is a need to coordinate infrastructure provision appropriate to the local industry clusters. At the local level, in order to foster a conducive business environment with appropriate skills, local infrastructure and business regulation must be addressed. Partnerships with development agencies can play a key role – as with the ADB in the Southern Economic Corridor. But more has to be done to proactively involve the private
127
sector to elicit better targeting for public investment and to tap its innovative potential. Cooperation and collaboration with the wider region could also be advantageous. The three economies are members of ASEAN; this has helped them to develop a very active framework for networking and sharing. Joint ASEAN policies in trade and commerce and promotion of visa-free ASEAN tourism have benefited the member economies. These processes are by no means fully institutionalized, even in the Southern Economic Corridor, the most successful of the corridors. There is a need for APEC to foster greater integration of policies relating to economic corridors into each member economy’s development plans, and specifically to recognize the need for better city-to-city linkages for trade and investment and for the adoption of best practices for sustainable urban development focusing on governance and institutional strengthening.
128
5. Greater Brisbane Region, Australia Brian H. Roberts, John Abbott and Michelle Addison
5.1
INTRODUCTION
The Greater Brisbane Region, also referred to in this chapter as South East Queensland, is Australia’s third largest metropolitan region. It consists of 12 local governments (Figure 5.1) with Brisbane, as state capital of Queensland, being the largest city. The region has a population of 3.3 million, which represents 70 percent of the state’s population living in only 1.3 percent of the state’s total area205. Over the past four decades, it has been Australia’s fastest growing metropolitan region. The rapid development of the region has generated many economic and social benefits to its citizens and business, but the rates of urban and population growth have made it challenge for governments to protect environmental assets and to keep up with delivery of community services and essential infrastructure. A focus on growth management has made it one of the best managed metropolitan regions in Australia. Greater Brisbane has been listed several times as one of the world’s most liveable cities. However, the economic development of the region has lagged behind the metropolitan regions of Sydney and Melbourne due to weaknesses in the competitiveness and structure of the economy. Photo 5.1 Brisbane Central Business District (CBD)
Credit: Brisbane Marketing.
129
To address these weaknesses, state and local governments have embarked on economic reforms, massive infrastructure projects and adopted a model of collaborative governance and metropolitan planning.206 There is a high level of engagement in partnerships and network initiatives involving economic, social and environmental planning, public– private sector partnerships and urban renewal projects which are global best practice. Several of the cities that make up the region, especially Brisbane207 and Gold Coast, are among the best managed local governments to be found anywhere in the Asia-Pacific region. The state and local governments have been active in developing trade enterprise areas, such as the Australia Trade Coast, and initiatives to make the region more competitive in attracting investment, firms and migrants. However, the region has struggled to develop advanced service and technology-based manufacturing. Improving productivity and strengthening endogenous growth industries are significant continuing challenges for the development of the region’s economy.
Figure 5.1 Twelve Local Governments of the Greater Brisbane or Southeast Queensland (SEQ) Region
This chapter explores the development of the Greater Brisbane Region from an economic, physical, social, and environmental management and governance perspective. There are many examples of good practice sustainable city development which provide excellent models for adaptation in other parts of the AsiaPacific region. Some of these are Authors based on Department of State Development, presented as case studies of good Source: Infrastructure and Planning, Queensland Government (DSDIP), practice partnerships in the latter part SEQ Regional Plan Review (Brisbane, DSDIP 2014). of the chapter. They include initiatives to position Brisbane as a new world city and to strengthen cultural and knowledge linkages between cities and communities in the Asia-Pacific region.
130
5.1.1 Population Growth The population of South East Queensland has grown from 1.2 million in 1976 to 3.3 million in 2015, an average of over 55,000 people per year and a growth of 175 percent over four decades. In 2013, Brisbane City’s estimated resident population was 1.13 million people, living in a land area of 1,367 square kilometres and with a population density of 827 people per square kilometre. Brisbane City has continued to grow steadily based on the infill development of urban renewal areas and apartment towers in the Brisbane CBD. Analysis of recent Australian Bureau of Statistics figures shows that Brisbane City’s share of the region’s population is declining as urban areas such as the Gold Coast, Ipswich and the Sunshine Coast have experienced higher growth rates based on new greenfield urban development. Over the past decade, population growth in South East Queensland has been more variable (ranging from 41,000 to 76,000 per annum) and has slowed relative to two decades ago. However, the latest state government projections show the population growing to 5.5 million by 2041.208
5.2
ECONOMIC ENVIRONMENT
As with population growth, the Greater Brisbane economy has expanded to be worth an estimated USD 170 billion or just under two-thirds of the gross regional product (GRP) of Queensland’s economic output209 (Table 5.1). By 2031, its economy is estimated to be worth over USD 217 billion.210 The state’s economy is driven by the construction and infrastructure sectors. Brisbane is well placed to leverage this to ensure a diversified, sustainable economy and drive future growth. The current resources and energy sector pipeline valued at USD 165 billion211 will see the city benefit from substantial investment in the mining, gas and infrastructure sectors.
131
Table 5.1 Key Economic Facts – Greater Brisbane Brisbane City #
Greater Brisbane ^
Value of the economy (June 2014)
n.a.
USD 170 billion*
Estimated residential population
1,131,191 (2013)
3,300,000 (2015) USD 62,175
GDP per capita (2012) 811,600
1,141,600
Unemployment rate (April 2014)
5.1%
5.9%
Number of businesses (June 2012)
115,472
189,244
Employment (April 2014)
# Refers to the Brisbane City Council local government area. ^ Refers to the Greater Capital City area identified by the Australian Bureau of Statistics, which includes Brisbane City Council, Logan City Council, Redland City Council, Ipswich City Council and Moreton Bay Regional Council. *Source: Brisbane City Council estimate.
5.2.1 Structure and Change in the Economy Over the decade from 2000 to 2010, the structure of the region’s economy has experienced significant change (Table 5.2). In terms of the proportion of gross regional product (GRP) for 2010/11, the largest contributions came from manufacturing (9.4%), financial and insurance services (9.6%), construction (8.1%) and professional, scientific and technical services (9.2%). Over the decade, the largest contributions to GRP came from the services industries (i.e. finance and insurance services, healthcare and social assistance). Transport is also an important sector of the economy as South East Queensland has a large and diverse transport network that reflects the complex nature of travel needs and behaviours of its residents. Structural changes have occurred in the region’s economy over the past decade, namely the significant and continued decline in the manufacturing sector and growth in the service sectors. While the region has not been a major centre for heavy manufacturing, as in the rest of Australia, the structural reforms of the 1980s and 1990s resulted in the offshoring of many industries and subsequent loss of jobs. The region has adjusted to this reasonably well, but the job growth has been in service sectors of the economy, which have not been high value-adding, and have occurred mainly in retail, tourism, health and education services. There has been significant endogenous growth in the GRP of professional, scientific and technical services – up 2.5 percent – from 2000/01 to 2010/11. This sector continues to grow in the fields of bionics, neurological sciences and avionics.
132
Table 5.2 Structure of the Brisbane Region Economy, 2000/01–2010/11 Economic Sectors212
Agriculture, forestry and fishing Mining Manufacturing Electricity, gas, water and waste services Construction Wholesale trade Retail trade Accommodation and food services Transport, postal and warehousing Information media and telecommunications Financial and insurance services Rental, hiring and real estate services Professional, scientific and technical services Administrative and support services Public administration and safety Education and training Healthcare and social assistance Arts and recreation services Other services Ownership of dwellings Gross
Proportion of GRP 2000/01 0.7 0.9 12.7 1.7 6.8 6.9 6.3 2.7 7.9 4.0 8.3 2.5 6.7 2.3 6.4 4.9 6.5 0.9 2.7 8.0 100.00
Proportion of GRP 2010/11
Change
0.3 1.4 9.4 2.3 8.1 6.8 5.5 2.2 7.7 2.5 9.6 2.7 9.2 2.6 6.9 4.3 7.0 0.6 2.0 8.9 100.00
-0.4 0.5 -3.4 0.5 1.3 -0.2 -0.8 -0.5 -0.2 -1.5 1.3 0.2 2.5 0.3 0.5 -0.6 0.5 -0.3 -0.7 1.0
Source: Government of Queensland, Australia, Queensland Regional Database 2013.
5.2.2 Regional Exports and Imports The Port of Brisbane is Australia’s third busiest port and the nation’s fastest growing container port. Brisbane Airport is also the third-largest airport in Australia with over 25 million passengers annually, of which almost 5 million are international passengers. An analysis of exports and imports for Brisbane City has been done by the National Institute for Economic and Industry Research (Figure 5.2). This shows manufacturing contributing over USD 14.25 billion to the city’s exports in 2011, followed by business services (USD 9 billion) and transport (USD 4.75 billion). The tourism and education sectors were estimated at USD 3.9 billion and USD 2.2 billion respectively. The Institute also did projections for the growth of exports by industry sectors for 2031. The largest percentage increases in exports are expected to be in the business services, transport, health, and community sectors, and this is expected to flow on to tourism and advanced business services. No data is available on the destination of exports at the city level or transshipments via the ports of Sydney or Melbourne.
133
Figure 5.2 Export Value By Industry, Brisbane Local Government Area, 2011– 2031
Note: Mining Services are classified under Business Services; Education and Tourism exports generate exports across all industry sectors marked with a *. Source: National Institute for Economic and Industry Research 2009.
Data on the type and origin of regional imports and invisibles related to investment capital from domestic and international sources are not available. The region’s ports and road– rail transport systems have become significant import/export hubs. Although the extent to which the region’s share of imports is consumed locally or re-exported to other parts of the state or other states and internationally is unknown, it is significant, especially the import of food, household consumer items and business and financial services. Machinery for the mining and agriculture sectors and large numbers of automobiles are re-exported from the region. The fact that statistics on regional trade by industry sector are not easily constructed makes it difficult to identify opportunities for developing import substitution and increasing trade linkages between cities. With trade ties between the Greater Brisbane Region and other metropolitan regions growing, but little data available, the opportunities to value-add to existing supply chains is a significant knowledge impediment to the development of the economy. 5.2.3 City/Region Economic Competitiveness Brisbane has not been evaluated by studies conducted by international research organizations like the Economist Intelligence Unit, Brookings and PwC, so it is difficult to evaluate its competitiveness relative to similar cities like Seattle or Vancouver. The City of Brisbane was ranked 3rd among Australian cities in a competitiveness index by the ANZSOG Institute for Governance.213 This study used three primary benchmark indicators, namely, productivity, sustainability and liveability, measured by 20 sub-
134
indicators. In another study measuring sustainability and competitiveness, Brisbane ranked 2nd among Australian cities.214 This study makes an important contribution by injecting sustainability into the urban competitiveness debate, something the Greater Brisbane Region has taken into consideration in developing recent policies on urban development. There is a need for the Greater Brisbane Region to develop a more international understanding of its competitiveness and to benchmark the region against similar metropolitan regions, such as Vancouver or Auckland, with which the city competes for international trade and investment. Developing a better understanding of the competitiveness of the region’s business and trade dynamics, strategic infrastructure and governance, will be critical to developing strategies for building on the competitiveness it already has in sustainability and liveability. 5.2.4 Investment Environment Greater Brisbane offers investors opportunities across various expanding industry and market sectors. These include tourism; clean technologies and renewable energy; infrastructure; construction; and the energy and resources sectors. A number of wellknown domestic and international mining and energy companies are located in Brisbane, with operations in the area as well as globally. Across Brisbane, industrial precincts are emerging as integrated business facilities supporting vertical business integration, with facilities located and designed to integrate multiple forms of transportation (including air, rail, sea and road). The challenge is to develop these alternate models for industrial hubs and to ensure that funding for vital transport infrastructure stays well ahead of expected demand. The Australia Trade Coast is a dynamic trade and industry precinct. Located 6km from the Brisbane CBD, it includes the Port of Brisbane and Brisbane Airport. In 2013, an estimated 124,000 square metres of new development was earmarked for delivery, a 25 percent increase on the previous year. To the city’s west, industry growth was estimated at 99,900 square metres of new development in 2013, while 100,000 square metres was forecast for Brisbane’s southern area.215 One consequence of investment in logistics, transportation depots, fabrication and assembly, storage, and a range of large industrial land uses along and adjacent to major transport routes, is metropolitan restructuring. This presents significant investment opportunities for development and gentrification, including in recently vacated inner-city areas. Renewal opportunities include residential, cultural precincts, retail, showrooms, business support, leisure, and mixed employment centres. The Queensland government has signalled a clear commitment to Brisbane being recognized as a unique and vibrant new world city, in line with Brisbane City Council’s vision. The Queensland government is putting its support behind projects (such as the Queen’s Wharf precinct) that will attract visitors and investment, reconnect the activity of the Brisbane City centre to the river, preserve and celebrate Brisbane’s heritage, and deliver high-quality public spaces. Opportunities exist for integrated development proposals from the private sector within the CBD that incorporate a mix of new uses (for example six-star hotels, retail, restaurant and entertainment zones, theatre and convention facilities, and new open space).216
135
5.2.5 Innovation and Business Support Krimmer classifies Brisbane as an innovation region, due to its high level of creativity, research and development, and entrepreneurship; a business environment that encourages and enables business innovation; a strong base of individuals and firms developing new or improved products, services and systems; and values that support, nurture and celebrate business innovation.217 The city has world-standard innovations and innovators, representing a major strength for the city. Innovation anchors include Australia’s largest city council; Australia’s growth airport, Brisbane Airport; eight research-intensive hospitals; international-standard universities; research and commercialization precincts; and diverse international-standard knowledge banks. Innovation precincts include aviation, the creative industries, eco-sciences, health, information and communications technology (ICT), food sciences, technology parks and mining technology. Support for business investment includes Australia’s low tax burden (tax to GDP ratio), which is the fifth lowest of all 34 OECD economies. In 2010, Australia’s tax revenue as a share of GDP was 25.6 percent, well below the OECD average of 33.8 percent.218 Queensland’s payroll tax rate of 4.75 percent is the lowest of all Australia’s mainland states. Combined with a threshold of USD 1.1 million, this ensures a minimal state tax burden on business. The Queensland government and Brisbane City Council both promote a pro-business economic environment, with investors having a safe, long-term investment climate within a stable and resilient economy that responded well to the global financial crisis. Innovation and knowledge-based industries are proactively supported in Queensland, and Brisbane is attracting large numbers of international migrants. This has resulted in a culturally diverse community: a city of many nations. Of all Queensland’s local government areas, Brisbane has the highest proportion of residents born overseas (28.3%), followed by the Gold Coast (27.9%) and Logan (26%). Brisbane and South East Queensland more broadly is an important service hub with specialized skills in professional services (e.g. ICT and biomedical services). With major energy and gas fields located inland, there are also opportunities to serve industries in the region by providing mining services and leveraging on its mining technology capabilities. The Queensland government has made a significant investment in R&D and the knowledge economy through the Smart State Strategy with over USD 3.6 billion invested since 1998 to support 40 new research institutes and hundreds of research projects. It aims to continue support for innovation and business growth. Three world-class universities, namely, the University of Queensland, Queensland University of Technology and Griffith University, are located in Brisbane and are highly regarded for graduate quality and R&D initiatives. However, a closer look at R&D investment as a percentage of gross state product in 2008 shows that Queensland’s investment (1.59%) lags behind the Australian Capital Territory (4.11%), South Australia (2.38%), New South Wales (2.44%) and Victoria (2.05%).219 Recent data show that business investment accounts for 60 percent of total R&D in Queensland, while expenditure by the Queensland government accounts for 7 percent. If Brisbane is to realize the ambition of becoming a world-class innovative
136
global city, then part of the challenge is to further the R&D agenda through greater and more diversified investment. 5.2.6 Economic Development Planning The Greater Brisbane Region has developed a series of economic development plans over several decades. The Brisbane Economic Development Plan 2012–31 outlines a vision and priorities needed to support the city’s economic development to 2031.220 Key features include strengthening Brisbane’s business and cultural links with the Asia-Pacific region and its integration into the rapidly growing digital economy. The region has, and is continuing to take, significant steps in the current revision of the regional plan in the identification and development of industry clusters, recognizing the importance of these in the creation of new jobs and industries in the region. Industry clusters that are showing significant development and growth prospects in the region are:
Creative arts, including visual arts, movie and television, and music Aviation and aerospace Logistics and freight distribution Food Marine industries Information and telecommunications technology services Neuro- and, bio-technologies, especially genomics.
Brisbane has recently produced a new economic development action plan for the region, called Brisbane 2022, to support its New World City aspirations.221 The plan is focused on building links with the APEC region and includes the following vision: In 2031, Brisbane will be a top ten lifestyle city globally and its high-performing economy will be characterised by deep business and cultural links with the AsiaPacific region.222 The plan recommends focusing on eight specific industry sectors that will have the biggest impact in transitioning Brisbane’s current economic profile to be more ‘globalfacing’. These industry sectors are:223 • • • • • • • •
Knowledge-based and corporate services Accommodation and visitor economy Higher and international education Energy and resources Creative and digital Property development and construction Advanced manufacturing Food and agribusiness
137
5.2.7 Employment South East Queensland is the employment hub for Queensland. In 2012, South East Queensland accounted for 1.6 million jobs or 70 percent of the state’s employment. By 2041, it is estimated that an additional 1 million jobs will be created in South East Queensland.224 Table 5.3 shows recent employment growth and decline in three major industry sectors. The Brisbane CBD is becoming a major centre for professional and technical services for Queensland, and employment opportunities in the services sector is set to rise further with the expansion of services to the mining industry. At the same time, heavy and light manufacturing has declined, which also means fewer employment opportunities for less skilled workers. Based on these trends, there will likely be excess supply at the lower skill levels, and excess demand at the higher levels.225 Employment opportunities exist in the health and community services areas. Other opportunities are in the cultural and creative industries areas in suburbs which are becoming important employment and micro business centres.
Table 5.3 Employment Trends in Greater Brisbane Unemployment rate
4.0% (2008/09)
5.8% (2012/13)
1.8% increase
Healthcare and social assistance
87,336 (2006 census)
112,390 (2011 census)
5.2% per annum
Retail trade
90,585 (2006 census)
90,482 (2011 census)
Manufacturing
85,017 (2006 census)
79,106 (2011 census)
Top three industries by employment
-
0.0%
-1.4% per annum
Source: Queensland Government, The Queensland Plan – Regional Snapshot Brisbane (2013)
By 2031, employment growth is expected to be greatest in the business services sector, including knowledge-intensive technical, professional and consulting services, with high employment growth also in health, community and education services. Hand-in-hand with the growth in knowledge-based jobs is the opportunity for new types of infrastructure (e.g. high-speed broadband) to increase business profitability and performance. Apart from the Brisbane CBD, those areas of South East Queensland expected to benefit from high employment growth include the Australia Trade Coast, Ipswich, Southport, South Brisbane, Maroochydore, Coomera, Caloundra, Bowen Hills, Woolloongabba and Toowoomba.226 All have locational advantages, access to skilled labour, access to key transport routes, access to research and knowledge institutes and proximity to suppliers, competitors and customers.
138
Despite this employment growth throughout the South East Queensland region, there is an increasing distance and mismatch between the location and concentration of employment in Brisbane City and the location of the residential population. This increases commuting distances and traffic congestion, increases transaction costs for businesses, reduces economic productivity, increases the need to build new transport infrastructure, and decreases liveability for South East Queensland residents. This locational mismatch also exists in other metropolitan areas in Australia.227 5.2.8 Strategic Infrastructure and Asset Management Over the past decade, the state government, Brisbane City Council and other local governments have invested heavily in strategic infrastructure in South East Queensland. This investment has been linked to the desired outcomes of the South East Queensland Regional Plan228 and has been critical to the region’s prosperity and future-proofing its water, energy and waste management needs. The region’s strategic infrastructure includes not only its roads and municipal services systems but its education, health, culture and recreation and knowledge facilities. This investment has raised state government debt levels which will limit the capacity of the state to invest in future infrastructure. Much of the investment in strategic infrastructure has been achieved through a wide range of partnerships involving government (at three levels) and the private sector. 5.2.9 Logistics Infrastructure Logistics infrastructure in Greater Brisbane is concentrated around Brisbane Airport and the Port of Brisbane, both located within the Australia Trade Coast (Photo 5.2). Brisbane Airport is the hub of the aviation and aerospace industry in Queensland. As one of Australia’s fastest-growing freight and passenger airports, there is no doubt that it is vital to the long-term economic growth of the state and Australia as a whole. By 2033– 2034, the airport will contribute an estimated USD 13.4 billion to the Australian economy, facilitate around USD7.6 billion in tourism activity, and support more than 88,000 jobs Australia-wide.229 The construction of a new runway and taxiway system at a cost of USD 1.3 billion will strengthen the Greater Brisbane economy and provide jobs and new opportunities for industry and the wider community. Building a new runway is not without environmental challenges, and the public consultation process resulted in the inclusion of new water use reduction strategies, an onsite solar energy plant, and a 285-hectare biodiversity zone within the precinct. The Port of Brisbane, located at the mouth of the Brisbane River, has greatly expanded its area by reclaiming land from Moreton Bay. It is one of the fastest growing multi-cargo ports in Australia and the nation’s third-busiest container port. Annually it services approximately 2,500 ships and handles more than USD 50 billion worth of trade (primarily to and from Asia). Around 95 percent of Queensland’s containers pass through the port, along with almost 100 percent of Australia’s meat exports. Brisbane is the only Australian port with three stevedoring operations that utilize automated container handling equipment. This is a key strength for supporting the logistics supply chain.
139
Photo 5.2 Port of Brisbane, Brisbane Airport and the Australia Trade Coast Area
Credit: Brisbane Marketing.
The challenge for the Port of Brisbane is to continue to grow and develop to meet future demand. With 95 percent of container freight accessing the port being transported by road, a sustainable long-term rail freight transport solution is needed to reduce freightinduced road traffic congestion and quality-of-life impacts. Compared to roads, little has been spent on improving rail network capacity. This does not bode well for the state and local government road systems which in many parts are not built to accommodate large freight vehicles. Added to this are community concerns regarding pollution, noise and quality of life. The Port of Brisbane has a large bank of land that presents trade and development opportunities into the future, without the need to expand into urban areas. A key strength of the Port is its proximity to the Australia Trade Coast and Brisbane Airport, making it a key transport hub both for the state and Australia as a whole. 5.2.10 Transport Infrastructure Transport infrastructure is a key strategic element for the sustainability and prosperity of South East Queensland. Its provision is primarily the responsibility of the state government, but all levels of government are involved and so is the private sector through PPP projects. Funding for asset renewal and maintenance and constructing new road infrastructure presents a considerable challenge in Brisbane. So too does the provision of public transport which is currently more expensive per kilometre than in Sydney or Melbourne, and is some of the most expensive globally. Road traffic congestion is a major problem in South East Queensland; it increases the travel time for residents and the cost of moving freight for businesses and in turn reduces liveability and economic efficiency. Around 90 percent of freight in South East Queensland is carried by road; and the projected growth in the export market and the economy is expected to double the freight task over the next 10–15 years. The Bureau of
140
Transport and Regional Economics has estimated that by 2020 the cost of congestion to the metropolitan Brisbane economy will be USD 3 million per annum.230 Since 2000, the state government has invested strongly in public transport with the development of a world-class busway system in Brisbane and a new light rail line on the Gold Coast. The state government and Brisbane City Council have collaborated on new road and tunnel infrastructure, including the TransApex ring roads to bypass and reduce congestion around the CBD, and the Airport Link tunnel. Generally, these road and tunnel projects have been funded by PPPs with tolls on road users. Both the CLEM7 tunnel (USD 3.2 billion project) and the Airport Link tunnel (USD 4.8 billion) resulted in private sector investors going into receivership. These projects have recently been acquired by Transurban, a toll road operator. South East Queensland has a clear vision for future transport infrastructure developed collaboratively between the state and local governments and expressed in the Connecting SEQ 2031 Plan.231 The transport plan aims to double the mode share of public transport by 2031 by focusing on new rail infrastructure, including a critical new cross-river linkage in the CBD. In practice, the transport plan faces many implementation and funding challenges including: increasing commuting distances; rising traffic congestion; how to give greater priority to freight movements; a risk-averse private sector; and the Australian Commonwealth government’s reluctance to fund public transport. 5.2.11 Flood Management Flood management is a significant issue for the South-East Queensland region. In January 2011, following a major rainfall event, the Brisbane River peaked at 4.46m, flooding more than 22,000 homes and 7,600 businesses across 94 suburbs, leaving 100,000 without power and an economic damage bill estimated at USD 440 million232, and considerably more for the region. In 1974, the region had an equally damaging flood, necessitating the construction of a massive flood retention dam west of the city, Wivenhoe Dam, which now serves as one of the metropolitan region’s major water supply. Even this dam was not enough to protect the city from the 2011 flood. Important lessons were gained in flood management, especially the need for stricter planning of development on flood-prone land. Most useful, however, was the application of social and multi-media in dealing with the emergency and in mobilizing community support for the clean-up.233 In a remarkable achievement, the city was able to self-organize a clean-up and return to normality in less than five days, thanks in part to the use of multi-media and a highly efficient emergency management organization.
5.3
SOCIAL AND ENVIRONMENTAL SUSTAINABILITY
As the state capital and a metropolitan region, Brisbane is not immune from urban challenges234 requiring innovative social and environmental responses. The city’s population is becoming increasingly culturally diverse, as Queensland grows as a global destination of choice for international migration. Direct overseas migrants have become the largest contributors to population growth, based on recent census data. Over the 2006– 2011 period, the number of overseas-born residents living in Brisbane grew by 111,865
141
people, increasing the share of overseas-born residents to 25 percent of the Brisbane population.235 The changing multicultural face of Brisbane is evident in some suburbs, in which more than half the population was born overseas. Along with established areas that are home to Greek, Italian and other European migrants, there are emerging ethnic communities and multicultural hubs with new refugees and asylum seekers from Africa, Afghanistan, Burma, Iraq and Iran – contributing to a new social fabric in the city. The Brisbane City and Queensland government’s Local Area Multicultural Partnership (LAMP) programme integrates the principles and practices of multiculturalism and promotes positive intercultural relations in the region. However, Brisbane is not immune to the challenges of living in a multicultural society, with recent world events and heightened security concerns creating tensions locally in the Brisbane community. These challenges have required all levels of government and the community to act to protect the basic rights and cultural diversity of all people who live in Australia. The city’s population is also ageing and this presents challenges for the provision of appropriate housing, support and healthcare. While older people have different housing needs and aspirations, the majority prefer to ‘age in place’ and this policy is supported by Commonwealth, state and local governments. As part of its commitment to older residents, Brisbane City Council developed the Seniors Strategy 2012–2017 to address the housing needs of the elderly through services, facilities and planning processes.236 5.3.1 Liveability Australian cities rank very highly in the annual global liveability survey conducted by the Economist Intelligence Unit because of their social stability, high-quality health and education services and good urban infrastructure. However, the 2014 liveability survey ranked Brisbane 20th behind Melbourne (1), Adelaide (5), Sydney (7) and Perth (9).237 Reasons for this lower ranking include public transport quality and costs and the availability and cost of housing. Growth in median household incomes suggests that Brisbane’s economic growth has brought with it faster household income growth.238 Between 2006 and 2011, a 25 percent increase in household incomes placed Brisbane in equal second position behind Perth but similar to Sydney and to the average for Australia. This is a significant improvement to a decade ago when Brisbane incomes were below the average for Australia. Despite this increase in incomes, housing affordability is a significant issue in the region. Among the seven developed nations assessed in the 2015 Annual Demographic International Housing Affordability Survey, Australia ranks third last as one of the most unaffordable major markets.239 Many commentators say the market is overvalued. In 2014, Brisbane’s housing price increased by 5.3 percent compared to 12.2 percent for Sydney, 1.2 percent for Perth, and 4.5 percent for Melbourne. In 2014, the nation’s housing market slowed with prices in the capital cities increasing by 6.8 percent, compared to an increase of 9.5 percent in 2013.240
142
Around two-thirds of Brisbane residents live in separate detached dwellings. However, over the past two decades the number of family households has declined. The growth in one-person households is dramatic and by 2029 it is estimated to be more than twice that of the growth in two-parent family households across all Australian states. With declining fertility rates and increasing longevity, the age structure in cities is changing dramatically, reflecting Australia’s ageing population. This presents challenges for the provision of housing more suited to changing household structures. In Brisbane, state and local governments are strong advocates for urban infill, including more medium density, attached housing in inner-city areas, to address housing need. Nevertheless, the purchase cost and a desire for more space and land continue to be important factors for many households. Brisbane’s population is becoming better educated, with 56.8 percent of residents having post-school qualifications (e.g. degrees, certificates or diplomas), an increase of 3.9 percent since the 2006 census.241 This is an opportunity to capitalize on growth sectors for the city and state economic development, as people make educational choices to gain the right skills for existing and future jobs. The challenge will be to develop a skills plan for Brisbane driven by an emphasis on the future of work, with education and training focused on developing the skills needed for the future workforce. Liveability varies between inner and outer areas in Brisbane and other Australian cities. Many outer metropolitan areas suffer from a locational disadvantage, with low socioeconomic status and poor access to services and public transport. People and households in these areas are vulnerable to increases in housing prices, mortgage rates and petrol costs. Providing adequate public transport to these generally low-density areas is difficult and costly. There are also issues about prioritizing new public transport infrastructure in these areas compared to inner-city areas where residential and employment densities are higher and cross city network linkages need to be made.242 5.3.2 Environmental Management Brisbane City is a subtropical river city with many parts of it built on the floodplain of the Brisbane River. The South East Queensland region covers a number of river catchments and is rich in biodiversity and environmental assets, including: the unique marine areas and sand islands of Moreton Bay; the Gondwana World Heritage Rainforests of the Scenic Rim; and the largest urban koala population in Australia. Much of the region’s coastline has been modified to accommodate urban growth and accompanying infrastructure. The Brisbane River empties into the Moreton Bay Marine Park, an area of important environmental significance. Environmental management is the responsibility of state and local governments and involves balancing urban and regional growth with the need to protect unique environmental assets and enhance land management and water quality in catchments. The South East Queensland Natural Resource Management Plan is the key non-statutory environment management plan for the region and it provides measurable targets for the condition and extent of the region’s environment. It is not a traditional natural resource management plan but is designed to guide the plans, strategies and actions of governments, the Healthy Waterways Network, land care and community catchment groups, and individual landowners.
143
The region is vulnerable to climate change and this is a challenge, due to the growing population and its coastal location. The 2007 Intergovernmental Panel on Climate Change identified the region as a ‘hot spot’ for climate change.243 More extreme weather events, such as the 1974 and 2011 floods, and their increasing frequency, highlight the impacts of climate change on unique ecosystems, human settlements and infrastructure. The National Climate Change Adaptation Framework and the Position Paper on Adapting to Climate Change in Australia are the principal initiatives guiding climate change adaptation in Australia. The challenge for Brisbane and the South East Queensland region will be to coordinate and integrate climate change into regional and sectoral plans. In 2009, the state government released a Draft SEQ Climate Change Management Plan but this was never finalized and endorsed. The Brisbane City Council is a key player in environmental sustainability with responsibility for current and future land use but has provided little leadership in relation to climate change policies. Low Choy et al. outline the key challenges for governments to achieve climate change adaption, as follows.244
5.4
Achieving effective horizontal and vertical coordination and integration between planning and other adaptation instruments Including climate change impacts in local and regional statutory and non-statutory plans Balancing mandatory and voluntary adaptation and engagement of the nongovernment sector in the climate adaptation decision-making process Achieving a synergy between planning with adaptation options for the urban landscape to foster the long-term biodiversity conservation and ecosystem services values for the whole region Addressing legal and other barriers to climate change adaptation through statutory and non-statutory planning Prioritizing policy responses to specific climate change impacts at local and regional planning scales.
EFFECTIVENESS OF GOVERNANCE
Australia has three levels of government – the Commonwealth, state/territory and local. Each level holds elections, makes laws and provides public goods and services, and each has various responsibilities affecting urban areas.245 The Commonwealth (or central) government sets the context for urban growth with control of immigration, taxation and the Australian economy, along with funding for infrastructure projects. The state governments are the major providers of community infrastructure and services, including transport, education, health and emergency services and they prepare metropolitan planning strategies. Local governments provide local roads, water, and community services, and prepare local land use plans. Recent neoliberal government policies have seen the private sector become more involved in the provision of infrastructure and urban services.
144
There is no regional or metropolitan level of government in Australia. In many policy areas, all levels of government share responsibilities, such as urban management, transport, environmental management and health. This results in conflict and collaboration and multiple layers of networked governance and presents many challenges and opportunities. Brisbane City Council is the largest local government in Australia by population. Because of its size, it provides a wide range of economic, social, environmental and planning services and, in many ways, rivals the state government. The Council has developed a long-term vision and strategy for the city called Brisbane Vision 2031.246 This is an overarching, aspirational community plan that aims to position Brisbane as Australia’s new world city. Brisbane City Council has adopted policies for inner-city urban renewal, PPPs for roads and tunnels, and local economic development and has witnessed the uneven effects of economic restructuring. More recently, there has been a move to local spatially-based neighbourhood planning programmes to address economic and social issues and engage local communities. Lawson suggests that this shift to a spatial focus is part of a rescaling of urban governance in Australia.247 Following Queensland local government amalgamations in 2008 and the deamalgamation of Noosa Council in 2014, the South East Queensland region now includes 12 local governments (Figure 5.1). Local governments in the region are larger than in other parts of Australia. The region contains five of the ten largest local governments in Australia, namely, Brisbane City; Gold Coast City; Moreton Bay Regional Council; Logan City; and Sunshine Coast Regional Council. Larger local governments mean that more infrastructure and services can be provided for communities and councils can engage more effectively in strategic land use and transport planning processes. Local governments in SEQ are more organized and unified at the regional level than in other metropolitan regions of Australia248 or in many large urban areas globally. Since the 1970s, the region’s local governments have actively collaborated on planning and the provision of services through voluntary arrangements, including the Moreton Regional Organization and the South East Queensland Regional Organisation of Councils. In 2005, they formed the Council of Mayors South East Queensland to collaborate with and lobby the state and Commonwealth governments. These arrangements have enabled local governments in South East Queensland to effectively engage with other levels of government and to present a united approach in many complex policy areas, including transport infrastructure funding priorities and regional planning. In relation to regional planning, it enabled new institutional arrangements to be established at the regional level, namely, the Regional Coordination Committee which became the Regional Planning Committee. 5.4.1 Planning for the South East Queensland Region Because of the large size of Brisbane City, planning at the regional level was slow to develop compared to other Australian metropolitan areas. However, rapid population growth in the 1980s, and the associated urban sprawl, environmental impacts and infrastructure backlogs, led to recognition by the South East Queensland community that regional growth had to be managed. In 1990, state, Commonwealth and local governments agreed to voluntarily collaborate through the SEQ 2001 Project to produce
145
a non-statutory growth management strategy.249 This plan was endorsed by all three levels of government in 1995 as the Regional Framework for Growth Management. The framework provided the context and impetus for the collaborative development of a number of key sectoral strategies for transport, water quality, and nature conservation. In 2003, following a community media campaign about open space and the need to strengthen regional planning, the local governments in South East Queensland agreed to the preparation of a statutory regional plan. This was an ‘historic change of policy for SEQROC [South East Queensland Regional Organisation of Councils]’, which had previously opposed any statutory regional plans which would limit councils’ planning powers.250 State and local governments worked collaboratively through the South East Queensland Regional Coordination Committee and the Office of Urban Management to prepare the South East Queensland Regional Plan 2005–2026 which came into effect in June 2005. The Regional Plan introduced three important growth management policy instruments, namely: the urban footprint; infill dwelling targets; and the South East Queensland Infrastructure Plan and Program (SEQIPP). Urban development was prohibited outside of the urban footprint and this allowed future urban areas in South East Queensland to be identified and sequenced and for the demand for new infrastructure to be managed. The plan aimed to achieve more compact development and local governments were required to amend their planning schemes to achieve specified infill dwelling targets. The SEQIPP was to be prepared annually as part of the state budget and it identified a 10-year regional infrastructure funding programme. SEQIPP was not just about infrastructure for urban growth areas but was a comprehensive programme covering all infrastructure classes such as transport, water, energy, education and health facilities, and economic activity centres. The South East Queensland Regional Plan was reviewed in 2008/09 and the South East Queensland Regional Plan 2009–2031251 came into effect in July 2009 (Figure 5.3). Although it incorporated another five years of population growth, there was no nett change to the area of the Urban Footprint and the broad policy settings of the plan remained the same, including updated infill dwelling targets for local governments. A number of key sectoral strategies have been prepared linked to the South East Queensland Regional Plan including the Connecting SEQ 2031 transport plan; the South East Queensland Water Strategy; the Rural Futures Strategy; the South East Queensland Natural Resource Management Plan; and the draft Regional Climate Change Management Plan.
146
The SEQIPP was prepared annually from 2005 to 2011. However, with a deteriorating budget outlook and following a change of state government in 2012, no further SEQIPPs have been prepared. The loss of this link between state infrastructure budgets and programmes and the South East Queensland Regional Plan has raised old fears for local governments about urban growth occurring without proper infrastructure provision.252
Figure 5.3 Map of South East Queensland
In 2013, a review of the South East Queensland Regional Plan commenced in the context of the state government’s desire to promote economic growth and to reduce the impact of planning and other regulations on development. In December 2013, the State approved a comprehensive, single State Planning Policy which defined state interests and Source: Department of Infrastructure, Local outlined broad policy approaches to these. Government and Planning, Queensland Government One of the implications was that regional (DILGP), ‘SEQ Regional Plan 2009–2031’ (Brisbane: plans could be less comprehensive and DILGP, 2009). focus on specific regional interests and problems. In 2016, the state government began a review of the South East Queensland Regional Plan, with a draft document released for public comment. The new long-term regional plan is expected to be released in late 2017. The focus of governments in the region on growth management and regional planning has facilitated the development and adoption of a broad range of integrated sectoral policies and strategies that go well beyond traditional land use planning and contribute to sustainable urban development. However, there are some notable regional policy gaps in the areas of economic development and climate change adaptation. Gleeson et al. contend that, while Brisbane and the rest of the region offer a positive governance narrative involving a new and widely supported regional spatial and infrastructure framework, weaknesses are evident. These include:253
Brisbane City’s extraordinary institutional scale offering it unusual influence over wider regional development patterns and policy priorities, demonstrated most clearly in transport planning A growing tendency to resort to project-led planning, meaning the increasing dominance of infrastructure schemes over planning schemes A ‘democratic deficit’ or lack of effective community engagement or ‘voice’ at the regional level.
147
Collaborative governance arrangements through the Regional Coordination Committee and Regional Planning Committee have proved very effective and resilient to a changing political and economic context with different levels of government and the community playing leadership roles in support of regional planning at different times.254 However, high-level governance arrangements in South East Queensland are currently in need of revitalization, and collaborative leadership is needed by Brisbane City, the Council of Mayors South East Queensland, and, the state government.
5.5
CHALLENGES TO SUSTAINABLE DEVELOPMENT
Sustainable city development requires coordinated planning and urban management on priorities across a range of sectoral areas, including: fostering economic development and trade and improving the investment environment; identifying and delivering strategic infrastructure; improving social and environmental sustainability; and fostering collaborative and effective governance structures. In all of these areas, Greater Brisbane faces challenges. The Greater Brisbane region economy is over-reliant on the building and construction and the mining and resources sectors which, in turn, depend on continuing rapid urban growth, high levels of government funding for infrastructure programmes, and high international resource prices. Every one of these has fallen in recent years. Efforts to diversify the economy and strengthen the knowledge economy began in the late 1990s through the state government’s support for the Smart State Strategy. Over the past decade, diversification of the economy has been evident through growth in research centres at universities and hospitals in the region and growth in professional, scientific and technical services sector activity, and jobs generally. However, this challenge to diversify and strengthen the knowledge economy is ongoing. Brisbane City Council and other local governments in South East Queensland have recently added their support, through the New World City vision and action plan.255 After extensive research and consultation, eight key industry sectors have been identified which can assist in transitioning Brisbane’s economic profile to be more global and focused on the Asia-Pacific region. Investments and supporting actions by private sector businesses, research and education institutions and governments are now required in these industry sectors. Over the past decade, the state government has invested heavily in strategic infrastructure for roads, public transport, water supply, hospitals and schools in South East Queensland in accordance with the desired outcomes of the South East Queensland Regional Plan. However, the recent downturn in economic activity in Queensland and higher levels of state debt are now limiting the state’s capacity for future infrastructure investment. In this climate of limited investment funds, the challenge is to manage the demand for new infrastructure, to improve the region’s capacity to identify critical infrastructure and to find innovative funding approaches involving all levels of government and the private sector.
148
Traffic congestion is a growing problem throughout South East Queensland. Construction and recent completion of the Trans-Apex tunnels and roads system have reduced some congestion around the Brisbane CBD. However, this will be eroded by the continuing growth in single-occupant car traffic, unless better public transport services and demand management policies are put into place. Congestion affects the movement of freight by road and increases transaction costs for businesses. Priority needs to be given to the movement of freight, by measures such as priority freight lanes and roads, but this will cause conflict with car users. Housing affordability is a major challenge to the social environment and liveability of South East Queensland. Provision of more single bedroom dwellings in medium-density housing, apartment blocks and student accommodation is assisting with this and also responding to the housing needs of the ageing population and the increasing number of international students in South East Queensland. However, many families with children and low-income households can only find suitable and affordable accommodation in the outer parts of the region with poor access to community services and public transport and high levels of automobile dependence. These families are vulnerable to rises in mortgage rates and petrol prices. More jobs, services and public transport infrastructure need to be provided in these areas. The Greater Brisbane Region, with its long and erodible coastline and extensive areas of flood-prone land along the Brisbane River and other waterways, already faces many natural hazards and challenges – which are likely to increase with the future impacts of climate change. Planning for flooding has been addressed by state and local governments after the devastating 2011 Brisbane floods, but broader planning for climate change adaptation remains a major issue and challenge. The multiple effects of climate change on the economic, social and physical fabric of cities have become more apparent since the draft South East Queensland Climate Change Management Plan was prepared in 2009. The Queensland government, the Council of Mayors South East Queensland and Brisbane City Council need to take the lead in planning for climate change adaptation and complete this important planning work. In relation to governance and integrated planning, as already discussed, and discussed again in the next section, Greater Brisbane has a strong record of governments, at different levels and business and community groups, collaborating and working in partnerships. However, high-level governance arrangements in South East Queensland in relation to growth management and regional planning are currently in need of revitalisation and this provides a challenge for collaborative leadership by Brisbane City Council, the Council of Mayors South East Queensland and the state government. Key challenges requiring collaboration across levels of government include: infrastructure planning and funding; planning for an ageing population; freight transport planning; regional economic development; addressing locational disadvantage in outer metropolitan areas; and planning for climate change adaptation.
149
5.6
GOOD PRACTICE PARTNERSHIPS FOR SUSTAINABLE DEVELOPMENT
Brisbane city and the South East Queensland region have attracted international recognition for some of their sustainable development practices. The following section describes several partnership initiatives undertaken in the Greater Brisbane Region which demonstrate examples of sustainable city development good practice. 5.6.1 The South East Queensland Regional Coordination Committee, Collaborative Governance and Integrated Planning The South East Queensland Regional Coordination Committee was a high-level committee involving key state ministers and local government mayors which met regularly (about every three months) between 1994 and 2009.256 At various times, the Commonwealth government and peak business and community sector groups were also represented on the committee. The Regional Coordination Committee, its predecessor, the Regional Planning Advisory Group, and its successor, the Regional Planning Committee, came into existence because of the need for, and agreement of, South East Queensland governments at different levels to work in partnership to manage rapid growth and develop regional policies. But the ways of working together and the nature of the meetings were also important in developing collaboration and trust. Meetings of the Regional Coordination Committee and the South East Queensland Regional Organisation of Councils and their associated committees provided politicians in South East Queensland, officers and community group members with opportunities to share experience and knowledge, and strengthen their commitment to metropolitan planning policies. The open discussion of thorny issues in growth management and the exercise of consensus decision-making in these forums were central to achieving this shared commitment.257 The Regional Coordination Committee facilitated collaboration between state and local governments, while the South East Queensland Regional Organisation of Councils facilitated collaboration between local governments. The South East Queensland Regional Organisation of Councils was responsible for presenting a unified local government view to the Regional Coordination Committee meetings and to the state government. The meetings of the Regional Coordination Committee also provided a platform for state and local politicians to develop and show leadership on regional issues. The experience of the Regional Coordination Committee holds valuable lessons for urban and metropolitan areas that operate under multiple governments with interdependent and overlapping roles. In such areas, high-level ‘metropolitan forums for collaboration’ could be very helpful. Such forums would allow senior politicians from different governments to come together to discuss issues and potential joint approaches and projects. To be successful, the forums would need to incorporate certain features. The forums should be based on open and consensus-based processes. They would have to be chaired by a senior politician. They also need to be provided with sufficient resources, including professional staff and project funding. Links with business and community groups with relevant insights into the specific issue under discussion should also be sought.258
150
Collaborative governance requires leadership and a willingness to share power and act collaboratively rather than unilaterally in relation to joint issues and problems. Brisbane City Council showed leadership in establishing and facilitating the voluntary cooperation of local governments in the region through the South East Queensland Regional Organisation of Councils. The state government showed leadership in relation to growth management by establishing the SEQ 2001 planning project and inviting the South East Queensland Regional Organisation of Councils and local governments to become involved on a voluntary basis. Seed funding from the central government, as occurred in SEQ in relation to water quality management, can also facilitate urban and regional collaboration. In all these cases, the establishment of forums involving relevant governmental and sectoral groups was a critical first step. These forums can contribute to sustainable development by: improving horizontal and vertical coordination and information flows; leading on to joint actions and agreed regional plans; and the establishment of more permanent institutional and statutory arrangements. South East Queensland also provides a good practice example of integrated urban planning. The concept of regional growth management was defined broadly to include environmental, social, economic and physical aspects of sustainable development. Policy development in all these areas was integrated in order to produce the voluntary Regional Framework for Growth Management and later the statutory South East Queensland Regional Plan. The South East Queensland Regional Plan 2009–2031 is a statutory plan under the planning legislation with which local government land use plans need to comply and be consistent. But it is also a policy plan that has been endorsed by state and local governments as the primary regional plan for South East Queensland. It thus provides a framework for other sectoral policy plans, such as those for transport, natural resources, centres, etc., which are integrated and consistent with it in spatial and policy terms. For example, the Connecting SEQ 2031 transport plan builds on the population projections, urban growth areas, economic centres and policy directions identified in the South East Queensland Regional Plan. The Greater Brisbane experience with collaborative governance offers lessons for other cities in the Asia-Pacific region where multiple governments share responsibilities and have interdependent roles in relation to complex issues and urban growth management.
151
5.6.2 Australia Trade Coast At the mouth of the Brisbane River is over 8,000ha of largely floodprone land containing some heavy industries. That land had remained vacant for many years before the relocation of the Port of Brisbane and development of a new Brisbane Airport. The costs and difficulties of providing services, fragmented land ownership, environmental constraints and access issues were major impediments to the area’s development. In 1993, the concept of an inter-modal transportation centre was studied by the Queensland State Premier’s Department. The resulting Gateway Ports Strategic Plan was released in 1994.
Figure 5.4 Australia Trade Coast and its 32 Development Precincts
The plan adopted an innovative approach in economic thinking for the development of the area. Source: Brisbane City Council, ‘Australia Tradecoast Local Plan’ Historically, the focus had (Brisbane: Brisbane City Council, 2013). been to promote its comparative advantage in terms of location, cheap land, access to transportation, low taxes, enterprise zones, etc. The reality was that there was a surplus of land in gateway ports around the Pacific Rim. Most of these ports provided conditions for development just as favourable as Brisbane. In 1999, the Australia Trade Coast was established as a partnership between four of Queensland’s most powerful industry leaders (Queensland government, Brisbane Airport, Port of Brisbane and Brisbane City Council) to drive inward investment and industry growth in the area. The paradigm driving economic development of the Australia Trade Coast is a collaborative advantage. The Australia Trade Coast partners collaborate to reduce factor costs of production (i.e. labour, raw materials, capital, infrastructure, range and quality of services) to make inward investment more attractive. The thrust of the collaboration strategy was to build strategic leadership, and foster technology, innovation and product development, information and marketing intelligence systems and a spirit of civic entrepreneurship. The intent was to get competing parties, business and communities working together to develop new ideas and products for established or emerging markets.
152
The Australia Trade Coast is now home to around 1,500 leading businesses with over 60,000 employees. It contains a wide variety of industries spread over 32 employment precincts (Figure 5.4). Industries located within the precinct include logistics, transport, export and import, aviation and warehousing. Infrastructure projects have been implemented to attract high-technology manufacturing, food and beverages and general manufacturing industries. Australia Trade Coast has become one of the largest and fastest growing trade and industry districts in Australia. The area is forecast to employ more than 110,000 people by 2026.259 Its development potential is likely to increase if the proposal for a new inland rail route from the Port of Brisbane to the Port of Melbourne, a second long-runway for the airport, and a new cross-river rail tunnel goes ahead in the next decade. Australia Trade Coast is a good practice example of a partnership between major government and private sector landowners and transport operators which proceeded because each recognized the advantages provided by collaboration in terms of sharing and reducing transaction costs to business and its importance to attracting investment. Australia Trade Coast and its partners have invested more than USD 1 billion in infrastructure development in the past five years generating around USD 4 billion of private sector investment in the area. 5.6.3 Brisbane Inner-City Urban Renewal (New Farm and Newstead)260 The old port of Brisbane in the Newstead reach of the river covered a 2km stretch of dockland, warehouses and industries that experienced significant decline during the industrial restructuring that took place in Australia during the 1980s. In 1991, Brisbane City Council established an Urban Renewal Task Force to investigate opportunities for urban revitalization.261 The focus of the task force was on the renewal of a 730ha inner north eastern suburban area, including Fortitude Valley, New Farm, Newstead, Teneriffe and Bowen Hills, as a pilot for revitalization of inner-city areas. It was to deliver a master plan, development strategies and procedures for implementation based on practical solutions and viable investments to achieve a population of 30,000 people (up from 12,000) over 20 years. The governance mandate of the Urban Renewal Task Force from Brisbane City Council was to manage the urban renewal programme and act as a broker between the private sector, government and the community in planning, investment and development. The task force had no specific powers or legislation other than using the city council’s planmaking powers to create a Development Control Plan for specific areas. Critical to the success of the project was the leveraging of capital. The Brisbane City Council had secured funding of USD 31 million from the Commonwealth Government’s Building Better Cities Program. Equitable funding was provided by the Queensland state government and the Brisbane City Council for operation of the task force and for infrastructure projects such as the conversion of the old New Farm Powerhouse to an arts and cultural hub (Photo 5.3); the Inner-City Bypass; sewerage at Tenerife; bike paths; street tree planting; and bus facilities. It is difficult to value the extent of the economic benefits generated by this urban renewal initiative, but it is estimated that USD 4 billion in funding for redevelopment projects was provided by the private sector.
153
Photo 5.3 Powerhouse Brisbane – From Power Station to Arts and Cultural Facility
Source: Brisbane Marketing.
The project provides a good example of cooperation between three levels of government in partnership with the private sector and local community. At the time the project was conceived, there was no real focus on specific sustainability initiatives, but the nature of the project involved inner-city revitalization, reuse of heritage buildings and improved public transport services, which are in themselves sustainable development elements. The New Farm–Newstead urban renewal project is a good example of the way Brisbane has been transforming obsolescence in a post-industrial city into opportunity. While this has been done in many other cities, such as Vancouver and Singapore, it is the level of cooperation, scale and the ability to leverage a relatively small amount of public capital that makes this project a good example of best practice sustainable development in the APEC region. The Urban Renewal Task Force was later transformed in 2003 into an organization called Urban Renewal Brisbane and given a widened focus of the whole inner city.262 5.6.4 Healthy Waterways Network In 1998, the Moreton Bay Water Quality Management Strategy was developed and released as part of the SEQ 2001 planning project.263 Developing the strategy required funding from the Commonwealth for new data collection, modelling and analysis and involved research organizations, state agencies, local governments and local community catchment groups working closely together. The subsequent investments in reducing point source pollution under the strategy have proven highly effective. Water utilities and local governments have upgraded wastewater treatment plants, significantly reducing water pollution and the incidence of algal blooms in Moreton Bay. These partnerships and collaborative working arrangements are ongoing and evolving. The Healthy Waterways and Catchments Network is an independent, non-government organization that brings people and organizations together across multiple sectors to manage waterway health in South East Queensland. Member organizations include state and local governments, water utilities, private water industry companies, university
154
research groups and environment and catchment groups. The Healthy Waterways and Catchments Network facilitates careful data collection, the release of an annual Report Card on ecosystem health for all rivers and waterways in SEQ,264 and coordinated planning and rehabilitation actions at local and regional levels. The waterways are an integral part of the region’s lifestyle and economy. With a rapidly growing population and increasingly unpredictable climate, the challenge is to protect the waterways now and for future generations. 5.6.5 Logan Together Community Partnership for Children’s Development265 Logan Together266 is a partnership of local people from the community, non-government organizations, governments and businesses who care about the wellbeing of children in Logan City. Logan City is located south of Brisbane City (Figure 5.1) and has a large low-income and migrant population. The aim of the partnership is to close the gap in healthy development outcomes for children and their families. The partnership targets children from before birth to age eight to ensure they develop the whole-of-life skills and competencies necessary to participate in the workforce after leaving high school. Logan Together is doing this by taking a collective impact approach to drive coordination and cooperation between stakeholders – to enhance skills competencies and promote knowledge development. The collective impact model has its origins in the USA, where it has been used to improve outcomes in areas such as educational attainment.267 To advance its aims, Logan Together established an organization to develop common goals, and develop and implement coordinating mechanisms and shared systems.268 The leadership of Logan Together was drawn from the local community, Griffith University and government and non-government organizations. The group prepared a roadmap to provide direction and operations guidance to the participating partner organizations. A Joint Commissioning Mechanism that involves funders across all levels of government, university and business was also established with the task of aligning resources from funding partners with the delivery of the roadmap.269 Logan has already seen many benefits from this initiative, similar to the US experience. Logan Together is providing a valuable partnership for addressing the development of social capital and early competency-based learning for children in one of the poorest and most disadvantaged areas of the Greater Brisbane Region. The project is a good example of a sustainable development initiative to invest in building long-term social capital to support community and economic development in disadvantaged sectors of urban populations which could be adapted and replicated in other cities of the region. 5.6.6 Asia-Pacific Cities Summit The Asia-Pacific Cities Summit and associated Mayors’ Forum is a conference and networking event initiated by Brisbane City Council in 1996. It has been held biennially since 1999 with the venue alternating between Brisbane and another city in the AsiaPacific region. Initially, the Asia-Pacific Cities Summit involved 34 cities and 128 delegates. It has grown steadily since, and recent summits have involved 150 cities and
155
over 2200 delegates and attracted influential corporate partners such as Microsoft and the Brookings Institute.270 The summit is now recognized as the region’s leading high-level, business and government forum for managing cities and urban development. The Asia-Pacific Cities Summit aims to:271
Create deepened dialogue, shared learning, strategic partnerships and economic opportunities in partnership with business as the keys to strengthening cities’ prosperity. Facilitate the exchange of information and ideas, and create a blueprint for future prosperity and shared solutions for sustainable living in the region’s cities. Support the development of strategic and commercial partnerships between all levels of government, private and public sector agencies and business communities in the region. Provide a platform that delivers long-term economic outcomes for cities and businesses seeking trade and investment opportunities in the Asia-Pacific region and beyond. Explore new models for city development strategies that strengthen the ability of cities to serve their communities, contribute to regional prosperity and improve quality of life.
The APCS provides a dynamic and interactive forum for local government politicians, business people and professional officers in the Asia-Pacific region to collaborate and exchange knowledge, identify common agendas, develop shared solutions and economic opportunities and improve city governance.
5.7
CONCLUSIONS
The Greater Brisbane Region faces challenges but demonstrates many aspects of sustainable urban development, which illustrate leading practice not only in Australia, but the Asia-Pacific region as a whole. Because of the role played by Brisbane City Council, Brisbane is ahead of other Australian state capital cities in many ways in relation to innovation and business support, and its location is ideal to capitalize on Australia’s economic role in the Asia-Pacific region. However, despite its New World City aspirations, Brisbane is still Australia’s third city in terms of population and economic activity and it needs to grow and diversify its economy, especially the knowledge economy. There is significant potential for the expansion of R&D to drive innovation and growth in the Brisbane economy and there are many examples of international investment being leveraged to commercialize innovation with a global reach (e.g. biosciences/genomics, mineralogy, cancer vaccines). A key factor in a strong economic future for Brisbane is capital investment by business and governments across a range of key industry sectors identified in the economic plan,
156
including: knowledge-based services; accommodation and tourism; higher education and research; energy and resources; creative and digital industries; advanced manufacturing; and food and agribusiness. Since 1990, state and local governments in the Greater Brisbane Region have maintained a continuous focus on collaborative planning and urban growth management. This has resulted in the endorsement of various statutory and non-statutory regional plans leading to the statutory South East Queensland Regional Plan 2009–2031. The Regional Plan contains strong policies to manage the future pattern of urban growth including: the definition of the Urban Footprint; infill dwelling targets; and the identification of a network of cities and urban activity centres for services and employment growth. The Regional Plan provides a policy and statutory framework for local land use plans and for sectoral plans for regional transport, water supply, etc. These plans allow infrastructure provision, particularly public transport, to be managed and integrated. The policies also offer lessons for other rapidly growing urban regions which contain multiple cities. The future urban management challenge for Greater Brisbane is to maintain and strengthen the policy focus on compact urban development and residential infill in inner parts of the region where most the region’s present and future employment will occur. At the same time, there is a need to improve employment prospects, services and infrastructure provision to vulnerable families and residents in some outer parts of the region. Another challenge is to face up to the multiple effects of future climate change on large urban areas and for an effective regional plan for climate change adaptation to be put into place. Based on the analysis of sustainable urban development in this chapter and the good practice partnership examples discussed, the aspects of urban planning and management in which Greater Brisbane offers leading practice lessons for other Australian cities, and the Asia-Pacific region as a whole. These can be summarized under the following themes: Collaborative city governance and integrated planning Large cities contain multiple governments that interact spatially and between different levels. Forums need to be created and resourced to allow governments (at political and officer levels) to exchange information, work together and collaborate on citywide planning and management issues. This facilitates integration between their various plans. Higher level governments or large local governments, such as Brisbane City, which generally have more resources, should take the lead in establishing and resourcing these forums. Economic development cannot be left just to business organizations and the private sector. Local governments can play a leading role with business in developing an economic vision for their area and in identifying key industry clusters that build on local competitive strengths. Local governments also need to collaborate with each other to develop a citywide economic vision and action plan.
157
Collaborative partnerships for business advantage in key economic areas In each city, there will be areas and spatial locations that already play a key role in economic development, employment and trade or that have the potential to do so in the future. The Australia Trade Coast is a key economic area in Greater Brisbane. If governments and large private and government corporations involved in the area collaborate to develop a vision and proposals for the area, it can create a positive business and investment environment that allows smaller businesses to flourish and innovate. Identify and fund strategic infrastructure linked to city plans Large infrastructure projects in cities compete with each other for limited government and private sector funding. These could be transport, education or health projects, new telecommunications links or areas of green open space, all of which may be important for sustainable city development. City plans and economic strategies need to be actively used to identify and prioritize strategic infrastructure projects for funding across sectors. Governments to lead urban renewal projects All cities have run-down areas that need, and/or have potential for, urban renewal. Many of these are old industrial and port areas in the inner city. The government can assist in developing a new vision for these areas by creating a planning and institutional framework to facilitate investment by private sector organizations and individuals. Community involvement for environmental and social wellbeing Many environmental and social issues require strong, grassroots community involvement and input to build and implement solutions. In Greater Brisbane, local land care and catchment groups have collaborated with governments and research groups to develop water quality management strategies. Local governments can play a key role in outsourcing and resourcing such community involvement, as in the case of the Logan Together partnership for children’s development. Create forums to share knowledge across the APEC region Brisbane City initiated the Asia-Pacific Cities Summit in 1996 and has promoted and resourced its development. The forum now plays a key role in creating links and sharing knowledge about sustainable city development among APEC economies and cities. APEC or its constituent governments or involved local governments should create other forums in relevant areas to share knowledge and strengthen cultural links. The Greater Brisbane Region has been a leader in developing partnerships for sustainable development in Australia for many years. It is a region known for progressive innovation in urban design, planning and development. It is a leader in integrated development of road, pedestrian, cycle, rail, air, river and ocean shipping transportation systems. It is a leader in waterway systems management and recycling. These achievements in sustainable development have been led by strong political structures, good governance, planning and financial management, and well-established community engagement practices. There is still much the region needs to do to become more sustainable, but the
158
regional and local government planning and collaborative governance processes are directing it along a path towards a more renewable-energy, green design and clean industry future. As a semi-tropical climate metropolitan region, it has much knowledge and experience in sustainable development practices it could share with other cities in the APEC region.
159
6. Jing-Jin-Ji Region, People’s Republic of China Michael Lindfield, Xueyao Duan and Aijun Qiu
6.1
INTRODUCTION
The Beijing–Tianjin–Hebei Region, known as the Jing-Jin-Ji Region (JJJR), is one of the most important political, economic and cultural areas in China. The Chinese government has recognized the need for improved management and development of the region and has made it a priority to integrate all the cities in the Bohai Bay rim and foster its economic development. This economy is China’s third economic growth engine, alongside the Pearl River and Yangtze River Deltas. Jing-Jin-Ji was the heart of the old industrial centres of China and has traditionally been involved in heavy industries and manufacturing. Over recent years, the region has developed significant clusters of newer industries in the automotive, electronics, petrochemical, software and aircraft sectors. Tourism is a major industry for Beijing. However, the region is experiencing many growth management problems, undermining its competitiveness, management, and sustainable development. It has not benefited as much from the more integrated approaches to development that were used in the older-established Pearl River Delta and Yangtze River Delta regions, where the results of the reforms that have taken place in China since Deng Xiaoping have been nothing less than extraordinary. The Jing-Jin-Ji Region covers the municipalities of Beijing and Tianjin and Hebei province (including 11 prefecture cities in Hebei). Beijing and Tianjin are integrated geographically with Hebei province. In 2012, the total population of the Jing-Jin-Ji Region was 107.7 million. The level of urbanization is 58.9 percent, 8.1 percentage points less than the Yangtze Delta and 25 percentage points less than the Pearl Delta. Within the Jing-Jin-Ji Region, the urbanization rate varies widely: Hebei province is at 46.8 percent while the rate for Tianjin is 81.5 percent and Beijing 86.2 percent.272 In April 2015, the regional coordination development plans were approved by the Politburo of the Central Committee of the Communist Party. The plan consolidates the development of the region into a central strategy. This chapter examines the drivers and challenges to the growth and development of the Jing-Jin-Ji Region. It profiles the economic, social and environmental, infrastructure and urban governance factors and challenges, and investigates the existence and development of partnerships that could support a more sustainable approach to urban and regional development in other parts of China. The conclusion suggests ways in which government, business, and communities could collaborate to overcome some of the development problems facing the region, to improve urban growth management and support the sustainable development of cities. 6.1.1 A Brief Overview of the Region The Jing-Jin-Ji Region has been the third-largest economy of the People’s Republic of China (PRC) since the launch of China’s economic reform in 1978. In 2013, the region’s GDP was estimated at CNY 6.2 trillion, representing 10.9 percent of China’s GDP.273 Since
160
the mid-2000s, Tianjin has grown much faster than Beijing and Hebei. The growth rate of Tianjin now exceeds the growth rate for China as a whole (Table 6.1).
Table 6.1 Annual GDP Growth Rate in the Jing-Jin-Ji Region, percent Region
2009
2010
2011
2012
2013
China
9.2
10.4
9.3
7.7
7.7
Beijing Municipality
10.2
10.3
8.1
7.7
7.7
Tianjin Municipality
16.5
17.4
16.4
13.8
12.5
Hebei Province
10
12.2
11.3
9.6
8.2
Source: Statistical Communiqué of the National Bureau of Statistics of China and Beijing, Tianjin, and Hebei Bureau of Statistics.
The largest cities and their dominant industry clusters in the region are: Beijing Municipality (population: 19.6 million): Beijing is the capital of China and one of China’s four municipalities. Its focus is manufacturing and finance. The main industries are wholesale and retail, information technology, computer services and software, and real estate. In addition, there is a vibrant cultural and creative sector, and its high-tech and high-level services industries are growing fast.274 Beijing ranks overall 39th in the Economist Intelligence Unit’s Hot Spots index on the competitiveness of 120 major cities in 2012.275 Tianjin Municipality (population: 12.9 million): Tianjin is an industrial city. Its main industries include metallurgical machinery, information technology, pharmaceuticals, new energy, and materials. In addition, Tianjin has the aviation and aerospace industries.276 The Tianjin Xingang port is the largest port in north China. The Tianjin Binhai New Area is China’s third Special Economic Zone (after Shenzhen and Pudong), established to attract investment by providing a more liberal financial market and tax incentives.277 Tianjin’s overall rating in the Hot Spots index is 75th. Principal cities in Hebei province are: Shijiazhuang (population: 10.16 million): Shijiazhuang is the provincial capital of Hebei province. It is not the geographical centre of Hebei, being far from the municipalities of Beijing and Tianjin. Shijiazhuang is a major chemical industry base and manufacturing centre for the textile and pharmaceuticals industries.278 Baoding (population: 11.19 million): Baoding is the largest city in Hebei province, both in population and area. Baoding, at the centre of Hebei province, was previously the capital of Hebei. Its economy focuses on equipment manufacturing industries, automobiles, new energy, textiles, food, and building materials. 279 Zhuozhou city, a county town under Baoding, acts as a dormitory suburb of Beijing.
161
Tangshan (Population: 7.57 million): Tangshan is a coastal city with a focus on heavy industry. As a centre for the coal mining and steel industries, it is an important part of the northeast China economy. Its port, Caofeidian, has a large iron-ore manufacturing facility and is one of the largest ports in the region. Langfang (population: 4.36 million): Langfang, located between Beijing and Tianjin, is well connected to the regional transport network. It is 40km from the centre of Beijing and 60km from the centre of Tianjin, 70km from the capital airport and Tianjin airport, and 100km from Tianjin Port. Seven expressways and five railroad lines pass through Langfang city.280 The dominant industries are equipment manufacturing, food processing, wood processing, furniture and metal working. Its three major urban areas, Yanjiao (east of Beijing), Guan and Langfang itself, are dormitory suburbs for Beijing. Handan (population: 9.18 million): Handan is an important industrial city in Hebei province, but is at the southern end of the province, far from Beijing and Tianjin. Zhangjiakou (population: 4.35 million): Zhangjiakou is located northwest of Beijing and is a poor, mountainous area. However, Chongli County is being developed for skiing. As a result of Beijing’s successful bid for the 2022 Winter Olympics, more winter sportsrelated industries will be developed in Zhangjiakou. Qinghuangdao (population: 2.99 million) and Chengde (population: 3.47 million): The two are traditional tourism sites, especially for those living in Beijing and Tianjin. 6.1.2 Development Challenges The development of the Jing-Jin-Ji Region faces a number of challenges: Lack of Land for Development: The region is relatively hilly and dry. There is not much flat terrain, compared to the Pearl River Delta and the Yangtze River Delta. Less than 50 percent of the land across the three provinces is flat,281,282 and much of the urban development occurring in the region is on productive land. Over 45 percent of the Beijing plain area is used for construction.283 Rapid Rise in Beijing’s Population and Congestion.284 From 2000 to 2012, around 16.43 million people moved into the Jing-Jin-Ji Region, of which 6.87 million moved to Beijing. The rapid growth in population has resulted, despite substantial investment in urban infrastructure, in significant traffic congestion, air pollution, and stress on water resources (see Table 6.2).
162
Table 6.2 Official Resident Population of the Jing-Jin-Ji Region, 2012 City
Total population (million)
Population in districts under city (million)
Beijing
12.78
12.07
Tianjin
9.96
8.16
Shijiazhuang
9.97
2.47
Tangshan
7.37
3.08
Handan
9.80
1.49
Baoding
11.61
1.08
Zhangjiakou
4.67
0.90
Qinhuangdao
2.90
0.87
Langfang
4.25
0.81
Xingtai
7.37
0.72
Chengde
3.74
0.59
Cangzhou
7.35
0.54
Hengshui
4.42
0.50
Source: Based on data from National Bureau of Statistics, 2012 China City Statistical Yearbook (Beijing: China Statistics Press, 2013).
Lack of Integrated Planning and Coordinated Development: There is no clear industrial orientation and coordination of development in the makeup of the economies of the municipalities of Beijing and Tianjin, and Hebei province. Unlike the Yangtze River Delta, where the urban economic hierarchy has evolved naturally over decades from one hub, i.e. Shanghai, in the Jing-Jin-Ji Region there is no clear strategy for the functional positioning of manufacturing and the ‘division of labour’ among the cities. Unlike the Pearl River Delta, where all cities are governed by Guangdong province, Beijing, Tianjin and Hebei province are at the same provincial administrative level of government, with no supervisory body except the central government, and they lack an effective coordination mechanism to enable them to work together. This is a real challenge for the Jing-Jin-Ji Region, and will require a new regional governance model that is somewhat different to other areas of China. This issue is discussed further in subsequent sections. Inability to Address Inequity in Development: There are high levels of disparity in the region. Significant differences exist in wealth and technological capacity of firms. In 2013, the per capita income of Tianjin was USD 16,323 while Beijing’s was USD 15,275. However, Hebei Province was USD 6,344.285 Beijing and Tianjin foster high-end industry and technological innovation, but Hebei has limited capacity to develop these industries because of the paucity and narrowness of the skills base in the city’s economy and labour force. While these differences could be addressed through harmonizing supply chains and synergies across a range of different industries, currently there is no effective policy in place to do this.
163
6.2
ECONOMIC ENVIRONMENT
Table 6.3 provides key economic indicators for JJJR. There are significant differences in the levels of development between the three provinces that make up the region. 6.2.1 Economic Dynamics Table 6.3 shows that the structures of the economy across the three components of the Jing-Jin-Ji Region are very different. Beijing has already made the transition to a highincome service-based economy, with 77 percent of its economy in the tertiary sector. Almost as wealthy, Tianjin is much more dependent on manufacturing, with services and manufacturing each comprising about half of the economy.
Table 6.3 Key Economic Facts – Jing-Jin-Ji Region, 2013 Beijing
Tianjin
Hebei
Land area (km2)
16,801
11,917
202,700
Total population (thousands)
21,150
14,130
73,326
Total urban population (thousands)
18,251
8,500
35,286
Unemployment rate
1.2%
3.6%
3.7%
GDP (million USD)
312,010
229,283
394,696
Primary industry (million USD)
2,496
2,981
49,732
Secondary industry (million USD)
69,578
116,017
194,585
Tertiary industry (million USD)
239,935
110,285
150,379
GDP per capita (USD)
16,419
15,216
6,271
Total exports (million USD)
63,250
49,030
30,900
Total imports (million USD)
365,860
79,500
23,900
Foreign direct investment (million USD)
8,520
16,830
6,447
Labour force (thousands
Sources: Authors using Data from Beijing, Tianjin and Hebei Statistical Yearbooks 2014; United Nations Conference on Trade and Development (UNCTAD) Inward FDI Performance, 2014.
Hebei province, with some 13 percent of its output still in agriculture, 37 percent in the service sector and about 55 percent in manufacturing, shows yet again another economic structure. Growth rates for Hebei province and Tianjin have been above average for China at 8.2 percent and 12.5 percent respectively, with Beijing’s growth at China’s average of
164
7.7 percent. However, the shutdown of polluting industries, which began with the measures taken for the Beijing Olympic Games, and which have continued and broadened, has impacted Hebei province’s growth. Its growth rate in 2014 dropped, in an initial estimate, to 6.5 percent.286 6.2.2 Key Industry Growth Sectors Beijing has the advantage of a developed service industry. In 2013, the proportion of the economy represented by the service industry in the GDP was 76.9 percent, which was the highest among all provincial governments. For example, the service industry in Zhongguancun Science Park, called the ‘Chinese Silicon Valley’, accounted for more than 70 percent of the value of its total industrial output. Annual revenue for Zhongguancun biological and health industry reached CNY 140 billion (USD 22.4 billion) in 2013; its profit rate has ranked first in the PRC for nine years consecutively.287 Beijing ranked 18th among a group of 30 leading cities worldwide in PricewaterhouseCooper’s 2014 Cities of Opportunity study, which assesses what the cities need to do to remain vibrant urban centres in the global economy. 288 Beijing performed particularly well on ‘economic clout’, coming in second by only a tiny difference to the leader, London. It also ranked second on the ‘city gateway’ indicator, which gives it the lead in Asia and most other continents.
Table 6.4 Key Industrial Sectors in the Jing-Jin-Ji Region, 2014 Industrial sector
Gross industrial output (billion CNY) Beijing
Tianjin
Hebei Province
Agriculture
421.78
412.36
5,832.94
Construction
7,407.09
3,670.53
5,203.92
Retail
6,585.6
n.a.
n.a.
Tourism
354.4
n.a.
n.a.
Industry
396,270.16
125,324.24
99,531.34
Of which dominant industry focus:
Integrated circuits
Mobile phones integrated circuits
374,000 (94%)
and
Metal and steel products 58,739 (59%)
106,336 (85%) Note: Data refer to enterprises with annual business revenue over CNY 20 million. Sources: Authors using data from Relevant Statistical Yearbooks 2014
Outside Beijing, industry in the Jing-Jin-Ji Region (Table 6.4) is characterized by the predominance of heavy industry – such as electricity generation, petrochemicals, steel and ship making – which accounts for over 80 percent of industrial output in 2010. Tianjin
165
had an 83.6 percent ratio of heavy industry to GDP in 2010. Although Hebei province lags behind in the sophistication of its economy, its total output is significant; 40 percent more than the sum of Beijing and Tianjin. In 2010, the value-added of industry in Tianjin was only 46 percent that of Hebei.289 The effective use of China’s industrial-estate incentives policy, with tax and other incentives coupled with high-quality infrastructure, has proved successful in attracting both local and international investment. Beijing has 19 major development zones, Tianjin has 4 major zones and 22 city level zones, and Hebei province has 5 major development zones. Major development zones with sophisticated infrastructure are typically over 5 square kilometres but may be bigger than 200 square kilometres. As development has proceeded in Beijing and Tianjin, the investment promotion activities have evolved, to foster higher value-added industries as manufacturing costs and sophistication increased. For example, China’s first coordinated and unified clearance system has been set up to simplify customs procedures and reduce trade costs. In September 2014, the Jing-Jin-Ji Region integrated customs clearance was started in Shijiazhuang.290 Through market feedback and administrative responses, the costs of doing business in the region have always been reasonably well calibrated to world markets. While substantial initial infrastructure spending was necessary, cost recovery for the services, through both user charges and other taxes, was sufficient to provide good and steadily improving infrastructure in major, well-located zones. However, city-level industrial estates have often been established without due analysis and have not performed as well, in terms of supporting export development and in terms of efficiency of operation. A more coordinated approach to planning and developing such zones is needed, especially in view of the requirements of regional integration.291 In respect of other forms of urban development, the urban areas of the Jing-Jin-Ji Region have been the recipients of high levels of public investment, for example, Beijing’s metro system is one of the largest in the world. Significant challenges remain for the region in the area of human capital. Industries face rising cost of labour. People in the capital will not work for the same wage as in less developed provinces. Traditionally low wage jobs have been taken by migrants, but its continuing ability to attract migrant labour in the face of increased job opportunities in the ‘sending’ provinces is in question. This is because of the impact of strong domestic policies promoting development in the west of China. In summary, given that Hebei province has a different economic structure, future development could take advantage of a potentially highly synergistic group of subregional economies – but human capital needs developing across the Jing-Jin-Ji Region. The current overall outcome for the cities in the international context is indicated by the Economist Intelligence Unit’s Hot Spots index. Beijing and Tianjin rank 10th and 1st, respectively, in the ‘economic strength’ category; and 56th and 74th in the ‘human capital’ category. No city in Hebei province was rated. 6.2.3 Trade Disaggregated data of origins and destinations for imports and exports are not available, but the general directions of trade can be discerned. Beijing’s major exports are destined
166
mainly for Hong Kong, China for re-export. Tianjin’s exports are more oriented to direct exports, with the major destinations of the USA, the European Union (EU), Japan and Korea accounting for 53.8 percent of the total exports. Hebei province’s major exports are to the USA, Australia, Japan, Korea and Chinese Taipei, mainly reflecting steel exports, but also electronics. Beijing’s principal import trading partners are Saudi Arabia, reflecting oil imports, and the USA. Because it is a centre for internal re-export, Beijing’s imports far exceed its exports. Tianjin’s imports are more in balance with its exports and reflect the inputs needed for its extensive high-tech manufacturing sector, being from the EU, the USA and Japan. Hebei’s imports are mainly from Australia, Brazil, the USA, Germany and India, the first two mainly reflecting raw material inputs to the steel industry.292 6.2.2 City/Region Economic Competitiveness The results of existing infrastructure policies are seen in the ‘physical capital’ category of the Economist Intelligence Unit’s Hot Spots index. Beijing ranks 55th, and Tianjin 68th, despite significant investment in transport infrastructure; these positions reflect the lower levels of services provided by the components of infrastructure other than roads and freight. The financial sector is a strength of the Jing-Jin-Ji Region. The largest domestic banks and insurance companies and many international financial institutions are headquartered in Beijing. Financing the required strategic infrastructure is a challenge for the region, particularly in Hebei province. While the use of land conversion to finance infrastructure has been very successful, the long-term viability of this strategy is very questionable, particularly in the context of the need to fund increasing levels of services for native-born and migrant populations. The results of existing policies are shown in the ranking of Beijing and Tianjin in the ‘financial maturity’ category of the Economist Intelligence Unit’s Hot Spots index. Beijing ranks 10th along with 15 other world cities. Tianjin ranks 61st along with 22 other world cities. The lack of sophistication of financial support services to companies outside Beijing is a factor holding back the development of the Jing-Jin-Ji Region.
6.3
INNOVATION, CREATIVITY AND BUSINESS ENTREPRENEURSHIP
After the Beijing Olympic Games in 2008, Beijing has become more open and global, a process which is expected to continue with Beijing’s successful bid for the 2022 Winter Olympics. In 2012, China Beijing International Fair for Trade in Services (CIFTIS) was established as the first comprehensive platform for facilitating global trade in services. CIFTIS covers the 12 sectors of trade in services defined by the WTO, namely, business, communication, construction and related engineering, distribution, educational, environmental, financial, health and social, tourism and travel-related, recreational, cultural and sports, transport and other services.293
167
In 2014, Beijing came in 8th out of the 84 cities worldwide assessed by the Global Cities Index, breaking into the top 10 for the first time. The index measures cities on how globally engaged they are across the dimensions of business activity, human capital, information exchange, cultural experience and political engagement. Beijing’s performance on the index was due to an expansion in the number of Fortune 500 companies, international schools, broadband subscribers, and museums.294 Tianjin has actively promoted innovation policy. Summer Davos, held in Tianjin since 2008, is a prominent vehicle for bringing internationally respected thinkers to the region, and it promotes Tianjin to the world. Up to 2014, more than 150 international Fortune 500 companies have invested in Tianjin, with USD 10.8 billion of actual FDI and USD 12.3 billion FDI on contract.295 The Tianjin Binhai New Area is developing into a significant ‘economic growth pole’. As a significant strategic precinct and comprehensive reform pilot zone for the PRC, it is seen as a gateway to northern China. It is envisaged as an advanced and modern manufacturing and R&D transformation centre, a northern international shipping hub and an international logistics nexus, as well as a liveable and ecologically sound city. The Tianjin Binhai New Area contains seven major industry function zones and one comprehensive trade port. Ranked fourth in the world, the port includes Tianjin Port Free Trade Zone, Tianjin Harbour Economic Area, Tianjin Binhai High-tech Industrial Development Zone, Tianjin Economic-Technological Development Area, Dongjiang Free Trade Port Zone, Sino-Singapore Tianjin Eco-City, the Central Business and Commercial District, and Tianjin Port. The cargo handling capacity of Tianjin Port reached 477 million tons in 2012. The same year, the gross output value of the Tianjin Binhai New Area reached CNY 720.517 billion (USD 120 billion), while GDP per capita was about CNY 300,000 (USD 50,000).296 The first high-tech park in China, the Zhongguancun National Demonstration Zone, is located in Beijing. Zhongguancun has the most intensive aggregation of scientific, education and talent resource in China. It is home to almost 40 colleges and universities, including Peking University and Tsinghua University. Also located there are more than 200 scientific institutions, including the Chinese Academy of Sciences and the Chinese Academy of Engineering. There are also 67 state-level laboratories, 27 engineering research centres, 28 engineering and technological research centres, 24 university science and technology and 29 overseas student pioneer parks.297 Venture capital investment in Zhongguancun account for approximately a third of the economy’s total every year.298 R&D has been given substantial emphasis in Beijing. As the technology innovation centre for the PRC, Beijing has strongly supported new technology. In 2013, Beijing’s total expenditure on R&D was CNY 120.07 billion (USD 19.3 billion), equal to 6.16 percent of its GDP. In comparison, R&D expenditure in Hebei province in 2013 was only CNY 29 billion (USD 19.3 billion), or 1 percent of its GDP.299 The results of existing policies are reflected in the ‘global appeal’ category of the Economist Intelligence Unit’s Hot Spots index. Beijing ranks 5th despite its active promotion efforts. Tianjin ranks 115th. While Beijing performs well, the lack of support from the remainder of the Jing-Jin-Ji Region is a challenge.
168
6.3.1 Regional Economic Development Planning In March 2011, Jing-Jin-Ji Region integration was included in the PRC’s 12th Five Year Plan in the form of plans for a Capital Economic Circle. Main functional area planning was undertaken for the ‘Bohai Ring’ region (Beijing–Tianjin, and Hebei, Liaoning and Shandong provinces). The State Council approved the Hebei Coastal Areas Development Planning in October 2011. Although some policies aimed at an integrated approach to the development of the region were announced, not much attention was given by Beijing to developing a plan, until intense smog occurred in eastern China in 2013. In February 2014, President Xi called for the integrated and coordinated planning and development of the region around Beijing. The National Development and Reform Commission with relevant ministries, municipalities and provinces prepared the Beijing–Tianjin–Hebei Coordinated Development Plan, which was approved by the central government in April 2015. It was later included in the China development strategy. Once this plan is published, it will become part of the development strategy for the PRC.300 The following analyses the economic underpinnings of the proposed development.
6.4
STRATEGIC INFRASTRUCTURE
6.4.1 Strategic Infrastructure Assets Jing-Jin-Ji Region has an extensive network of expressways and a high-speed rail network that connects the municipalities of Beijing and Tianjin and the cities in Hebei province with other regions. Jing-Jin-Ji Region also has two international airports, Beijing and Tianjin, with a second international airport south of Beijing under construction. These transportation networks are shown in Figure 6.1.
169
Figure 6.1 Main Transportation Infrastructure in Jing-Jin-Ji Region
Source: Li Defeng, China Centre for Urban Development, 2014.
The main international airport for the region is in Beijing, but international flights also operate from a number of city airports. Tianjin is China’s fourth largest seaport; the new facilities in the Binhai District at Tanggu will add substantial capacity to the region’s ports. Other ports in the region, Tangshan, Caofeidian, Jingtang, Huanghua, Qinhuangdao and Dongying, are also being upgraded. In July 2014, construction commenced on the southern section of a dedicated cargo express train line. The line stretches 1,181km with 30 stations.301 The whole circle will
170
cover around 140 counties in Jing-Jin-Ji Region, and some counties and cities in the provinces of Shandong and Shanxi.302 Other initiatives include:
New high-speed rail links to Tianjin and Qinhuangdao (see Figure 6.2). A high-speed railway connecting Tianjin municipality with Qinhuangdao, a port city in Hebei province. Trial operations have been commenced since the end of 2014.
The South-to-North Water Diversion Project’s central route is expected to transfer fresh water from the Han River (a tributary of the Yangtze River) to Beijing (about 1.24 billion cubic metres annually) and to Tianjin (about 1.02 billion cubic metres annually).303 Figure 6.2 High-Speed Railway Network in Jing-Jin-Ji Region
Source: Translated by China Centre for Urban Development, 2014.
While the ambitious infrastructure spending has resulted in effective logistics infrastructure, urban infrastructure remains a challenge. Water, wastewater and solid waste services have lagged behind. Education and health services also are failing to meet the expectations of citizens. For the migrant population, services are even less accessible. Information and communications infrastructure, overall, is good within the major cities and industrial estates, but is less established in the rural areas of Hebei province.
171
6.4.2 Future Infrastructure Needs The focus of future infrastructure investment will be on building a highly efficient transportation network that fully connects Beijing, Tianjin and the cities in Hebei province – to jumpstart regional economic integration. The 2020 Jing-Jin-Ji Region transport network target is expected to be met, including 9,500km of heavy railways and 9,000km of expressways, and shorter travelling times between major cities in the region (within an hour by train and three hours by car). According to the Outline of Beijing Traffic Development (2004–2030), Beijing is committed to building a 940km outer ring road with 12 lanes to boost the linkage between adjoining areas. Approximately 50 percent of the construction has been finished, with 490km yet to be built. Tianjin also has invested heavily in improving its transport infrastructure with the Binhai, Jingtai, Jingqin, Tanglang Phase 1, Tangcheng Phase 2 and Jishan expressways providing the backbones of three corridors between Beijing, Tianjin and Shijiazhuang. Hebei province will contribute to building Beijing’s outer ring road, since more than 90 percent (850km out of 940km) of this ring road is within Hebei Province, linking the Jingzhang, Jingshen, Jinghu, Jingtai, Daguang and Jingzhu expressways.304 Planned infrastructure projects feature a continued heavy emphasis on expressways and on high-profile transport infrastructure, specifically high-speed and freight rail (see Figure 6.2). While those projects are important, other aspects of strategic infrastructure, such as higher education, better health services, and a healthier environment, also need to be emphasized. It is these investments that will build the base for the higher value-added, internationally competitive services needed to further increase the GDP per capita and quality of life of the Jing-Jin-Ji Region’s citizens. Despite progress, initiatives to date have not attracted significant new investment and have not, as yet, significantly improved quality of life in the Jing-Jin-Ji Region. 6.4.3 Infrastructure Partnerships All three entities within the region, Beijing, Tianjin and Hebei province, have announced plans to implement public–private partnership (PPP) schemes for the provision of infrastructure in the region. Hebei province has explicitly stated that its PPPs are in support of the further integration of the region.305 The main PPP modalities for key sectors are:
Railways. These are highly subsidized, but effective in minimizing car traffic. Freight rail is very important for reducing truck traffic, but is also highly subsidized. Opportunities are mainly through availability payment – payment for provision – schemes. Metro extensions. Property-based value capture (a mechanism that allows government to capture some of the increase in land value generated through infrastructure investments) based on the Hong Kong, China model is both possible and intended. Water supply. This is dependent on cost recovery tariffs or availability payments from the local governments.
172
Health. Provision of health services by PPPs through availability payments is both feasible and equitable. Fully cost-recovering PPPs in the sector will serve only the higher income groups. Education. Availability payments for schools are now routine, but performance based contracts for teaching may also be possible.
For many of these PPP modes, a sustainable revenue base is essential. As many infrastructure projects are not able to cover capital and operation and maintenance (O&M) costs from user charges, a stable subsidy stream, or availability payment, from local governments would be necessary. The key to such revenue streams are land-based revenues, from property tax in the case of availability payments, and from development/land taxes for public transport. Structuring such projects to ensure that the community does not lose is important, but it is not well understood by Jing-Jin-Ji Region governments. Current mechanisms, which capture part of the land value increment from land conversion to fund infrastructure provision, are not financially sustainable, and should be avoided as a source of funding – even counterpart funding. 6.4.4 Operation and Maintenance of Infrastructure A lack of asset management systems and the ease of justifying and financing capital investments have militated against effective O&M. In too many cases, old assets have been rebuilt, a practice that is environmentally and financially inefficient. Better asset management and more rigorous project appraisal are required. Given the rebalancing of growth in China, and a move away from an automatic recourse to new build, continuing growth of the Pearl River Delta will increase the stress on infrastructure. Cities in the Jing-Jin-Ji Region need to increase their resilience to withstand events occurring both inside and outside of the region as a result of natural or technological hazards, human error or equipment failure. The Jing-Jin-Ji Region’s cities need to future-proof against disruption to infrastructure supply and network systems, particularly in respect of the region’s vulnerability to typhoons. Infrastructure failure can be significant and costly; and requires a series of actions to improve the operation, maintenance and replacement of urban utility services. As a risk management strategy, the utility service agencies need to undertake comprehensive asset management planning to reduce the possibility of future failure and ensure that services can be re-established quickly if failure does occur.
6.5
SOCIAL AND ENVIRONMENTAL SUSTAINABILITY
6.5.1 Liveability and Competitiveness Beijing and Tianjin municipalities are wealthy in terms of GDP per capita, but this wealth is not reflected in the quality of life of its residents. There are major issues with water and air quality. Heavy traffic congestion and poor air quality in the long term may deter highlevel professionals from coming to these areas or even encourage them to leave. Foreign businesses are already making choices about locations in Beijing on the basis of air
173
quality issues.306 Eventually, Jing-Jin-Ji Region may fail to attract the highest level of international and domestic human capital, which will affect its competitiveness. In Hebei province, the economies of most cities rely on heavy industries, which are highly polluting. Further, in the run-up to the 2008 Beijing Olympic Games, a large number of heavy manufacturing factories were relocated to Hebei province to improve air quality in Beijing. Similar arrangements may be necessary again for the 2022 Winter Olympics, which may place further stress on the province. In addition, solid waste treatment in urban areas is inadequate, and the ecology of the region is deteriorating because of soil erosion and degradation from sand storms. Although Beijing has the highest concentration of China’s elite universities, hospitals, and other specialist services, the challenge lies in providing migrants with access to public services. The hukou system, the household registration system which restricts the movement of people and effectively locks rural dwellers out of the modern economy, is the main obstacle to migrants gaining access to public schools, public health services and some goods, such as automobiles. Housing affordability is also of significant concern and is a major challenge for Beijing in its quest to attract high value-added people. According to a study by E-House China R&D Institute, the ratio of median house price to median household income in Beijing is 14.6 in 2014 – which internationally is a very high level.307 There is an imbalance of social development, infrastructure and access to public services in the Jing-Jin-Ji Region. Around Beijing and Tianjin, and in 24 poor counties, 2 million people live under the poverty line. In 2010, per capita fiscal expenditure in Beijing district was CNY 18,892; 3.34 times higher than for Hebei province. The best universities and hospitals are concentrated in Beijing. Of the top 50 Chinese universities, 9 are in Beijing, and 5 are in Tianjin. Based on 2011 data, among the 1,399 third-degree hospitals (highest degree) in China, 51 are in Beijing, which is equal to 24 percent of those in the whole of north China (Huáběi in Chinese, referring to Huabei Plain, consisting of Beijing municipality, Tianjin municipality, Hebei province, Shanxi province and the Inner Mongolia Autonomous Region).308 The results of existing social policies are shown in the ‘social and cultural character’ category of the Economist Intelligence Unit’s Hot Spots index. Beijing and Tianjin rank 71st and 111th respectively. While Beijing’s performance is better than Tianjin’s, it is not outstanding; and it is below that of other capital cities with which it must compete. The results of existing environmental policies are shown by outcomes in the ‘environmental and natural hazards’ category of the Hot Spots index. Beijing ranks 85th (with eight other cities) while Tianjin ranks 108th, reflecting the poor overall situation in the Jing-Jin-Ji Region. These outcomes demonstrate an urgent need for the municipalities of Beijing and Tianjin and the province of Hebei to work cooperatively and effectively on social and environmental challenges. They will need to make adjustments to the region’s industrial structure and functional orientation, strengthen their regional environmental management capacity and bolster the scientific and technological underpinnings of growth. Incentive mechanisms to foster resource efficiency and ecological conservation; better mechanisms
174
to promote energy saving and emission reduction; and effective coordination are essential to achieving green and efficient development. 6.5.2 Pollution and Development The Jing-Jin-Ji Region urgently needs to address air pollution. It is lagging far behind the Pearl River Delta and Yangtze River Delta in air quality, with 69 percent of days in 2013 failing to meet China’s air quality standards. An analysis of air pollution patterns in Beijing, Tianjin and Hebei province show some variations in the levels and sources of pollution. In terms of coal burning, for example, the situation has improved in Beijing and stabilized in Tianjin. 309 In Hebei province, however, coal burning still accounts for as much as 80 per cent of the regional consumption. In 2012, motor vehicle emissions were the main source of air pollution in Beijing. For Tianjin, it was sulphur dioxides from coal burning; and in Hebei province, industrial manufacturing proved to be the major source of air pollutants. Nevertheless, given the geographical proximity of Beijing, Tianjin and Hebei province, a joint prevention and control mechanism is essential. The central government has already reiterated the importance of an integrated, regional approach to preventing and controlling air pollution and to infrastructure construction in the Jing-Jin-Ji Circle.310 Central to resolving the air pollution problems in the region is eliminating overcapacity in polluting industries and encouraging those industries to upgrade their equipment. In this regard, Hebei province is the key.311 The Hebei Environmental Protection Bureau has called for the province to reduce the production capacity of several industries: iron and steel (60 million tons), cement (61 million tons) and coal (40 million tons). It has also suggested that heavy pollutors should be provided with support to either transform production modes or relocate. 312 However, there are likely to be costly trade-offs. In 2012, Hebei province was 6th in China in terms of GDP, but this was achieved on the back of strong growth in the heavy chemical industry sector. Given the importance of heavy industry to the province’s economy, production cuts are likely to have a significant impact on GDP growth, fiscal revenue and employment.313 Also, there are limited incentives for implementing policies that will disadvantage established interests. Traditionally, non-governmental organizations (NGOs) have been the strongest advocates for such measures. But while there has been an increase in environmental NGOs operating in Beijing, their ability to make a real impact remains a question mark. It would not be easy to replicate the achievements of Friends of Nature, Green Earth Volunteers and Global Village of Beijing, the three most influential environmental NGOs in Beijing.314 The international environmental organizations operating in Beijing face significant challenges in collaborating and negotiating with the local government, partly due to cultural differences.
175
6.5.3 Poverty and Inequality The literature on poverty in the region clearly establishes a ‘poverty belt’ around Beijing and Tianjin, in stark contrast with the areas surrounding the Pearl River Delta and Yangtze regions. Further, the gap between this belt and the urban centres of the region has been growing. The combination of poor, water-starved farming land providing only a meagre living from agriculture and the hokku system, which locks rural dwellers out of the modern economy, has been disastrous for the rural poor. Administrative integration per se will not address this issue. The inhabitants of the ‘poverty belt’ also lack the skills, health and access needed to integrate into a modern economy. Much more proactive means will be needed to reduce and then remove the poverty belt.315
6.6
EFFECTIVENESS OF URBAN GOVERNANCE
6.6.1 Regional Vision The vision for the Jing-Jin-Ji Region is to link 130 million people across Beijing, Tianjin and Hebei province into a single megalopolis.316 The Jing-Jin-Ji Region is held out as the model for China’s future urbanization. To realise this vision, it is fundamental to align policies and conflict interests, especially in relation to urban planning, industrial production, state-owned and private companies, and environmental protection. The Jing-Jin-Ji Region plan has initiated for the three northern areas to be integrated into one economic realm, similar to the Yangtze River and Pearl River Deltas. To achieve parity with the two deltas, the JJJ region needs to further develop private enterprise, enhance the cohesiveness of its industrial base, and further open to the outside world. In 2012, exports accounted for 15 percent of its GDP, compared to 60 percent in the Yangtze River Delta and 63 percent in the Pearl River Delta. The new metropolis would require an investment of CNY 42 trillion (USD 68 billion) over the next 20 years. This large region has great potential for economic development but so far has not achieved that potential. The industrial base of the Pearl River Delta took shape in the 1980s after China’s first moves to open up to the world, and consequently Shenzhen and Zhuhai have been turned into successful Special Economic Zones (SEZ). After a decade, , this opening up process was further enhanced, focusing the industrialization of the Yangtze River Delta, with Shanghai’s Pudong area promoted as the financial hub of the nation. The third generation of reform has shifted its policy focus to the underdeveloped areas of the mainland, including to address income disparity with the ‘Go West’ and ‘Develop Central China’ campaigns. These policies have fostered development in inland regions but failed to address the structural problems in the regional economy, neither to make growth sustainable. In particular, the services sector has remained less developed. The industrial base of the Pearl River Delta took shape in the 1980s after China’s first moves to open up to the world, and consequently Shenzhen and Zhuhai have been turned into successful Special Economic Zones (SEZ). After a decade, this opening up process was further enhanced, focusing the industrialization of the Yangtze River Delta, with
176
Shanghai’s Pudong area promoted as the financial hub of the nation. The third generation of reform has shifted its policy focus to the underdeveloped areas of the mainland, including to address income disparity with the ‘Go West’ and ‘Develop Central China’ campaigns. These policies have fostered development in inland regions but failed to address the structural problems in the regional economy, neither to make growth sustainable. In particular, the services sector has remained less developed. The establishment of the Special Economic Zones (SEZ) opened China’s market to foreign manufacturers, which turned the two Deltas into ‘the world’s factory’. The experiments in Shanghai Pudong helped to prepare China for the entry into the WTP. The intent now is that the deep-seated structural problems in the Chinese economy can be addressed through a new round of reforms that will be piloted in the Jing-Jin-Ji Region.317 President Xi heads the ‘leading group’ for overall reform and has initiated for integrated and coordinated development among the three regions, ensuring that their actions complement one another in strengthening trilateral cooperation, in order to deliver tangible results within an integrated and coordinated approach to sustainable development. The President reportedly meets each involved minister in the State Council for a weekly briefing on progress. Analysts, however, have warned that, compared with reforms introduced in the Pearl River Delta and the Yangtze River Delta, the new JJJR plan could potentially meet resistance. The three components of the Jing-Jin-Ji Region have benefits in its unique political status. As China’s capital, Beijing accommodates the headquarters of all major party, governmental and military bodies. It is also the home to China’s leading academic, cultural, sports and other social institutions, including the mainland’s elite universities, hospitals and performance troupes. Along with Shanghai and Chongqing, Beijing and Tianjin are classed as metropolises that are directly under the central government by Chinese governmental hierarchy, each headed by a Politburo member, giving them a higher status than a province. Bridging the administrative divides among the three regions will require effective coordination and strong leadership. While the Jing-Jin-Ji Region’s GDP was USD 1 trillion in 2014, similar to Korea’s GDP, and the 15th highest in the world, wealth distribution is uneven in the region. The per capita GDP of Beijing was almost three times that of Hebei province. As the plan aims to more equitably utilize the resources across the region, resistances are likely to come from current ‘winners’ that have enjoyed far greater access to superior resources of education, healthcare, culture and administration. 6.6.2 Integrated Development Planning As yet, there is no effective cross-provincial governance mechanism within the Jing-JinJi Region, aside from the high-level leadership group. The regional inequalities make cross-boundary regional cooperation hard to design. Further, the current official performance evaluation mechanism does not provide enough motivation to coordinate and cooperate. Before 2013, there were many discussions and plans for regional development linking Beijing, Tianjin and Hebei, but no significant actions were taken to improve
177
harmonization and foster collaborative competition. However, Beijing, Tianjin and Hebei province are confronted with the same significant environmental challenges, which may provide the catalyst for greater regional cooperation, especially in advancing solutions to environmental problems. In March 2014, a coordination committee for Jing-Jin-Ji Region development was established between the Beijing, Tianjin and Hebei province governments, with strong support from senior business and political leaders in the region. Since June 2014, several high-level meetings and seminars have been held among the governments, and field visits to partner provinces have been conducted. Mechanisms to establish and/or encourage common approaches to promote industry clusters, such as a uniform regional tax, have been developed, and a working group on implementation has been formed.318 While a more coordinated and collaborative regional governance structure is very desirable, the challenge will be to bring it to fruition, given the cherished autonomy of provinces and local governments in China. The results of existing policies are shown in the ranking of Beijing and Tianjin in the ‘institutional effectiveness’ category of the Economist Intelligence Unit’s Hot Spots index – at 96th with seven other cities. The overall ranking result for these flagship cities in the Jing-Jin-Ji Region are low when compared to the cities with which they must compete. The cities in the Jing-Jin-Ji Region are competing not only for business outside of China, but with the government’s policy to support more endogenous growth and lift the level of consumption in the domestic economy. They will have to compete with the Pearl River Delta and Yangtze River Delta for business and investment. Unless provincial and local governments can work together to achieve greater cooperation and collaboration, they will lose their competitive advantage and many of the new technology jobs that will be created in China. 6.6.3 Governance Reforms and Initiatives The Politburo of the Central Committee of the Communist Party of China approved plans on 30 April 2015 for the coordinated development of the Beijing–Tianjin–Hebei region, consolidating the project as a PRC-level strategy.319 The strategic plan aims to relieve pressure on Beijing and boost the development of its surrounding regions. Its approval will pave the way for the government to promote economic and spatial restructuring in the region, and improve the management of Beijing’s population. The plan places priority on traffic management, environmental protection, energy security, industrial upgrades and public services. One of the plan’s most important priorities is to ease the non-core administrative functions from Beijing to Tianjin and Hebei province. Tongzhou district, east of Beijing’s CBD, is planned to be a sub-administrative-centre of Beijing. There are discussions and debates about the relocation of Beijing governmental administration to Tongzhou district, but no official announcements have been made. Tongzhou is strategically located as a hub between Beijing, Tianjin and Hebei province, and is well connected by transport infrastructure. This makes it a possible centre for the relocation of some universities, hospitals and other public services. The second high-speed railway between Beijing and Tianjin is under construction and will further improve the connection between Tongzhou, Tangshan and Qinghuangdao, and thus will improve regional transport integration. A
178
regional railway development institution was registered in December 2014 as Jing-Jin-Ji Railway Investment Corporation. It is a joint venture, on a 3:3:3:1 share basis, between the Beijing government, Tianjin government, Hebei government and China Railway Corporation (the railway operation under the Ministry of Transport). The development of the plan has enabled investment in key strategic infrastructure to proceed, including the extension of Beijing’s subway network to Hebei province, and collaboration on customs clearance procedures between Beijing and Tianjin municipality starting in July 2015. However, a sufficiently powerful central coordination mechanism to ensure effective implementation is still lacking. Both Hebei province and Tianjin have always been subordinate to Beijing in resource allocation and administrative concentration. The disparity in political and economic position creates barriers to deeper cooperation and coordination at the administrative level. It will be necessary to break the boundaries of administrative systems to realize true coordination of the three regions. Second, there are also procedural barriers. For example, although in recent years Beijing has cooperated with Hebei province’s cities and development zones, they have encountered problems in harmonizing approaches to such issues as how to calculate GDP and to share taxes. Further, in comparison to the Pearl River Delta and the Yangtze River Delta regions, the Beijing–Tianjin–Hebei Region has a much less developed private sector, and more difficult natural conditions. Lastly, there is, as yet, no free flow of labour and resources in the Jing-Jin-Ji Region as the hukou system is not yet integrated within the region.
6.7
PARTNERSHIPS FOR SUSTAINABLE DEVELOPMENT
6.7.1 Development Partnerships The component metropolitan areas, cities and Hebei province have myriad partnerships on many levels. However, the different types of partnerships that support the development and management of the Jing-Jin-Ji Region can be characterized into just a few. Many of these involve formal structures, especially when they involve public–private sector partnerships between government and business. Others are less formal and involve networks and associations of professionals, communities and cultural interest groups. The core partnership types are: Government-to-government partnerships, providing coordination of economic development activity. The Jing-Jin-Ji Region constituents do not have any cooperation agreements equivalent to the Closer Economic Partnership Arrangements between the mainland and the two Special Administrative Regions (SARs) in the Pearl River Delta.320 The administrative autonomy of the SARs makes this arrangement necessary, but the process of working through key areas of cooperation and formally agreeing on them is in itself an important basis for effective coordination. Such formal coordination is advocated by both the Beijing–Tianjin–Hebei Integrated Development and Innovation
179
Centre of the Hebei University of Economics and Business and the Binhai Development Research Institute of Nankai University.321 Under such agreements, coordinated ‘twinning’ of agencies can occur, for example, as exists between the environmental agencies of Hong Kong, China and Guangdong. Such agreements will be essential if major administrative reforms such as unification of hukou (residence) permitting, are to be implemented. International city-to-city relationships, through sister city relationships and membership of specific interest groupings such as the C40 or Metropolis. Partnerships among institutions – such as educational institutions – in the cities of the region with other cities in the region or with international partners are common. In the urban sector, Peking University’s School of Urban Planning and Design has a long-standing relationship with the Lincoln Institute of Land Policy in the US, for example. Partnerships involving the private sector either with government or between industry associations. In particular, PPPs in the infrastructure space have occurred in the water sector and for rail investments, but they have not been transparent in their structures and are likely not to be replicated. However, the PRC government has recently introduced an improved framework for such activity. 6.7.2 Strategy for the Development of Partnerships While the partnerships developed to date have been important, a more strategic approach to partnership development could be taken. Such an approach would focus on the key economic development objectives and set out to establish relationships with partners in potential markets or commodity suppliers, and with collaborators in technology that is related to priority sectors. Examples are port cities as sources of raw materials and/or markets which link to substantial existing or potential hinterlands, such as the Lima ports (railway link to Brazil), Portland (links to US markets) and Brisbane (with its increasing links to Australia’s southern markets via rail and as an export hub for some commodities). 6.7.3 Action Agenda for City or Corridor Development Key areas of focus for a regional strategy for partnership development should be:
Investing in environmental infrastructure (particularly in water management and wastewater to augment current efforts and build resilience) Developing and implementing, on a sustainable basis, investments in ‘soft infrastructure’ (e.g. control of air pollution and inclusive health and education) Sustainable urban finance management (property tax, cost recovery, and then embark on PPP projects to leverage government funds) Low carbon planning and finance Developing international city-to-city economic links, especially in areas it wants to develop: sports (e.g. with Vancouver), education (e.g. with Canberra – already a sister city), high technology (e.g. with Songdo/Seoul) Establishing a more formalized regional planning and implementation body capable of guiding development.
180
6.7.4 Potential APEC Partnerships Through APEC, more effective public–private dialogue can be fostered – linking public– private groupings in the Jing-Jin-Ji Region with other dialogue organizations (such as exist in Sydney and Portland). This can be done by fostering an APEC-endorsed approach to developing a strategy such as discussed above, and to promoting the strategy so that the vision is shared by public, private, and community stakeholders.
6.8
CONCLUSIONS
The Jing-Jin-Ji Region is dynamic, but it is under severe stress and undergoing rapid change. In the last decade, structural reforms to central and local governments, the opening of the economy to greater competition and FDI, and internal migration, have significantly changed the socioeconomic structure and governance of the region. It faces many challenges in managing its continuing rapid urban development, transport, social and environmental problems. There is widespread recognition and understanding of these challenges, and the need for collective action by government, business and communities to address them. Partnerships and other collaborative initiatives and efforts are important for developing a viable approach to sustainable development. Sustainability is a strong underlining principle of the region’s development objectives, but not necessarily of its implementing organizations. The operational policy and decision-making processes of provincial and local government, business and communities are sometimes at odds with the concept. In the area of local economic development, the region has developed a wide range of partnerships between government, business and institutions which do not necessarily make up a coherent whole. With China’s economy slowing, unemployment rates threaten to rise, and investment to slow, except in areas such as services. Urbanization is a major challenge to the sustainable development of the region. Rising wealth drives lower-density, more energy-inefficient housing and the use of cars. There is a pressing need for the region to focus on greater integration of component cities while retaining high-density development along corridors between urban nodes and within cities. Decentralization of employment, investment and services, through planning support for polycentric city development is essential if the city is to develop more sustainable land-use, employment, transport and delivery systems for urban services. Social problems, in particular those relating to migrants and encroachment on rural communities, are significant and are a concern for the future sustainable development of the region. Similarly, its environmental problems are a competitive disadvantage. The Jing-Jin-Ji Region has a high-level endorsement for an effective governance structure. More effective coordination of local governments will be needed to achieve the ambitious goals for the region set by the central government. It is necessary to develop a structure which will enable the local bodies to act uniformly in the interests of the region, to improve the coordination of planning and infrastructure and to make the region’s economy more competitive. Better asset management systems are needed to provide a basis for more effective financial management. Such a governance structure is also the
181
basis for improved use of partnerships underpinning the development of the region and, as discussed above, these partnerships need to be better focused. While the Jing-Jin-Ji Region’s economic performance is impressive, its performance in putting in place the supports necessary for sustainable development is less so. Significant challenges are emerging, particularly in the areas of fiscal, social and environmental sustainability. Thus, while significant progress has been made in planning physical infrastructure, the experience of the Pearl River Delta offers key lessons in regard to the significance of central and local governments working together to build the enabling environment and the logistics components of strategic infrastructure as a basis for productive and complementary domestic and international private-sector investment. Several areas of challenge need to be addressed. Innovation systems need to be bolstered. Significant investment in human capital development is needed to enhance productivity and to support higher value-adding industry, particularly in Hebei province. Strategic infrastructure other than logistics, particularly social and environmental infrastructure, needs to be further developed as a high priority. In terms of governance, there is a need to coordinate better the response to these challenges across the public and private sectors. The new structures for regional coordination need to address the three dimensions of sustainable development (economic competitiveness, social development, and environmental improvement) to ensure continued growth on a sustainable trajectory. Big-picture thinking is crucial for the sustainable regional development of the Jing-Jin-Ji Region. However, only with a long-term commitment to change, and a more cooperative and collaborative way of thinking, can the potential of the Beijing–Tianjin–Hebei Region be fully realized.
182
7. Kitakyushu City, Japan Hitomi Nakanishi and Hisashi Shibata
7.1
INTRODUCTION
The City of Kitakyushu in Fukuoka Prefecture is the 13th largest city in Japan. Located on Kyushu island just south of the Japanese main island, it is regarded as a gateway to Asian economies. The city was developed by the steel industry in the modern era (1900s), and grew to become one of the largest industrial zones in Japan. However, by the 1950s and 1960s, its rapid development had led to air and water pollution (Photo 7.2). The Dokai Bay area was contaminated by factory emissions and industrial and domestic wastewater, and came to be dubbed the ‘sea of death’.322 The local administration was forced to act, and the city dramatically recovered from the environmental degradation. Kitakyushu set out to become the World Capital of Sustainable Development; and it became known for its sustainability initiatives, many of which involved partnerships with residents, enterprises, research institutes and government administrations. This chapter illustrates Kitakyushu’s concept of urban management, exemplified by the Energetic Kitakyushu Plan.323 Secondary data sourced from the City of Kitakyushu and academic articles were drawn upon for this case study.
Photo 7.1 City of Kitakyushu
Source: City of Kitakyushu
183
Photo 7.2 Overcoming Severe Environmental Pollution, City of Kitakyushu In the 1950s & 1960s
Present
Credit: City of Kitakyushu.
The chapter discusses some of the measures implemented by Kitakyushu City in moving from a ‘grey city’ to a green and a sustainable city. First, Kitakyushu’s economic dynamics, its infrastructure, and its social, environmental and governance systems are described in detail. Then, the collaborative efforts to push forward the Kitakyushu Model, which was designed to establish Kitakyushu as a global leader in sustainable city development, will be examined. The study will then conclude with key messages and lessons from the case study of Kitakyushu that could be replicated and adapted for other cities in the APEC region. 7.1.1 Development of the City of Kitakyushu Kitakyushu has a population of approximately 1 million (around 423,000 households) within an area of 489.6 square kilometres, making it the second largest city in the Kyushu region after Fukuoka City. Kitakyushu is divided into seven wards (Moji, Kokurakita, Kokuraminami, Wakamatsu, Yahatahigashi, Yahatanishi and Tobata), each with differing geographical conditions. The southern part of the city – designated as the Kitakyushu Quasi-National Park – is mountainous and has a relatively compact urban form. Kitakyushu enjoys a mild climate, which contributes to a comfortable lifestyle.
184
As the gateway city of Kyushu, and by taking advantage of its location facing a number of Asian economies, Kitakyushu has developed into a port city. The city also serves as a major hub for both road and railway transportation networks.
Figure 7.1 Map of City of Kitakyushu
Source: Authors.
7.2
ECONOMIC DYNAMICS
Kitakyushu has approximately 443,700 people in employment (as of 2012), and is home to almost 48,000 businesses. The key industry is manufacturing, and major export sectors are steel and machinery. Fukuoka City, the capital of Fukuoka Prefecture, differs considerably in industrial profile and focus, which strengthens the competitiveness of the prefecture. The expansion of Kitakyushu’s economic base was driven by the materials industries (steel, chemical, metal and ceramic) during the early twentieth century. Imperial Steel Works, Japan, founded in 1901, was the largest steelworks in Asia at the time – a modern factory that played a lead role in Japan’s industrial revolution and economic growth. The Chikuho coalfield, the largest of its kind in Japan at the time, brought prosperity to the city.
185
However, an industrial restructuring was required after the Second World War; and since then, three types of port (seaport, airport and e-port) have been constructed, and new industries, including the automobile, semiconductor and environment-related industries began to be promoted.324 Current figures suggest that Kitakyushu’s unemployment rate is above the average for Japan and is continuing to rise, despite the shrinking workingage population.325 7.2.1 Key Industry Growth Sectors Kitakyushu’s current industry growth sectors are automobile, semiconductor manufacturing and robotics. The logistics and distribution base centred in Kitakyushu Airport, Tachinoura Container Terminal and Hibikinada Container Terminal supports the growth of these industries. Major automobile manufacturers and auto parts makers are located throughout the city, contributing to the development of the sector’s advanced technology. Research facilities for environmental and information technologies are based at the Kitakyushu Science and Research Park. Research institutes, laboratories, enterprises and affiliated departments of universities gather in this research park for educational purposes. The goal of Kitakyushu Science and Research Park is to become a pre-eminent intellectual base for cutting-edge science and technology in Asia, as well as a core academic research centre.326 It also aims to facilitate collaborative research by enterprises and universities, promoting integrated learning. Kitakyushu Science and Research Park also provides various opportunities to robotics venture enterprises. Led by the Robotics Technology Center of Kitakyushu Foundation for the Advancement of Industry, Science and Technology (FAIS), the Kitakyushu Robot Forum was established in 2006. Robot-related technological research, development and application are the main purposes of this forum. The products include, but are not limited to, the Upper Limb Medical Rehabilitation Support Robot, the Pipework Inspection Robot, the Carrier Support Robot and the Infrastructure Investigation Robot for tunnels. 7.2.2 Trade and Investment Kitakyushu’s exports bring in around JPY 1 trillion (USD 9.8 billion) per annum. Major exports include: steel materials, machinery, shipping containers, electrical equipment and rubber products such as tires and tubes.327 Main imports include: natural gas, coal and electrical equipment. The city’s main trade partners for exports (as of 2011) are China (25.7%), Korea (14.0%) and ASEAN economies (17.4%). Main trade partners for imports (as of 2011) are China (27.2%), Korea (7.2%) and ASEAN economies (24.5%). The amount of trade (both export and import) continues to increase, generating JPY 2 trillion (USD 16 billion) in 2011; almost twice the revenue generated in 2002.328 The figures suggest a strong relationship between Kitakyushu and its neighbouring Asian economies. Kitakyushu’s active export relationship with its neighbouring Asian economies has supported its economic growth. Its main partner economies in Asia are China, Korea, Chinese Taipei and Thailand. The United States is also a major trading partner.329 Recently, in line with the moves toward a greener economy, export of steel products with
186
a high environmental performance has been the main focus of Kitakyushu’s manufacturing sector. 7.2.3 Regional Economic Competitiveness The economic competitiveness of the region can be illustrated by the uniqueness and innovativeness of Kitakyushu-based companies. An example is the Yaskawa Electric Cooperation.330 The company developed ‘MOTOMAN’, an industrial robot, using its own motion control technology, and released it as the first Japanese all-electric industrial robot in 1977. Since then, the company has shipped more than 300,000 products, establishing itself as the world’s leading manufacturer of industrial robots. Zenrin Co. Ltd., also headquartered in Kitakyushu, is Japan’s largest map maker. Not only does it produce printed and electronic maps, the company also provides geographic information system (GIS) data to Google Maps and global positioning system (GPS) makers.331 Another example is TOTO Ltd., which is ranked fourth in the world in the sanitary ware manufacturing sector (as of 2014). The company has bases in the United States and Europe, as well as China and a number of economies throughout the Asia-Pacific, producing products that fit the culture and lifestyles of each region. Its headquarters is in the Kokurakita ward of Kitakyushu; where it is able to advantage of its favourable location to import and export products to China and other East Asian economies.332 The geographical advantage of Kitakyushu, combined with its logistics and transport infrastructure, has enabled it to attract investments in the above key industry sectors. From the perspective of economic competitiveness, Kitakyushu complements Fukuoka City. While Kitakyushu is strong in manufacturing, robotics and environmental management, Fukuoka City leads in the tertiary industry. Its wholesale and retail industries employ around 190,000 people,333 making this a core industry, followed by the service industry, comprising medicine, information services and civil engineering. The Gross City Product for Fukuoka was about JPY 51.9 trillion (USD 428 billion) in financial year 2012.334 Fukuoka City also has a port and an international airport. Together, these two cities are driving the competitiveness of the prefecture. 7.2.4 Local Economic Development Kitakyushu aims to develop further the materials and machines industry by taking advantage of its location and resources.335 It aims to foster a knowledge-based manufacturing and assembly business hub that focuses on creating high-value products using innovative technologies and experienced human resources. The city supports small businesses that lead in technologies and services by providing them with accreditation. Kitakyushu also offers financial assistance to businesses at risk of bankruptcy as well as those starting creative projects. It also provides support through technological development funding, courses and seminars. Collaboration with local universities and businesses are promoted to assist local economic development. 7.2.5 Innovation, Creativity and Business Entrepreneurship
187
Kitakyushu’s most notable innovation is the integration of environmental and economic policies. The Green Frontier Plan aims to address the issues of greenhouse gas emissions and the coordination of environmental and industrial policies.336 The city also promotes medical welfare businesses that address the issues of an ageing society.337 Ageing and the shrinking working-age population are pressing issues for Japan, and demand for businesses that address these concerns continues to increase. Success in developing the medical welfare sector will strengthen Kitakyushu’s competitiveness. Beyond being an industrial city, it will also be a city with the capacity to respond to society’s new needs by developing innovative products and services that draw on the latest advances in robotics and information and communications technology. These advanced technologies could also be tapped to develop solutions that respond to the decrease in available human resources. 7.2.6 Economic Development Partnerships Sister cities of Kitakyushu (as of August 2014) include: Tacoma (Washington, the United States), Norfolk (Virginia, the United States), Dalian (China), Incheon (Korea) and Haiphong (Viet Nam). In 1991, 10 major East Asian cities (Kitakyushu, Shimonoseki and Fukuoka in Japan; Tianjin, Dalian, Qingdao and Yantai in China; Incheon, Busan and Ulsan in Korea) organized a conference to discuss the economic development of the region. In 2004, this network of 10 cities was named The Organization for East Asia Economic Development and established a platform for economic activities.338 Kitakyushu has a number of ongoing initiatives – not only with Asian economies and the United States, but also with European nations. In 2015, Kitakyushu was selected to be part of the Regional Industry Tie-Up Program (RIT Program) led by the Japan External Trade Organization. Under the RIT Program, Kitakyushu aims to create a new business model with European partners, starting with Germany.
7.3
STRATEGIC INFRASTRUCTURE AND ASSETS
Kitakyushu, as the front runner in the modernization and industrialization of Japan, founded a number of factories for the chemical, ceramics, cement and electricity industries; including the Imperial Steel Works, Japan. With its favourable geographic location, it was able to support these industries by enhancing two core infrastructure assets: the port and the railway. These improvements were the catalyst for the city’s growth to become one of the top four industrial areas of Japan. Today the region’s infrastructure network remains one of its main strengths. Not many non-capital cities in Japan are equipped with an infrastructure network as comprehensive as Kitakyushu’s. There are flexible options for logistics and transportation; and Kitakyushu is one of the few cities able to meet the greater demand for faster transportation and lower costs. Kitakyushu’s infrastructural base is being further
188
strengthened by progress on its airport and expressways. The following is an overview of the city’s infrastructure: Air transportation: Kitakyushu Airport opened in 2006 and operates 24 hours per day.339 The airport provides services between major cities in Japan and cities in Asia. International charter flights as well as midnight cargo flights are also offered.340 Kitakyushu Airport is approximately 30 minutes’ drive from the city centre. Marine transportation: The Port of Kitakyushu, one of the main ports in western Japan, is an international distribution base serving Asia and the rest of the world.341 It is 230km from Busan, Korea; and Chinese ports such as Shanghai, Qingdao and Dalian are within a radius of 1,000km. There are seven to eight feeder services per week between the ports of Kobe and Kitakyushu. Regular ferry services are available to the Osaka and Tokyo regions. Internationally, the Port of Kitakyushu has sister-port relationships with Tacoma (the United States) and Laem Chabang (Thailand); and a friendly-port relationship with Dalian (China). It also has logistics partner ports: Incheon (Korea); and Tianjin, Yantai and Qingdao (China). The Kitakyushu port has around 197 international services per month. Land transportation: Kitakyushu’s JR Kokura Station is linked to the main island of Japan by Japan Railways (JR). The bullet train (shinkansen) and other express trains stop at this hub station. With a monorail and expressway network, the area offers accessibility to the port areas as well as the airport. The Kanmon Expressway, Kyushu Expressway, East Kyushu Expressway and Kitakyushu Urban Expressway have interchanges in the city. Furthermore, the undersea Wakato Tunnel through Dokai Bay opened in 2013, allowing for easier and faster access between Hibikinada and the Tobata-Kokura area. 7.3.1 Logistics and Information Systems The Port of Kitakyushu’s Tachinoura Container Terminal serves as a hub for international physical distribution in western Japan. Using a sophisticated IT system, it offers accurate and efficient services to 180 container vessels per month. The No. 1 Container Terminal wharf is 620m long and its container depot capacity is 6,424 TEU.342 The Hibiki Container Terminal started operating in April 2005; since then, the port has further enhanced its level of services. The terminal’s berth has 15m of water depth, with the overall length being 700m. The terminal is designed to meet multi-purpose logistic needs. Table 7.1 summarizes the main trading destinations of container cargo in 2014.
189
Table 7.1 Main Trading Destinations of Container Cargo at Hibiki Container Terminal, 2014 Port
TEU
Tons
Busan
113,955
1,697,519
Shanghai
85,456
1,187,183
Kaohsiung
42,094
852,572
Hong Kong, China
33,345
624,530
Qingdao
18,538
235,610
Source: Kitakyushu Seaport and Airport Bureau.
The Kitakyushu Freight Terminal has a dedicated platform for marine containers. Utilizing its proximity to the sea and neighbouring Asian economies, the terminal has a sea–rail system that can minimize environmental burdens. It is possible to unload the train at its platform, minimizing unloading time. In September 2015, the Tachinoura Container Terminal, the main terminal of Kitakyushu port, conducted a pilot trial of an electronic toll collection (ETC) system at the terminal gate. The system is designed to enhance the accuracy and speed of the gate and shipping. It is expected that the implementation of the system will further strengthen the competitiveness of the Port of Kitakyushu as a regional hub. The system will automatically recognize vehicles and containers at the entry and exit gates as trailers pass through. There will be no need for the drivers to get out of the vehicles. Trailers can be moved and unloaded with the guidance of electric signboards, considerably reducing the time at a gate. Kitakyushu aims to implement this system in early January 2016, and to apply the system to all gates by April 2017.343 7.3.2 Assessment of Physical Infrastructure and Assets As described above, Kitakyushu has well-networked and advanced physical infrastructure that supports its industries and logistics. It is apparent that Kitakyushu’s locational values have made it a hub of marine, road and air transportation. The short distance from close Asian hub cities has enhanced its competitiveness in trading and logistics. The city has continued investing in assets to provide high-quality services, such as the Hibiki Container Terminal. Kitakyushu’s strategy of utilizing its location and building on that advantage has been successful thus far. Its infrastructure network has also benefited other areas in Kyushu. Infrastructure is essential in a region prone to natural disasters such as floods, typhoons and earthquakes. It may be perceived that the Kitakyushu region is overly committed to enhancing its infrastructure network. However, when disaster strikes, it is imperative to secure these types of networks. When portions of roads and ports are damaged, the networks provide alternative ways to dispatch rescue teams and send relief goods throughout Kyushu.
190
The city aims to provide more efficient services by solidifying the air, marine and land logistics networks. This would also support the city’s objective of promoting new, creative businesses in the environment and energy sectors. Kitakyushu is expected to attract business leaders and entrepreneurs with this new strategy. However, some foreseeable challenges should also be noted. Physical infrastructure requires regular maintenance and updates to maximize its potential. With the Japanese economy experiencing a prolonged period of stagnation and an ageing population, it will be a significant challenge to maintain the physical infrastructure and assets, and to meet expected needs in the future. The skills and knowledge of workers in these facilities are arguably world-class. The city could invite trainers from partner economies or cities and disseminate knowledge in logistics and infrastructure maintenance and design. 7.3.3 Public Infrastructure Reinvestment Plans and Infrastructure Partnerships Kitakyushu is home to many heritage structures. These include but are not limited to the Kanmon Tunnel, Mitsubishi warehouse, Kawachi Reservoir and the facilities of the Imperial Steel Works, Japan. These sites have the potential to create new business activities if maintained and refurbished. They will attract tourists, students of engineering history and architecture, and social entrepreneurs, among others. Some of these sites were nominated by UNESCO as world heritage sites, as part of the Sites of Japan’s Meiji Industrial Revolution: Iron and Steel, Shipbuilding and Coal Mining initiative, in July 2015. Kitakyushu is investing in these facilities by collaborating with other local government administrations that are also taking part in the initiative. Partnering administrations are as follows: prefectural (Fukuoka, Saga, Nagasaki, Kumamoto, Kagoshima, Yamaguchi, Iwate and Shizuoka), municipal (Omuta, Nakama, Saga, Nagasaki, Arao, Uki, Kagoshima, Hagi, Kamaishi and Izunokuni). Kitakyushu have invested in the initiative.
7.4
SOCIAL AND ENVIRONMENTAL SYSTEMS AND SUSTAINABILITY
Dependence on the steel industry caused serious air and water pollution for Kitakyushu during the economic boom between the 1950s and 1970s. The city implemented a series of environmental policies such as pollution control administration and an anti-pollution ordinance in partnership with its local citizens. As a result of these policies, healththreatening levels of pollution were reduced; and compliance with almost all domestic standards was achieved. Key initiatives for reducing the environmental impact of its heavy manufacturing industries include converting the city’s largely coal-based energy supply to oil and natural gas; moving toward cleaner production, including improving industrial energy efficiency; and introducing end-of-pipe technologies. The environmental approaches introduced by Kitakyushu have been highly praised both at home and abroad; and the city was selected as a Future City and a Green Asia International Strategic Comprehensive Zone in 2011. Kitakyushu was also the only Asian
191
city to be selected as one of four Green Growth Cities by the OECD Green Cities Program alongside Paris, Chicago and Stockholm. 344 Prior to this, in 2004, the city had formulated a Grand Design (to work ‘Towards the Creation of a “World Capital of Sustainable Development”’) based on grassroots-level environmental approach (see also Section 7.4.2). The Grand Design ascribes standards for all actions, with the aim of creating a city of abundance, wealth and prosperity that could be passed down to future generations. In 2007, Kitakyushu developed a Basic Environmental Plan that embodies the Grand Design. Kitakyushu also aims to triumph with its Green Industrial Town, by satisfying both environmental and economic targets while revitalizing the local economy with the aid of the Plan of Comprehensive Special Zone for International Competitiveness Development. Kitakyushu is regarded as a leader among cities in Asia in terms of its approach to social and environmental sustainability (See case study in Box 7.1).
192
Box 7.1 The Hustle and Bustle of Central Kokura and its Environmental Activities Flowing through the heart of central Kokura, the Murasakigawa River is a symbol of Kitakyushu. In the past, the river had been prized as a production area for high-quality ao-nori (a type of edible seaweed). It is said that the river had numerous ayu (sweet fish); and cormorant fishing was common. However, in the 1960s, industrial effluent and residential wastewater caused serious pollution; and the area suffered from poor water quality and unpleasant odours. In 1963, the year Kitakyushu was founded, the city began to engage in water purification, beginning with a comprehensive study of the water quality of the river. The city also embarked on a programme of sewage system construction. In the latter half of the 1960s, acting on pleas by the Junior Chamber International Kitakyushu for the waters of the Murasakigawa River to return to its former pristine state, efforts to clean up the river were expanded into a citywide movement. Thanks to the combined efforts of citizens and the local government, the river has since shown steady improvement.
1960s
Present
.
Murasakigawa River
Toward the latter half of the 1980s, the ground-breaking urban development project, ‘My Town My River’, was introduced. This project involved the unified implementation of river development projects as well as the creation of parks, roads and urban zones. The river was widened and bridges replaced. Buildings that had previously faced away from the river were reconstructed so that they looked out onto the purified river. To create a waterfront with a harmonious natural environment, natural rockery was added to the river dikes and waterfalls, and Suhama Plaza was built. Various environmentally friendly initiatives were also introduced, such as the Environmental Museum of Water, which allows visitors to observe conditions under the water surface. A commercial facility was later constructed featuring an air conditioning system that utilizes water from the river. Source: City of Kitakyushu
193
7.4.1 Labour Markets, Education and Training Kitakyushu’s labour market has been shifting its focus over the years, from manufacturing to tertiary industry (Table 7.2). A major concern is population decline, mainly driven by net migration rate. Kitakyushu’s population peaked in 1979 at 1,086,415. It has since declined by 10.5 percent, to 972,719 in October 2011.345 Meanwhile, the elderly dependency rate continues to increase. Kitakyushu has the highest percentage of those age 65+ among all ‘designated cities’ selected by the Japanese government for special programmes. It is also notable that younger people are leaving the city for education and other opportunities,346 making it a challenge for Kitakyushu to attract students and qualified workers.
6.8
7.9
10.1
18.7
6.9
2.7
1997
23.7
7.1
3.5
11.4
6.5
7.8
11.3
18.7
7.1
2.6
1998
21.4
7.5
3.6
11.1
6.3
8.8
11.9
19.4
7.2
2.7
1999
20.8
7.6
3.6
11.1
6.4
9.0
11.6
19.8
7.5
2.6
2000
20.6
7.7
3.6
10.7
6.0
9.2
11.2
21.0
7.4
2.5
2001
20.4
6.8
3.6
10.4
6.4
9.2
11.7
21.3
7.6
2.6
2002
18.5
7.0
3.7
10.7
6.6
9.5
12.1
21.6
7.8
2.7
2003
19.6
5.6
3.6
10.7
6.3
9.7
12.4
21.7
7.8
2.5
2004
19.2
5.6
3.8
10.6
5.8
9.8
12.9
22.0
7.8
2.5
2005
19.7
6.0
3.9
10.3
6.4
9.6
12.6
21.8
7.2
2.4
Finance/
Construction
Others
11.9
Government service
Service
3.8
Logistics/
7.6
insurance Real estate
23.7
Electricity, gas, water
1996
Manufacturing
communication
Wholesale/retail
Table 7.2 Employment Trends in Kitakyushu, by Sector, percent
Source: City of Kitakyushu, Cabinet Office National Accounts Estimates
Creating employment is one of Kitakyushu’s biggest challenges. Kitakyushu relied on two types of strategies between the years 2008 and 2011: one aimed at promoting growth in industry, enterprises and regional manufacturing; and the other focused on expanding business or trade and services. These strategies failed to achieve the target of 8,000 new jobs (Table 7.3). Japan’s stagnant economy during this period may have affected the outcome, which reinforces the need for new ways of dealing with the situation. The city also needs to provide more opportunities, to assure the younger generation that they could
194
achieve a better life and raise their families in a quality environment if they choose to stay.
Table 7.3 Employment Creation in Kitakyushu, 2008–2011 2008 Strategy one
Strategy two
2009
2010
2011
Total
1. Promoting growth of industry (target: 800 new jobs)
107
330
188
107
732
2. Attracting enterprises (target: 3,200 new jobs)
964
609
1,001
411
2,985
3. Strengthening regional manufacturing (target: 800 new jobs)
306
316
326
242
1,190
4. Promoting business/trade (target: 1,600 new jobs)
189
359
74
454
1,076
5. Creating services (target: 1,600 new jobs)
65
423
422
428
1,338
1,631
2,030
2,011
1,642
7,321
Total (target no. for 4 years: 8,000)
Source: City of Kitakyushu. New Growth Strategy (in Japanese, 2013)
7.4.2 Environmental Management and Sustainability: Policies and Measures Kitakyushu overcame serious environmental pollution (coal dust and sulphur dioxide concentration in air and water) in the 1960s. By 1990, the major urban environmental issues were living-environment related, such as noise, vibrations, odour, ozone depletion and nitrogen dioxide.347 Kitakyushu was selected as an Eco-Model City by the central government in 2008. In 2009, the city issued the Kitakyushu Environmental Model City Basic Plan based on the Grand Design scheme.348 The core principle of the Grand Design is ‘true wealth and prosperity’ sustained by the three pillars of living and creating together; economic advancement in a healthy environment; and enhancement of sustainability. Along with the Grand Design, the people of Kitakyushu, noting ‘the importance of the creation of a sustainable society’, embraced 10 principles of environmental action ‘by all sectors of society and in all aspects of living, learning, working and playing in Kitakyushu’:349
195
Ten Principles of Environmental Action of the People of Kitakyushu Boosting the environmental capacity of the city through the strength of the people Advocating for the advancement of exceptional human resources in the field of environment Valuing the significance of visible local ties Encouraging the symbiotic relationship with all living things through a deeper understanding of nature Protecting our valuable urban assets in the quest for beauty Reducing the ‘urban load’ on the environment Stimulating the market, driven by innovative environmental technology, with the participation of local actors Advocating the use of recycled resources in socioeconomic activities Sharing environmental information for further actions Channelling the concept of a model environmental city to all people of the world.
The 2009 Kitakyushu Environmental Model City Basic Plan, regarded as the administrative plan of the Grand Design, has the following objectives: (i) to enhance the capacity of environmental sustainability; (ii) to promote a low-carbon society and its internationalization; (iii) to promote a recycling-oriented society; and (iv) to promote conservation of biodiversity and facilitate a better quality of life.350 The outcomes of the Plan are monitored by applying a cycle of Plan, Do, Check and Action. The plan is evaluated using three performance indicators – achievement; ripple effect and efficiency – measured against the four aforementioned objectives. For the results of an evaluation published in 2014, see Table 7.4. To achieve its objectives, and in line with the aim to transform the former steel town into an eco-town, Kitakyushu has actively promoted environment-related businesses. First, Kitakyushu invited recycling businesses. The success of this strategy can be seen in the fact that Kitakyushu now has the largest scale of production for this type of business in Japan. An integrated environmental complex with a zero-emissions policy was developed in the Wakamatsu ward. The area has been used for recycling PET bottles and office equipment. It area also supports small venture businesses. Its precinct consists of a ‘frontier zone’ that gathers together cutting-edge technologies, and an ‘automobile recycling zone’ where automobile dismantlers are located. Also, a research centre has been to set up to foster collaborative efforts among industry, government and universities (including Fukuoka University) to improve technologies in waste management and recycling. The research centre aims to address global environmental issues. In June 2001, Kitakyushu Eco-Town opened its doors to encourage participation of the citizens and to promote better understanding of environmental issues.
196
Table 7.4 Evaluation of the Kitakyushu Environmental Model City Basic Plan Objectives
Achievement
Ripple effect
Efficiency
Total
1. Enhancing the capacity of environmental sustainability
84.4%
92.7%
85.4%
87.2%
2. Promotion of low-carbon society and its internationalization
91.3%
90.0%
88.8%
90.1%
3. Promotion of recycling-oriented society
88.6%
93.2%
97.7%
92.7%
4. Promotion of the conservation of biodiversity and the provision of better quality of life
84.6%
94.2%
84.6%
87.5%
Total
87.1%
92.3%
88.2%
89.0%
Source: City of Kitakyushu, Report of the Achievement of Kitakyushu Environmental Model City Basic Plan (2014)
7.5
URBAN GOVERNANCE
7.5.1 Institutional Urban Management Arrangements Conforming to the customary practices of local governments in Japan, Kitakyushu has a city assembly which currently consists of 61 members from seven wards, each member serving four-year terms. The City Assembly is responsible for budgets and regulations, and also discusses various challenges and issues to offer policy proposals. 7.5.2 Kitakyushu’s Vision ‘People-friendly and energetic’ has been the main theme behind the development of Kitakyushu.351 The fundamental concept was developed in December 2010 through the Energetic Kitakyushu Plan. The plan outlines six policy aims: to be people-friendly; to promote new growth; to expand the city by attracting citizens and creating jobs; to become the world capital of sustainable development; to guarantee the safety and security of the population; and to administer sustainable and stable finance policies. Among these aims, the fourth, ‘to become the world capital of sustainable development’, looks to enhance Kitakyushu’s performance as an eco-city by promoting international cooperation. To disseminate the knowledge gained from its experience in overcoming its own pollution problems, Kitakyushu established an international network called the Kitakyushu Initiative Network. A total of 61 cities from 18 economies from the AsiaPacific region have joined the network (as of January 2006). Kitakyushu is striving toward environmental sustainability by being at the forefront of the Asia-Pacific region.
197
Photo 7.3 Refurbished Wine Bar in Kitakyushu City’s Central Business District (CBD)
Kitakyushu has implemented various schemes to achieve a better quality of life, many of which have attracted nationwide attention. One is ‘renovation town planning’, where the city renovates underutilized properties in the central business district (CBD) to boost employment and assist its industries. Vacant clothing stores in shopping malls were turned into organic food restaurants and jewellery shops. An old bookshop was refurbished into a wine bar, with the original exterior being retained (Photo 7.3). 7.5.3 Public Finance
Kitakyushu’s budget for 2014 was JPY 5.42 billion (USD 45 million), approximately 0.4 percent up from that of the previous year. Credit: Authors. Investment in leading projects under the new growth strategy was the main focus of the city’s spending in 2014: JPY 1.8 billion (USD 15 million), was allocated for the promotion of its regional energy hub; JPY 300 million for the export of urban environmental infrastructure; and JPY 1.8 million (USD 15 million), for a logistics strategy on the new East Kyushu Expressway. Each budget was discussed and adopted at the City Assembly after the Mayor’s announcement of the budget proposal and a period of public consultation.352 The most critical issue in urban finance would be the cost of maintaining public facilities, roads and bridges.353 These facilities were mostly constructed after the Second World War, and have aged considerably. An estimated USD 760 million is needed annually for the maintenance of these facilities. This concern will become more serious due to depopulation. It is recommended that the facilities be updated with materials that require minimal maintenance, by applying latest technology wherever possible. 7.5.4 Development Planning Five municipalities (Kokura, Moji, Tobata, Wakamatsu and Yahata) overcame political differences and merged in 1963 to form the present-day Kitakyushu, which has since steadily revitalized the traditional urban centre and the transport network.354 The 2013 Kitakyushu Urban Master Plan (and the Individual Area Plans overseen by the respective administrative wards) sets out a clear vision of achieving a compact city with minimal environmental impacts, and stresses the importance of a concept for the city’s downtown.355 This plan is consistent with Kitakyushu’s vision of a people-friendly and energetic city. In the 1990s, urban growth increased rapidly, and industries overtook forests and farmland.356 Therefore it is important for Kitakyushu to control its pace of development to secure its green land for the sake of maintaining its ecosystem. The master plan focuses on: (i) regeneration of inner town areas; (ii) utilization of stock; (iii) quality assurance; and (iv) collaboration among various stakeholders. These are
198
intended to address some of the recent trends, such as decrease in population density, decrease in public service efficiency, decline in vitality and vigorousness of the central urban areas; delay in the renewal of urban areas; and inefficiency in the utilization of industrial areas.357 Kitakyushu had relatively high population density in some areas because of topographic constraints, but has experienced urban sprawl over the last few decades. This, along with the growing use of private cars, could cause an increase in carbon dioxide emissions. Kitakyushu’s urban development aims to develop towns alongside public transport networks (comprising JR lines, the monorail, the Chikuho railway and buses).358 As in many other Japanese cities, urban sprawl is a major impediment to sustainability. Compared to other cities, it is still possible for Kitakyushu to achieve a compact urban form for its geographic characteristics. Transit-oriented development is possible if strategic planning is implemented. For instance, successful development of the JR Moji station area was achieved by coupling the land re-adjustment project and the development of residential areas nearby. The project made the Moji area a popular tourist destination, and revived the shopping mall and the town area. 7.5.5 Governance Reforms and Initiatives Japan is facing a critical challenge that no other economy has experienced to the same degree. Its rapidly ageing population requires a radical change in the governance of its cities. Japan’s public workforce is smaller than other OECD economies; and this needs to be addressed through innovation. There is a need to bring in new skills and new ways of working to enhance the effectiveness and productivity of public services.359 Regulatory reform and new forms of partnership with the private sector are other areas for improvement. Public–private partnerships are a common way to boost private investment in infrastructure while reducing the financial burden on the public sector. However, the success of such partnerships is highly dependent on the economic situation. It requires caution, as evidenced by the many examples of failure around the world. Kitakyushu has been engaged in government reform to cope with the challenges brought by the changes in the societal, economic and environmental situation. The current plan proposes collaboration among residents, non-profit organizations and the private sector. In addition, it aims to achieve efficiency and effectiveness by ‘selection and concentration’ as the city attempts to respond to the needs of residents and assess the costbenefit performance of each proposal. To these ends, the city is making efforts to value staff and their skills, reform the organizational structure for more efficiency, and achieve transparency by providing information to its residents.
7.6
PARTNERSHIPS FOR SUSTAINABLE DEVELOPMENT
Kitakyushu has been one of the most engaged Japanese cities in international environmental cooperation.360 The following are some of its partnerships:
199
The Yellow Sea Partnership: The Pan-Yellow Sea Economic Region proposes economic and human resource interactions within the region through The Organization for East Asia Economic Development, described in Section 7.2.6. The Kitakyushu Asian Centre for a Low Carbon Society (also known as Asia Green Camp): This partnership aims to promote low-carbon societies in Asian cities. The centre organizes many projects in Asian economies (Cambodia; China; India; Indonesia; Korea; Malaysia; Myanmar; Palau; the Philippines; Singapore; Thailand; and Viet Nam) to promote and support low-carbon projects and businesses to reduce carbon dioxide emissions.361 It also has partnerships with the United Nations Industrial Development Organization (UNIDO), the Japan Bank for International Cooperation and the Japan International Cooperation Agency (JICA). The Kitakyushu Model Initiative is the main driving force of the centre’s activities. The Kitakyushu Model: This model was developed to systematically organize a city’s administrative knowledge base on urban environments. The Kitakyushu Asian Center for a Low Carbon Society recommends the development of a master plan through applying the Kitakyushu Model, to create sustainability under the ‘green city’ concept. The centre also measures achievement by applying the Kitakyushu New Low-Carbon Measurement, Reporting and Verification Mechanism (K-MRV). This mechanism aims to promote the export of high, value-added technology by evaluating the reduction of greenhouse gas emissions.362 Kitakyushu International Techno-cooperative Association (KITA): Since 2005, Kitakyushu and Surabaya in Indonesia have cooperated in the waste management sector through KITA. The Takakura Home Composting (THC) method was implemented in Surabaya to solve its serious waste management problem.363 Surabaya was able to dramatically reduce the waste generated at disposal sites by 30 percent in the matter of four years, allowing the city to win Indonesian and international awards for environmental improvement. A wide range of support from local stakeholders (government and non-government, NGOs and local communities) is essential to build capacity.364 The success in Surabaya created considerable demand for technical assistance in other Asian cities.365 For example, in Cebu, Philippines, Kitakyushu funded a community-based wastewater treatment facility in 2009.366 The THC method was implemented there as well. Kitakyushu has the highest average number of trainees qualifying per year among the 20 government ordinance-designated cities in Japan that are participating in the International Environmental Cooperation project. The city also has 35 years of experience in international environmental cooperation.367 In addition to KITA, Kitakyushu also has a JICA centre where it organizes various training programmes.
200
The training programme for Kitakyushu’s resource recycling initiative aims to harness the experience of both government and business to contribute not only to environmental improvement in developing economies but also to the revitalization of Kitakyushu itself.368 The city holds seminars targeting businesses, conducts surveys, sends business mission teams, participates in exhibitions and acts as a mediator between the business sector and local governments in neighbouring Asian economies.
7.7
CONCLUSIONS
Kitakyushu played an integral part in the economic growth story of not just the Kyushu region, but also Japan, in the twentieth century. That growth came at a price however. The rapid industrialization had resulted in serious environmental problems in the city. This chapter discussed how Kitakyushu survived those problems, and transformed itself into an environmentally friendly city, or an ‘eco-city’. While improving its environmental management, the city invested in economic development by promoting new technology and extending its logistics and transport network. A number of partnerships with other cities throughout the world enabled Kitakyushu to export the knowledge and skills learned from its own environmental crisis. However, knowledge in environmental management would not be sufficient for Kitakyushu to lead Asia in the long run. New growth sectors would be key for Kitakyushu to become more competitive internationally and to establish itself as a technology hub for Asia. Its infrastructure network and its flexibility could well support its way forward. The challenges facing the development of the city of Kitakyushu are significant. Japanese cities are facing the serious issues of ageing and a decline in working-age population, and Kitakyushu is no exception. Repair and maintenance of its infrastructure will demand significant expenditure, which will put pressure on the city’s budget. Cost of pensions and medical care will also continue to increase due to the ageing population. From an urban planning perspective, a key challenge for Kitakyushu if it intends to keep its position as an environmentally friendly city is to halt urban sprawl and provide closedistance, high-quality transit corridors. It is apparent from international examples that high-density urban settings can provide a high quality of life, even within limited spaces. With its highly-reputed design skills, it should be possible for Kitakyushu to go in that direction. Engaging with the local community and partnering with businesses could result in a consensus on urban design acceptable to all parties, which could in turn reduce costs and attract residents and investors alike.
201
8. Lima, Peru Florian Steinberg and Juana Kuramoto
8.1
INTRODUCTION
Lima, the capital city of Peru, with a population of almost 10 million, was founded in 1535 by Francisco Pizarro in a fertile valley a few kilometres east of the Pacific Ocean. Its strategic location gave the Spanish conquistadores control over vast expanses of South America. Through its pre-colonial, colonial and recent history, the city has had its fair share of economic ups and downs, disasters and civil disorder. However, throughout these times, the city has demonstrated remarkable resilience – rebuilding, rejuvenating and developing, although not necessarily sustainably. Changes are happening to make Lima a more sustainable city. Lima is currently ranked among the top ten best cities for doing business in Latin America. This chapter explores the current state and dynamics of change in the economic, physical, social, environmental and governance systems of Lima. It explores recent development, and highlights some examples of sustainable city development projects. These include the busway systems and inner city restoration that are giving back to the city the functionality and character that it has been lacking for many years. Finally, it draws some conclusions about Lima, and what it can offer by way of lessons for making cities in the Asia-Pacific region, and especially South America, more sustainable.
202
Photo 8.1 Larcomar Shopping Mall, Miraflores, Lima – A Commercial Highlight
Credit: Wikimedia Commons / shoestring.
8.1.1 Lima in Context Peru has a population of 30,135,875 people. It has almost all climates types and important natural, mineral and energy resources. The economy of Peru is classified as upper middle income by the World Bank and is the 39th largest economy in the world. In recent years, Peru has been one of the world’s fastest-growing economies, thanks to an economic boom in the 2000s. It has a high Human Development Index of 0.734, based on 2014 data .369 Historically, the economy has relied heavily on exports. Peruvian economic policy has varied widely over the past decades. Since the 1990s, the economy has liberalized, and ended price controls, protectionism, restrictions on foreign direct investment, and most state ownership of companies. The reforms have permitted sustained economic growth since 1993, except for a slump after the 1997 Asian financial crisis. Peru’s GDP in 2014 was estimated at USD 202,859 million. Services accounted for 60 percent of its GDP, followed by manufacturing (14%), the extractive industries (12%) and taxes (16.5%). Recent economic growth has been boosted by a period of macroeconomic stability, improved terms of trade, and rising investment and consumption. Peru’s free trade agreements with the United States; China; Mercosur; and Chile have played, and will continue to play, a significant role in its success in trade.370,371
203
In terms of international competitiveness, Lima has room for improvement. In the Economist Intelligence Unit’s 2012 study, Hot Spots – Benchmarking Global City Competitiveness, which analyses 120 major cities in the world, Lima comes in at 88th, which makes it 5th among South American cities.372 Lima ranks above the global mean in ‘economic strength’ and ‘global appeal’, but substantially below New York which leads in the overall competitiveness ranking (Table 8.1). In all other indicators, Lima falls below the global average, with the gap particularly wide on the ‘financial maturity’ and ‘environmental and natural hazards’ attributes. However, the projection for 2025 shows Lima moving up to rank 48th on the world scale.373
Physical capital
Financial maturity
Institutional effectiveness
Social and cultural character
Human capital
Environment al and natural hazards
Global appeal
Category weight
Economic strength
Overall
Table 8.1 Economic Competitiveness of New York and Lima, 2012
30.0%
10.0%
10.0%
15.0%
5.0%
15.0%
5.0%
10.0%
1
New York
71.4
54.0
92.0
100.0
85.8
95.0
76.5
66.7
35.7
88
Lima
42.5
40.0
66.1
16.7
45.2
58.3
64.2
37.5
10.2
Global
49.1
35.9
77.25
50.0
63.25
63.75
63.7
66.7
9.0
Source: Economist Intelligence Unit, Hot Spots 2025: Benchmarking the Future Competitiveness of Cities (London: Economist Intelligence Unit: 2013).
Lima is a primate city, and dominates Peru’s system of cities. It is home to 31.6 percent of Peru’s population, produces 45 percent of its GDP, and 79.6 percent of its banking portfolio.374,375,376 The city contributes about 80 percent of the total taxes collected in Peru, 61 percent of Peru’s manufacturing activities (through its nearly 7,000 factories), 55 percent of the construction sector’s output, 53 percent of the retail and service sector outputs and 52 percent of gross value added (2007 data). While the average national product per worker was PEN 15,519 (USD 4,961) in 2007, Lima averages more than PEN 20,000 (USD 6,393). The Port of Callao handles more than 80 percent of Peru’s shipping container traffic, including 19 percent of Peru’s mining exports; and this has been growing with recent port expansions. 8.2
ECONOMIC ENVIRONMENT
Lima is Peru’s leading industrial, financial and retail centre. Many of Peru’s industrial complexes are located in and around the capital city region; and most of Peru’s imports and exports are channelled through the Port of Callao.377 Despite its importance, Lima’s economy has experienced significant ups and downs. Unemployment is high, as is the size of the informal sector economy.
204
The government was traditionally the main employer. However, since the 1990s, the private sector has become the leading employer. In the early 1990s, the reform of the Peruvian government included the privatization of most state-owned companies and a reduction in the number of workers in government institutions such as ministries and other agencies. The size of the government went down sharply in the early 1990s. The government even had a programme to encourage resignations in the public sector. The privatization of state companies left thousands of people out of work in the mid1990s, as many of these companies were old, inefficient and lacking the capital to modernize. While Lima’s economy grew rapidly during the mid-1990s, it has never been able to recover fully from the recession that began in 1997, and which left one in every two Peruvians living in poverty. More recently, Lima has experienced improvements, due mainly to the flow-on effects of a booming mining industry, and increased trade. Sectors like agriculture, textiles (apparel, among others) and the expanding services sector (commerce, improvements in telecoms, professional services, etc.) also contributed. Table 8.2 shows key facts on the city’s economy.
205
Table 8.2 Key Economic Facts – Lima
Value of the economy (June 2013)
Local Government Area
Greater Region
(The province of Lima)
(The ‘department’ or region of Lima)
USD 70,124,741,639
n.a
(45% of Peru’s GDP) Estimated residential population (June 2013)
8,617,310
n.a.
GDP per capita
USD 5,120
USD 8,137
Employment (2013)
4,607,100
n.a.
Unemployment rate (2013)
4.7%
n.a.
Number of businesses (June 2013)
n.a.
842,522
Key export sectors
n.a.
Traditional mining, oil and natural gas, agriculture and agroindustry, clothing and apparel, and chemicals
Source: Compiled from the following INEI (Instituto Nacional de Estadísticas e Informática) publications: Evolución de la Pobreza Monetaria 2007–2012 [Evolution of Monetary Poverty] (2013); PBI por Departamentos 2001–2012 [GDP by Region] (2013); Perú: Estructura Empresarial 2013 – Análisis de la estructura empresarial de Lima Metropolitana [Peru: Business Structure – Analysis of Metropolitan Lima’s Business Structure] (2013); Situación del Mercado Laboral en Lima Metropolitana, Junio-Julio-Agosto 2014 [Metropolitan Lima’s Labour Market] (2014); Principales Indicadores Departamentales 2008–2014 [Main Region’s Indicators] (2015); and from: A. Segura, Perspectivas Económicas 2014 [Economic Perspectives] (Lima: Ministry of Economy and Finance, 2014)
206
Figure 8.1 Map of Peru
Note: This map shows the department (region) of Lima. The region of Lima has 10 provinces, one of which is the province of Lima. The province of Lima comprises Metropolitan Lima and the constitutional province of Callao. This is what we refer to as the city of Lima. Source: Wikimedia Commons / Huhsunqu.
8.2.1 Economic Dynamics of Lima The city of Lima concentrates the largest share of economic activity in Peru. In 2013, it contributed USD 70,125 million to the national economy or approximately 45 percent of national GDP. There is no available data on the share of GDP provided by the metropolitan Lima area. Figure 8.1 shows the size of the economy of the Lima region
207
compared to other regions in Peru. The Lima region has an economy eight times that of Arequipa’s, the next largest. In 2013, metropolitan Lima’s real per capita income was about USD 8,137 compared to the provincial level of USD 5,120 (Table 8.2). However, it should be noted that per capita income figures have been bloated by the strong performance of the mining industry, and distribution of income is inequitable, as shown by Peru’s Gini coefficient, which was 45.1 in 2012.378 In 2011, 4.9 per cent of the households in Lima had an annual income of USD 49,724; 18.8 per cent had USD 24,083; and 40.7 percent had USD 14,932. During the last decade, there has been rapid growth in other regions (Figure 8.2). In 2012, Lima ranked 12th (6.0%) in production growth rates in Peru. Regions like Amazonas (13.9%), Ayacucho (12.6%), Apurímac (11.9%) and Ucayali (11.6%),379 which used to be low performers, have experienced a major recovery. Other regions that outperformed Lima include Arequipa (8.7%), Lambayeque (8.7%), Piura (7.3%) and La Libertad (6.1%).
Figure 8.1 The Dominance of Lima in Peru’s Economy, GDP by Region
Source: Date from A. Segura, Perspectivas Económicas 2014 [Economic Perspectives] (Lima: Ministry of Economy and Finance, 2014)
Figure 8.2 Production Growth Rates in Peru, by Region
Source: Data from INEI (Instituto Nacional de Estadísticas e Informática), Producto Bruto Interno por Departamentos 2001–2012 [GDP by Departments] (Lima: INEI, 2013)
8.2.2 Key Industry Growth Sectors As indicated, almost half of all production in Peru takes places in Lima. In addition, economic activity is concentrated in Lima. The inner circle of Figure 8.3 shows Lima’s GDP breakdown by economic activity. The outer circle shows Lima’s share with respect to the Peruvian economy as a whole.
208
Manufacturing represents 31 percent of Lima’s GDP, but 68 percent of all manufacturing in Peru. In the same way, even when restaurants and hotels represent only 5 percent of Lima’s economy, they account for 63 percent of all Peru’s economic activity in that sector. Even primary industries such as mining and fishing, which depend on the availability of location-specific resources, conduct many associated activities in Lima (e.g. processing) since many mining and fishing firms are headquartered there. 8.2.3 Trade During the 2000s, Peru’s international trade increased sharply. Free on board (FOB) exports in 2000 were USD 6,995 million; in 2005 they were USD 17,368 million, and in 2012 they reached USD 47,411 million.380 This increase in trade is due to the signing of bilateral trade agreements. To date, Peru has 14 ongoing trade agreements (Andean Community, Mercosur, United States, Canada, China, Korea, Singapore, European Union, Mexico, Chile, Japan, Cuba, Thailand and Panama). Four recently signed agreements (European Union, Costa Rica, Guatemala and Venezuela) are waiting for implementation. Two major multilateral agreements are under negotiation – the Pacific Alliance and the Trans-Pacific Partnership, as well as two bilateral trade agreements (El Salvador and Honduras).381 Peru has experienced a setback in exports in the last two years, in part due to the fall of commodity prices and the slowdown of some China, United States, the European Union).
Figure 8.3 Economic Activities in Lima, 2012
Source: Data from INEI (Instituto Nacional de Estadística e Informática), Producto Bruto Interno por Departamentos 2001–2012 (Lima: INEI, 2013).
of Peru’s most important partners (e.g.
The region of Lima accounts for 24 percent of all Peruvian exports (USD 9.33 billion out of USD 38.18 billion in 2014). About 9 percent of Lima’s exports are made up of nontraditional products, such as agro-industrial products; apparel and textile manufacturing; chemicals, metallic, iron and steel products; and mechanical products. Exports that are considered more traditional include minerals, fishmeal, oil and natural gas.382 8.2.4 Investment Environment The World Economic Forum’s 2013–2014 report on competitiveness has Peru maintaining its global position at 61st. The following reasons are listed: strong macroeconomic performance, and high levels of efficiency in the real estate, finance and labour markets. Further, positive points are seen in the strict rules governing hiring or dismissal of labour. Negative factors are deficiencies in public sector administration, the
209
inconclusive fight against corruption, weak infrastructure, the poor quality of the education sector, a low capacity to innovate, and low investment levels for research and development.383 In an effort to translate the Doing Business indexes to the municipality level, Herrera384 estimated the balance between attractiveness factors (i.e. first order factors such as basic infrastructure, energy, roads and productive infrastructure; and second order factors such as level of education, size and specialization of the labour force, and public goods) and expelling factors (i.e. first order factors such as city insecurity, vulnerability to natural disasters, environmental pollution and lack of basic infrastructure) within 1,686 municipalities in Peru. He found that the top 10 municipalities were located in Metropolitan Lima (i.e. San Isidro, La Punta, Miraflores, Jesús María, Lince, Santiago de Surco, La Molina, Pueblo Libre, Santa María del Mar and Los Olivos). A report by the Asian Development Bank (ADB) and Corporacion Andina de Fomento (CAF) in 2015 on The Competitiveness of Cities in Asia and Latin America analysed Lima as a case study.385 Interestingly, the result regarding the cost of doing business in Lima is that the rate of corruption, a serious problem that affects economies in Latin America, is lower compared other cities studied. Land costs in the city are considered very reasonable for the region, as are the costs of starting a business. The local economy is dynamic and entrepreneur friendly with a high-quality workforce. The population of the city is relatively educated and has the required managerial capacities. The illiteracy rate was equal to 2.9 percent in 2010 and is still falling. The population older than 15 years of age has an average of 11 years of schooling, reflecting increased spending on primary and secondary education, and high school attendance rates.386 These outcomes are reflected in the Economist Intelligence Unit’s Hot Spots index, which puts Lima at 39th in both the ‘economic strength’ and ‘human capital’ categories. 8.2.5 Innovation and Business Support The 2015 ADB-CAF study found that support for research and development in Lima was underdeveloped. It was only in 2007 that a funding scheme was established to support R&D by academic institutions and firms. The programme, known as the Science and Technology Fund for Competitiveness387 (FINCyT and now converted into Innovate), was created with resources from an Inter-American Development Bank loan and Peruvian government resources. The scheme, currently finishing its second phase, has seen increased government support. Funding of science and technology activities through the Council of Science, Technology and Innovation has also risen, with its budget having risen eightfold, from around USD 5 million in 2012, to USD 40 million in 2015. By the end of 2012, the government had also created the USD 100 million Framework Fund for Innovation, Science and Technology, or FOMITEC. Despite these positive developments, and an attempt to create a Science, Technology and Innovation Council for the city of Lima, at present there are no major initiatives to promote research and innovation in the city.
210
Support for business has been more forthcoming. The Municipality’s Office of Business Development has developed a number of initiatives, including a business development programme, the development of clusters, human resource development, and the promotion of SMEs. In addition, the Ministry of Production has a series of Innovation Centres that provide support to agglomerated firms in specific lines of business, such as leather and shoes, wood and furniture, agro-industrial, and textile manufacturing. The municipality also promotes large investment projects with private participation. The Office of Promotion of Private Investment is responsible for facilitating large projects and the procedures that will rule the participation of private investment in such projects. The coordination among agencies and between the municipality and the private sector could be improved. The Metropolitan Lima Municipality has been planning to establish industrial and technological parks, one in the northern end of the city (next to Ancón) and another one at the southern end (next to Pachacamac and Lurín). These projects are still at the blueprint stage. Two private universities are also planning technological parks in the Santa María district, 45km south of Lima. There is now a strong pro-investment climate in Peru, including a favourable legal framework for foreign investment and non-discriminatory treatment. There is unrestricted access to most economic sectors and no performance requirements. Investors can enjoy free transfer of capital; free competition; respect for private property; freedom to purchase stocks from locals; freedom to access internal and external credit; freedom to pay royalties; and a network of investment agreements.388 According to a World Bank survey and the World Economic Forum, Peru stands second in the Latin America region, and 15th in the world, in protecting investors. Peru is first in the region in government readiness for private investment.389 Red tape and bureaucracy have reduced significantly in the past 15 years. However, doing business in Lima still requires patience and persistence, even though a culture of ‘no bribes’ is taking root. According to a World Bank study, Peru ranks 50th in 2016 in terms of the ease of doing business, compared with the year 2007 in which it ranked 65th. These findings are consistent with the results of the Economist Intelligence Unit’s Hot Spots index, which ranks Lima 55th in terms of ‘global appeal’. 8.2.5.1 Productive Development Policies In the first half of the twentieth century, as shown in Figure 8.4, Lima followed a triangular expansion pattern with the following vertices: Downtown Lima, where many political and administrative entities are located; Callao, the industrial and trade centre; and the districts of San Isidro (Photo 8.2) and Miraflores, as financial centres.390
211
Figure 8.4 Traditional Centres of Lima’s Urban Economy
Source: Data from PROTRANSPORTE, Estudio de Corredores Complementarios – Caracterización de la estructura y dinámica urbana [Complementary Corridors – Characteristics of the urban structure and dynamics] (Lima: PROTRANSPORTE, 2013).
The urbanization process of Lima, together with the migration process from the regions to the capital, has intensified this pattern of economic development. Some authors analyzing the concentration of employment in the city found that the employment density decreased in the districts that were more distant from these centres of the urban economy.391 However, they also realized that other urban centres were developing quickly, such as Los Olivos (in the north) and San Miguel (in the west) and Gamarra ana Ate (centre and east). After the liberalization process in the 1990s, Lima attracted investment and new developments as commercial centres (e.g. shopping malls) consolidated the new urbanization areas that once were invaded lands. The emergence of Lima as a polycentric city became evident.
212
Figure 8.5 Lima: Local Productive Development Policies
Source: Data from PROTRANSPORTE, Estudio de Corredores Complementarios – Caracterización de la estructura y dinámica urbana [Complementary Corridors – Characteristics of the urban structure and dynamics] (Lima: PROTRANSPORTE, 2013).
Figure 8.5 shows three different expanding urban centres in the north, south and east, with 26 percent, 17 percent and 20 percent of the population of the city respectively. Each of these centres has significant investments in shopping malls, which have consolidated their position as centres of consumption as well as centres of employment generation. Based on figures of the Development Plan for Metropolitan Lima, 55.6 percent of the 2010 value of production generated in the city comes from districts different to those which have traditionally been considered as business centres, such as San Isidro, Miraflores and downtown Lima.392 Another major constraint is a lack of funding. Even when the Metropolitan Lima Municipality speeds up the approval of large investment projects, the central government may not release the financial resources or provide clearance for certifying international loans. For example, Metro Line 2, which will be funded by a World Bank loan, was initially programmed for 2015, but will be delayed by one year. In some cases, the delay in the approval by the central government is related to the lack of proper studies to justify the viability of the projects.
213
Photo 8.2 San Isidro’s Financial District
Credit: Wikimedia Commons / Sen67howard.
8.2.6 Industry Clusters Since the economic stabilization process experienced in the 1990s, Peru has rejected the idea of any industrial policy that promotes the development of specific sectors. In the 2000s, there was some interest within sectors of the central government on the development of industrial clusters, but there has not been a clear policy to promote emerging ones. The National Council for Competitiveness (CNC, its Spanish acronym) recently prepared a report to map and assess the level of development of existent clusters. The report identified 41 industrial clusters throughout Peru. Fourteen of these clusters were located exclusively in Lima (Table 8.3). In the case of some other clusters, like mining-related services and canned and frozen vegetables, their locations were dispersed among Lima and elsewhere. Today, the CNC’s efforts to promote clusters has lost some momentum, as a new major initiative from the Ministry of Production to promote economic diversification393 has received direct support from the central government, with significant financial resources allocated to it. (In 2014, the government created a fund to strengthen SME’s productive development amounting to PEN 600 million, or USD 211.3 million. A fifth of that is devoted to promoting technology diffusion and cluster development. An existing fund to promote SME investment was also increased to PEN 1.2 billion, or USD 422.6 million.) This diversification plan is expected to develop from the information gathered by the CNC’s cluster studies. 8.2.7 Constraints to Economic Development The major constraint to economic development in the city of Lima is the lack of continuity in policies. New administrations taking office after municipal elections often do not carry on with the policies implemented by the previous administration. In many cases, the
214
priorities of new administrations differ and long-term policies cannot be properly implemented (e.g. the reorganization of the public transportation system). The lack of funding does not only apply to major investment projects. The Peruvian productive structure is made up of mainly micro and small businesses which have difficulty in accessing credit. Implicit interest rates reach 20.8 percent and 32.9 percent monthly for small and micro business respectively394 while rates charged to corporations, large firms and medium-sized businesses are, respectively, 5.3 percent, 7.3 percent and 11.3 percent.395 In addition, business development services are scarce for micro and small firms. The Ministry of Production has a set of technology innovation centres that provide information, training and technological services for small firms. There are only 15 such centres that are active throughout Peru, which is not enough to meet demand. More than half of these centres are located in Lima and are undergoing a major reorganization.
Table 8.3 Clusters in the City of Lima LINE OF BUSINESS
CLUSTERS Fashion Show
Design manufacturing Furniture Jewellery Meat Food and agriculture health
Gastronomy & food services Health services Logistics Software
Creative industries and support industries
BPO Digital and audio visual contents Construction
Other industries Automotive related Corporative tourism Tourism Cultural tourism Source: Based on data from Metis Gaia, Elaboración de un mapeo de clusters en el Perú – Informe Final [Cluster map for Peru – Final Report (Lima: Ministerio de Economía y Finanzas, Consorcio Cluster Development, 2013).
8.3
STRATEGIC INFRASTRUCTURE
As the largest city in Peru, Lima has the highest level of physical infrastructure to support the economic activities of its population. Nevertheless, like the rest of Peru, it has a severe infrastructure shortfall. Peru has a projected infrastructure deficit of USD 88 billion for the period 2012–2021,396 and an estimated 35 percent of this deficit is in Lima.397
215
Lima is Peru’s central logistics node. The Port of Callao moves 85 percent of all in and out shipments in Peru (around 1.8 million containers in 2012).398 As shown in Figure 8.6, all the logistics nodes in Peru are connected to Lima. Four nodes provide direct access to markets in neighbouring economies: PiuraTumbes in the northwest which connects to Ecuadorian markets; Iquitos in the northeast to Brazilian markets; Puno in the southeast to Bolivian markets; and Tacna to Chilean markets.
Figure 8.6 Peru’s Logistics Nodes
Furthermore, Lima is also a major consumption and production centre, so there is intense trade between Lima and the various regions, most of which is made by land. Thus, vital infrastructure is crucial. To improve the efficiency of logistics services, the Plan for Logistic Services has identified the main investment projects that need to be executed in Lima. Table 8.4 shows that these short- and mediumterm projects include investments in ports, airports and logistic zones amounting to USD 2.9 billion.
Principal logistics nodes Secondary logistics nodes Local area logistics nodes Regional functional scope Macro regional functional scope Border crossing traffic scope Consolidated logistics relationships
Source: IMP (Instituto Metropolitano de Planificación), Memoria de Análisis y Diagnóstico – Plan Metropolitano de Desarrollo Urbano 2035 [Aide Memoir – 2035 Metropolitan Plan for Urban Development] (Lima: Municipalidad Metropolitana de Lima – IMP, 2014).
The projects are expected to be built with the participation of the private sector, mostly via concessions. This modality of private participation ensures that maintenance costs will be met by the concession contracts. As will be explained later, the municipality has included institutional initiatives to facilitate private investment. There is a master plan to improve Lima’s vital infrastructure through land corridors that include vital rings, connector roads, ring roads and expressways. Figure 8.7shows the corridors that connect to the main highways in Peru (the Northern and Southern PanAmerican Highway and the Central Highway).
216
Table 8.4 Lima’s Required Logistics Investment Project
Investment (USD, million)
Logistic Zone – Callao
155.20
Northern Multipurpose Terminal – Port of Callao
749.00
Southern Containers Terminal – Port of Callao Phase 1
355.00
Southern Containers Terminal – Port of Callao Phase 2
216.00
Minerals Terminal and Conveyor Belt – Port of Callao
120.33
Jorge Chavez Airport – Phase 1
265.38
Jorge Chavez Airport – Phase 2
796.14
Logistic Zone – Callao
171.95
Lima North Truck Centre
32.50
Lima South Truck Centre
32.50 2,894.00
Total
Source: Author compiled from data Advanced Logistic Group, Plan de Desarrollo de los Servicios Logísticos de Transporte – Plan de Mediano y Largo Plazo [Development Plan for Transport Logistic Services] (Lima: Ministerio de Transportes y Telecomunicaciones and BID, 2014).
8.3.1 Lima’s Vital Corridors With regard to information and telecommunications infrastructure, Peru is lagging among the emerging and Latin American economies. Peru ranks 103rd (out of 144) in the Networked Readiness Index 2013.399 Regulation is a weak point, with Peru coming in 121st in ‘political and regulatory environment’ in the index. In fact, the Ministry of Transportation and Communications found that regulations inhibit the shared used of infrastructure, especially fibre optics, thus increasing access fees for final consumers. A recent Inter-American Development Bank document suggests that an increase of 10 percent in broadband services could generate a 3.2 percent increase in GDP and 2.6 percent increase in productivity.400 It also states that broadband penetration is not widespread in Lima and that considerable improvement is required. In fact, penetration levels in modern Lima districts such as Miraflores, San Isidro and Magdalena are 44.6 percent, 41.3 percent and 24.6 percent, respectively.401 One of Lima’s main weaknesses is the absence of well-articulated transport corridors and the existing poor transport infrastructure. Lima’s Metropolitan Municipality has commenced two projects to incorporate new urban land into the city. These projects are located at the northern and southern areas of the city; at the New City Park in Ancon– Santa Rosa and the New Productive City in Lurin, respectively. Both projects envisage the creation of complexes of industrial and technological parks. The New City Park of
217
Ancon–Santa Rosa will include 764 hectares for an industrial park hosting light and medium industry, and 105 hectares for hosting university centres and firms involved in research, development and innovation projects, and for offering incubation services for new business. Estimated investment for these two sub-projects amounts to USD 3,560 million, of a total of USD 7,480 million for the New City Park, which also includes the development of urban development projects. The New Productive City of Lurin has an area of 2,021 hectares which is being developed for light and large industries. In addition, 34 hectares have been zoned for technologically intensive industries.402 The industrial and technological park of the New Productive City in Lurin will generate complementarities with the two projected technological parks from the Pontificia Universidad Católica del Peru (PUCP) and Universidad Particular Cayetano Heredia (UPCH) in the southern district of Santa Maria del Mar.
Figure 8.7 Lima’s Complementary Vital Corridors
Source: IMP (Instituto Metropolitano de Planificación) Movilidad Sostenible – Plan Metropolitano de Desarrollo Urbano 2035 [Sustainable Transport] (Lima: Municipalidad Metropolitana de Lima – IMP, 2014)
Lima has the largest number of universities in the economy. Of the 120 universities in Peru, more than 50 are located in Lima and 8 of them are ranked among the 200 best universities in Latin America, according to the 2013 QS university rankings. Some of these universities like the PUCP have more than 90 laboratories and research centres in science, architecture, communications, social and administrative sciences and humanities. UPCH has four highly reputed institutes and several joint laboratories with entities such as IRD from France and the University of Berkeley from the United States. In the same way, the Universidad Nacional de Ingeniería has 48 laboratories and the Universidad
218
Nacional Agraria de La Molina has 52 laboratories.403 A number of public research institutes are located in Lima, such as the Institute of Agriculture Innovation, the International Centre of Potato, the Institute of the Peruvian Sea, the Technological Fishing Institute, the Geophysical Institute and the Nuclear Energy Institute. 8.3.2 Public Infrastructure Investment The ADB-CAF study404 found that while Peru has a projected infrastructure gap of USD 55 billion over the next 10 years, much of this infrastructure is in – or linking though – Lima; and significant action has already been taken to improve the city’s infrastructure. Lima is at the centre of Peru’s road system, and has the largest port and airport in the economy. However, its roads and public transportation system remain deficient, with the latter mostly served by privately owned units with an average age of 19 years.405 Facilities for collection of physical waste and the drainage system are also inadequate. In terms of other public services, the successful management of the electricity supply stands out, covering 99 percent of the population.406 The water system covers 93.1 percent of the urban population.407 Less favourable are the results for the communications infrastructure, where the penetration of cellular, fixed telephony and the Internet is still relatively limited, reaching 82.1 percent; 53.8 percent and 41.4 percent of the households; respectively.408 To resolve some of these limitations, major urban investments have been undertaken over the last decade:
Development of an urban bus rapid transit system and a metro as part of an integrated metropolitan transport system Restoration of the colonial city centre, a UNESCO-recognized World Heritage site, incorporating innovations like street greenery Development of a tourist seaside shopping and entertainment centre, Larcomar Development of major extensions to water supply and electricity networks into vast informal settlement areas Introduction of a land titling programme for the legalization of informal settlements, with World Bank support.
More than USD 12.5 billion have been invested in less than 10 years, much of it in in large-scale projects (Table 8.5). Examples of mega-projects in Lima include the expansion of the port and international airport at an estimated USD 1.5 billion, and the expected metro line 4 to connect the central business district with the airport. The city’s mega-projects are expected to boost GDP through the construction sector.409 These megaprojects should also enhance Lima’s overall competitiveness. Currently, the city still ranks low, at 77th place, in the ‘physical capital’ category of the Hot Spots index. To finance the infrastructure works selected by the municipality, the Metropolitan Lima Municipality counts on a fund for major investments called INVERMET. An office has also been established to promote private investment and public–private alliances among the regional and local governments and the private sector and/or the civil society. All
219
large municipality projects are expected to be evaluated according to the procedures of the Public Investment System (SNIP). Public bids are required for the participation of private investment in large municipality projects. Direct adjudication is only considered if no suitable bidders are identified. In the specific case of concession projects, contracts can be signed for as long as 60 years. The central government has also implemented a mechanism to encourage private firms to finance public works. Private firms can deduct up to 50 percent of their income tax via this mechanism. Projects can be presented by the firm or can be selected from the investment portfolio of the municipality. They must be cleared by the SNIP. Projects will need to present a conformity report once finished.
Table 8.5 Lima’s Mega-Projects Project
Status
Type of Project
Estimated budget (million USD)
Level of government involved
Metro de Lima (Line 1)
In progress
Public transportation
950
Central government
Metro de Lima (Line 2)
Announced, to be tendered in 2013
Public transportation
5,000
Central government
‘Metropolitano’ Segregated Bus Line
Delivered
Public transportation
300
Metropolitan government
Via Parque Rimac
In progress
Private transportation
700
Metropolitan government
Via Nuevas de Lima
Tendered
Private transportation
500
Metropolitan government
Southern expansion of the Paseo de la Republica express highway
Tendered
Private transportation
196
Metropolitan government
Javier Prado–La Marina– Paucett axis express highway
Announced
Private transportation
902
Metropolitan government
Huachipa potable water plant
Delivered
Water
190
Central government
Chillon potable water plant
Tendered
Water
54
Central government
Interceptor Norte Taboada wastewater plant
Delivered (partially)
Sanitation
165
Central government
Huascacocha water channel
Delivered
Sanitation
94
Central government
Upgrading of 5,000km of pipeline from the
In progress
Sanitation
5,200
Central government
220
metropolitan water and sewerage networks Nuachips potable water plant
Delivered
Sanitation
281
Central government
South Pier of Callao Port
Delivered
International connectivity
305
Central government
North Pier of Callao Port
Delivered
International connectivity
307
Central government
Jorge Chavez airport expansion
In progress
International connectivity
830
Central government
Source: L. Miranda Sara, G. Takano and C. Escalante, Metropolitan Lima and the Sustainability Challenge, Growing Cities in Growing Economies – City Report: Metropolitan Lima and Callao. (Bonn: European Association of Development Research and Training Institute and Chance2Sustain, 2014)
Despite the existing mechanisms for tax reductions for private infrastructure investments, it seems the financial sector does not support them decisively, as not all of them have convincing financial structures and returns. Lima’s financial institutions have much room for improvement. As a result, they are ranked less well than regional competitors, at 77th in the Hot Spots index. 8.3.3 Future Infrastructure Needs The Metropolitan Plan Lima 2035 set the investment priorities for the city based on certain criteria. First, Lima’s future configuration is that of a polycentric city. As mentioned before, the city has expanded into three differentiated centres. However, more expansion is being seen in the north, south and east, creating new centres for the city. One challenge this new configuration poses is the lack of a proper transportation network. The current transportation system has collapsed and infrastructure is not growing at the same pace as growing population needs. The plan considers major improvement in public transportation to decrease the average time of trips by 25 percent via the construction of massive transportation systems. The latter aims to reduce to less than half the number of the public transportation vehicles (from 38,000 to 16,500). In addition to enhancing transportation, the plan considers the provision of services to the new areas of development. The development of the industrial and technological parks in Ancon and Lurin will expand the economic development infrastructure necessary to create job opportunities and consolidate the new centres in the city. In addition to the development of new areas, the plan considers the rejuvenation of inner city areas so as to improve the quality of life of the population settled there.
221
8.4
SOCIAL AND ENVIRONMENTAL SUSTAINABILITY
8.4.1 Industrial Labour Market Reforms Labour market conditions are an important factor in social sustainability. Peru has ratified the International Labour Organization (ILO) Convention No. 2138 on the minimum age of workers, which imposes stiffer regulations against child labour. Workers aged 15 years and above qualify to work in non-industrial plants, and those 16 years and above can work in more high-risk jobs in factories and mines. Children between 12 and 14 years must get special permission to work at certain menial jobs while furthering their education. Minimum wages are protected by law. Only an estimated 15–20 percent of the labour force are unionized, making that group a rather privileged sector of the working class.410 Underemployment has been high for decades, and only 58.7 percent of Lima’s economically active population is fully employed.411 The problem is particularly serious among youths. The unemployment rate of young people aged 15–24 is two or three times that of older persons of working age. The labour participation of young persons is also determined by inequality. Those from poorer social backgrounds find it more difficult to enter and prevail in the labour market; and many of them remain marginalized, and are forced to engage in illicit activities. These conditions place serious difficulties on institutions that are dedicated to helping with labour formation, education and integration into the labour market.412 A quality of life survey of South American cities ranks Lima in 8th position.413 This low ranking can mostly be attributed to inadequacies in urban transport services and environmental degradation due to the informal growth of the city.414 In addition, there is an increasing perception that the city is becoming dangerous. In a recent 2014 survey, 82 percent of Lima inhabitants report that delinquency and insecurity are the main problems in the city, with 43.1 percent reporting that they have been victims of delinquency.415 The Metropolitan Lima Municipality facilitated several plans to promote employment via the formalization of informal commerce units. However, success has been limited. Even when some of these programmes have reduced significantly, and even eliminated, the cost of licenses, street vendors prefer to continue working informally.416 The Ministry of Work and Social Promotion also introduced programmes to promote employment, especially among young people. Jóvenes Productivos enhances employability through providing training in sectors such as agriculture, commerce, construction, industry, fishing, services, transportation, logistics and communications. The programme does so through strategic alliances with universities and training centres. The number of young people trained under this programme reached 14,000 in 2014.417 Another employment programme is Trabaja Peru, which aims to provide those in extreme poverty with temporary jobs in basic infrastructure projects. The programme generated almost 472,000 temporary jobs between January 2006 and June 2014.418
222
8.4.2 Environmental Management and Sustainability: Policies and Measures Greater Lima is very susceptible to the impacts of climate change. Peru is considered the one of the most vulnerable economies in the world to climate change because of low rainfall and water availability. Its rivers are being fed from the rapidly disappearing glaciers of the Andes mountains. Lima’s rapid urban expansion has also caused a reduction of agricultural land near the city. The contamination from inadequate waste disposal and industrial pollutants threaten the health and wellbeing of citizens. The ecological footprint of Lima has been calculated at more than 12 million hectares (or 1.47 hectare per inhabitant per year).419 Lima also suffers from poor air quality, with a 2014 World Health Organization (WHO) study suggesting that it has the worst air pollution in Latin America.420 According to the WHO, the amount of atmospheric dust present is over the permitted limit (14.1 tonnes per square kilometre per month against the benchmark of 5.1).421 The relatively poor performance in these areas is reflected in Lima’s ranking in the ‘social and cultural character’ and ‘environmental and natural hazards’ categories of the Hot Spots index – at 65th and 111th respectively. Lima’s state water company, Sedapal, has built large treatment projects to solve the water quality problems. The Taboada plant treats water for almost 4.5 million people from 27 districts, representing 56 percent of the city’s treated water. Its treatment capacity is 14 cubic metres per second. This plant recently received awards in the World Water Summit.422 The Chira treatment plant is under construction. Its treatment capacity will be 11.3 cubic metres per second and will benefit 2.6 million people from 18 districts. By 2015, these works are around 80 percent complete.423 Besides the infrastructure projects, the municipality has several initiatives to reuse water in parks and other green areas.
8.5
EFFECTIVENESS OF URBAN GOVERNANCE
The steady economic growth of Peru may be traced to reforms initiated by President Fujimori in the 1990s, and the continuing support for pro-business and pro-investment policies by subsequent governments. In particular, the government has been highly supportive of public and private investment in infrastructure for a range of sectors – transportation, telecommunications, energy, sanitation, airports and ports. At the same time, poverty reduction and income inequality are being tackled through social spending and measures such as increasing mining taxes.424 The Peruvian government has encouraged integration with the global economy by signing a number of free trade agreements, such as the United States–Peru Trade Promotion Agreement (PTPA) and Pacific Alliance, and through membership in groupings such as APEC. Lima is recognized as having a key role in pursuing these policies. In terms of city governance, which is the focus of the implementation of many of these policies, the ADB-CAF study found that the existing system of governance was not adequate to the task. The Metropolitan Lima Municipality is the body in charge of the
223
management of the city of Lima, although it shares this responsibility with the department (region) of Lima, which also has a regional government structure. Complicating this is the fact that Metropolitan Lima comprises 49 districts, 41 of which are under the Metropolitan Lima Municipality and the other 8 under the Callao Municipality. Added to that, both Metropolitan Lima and Callao have their own majors (governments) and each of the 49 districts have their own majors (governments) as well. The Metropolitan Lima Municipality faces several urban governance problems, including effective coordination with the government of the Lima Region. A municipality must coordinate action with the region, a factor that complicates local management due to overlapping mandates. The municipality is also organized in a combination of 15 divisions with very specific objectives and a narrow focus. Where projects do not fall within specific remits or across mandates, specialized institutes reporting to the Municipal Council are used. Coordination of effective service provision within this structure is a challenge.
8.6
SUSTAINABLE DEVELOPMENT PARTNERSHIPS
The Municipality of Lima fosters public–private partnerships via international and domestic agreements. This is the responsibility of the Office of International Technical Cooperation, under the Direction of Planning. Priority is given to agreements that provide funding because the Municipality lacks resources. Agreements should be of at least three years’ duration. One such agreement relates to the Alliance for the Cooperation of Euro-Latin American Cities project.425 This project promotes city cooperation to improve public policy and territorial development by exchanging experiences. The participating cities are Bello Horizonte, Lima, Medellin, Mexico City, Montevideo, Moron, Quito and institutions representing cities in France and Andalucia. This programme strengthens local authorities’ capacities in Latin America via network building with other authorities in the European region. Activities include sharing strategic participative internationalization plans and multi-actor agreement mechanisms for international cooperation. The programme promotes decentralized cooperation projects in three areas: sustainability; social inclusion; and territorial appeal. The Municipality of Lima also participates actively in the Network of South American Cities, a platform for South American integration and the building of a common identity. Ten cities participate in this network: Asunción, Bogota, Buenos Aires, La Paz, Lima, Mexico, Montevideo, Quito, Santiago and Sucre. The network supports three areas: environment and climate change, security and urban planning. Within this network, the Municipality of Lima has signed an agreement with the Spanish government to establish the Lima Workshop School, aimed at training artisans in iron works and woodworking to refurbish old houses in the city.
224
The Municipality of Lima is also active in fostering partnerships with the private sector. To recover areas in the inner city, small printing shops that worked without keeping any basic environmental standards have been relocated. Old colonial houses are offered to the private sector for restoration and use as restaurants, jewellery shops, tourism agencies, hotels and other businesses. These actions are revitalizing various inner city areas. The Municipality has also been active in positioning Lima as the gastronomic capital of Latin America, through its support of Mistura, an international gastronomic fair first organized in 2008. In 2014, it attracted more than 400,000 people over 9 days. Delegations came from Colombia, Bolivia, México, Costa Rica and Korea to learn about the development of the gastronomic model adopted in Peru. The International Gastronomic Congress, Qaray, attracts renowned international chefs.
8.7
POTENTIAL APEC PARTNERSHIPS
In 2012, Peru and Korea signed a five-year agreement to clean and remediate the Rimac River.426 This river, the most important in the city, is highly polluted by heavy metals released in the highlands, where mining operations abound, as well by the release of treated waters directly into the river stream. The City of Lima will directly benefit from this agreement. While the initiative is yet to yield major results, a technical commission has been established that integrates the National Water Authority, the Ministry of Mining and Energy, the Ministry of Agriculture, the Ministry of Production, the Municipality of Lima and the Municipality of Callao.
8.8
CONCLUSIONS
Over the last decade, Lima has enhanced its physical infrastructure through an impressive variety of public and private sector projects, but not fast enough to match the growing needs of the population. Improvements in the business climate and competitiveness factors have helped Lima to remain at the mid-level of worldwide rankings. The prospects for further expansion of productive projects from different sectors, ranging from the extractive industries to agriculture, manufacturing and services, as well as the development of transcontinental road and pipeline connectivity from Peru’s coast toward neighbouring Brazil, which is the biggest regional market, will favour the development of Lima and Peru, not only for transit, but also as a location for industrial development and trade. Lima’s challenge is to be better integrated with the rest of the world. Peru, as a member of the new Pacific Alliance (Mexico; Colombia; Peru; and Chile) and a member of APEC, will see significant benefits from participating in these regional groupings. Peru, and its capital city of Lima, will also be part of the new economic geography that will transform the South American region, and in the course of this regional transformation will see improved North–South and West–East connectivity toward its direct neighbours (Brazil;
225
Chile; Colombia; Ecuador; and Bolivia). Most of the international trade is conducted by sea or air transportation. Peru, and Lima, need to continue improving and expanding its airports and ports. Equally, more roads will be needed to bring products to airports and ports. The excessive traffic at the port and airport could be reduced not just by increasing capacity, but also by diverting some cargo to other ports and airports in the vicinity (e.g. to Pisco, two hours south of Lima by car). The key recommendations for the City of Lima are related to the need to expand the transport infrastructure, and to deal with environmental threats and the future impacts of climate change that are likely to threaten the development of metropolitan Lima. Further, Lima needs to pursue more actively a full-employment strategy, to engage the labour force and bring the benefits of its macroeconomic development to its citizens. Ensuring sustainable development would require that the city tackles the issues of jurisdiction and coordination that are hindering effective governance of various projects and urban services.
226
9. Metro Manila, Philippines Theresa Audrey O. Esteban and Michael Lindfield
9.1
INTRODUCTION
Metro Manila, the National Capital Region of the Philippines, is the seat of government and the most populous region of the Philippines. It covers an area of more than 636 square kilometres and is composed of the City of Manila and 16 other local government units (15 cities and one municipality) (). As the city has grown, the local government structure has led to a polycentric system of highly competitive cities in the metropolitan region. The impact of rapid urbanization on the city has been dramatic. Metro Manila is the centre of culture, tourism, the economy, education and the government of the Philippines. Its most populous and largest city in terms of land area is Quezon City, with the centre of business and financial activities in Makati (Photo 9.1). Other commercial areas within the region include Ortigas Centre; Bonifacio Global City; Araneta Centre, Eastwood City and Triangle Park in Quezon City; the Bay City reclamation area; and Alabang in Muntinlupa.
Figure 9.1 Map of Metro Manila
Among the 12 defined metropolitan areas in the Philippines, Metro Manila is the most populous.427 It is also the 11th most populous metropolitan area in the world.428 The 2010 census data from the Philippine National Statistics Office show Metro Manila having a population almost 11.85 million, which is equivalent to 13 percent of the population of the Philippines. 429 Metro Manila ranks as the most densely populated of the metropolitan areas in the Philippines. Of the ten most populous cities in Credit: Wikipedia Commons the economy, five are in Metro Manila. Although other cities, such as Cebu and Davao, are now growing relatively faster and reducing the primacy of Metro Manila somewhat, its dominance continues.430
227
/ Magalhaes.
Photo 9.1 Metro Manila
Credit: Paul Pacheco.
Much of Metro Manila is low-lying and in an active tectonic zone. More than 4 million people live in slum settlements.431 The area has significant traffic, waste management, governance and social problems. Despite this, it has demonstrated remarkable resilience in overcoming physical and economic disasters and challenges. This chapter explores some of the challenges, and the ways the city has gone about supporting sustainable development under difficult circumstances.
9.2
ECONOMIC ENVIRONMENT
The pre-eminence of Metro Manila in the economy is illustrated in its GDP, which equates to 37 percent of the Philippine GDP. This dominance has continued with the recent growth of business process outsourcing (BPO), taking advantage of the relatively good ICT infrastructure (compared to neighbouring Cambodia; Indonesia; and Thailand),432 the Filipino capacity in English, and the Philippines intermediary time zone between Europe and the North America. In 2014, Ericsson’s Networked Society City Index ranked Manila as the 8th most improved in terms of ICT maturity. The report also indicated that Manila has a higher performance in ICT usage compared to its ICT infrastructure. This means that while Manila still needs to improve its ICT infrastructure, the ICT service and usage is high. This gives the city opportunities to improve and innovate in this area, such as by using new mobile technologies for connectivity.
228
The economic reach of Manila goes far beyond the bounds of the formal boundaries of the National Capital Region. The effective economic region of Manila, the Mega Manila Urban Region, with a population of 26.4 million people, encompasses the surrounding provinces to the northeast and south. Figure 9.2 illustrates the Mega Manila Urban Region and its principal components.
Figure 9.2 Mega Manila Urban Region
Source: ADB (Asian Development Bank), Philippine Urban Sector Assessment (Manila: ADB, 2013).
9.2.1 Key Economic Sectors Since 2000, Metro Manila’s economy has grown by almost 10 percent annually compared to around 5 percent for the whole Philippine economy. Daytime population in Metro Manila increased from 13 million in 2000 to 16 million in 2010, as more people residing in adjacent provinces sought work in the metropolis. The key sectors of the economy are shown in the Table 9.1.
Table 9.1 Key Economic Sectors – Metro Manila, 2014 Sector
Regional GDP (million USD) 216
Agriculture Industry
19,256
Commerce and services
89,360
Source: Based on data from PSA (Philippine Statistics Authority), ‘2014 Gross Regional Domestic Product: Highlights’, 6 June 2016, http://nap.psa.gov.ph/grdp/2014/reglHighlights.asp
229
Metro Manila’s economy is dominated by the services sector which contributes over 80 percent to the region’s GDP. Nevertheless, its manufacturing sector is very significant, constituting over 20 percent of the Philippines’ industrial output, second only to the Calabazon region, itself within Mega Manila. 9.2.2 Trade Trade statistics for Metro Manila are difficult to disaggregate from statistics for the Philippines as a whole; but much of the economy’s imports and exports flow through Manila’s ports and airports. Electronic products account for a 40 percent share of total exports for the first semester of 2014 at USD 11.924 billion. Much of this is produced in the industrial estates of the Mega Manila Urban Region – particularly in the Calabazon and southern corridors. The ‘other manufacturers’ category follows with a share of 9.6 percent and receipts of USD 2.849 billion. Production in the manufacturing sector is concentrated in the Mega Manila Urban Region, so is the fourth ranked, machinery and transport equipment, with a share of 5.7 percent and export receipts of USD 1.692 billion. Of the leading exports, only the third-ranked, woodcrafts and furniture, and fifth-ranked, other mineral products, are not heavily concentrated in the area.433 With respect to imports, a similar picture emerges. At the top are electronic products with 22.3 percent of the total import bill at USD 7.010 billion. These imports are primarily destined for the consumers and factories of the Mega Manila Urban Region, as are the second-ranked, mineral fuels, lubricants and related materials with 21.7 percent share (USD 6.810 billion), the third-ranked, transport equipment, comprising 10.2 percent (USD 3.205 billion) and the fourth-ranked, industrial machinery and equipment, with 4.8 percent share (USD 1.497 billion). Figure 9.3 illustrates the primary sources and destinations for imports and exports for the Philippines.
230
Figure 9.3 Philippines Export and Imports
EXPORTS
Malaysia 2%
Others 16%
Japan 22%
Chinese Taipei 3% Thailand 4% United States 14%
Germany 4% Korea 5%
Hong Kong, China
Singapore 8%
8%
IMPORTS
China 14%
China 15% Others 30%
United States 9%
Korea 9%
Hong Kong, China 2% Germany 4% Thailand 5%
Japan 8% Malaysia 5%
Chinese Taipei 6%
Singapore 7%
Source: PSA (Philippine Statistics Authority), ‘Foreign trade statistics of the Philippines: 2014’, accessed 1 June 2016, https://psa.gov.ph/content/foreign-trade-statistics-philippines-2014
The top 10 trading partners posted a total trade value of USD 46.953 billion or 76.6 percent of the cumulative external trade for the first semester of 2014.434 Japan was the economy’s top trading partner, accounting for 15 percent of total external trade. The total export receipt was USD 6.676 billion while imports were valued at USD 2.530 billion – a trade surplus of USD 4.145 billion. Major exports were woodcraft and furniture (25.2% of total exports to Japan) and electronic products (20.3%). Major imports were electronic products (32.8% of total imports) and transport equipment (16.3%).
231
The People’s Republic of China ranked second, accounting for 14.3 percent of the total trade in the first semester of 2014. The total export receipt was USD 4.064 billion while the import bill was USD 4.714 billion – a trade deficit of USD 649.80 million. Major exports were electronic products (43.7% of total exports to China) followed by other mineral products (22.1%). Major imports were electronic products (19.8% of total imports from China), mineral fuels, lubricants and related materials (13.3%) and iron and steel (8.4%). The USA was the economy’s third largest trading partner in the first semester of 2014, accounting for 11.5 percent of total trade. The total export receipt was USD 4.184 billion while imports were worth USD 2.882 billion – a trade surplus of USD 1.301 billion. Major exports included electronic products (34.5% of total exports to the USA) and apparel and clothing accessories (13.7%). Major imports were electronic products (41.5% of total imports from the USA) and feed for animals (13.6%). 9.2.3 Investment Environment The strengths of the Mega Manila Urban Region are considerable, despite its position quite removed from mainland Asia and the major logistics hubs there. The Philippines has provided a stable economic base, useful investment incentives through the Board of Investment,435 and, with the exception of electricity, reasonable costs for infrastructure which, apart from transport, is reliable in the core economic centres described above. The Philippines’ high level of human capital is also an advantage. Its tertiary institutions turn out a large number of skilled, English-speaking professionals, able to adapt to work in many societies. Factory and industrial estate construction are the domains of the private sector, with the Philippine Economic Zone Authority providing approvals to a broad range of estate types, tailored for different types of investor. This policy is designed to allow flexibility to cater for a range of industries.
Physical capital
Financial maturity
Institutional effectiveness
Social and cultural character
Human capital
Environmental and natural hazards
Global appeal
30.0%
10.0%
10.0%
15.0%
5.0%
15.0%
5.0%
10.0%
71.4
54.0
92.0
100.0
85.8
95.0
76.5
66.7
35.7
70.0
46.0
100.0
100.0
87.8
77.5
69.8
87.5
43.2
Overall
Economic strength
Table 9.2 Economic Competitiveness of New York, Singapore and Manila, 2012
Category weight 1 3
New York Singapore
Manila 43.2 34.0 61.6 50.0 45.6 65.8 56.6 54.2 5.2 85 46.7 35.8 71.4 33.3 54.4 57.1 61.8 66.7 7.4 Median Global Source: Based on data from Economist Intelligence Unit, Hot Spots 2025: Benchmarking the Future Competitiveness of Cities (London: Economist Intelligence Unit: 2013).
232
The strengths of the Mega Manila Urban Region can be seen from Metro Manila’s ranking in the Economist Intelligence Unit’s Hot Spots index of 120 major cities (Table 9.2).436 Manila received an overall ranking of 85th globally, and 26th in Asia. Metro Manila ranked 33rd and 66th respectively in the ‘economic strength’ and ‘human capital’ categories. Within the Philippines, the National City Competitiveness Index ranks Metro Manila highest in most categories.437 Metro Manila is diversifying, with heavy or export industries migrating towards the Greenfield estates in the logistics nodes of Batangas and the Clark-Subic area, and higher value-added services concentrating in the Metro Manila core. Significant challenges remain in the areas of the reliability and cost of infrastructure, with congestion and high electricity costs being the two most significant factors. Declining levels of English in the overburdened Philippine state education system are also a problem. In some areas, such as in the BPO sector, skill shortages are emerging in the face of the phenomenal success of the sector (having surpassed India in the number of BPO ‘seats’), leading to a rising cost of labour in those sectors. Another strength of the Mega Manila Urban Region is the moderate transaction costs of running a business. The fees and taxes levied are not onerous, work permits are available for expatriate staff, labour legislation, in general, is not difficult, and a broad spectrum of office and factory accommodation is available. Significant challenges remain in the cost of doing business. Corruption is a major issue (see Figure 9.4). Improvements are required to approval processes, both in terms of transparency and processing times.
233
Figure 9.4 Doing Business in the Philippines: Major Issues and Barriers Poor public health Poor work ethic in national labour force Foreign currency regulations Access to financing Government instability/coups Insufficient capacity to innovate Inadequatly educated workforce Inflation Crime and theft Restrictive labour regulations Tax rates Tax regulations Policy instability Inadequate supply of infrastructure Inefficient government bureaucracy Corruption
0.8 1.3 1.3 1.7 2 2.4 2.5 3 3.2 6 6 7.7 9.2 16.2 17.2 19.3 0
5
10
15
20
Source: Based on from data from World Economic Forum, The Global Competitiveness Report 2008–2009 (Geneva: World Economic Forum, 2008)
9.2.4 Innovation and Business Support The Mega Manila Urban Region has significant strength in its capacity to support the development of local enterprise clusters and their supply chains, including financial assistance. The Philippine Competitiveness Council has been established to boost innovation and business support. Metro Manila is focusing on urban development as the effectiveness of local governments is considered an essential element of the Philippines’ competitiveness. The Philippine Competitiveness Council is actively seeking to address perceived infrastructure and governance shortfalls, and position Philippine urban areas as supporters of sustainable development, by providing an environment for higher valueadding activities to flourish. The Department of Trade and Industry has an extensive SME support system, partly funded by development assistance agencies. While such measures support existing industries, and foster higher quality production by those industries, most of them do not, of themselves, foster innovation. Support for innovation is a challenge that requires a commitment to world-class R&D and product development. Current government support for R&D, at 0.11 percent of GDP, is low. Innovation support is weak, as are some aspects of enforcement of intellectual property. Although largely domestic-focused, the financial sector also is a strength of the Mega Manila Urban Region. Despite a relatively shallow capital market, the Philippine financial sector is technically able to provide most forms of financial instruments and can link effectively to international capital markets. A significant part of the growth of the BPO industry is in providing ‘back office’ support to other economies, and such skills will form the basis for further development in the sector.
234
25
Financing the required strategic infrastructure is a challenge for the Mega Manila Urban Region, however, as local government collection of property tax is not effective. Even where the tax is collected from levied properties, the valuations are often very low; and this restricts financing options. The results of existing policies are shown in the ranking of Manila in the ’financial maturity’ category of the Economist Intelligence Unit’s Hot Spots index. It was ranked 32nd of 120 world cities. 9.2.5 Industry Clusters The Philippine Development Plan 2011–2016 states that the Philippine economic performance in terms of investment, exports and competitiveness has been unsatisfactory compared to its neighbouring economies. The manufacturing sector’s share in the economy’s GDP has reduced, and the gross domestic investment rate is declining.438 Strategies toward increasing the competitiveness of its industries include improvements in the business environment, raising productivity and efficiency, and improving the quality of goods and services. The Philippine Development Plan highlighted key priority areas to help accelerate economic performance and generate more jobs and opportunities for Filipinos. These include increasing productivity and efficiency through supporting micro, small, and medium enterprises; increasing market access; expanding industry cluster development and promoting competitiveness. To increase productivity and efficiency, priority will be given to development areas with the highest potential for growth and job creation, such as tourism, BPO, housing, electronics and infrastructure. One outstanding success for the Philippines has been the growth of the BPO market. Metro Manila is positioned at the centre of the BPO and IT industries, housing the most number of BPO and IT companies in the economy. Initially introduced as call centres or ‘voice’ services industry, the BPO industry has evolved to non-voice BPO functions such as finance, human resources, transcription services and administrative services.439 In 2007 and 2008 growth in the back office and knowledge process outsourcing industries generated revenues from USD 400 million to USD 830 million. In 2010, BPO industry revenues reached USD 9 billion, employing 530,000 fulltime employees (Figure 9.5).440 The Philippines has been recognized by the National Outsourcing Association of the UK as the ‘Offshoring Destination of the Year’ for the years 2007, 2008 and 2010.
235
Figure 9.5 Business Process Outsourcing (BPO) and Information Technology (IT), 2004-–2011
Source: Business Process Association of the Philippines as derived from the Philippine Development Plan 2011–2016
While the BPO industry has grown substantially, making the Philippines the number one global BPO destination in terms of pure voice-based BPO, IT services growth has not been as strong. As a result, India remains the leader in the global BPO industry due to its strength and capacity in IT, specifically software development. 441 For the Philippines to compete head to head in this sector, it needs to enhance its capacity in the IT sector.
Table 9.3 Operating Economic Zones in the Philippines, 2015 Operating Economic Zones
Number Operating
Total
The Philippines
Metro Manila
57
6
9%
IT Parks and Centres
209
127
61%
Medical Tourism Zone
2
1
50%
Manufacturing Zone
Economic
Source: Based on data from Philippine Economic Zone Authority, ‘List of economic zones, Philippines’ (2015).
Data from the Philippine Economic Zone Authority show a growth in the number of IT parks and centres in the economy, from 16 in 2004, to 209 in January 2015. One hundred twenty-seven or 61 percent of these IT parks and centres are operating in Metro Manila. Other industry sectors in Metro Manila are shown in Table 9.3. IT parks and centres occupy the highest percentage, and overall Metro Manila has the highest number of economic zones compared to other regions.442
236
9.3
STRATEGIC INFRASTRUCTURE
The Philippine Development Plan 2011–2016 states that the economy’s current gap in transportation infrastructure impedes development. The quality and quantity of infrastructure, including social services, have slowed efforts in poverty reduction and economic growth. In the last decade, Metro Manila experienced high and sustained economic growth, but infrastructure deficits have led to worsening road congestion. The World Bank estimates the costs to the economy around 8 percent of GDP annually.443 To address the worsening congestion, the central government and various city governments have implemented ad hoc measures to limit the number of vehicles on the road. However, the core issues underlying the problem have not been addressed. The solution lies in creation of new and better road networks and mass transit systems. In the transport sector, development of infrastructure was geared toward providing growth opportunities in the region and areas adjacent to Metro Manila, as outlined in the Medium Term Philippine Development Plan 2004–2010.444 The North Luzon Expressway Rehabilitation and Expansion Project, which was undertaken as a public–private partnership (PPP) and expanded to include the Subic–Clark–Tarlac Expressway, reduced travel time from Subic and Tarlac to Manila.445 This sped up the transport of agricultural products from the north, and manufactured and export/import goods from Subic to Metro Manila. The ongoing construction of the Tarlac–Pangasinan–La Union Toll Expressway, which connects to the Subic–Clark–Tarlac Expressway, will further relieve traffic congestion and reduce travel time. South of Metro Manila, the Batangas Port Development Project and the Southern Tagalog Arterial Road Expressway, will contribute to the economic development of Southern Luzon. While many of the transportation projects are geared toward encouraging the growth and development of regions outside Metro Manila, the megacity’s transportation infrastructure needs further maintenance and support. Opening the growth corridors in the north and south of Metro Manila would also mean congestion within the metropolis, which is the centre of trade and commerce. The Philippines does not have an integrated transport plan, nor is there coordination between the central and local government transportation plans. Metro Manila’s existing rail system needs further upgrades to enable the mass transit system to transport commuters efficiently. Expansion of mass transit systems such as bus rapid transit systems need to be considered in the development of a viable, well-coordinated transportation network. Current on-ground public-use vehicles, such as buses, jeepneys, private minibus, taxis, tricycles and pedicabs, are privately owned (either by companies or individuals) and are not government regulated. Flood control and drainage is one of the main problems in Metro Manila. Existing flood control infrastructure is not sufficient, especially for an extremely dense megacity. Unexpected increases in storm water discharge cannot be handled by the existing, poorly maintained, and outdated flood control infrastructure, and result in massive flooding, especially in the low-lying areas in the metropolis. The Metropolitan Manila Development Authority is tasked with operating and maintaining Metro Manila’s flood control infrastructure.446 Funding is also required by each local government unit in Metro Manila to construct flood control programmes and infrastructure, and coordinate with
237
government agencies, the Metropolitan Manila Development Authority and other adjacent local government units. Lack of funding has constrained the responsible organisations’ ability to provide effective outcomes. While the Metropolitan Manila Development Authority manages flood control in Metro Manila; sanitation, sewerage, and seepage is the responsibility of the Metropolitan Waterworks and Sewerage System. Lack of investment in sewage collection, treatment and disposal has adversely affected sanitation facilities in poor urban areas, and open defecation is still practised. The sector’s high capital requirements and low investment returns discourage private sector engagement in such ventures. As discussed briefly above, many aspects of the major logistics infrastructure and urban infrastructure remain a challenge, particularly freight and public transport, wastewater and solid waste services. Education and health services also are struggling to keep pace with population growth and the expectations of citizens. A core strength of the Metro Manila Urban Region, however, is the collaborative approach to developing infrastructure, that has been adopted in the recent past. The Philippines is implementing an effective PPP programme for infrastructure provision, much of which is focused on Metro Manila.447 PPP projects in Metro Manila are not limited to transportation but include social infrastructure, an example being the National Kidney Transplant Institute (NKTI) Hemodialysis Centre. The NKTI Hemodialysis Centre was established to provide an affordable and quality outpatient healthcare service to address the increasing incidence of kidney ailments among the young, and other workrelated degenerative disorders.448 The project involves a lease contract agreement with a private service provider, Freseneus Medical Care Philippines Inc. Under the agreement, the medical supplies, equipment and facilities necessary and related to hemodialysis are provided by Freseneus Medical Care Deutschland GmbH; and the technical support system, including NephroCare, technology transfer and the maintenance programme are provided by Freseneus Medical Care Asia-Pacific Ltd.449 Another PPP is the Civil Registry System–Information Technology Project (CRS-ITP), a build-transfer-operate (BTO) joint undertaking between the National Statistics Office and Unisys Public Sector Services Corporation.450 The multi-phase project involves the automation of document copy issuance, authentication, and certification of civil registry documents; the conversion of over 120 million civil registry documents into digital format; the establishment of CRS outlets nationwide; the building of a wide area network infrastructure for the communication requirements of the CRS outlets; the development of application and support systems that will run the CRS, and the redesign of business processes to support the CRS.451 This project aims to enhance public service delivery through expeditious processing of requests, shorter lines at the application and payment counters, and improved facilities for the convenience of the public. The CRS-ITP is also aimed at improving the integrity of processes, including minimizing cases of falsification and fabrication of civil registry documents. Moreover, the CRS-ITP will be able to address vital statistics production backlog of the National Statistics Office because of the enhancement of computing resources and capabilities.
238
9.3.1 Future Infrastructure Needs The Asian Development Bank’s (ADB) Asian Development Outlook 2007 identified inadequate infrastructure and a resulting poor logistics network as critical constraints to investment and growth. A strong and well-maintained infrastructure stimulates the business environment, improves productivity and enables economic growth. Infrastructure investment in Metro Manila must be focused on increasing productivity through improvements in logistical networks. This includes transportation, communications and power. Inefficient transport networks and unreliable power supply and communications constrain overall growth, and must be addressed, especially if Metro Manila is to compete globally and side by side with neighbouring Southeast Asian economies, such as Singapore; Hong Kong, China; and Malaysia. Improvements in the mass transit system and connectivity must be prioritized in Metro Manila. The increasing number of vehicles and poor road networks have increased travel time within the megacity. The need to improve mass rail transit is necessary to ease the congestion. Further, there is need to develop a Metro Manila transportation plan that connects the mass rail transit to other mass transit systems. An allocated lane for a bus rapid transit system is an effective way to shuttle more commuters from one point in the city to another. There is a need to phase out current public-use buses and jeepneys that traverse the metropolis and occupy three to four lanes of the roadway. Further, the government must rethink its position on public-use vehicles, regulation of which is inadequate. Apart from road improvements, flood control infrastructure must be prioritized, as flooding in Metro Manila immobilizes the city. A coordinated flood control system must be developed that takes account of current flood control infrastructures of the local government units, their infrastructure needs, and the greater whole of the megacity. Standalone projects, as currently operate, fail to recognise that flooding transcends city boundaries. 9.3.2 Operation and Maintenance of Infrastructure A lack of coordination between local governments, asset management systems, and local government budgets which are constrained by insufficient and ineffective revenue mobilization, have all militated against effective operation and maintenance (O&M). Old assets are often rebuilt once they become almost unserviceable from lack of maintenance; this is environmentally and financially inefficient. Manila’s cities also need to increase their resilience in the face of clear and present threats from both climate-related (e.g. typhoons) and other natural hazards (e.g. earthquakes given that a major fault runs through the centre of the city). Manila’s BPO industry depends, except for short-term and localized failures of electricity, on resilient infrastructure to deliver its skilled workers to BPO centres, and link them to the outside world. Its manufacturing centres are increasingly vulnerable as they move up the value chain and their integration into global supply networks increases. There is, therefore, an urgent need to future-proof against disruption to infrastructure supply and network systems, particularly in respect of the vulnerability of the city to typhoons.
239
Utilities need to undertake comprehensive asset management planning to reduce the possibility of future failure and ensure that services are re-established as soon as possible if failure does occur. 9.3.3 Infrastructure Partnerships PPP programmes have been adopted in the Philippines as an important strategy to accelerate economic investment and infrastructure. Section 20, Article II of the 1987 Philippine Constitution, states: ‘The State recognizes the indispensable role of the private sector, encourages private enterprise, and provides incentives to needed investments’, thereby supporting private investment and partnerships that will expedite progress in the economy. Two other laws further support this initiative: The Government Procurement Reform Act (RA 9184) for the procurement of goods, supplies and services; and the Philippine Build Operate Transfer (BOT) Law (RA 6957). RA 6957 has subsequently been amended to RA 7718 to broaden the coverage of the BOT programme. The PPP Centre was established in 2013 to spearhead the PPP programmes and activities. In 2014, the PPP Centre announced that at least five projects under the agency’s programme would be completed by the end of the Aquino administration.452 Data from the Department of Budget Management show a total of 98 PPP projects in the Philippines. Thirty-two of these projects have been completed. An example is a concession agreement with the Manila Water Company and Maynilad Water Services, Inc. as part of the Metropolitan Waterworks and Sewerage System Privatization Project (see Box 9.1) Sixty-six of the projects are ongoing and others are still to be turned over to the Department of Budget Management. Most of these projects are in, or focus on, Metro Manila. This both reinforces the city’s role as the focal point of the Central Luzon corridor but also helps bring markets of the capital to peripheral regions. The most prominent PPP infrastructure projects in Metro Manila are the Metropolitan Waterworks and Sewerage System Privatization Project and the North Luzon Expressway Rehabilitation and Expansion Project. Recently, it was announced that PPP projects in Metro Manila worth PHP 800 billion (USD 17.5 billion) will be rolled out in 2015.453 Most of these projects will be for the transportation sector. Projects include the Daang Hari–SLEX Link Road Project; Ninoy Aquino International Airport Expressway (Phase 2); modernization of the Philippine Orthopaedic Centre; an Automatic Fare Collection System (AFCS); the Light
240
Rail Transit Line 1 Cavite Extension and O&M; and the Integrated Transport System– Southwest Terminal project. Box 9.1 Public–Private Partnership (PPP): Metropolitan Waterworks and Sewerage System, Manila In 1997, the Metropolitan Waterworks and Sewerage System was first privatized through a public bidding with the area of operation divided into two concession zones (East Zone and West Zone). The division was to establish benchmarking, even the balance of power between the concessionaires and the regulator, and ensure competition in the bidding process.
The aim of the PPP is to: (i) increase capital investment and operational efficiencies that will expand service coverage; (ii) relieve the government of the financial burden needed to improve the facilities; (iii) ensure 24-hour water supply; (iv) improve sewerage services; and (v) reduce non-revenue water to an acceptable level. The East Zone was won by Manila Water Company, Inc. while the West Zone was awarded to Maynilad Water Services, Inc. The scope of the concession agreement is to operate, develop, manage, maintain and upgrade water and sewerage services for 25 years commencing on 1 August 1997. The agreement specifies service obligation targets and performance standards. Service Levels The concessionaires are successfully providing water to their respective zones. Manila Water has expanded its pipeline network to 4,156km serving 6.2 million people; and Maynilad has decreased its non-revenue water to 32.7 percent and provides 24/7 uninterrupted water service to 1.2 million households. There is criticism that the service provided is inequitably distributed and that the water tariff is beyond the ability of the poor to pay. However, in terms of performance, the two concessionaires are achieving their targets of 100 percent water service for their concession zones. Both are also working toward the rehabilitation and construction of sewerage lines as part of the concession agreement. Profitability While both concessionaires have continued to serve the residents in the east and west zones of the megacity, Manila Water is more successful and stable. The International Finance Corporation reported that Manila Water made profits two years after the concession award and has since expanded its network and clients. Maynilad, on the other hand, has followed a slow and painful path in recovering their investments. In 2005, a Debt and Capital Restructuring Agreement was implemented aimed at rehabilitation of Maynilad. The plan provided the Metropolitan Waterworks and Sewerage System with the option to subscribe to 84 percent of the equity in Maynilad. In 2007, the Metropolitan Waterworks and Sewerage System conducted a bidding process for the equity, turning over the operations and administration of Maynilad from its earlier consortium to an all-Filipino partnership led by DMCI Holdings, Inc. and Metro Pacific Investments Corporation. The new Maynilad administration acquired USD 240 million of foreign debt and 70 percent non-revenue water. Almost two years after the new Maynilad administration took over, the concessionaire could pay its debts, develop strategies to reduce non-revenue water, and lay out a PHP 33 billion (USD 715 million) capital expenditure programme for 2007–2015.
241
9.4
SOCIAL ENVIRONMENT
The heavy reliance on the private market to provide social goods and services, in particular, housing, has led to social inequalities. Private developers select prime locations with sufficient access to services for development for high-income residents while less suitable areas are left for low-income residents. The net effect of this social polarization is the lack of physical integration of the city.454 This is observable in the welldesigned road networks of high-income subdivisions that are de-linked from the main city or municipal road networks. This trend carries through to infrastructure provision, for example, water, sewerage and drainage systems for high-income neighbourhoods are not integrated with a city network. A case in point is the storm water storage constructed under the new town development Bonifacio Global City. The water storage can accommodate 22 million litres of water, which take in the flood waters in the area. However, the adjacent City of Taguig does not have complementary systems, and poorer neighbourhoods in the city suffered severe flooding during Typhoon Ketsana. Social services are also of better quality in high-income residential areas. The influence of the residents in local government can be seen in the provision of social and infrastructure services – streets, road networks, street lights, garbage collection, and security. Land-use planning and infrastructure development in Metro Manila are thus widely regarded as catering more too high-income residents. Such underinvestment in citywide infrastructure leads to high social and economic costs, much of which is borne by lower income groups. 9.4.1 Labour Market and Reforms Sustained high economic growth in recent years has begun to translate into stronger job creation. The latest Labour Force Survey in October 2014 reported that net job creation reached over 1 million. Furthermore, unemployment has fallen to its lowest rate in 10 years: to 6 percent, from 6.4 percent the previous year. The bulk of job creation was in the services sector, with 675,000 jobs, although most of these were in the informal sector. Another 294,000 jobs were created in the industry sector, while only 77,000 were created in agriculture, as agricultural output contracted in roughly the same period. The quality of employment remains a challenge as the rate of underemployment increased from 18 percent to 18.7 percent. The reduction in poverty incidence between the first half of 2012 and 2013 indicates that growth is becoming more inclusive.455 The reduced contribution of the manufacturing sector to the Philippine GDP and a decline of gross domestic investment have placed the economy in a weak and disappointing competitiveness position compared to its Southeast Asian neighbours. The lack of infrastructure, the poor business environment and the level of labour force skills have diminished the Philippines’ competitiveness and its attractiveness to new investment (both local and foreign). To remedy this, the economy aims to increase productivity by supporting industries with high growth potential. BPOs, for example, could contribute estimated revenues of up to USD 25 billion by 2016.456 Metro Manila is where much of the BPO activity is taking place. The area has a growing number of BPOs and IT parks and centres; and most of the 770,000 BPO workers in the Philippines are found there.457
242
Table 9.4 Employment by Sector, Philippines Major industry group All industries Agriculture Agriculture, hunting and forestry Fishing Industry Mining and quarrying Manufacturing Electricity, gas and water supply Construction Services Wholesale & retail trade, repair of motor vehicles, motorcycles and personal and household goods Hotels and restaurants Transport, storage and communications Financial intermediation Real estate, renting and business activities Public administration & defence, compulsory social security Education Health and social work Other community, social and personal activities Private households with employed persons Extraterritorial organizations & bodies
2008
2009
2010
34,089 12,030 10,604
Average 35,061 12,043 10,582
Jan 34,262 11,846 10,446
Apr 34,997 12,313 10,841
Jul 35,508 11,940 10,476
Oct 35,478 12,072 10,563
Average 36,047 11,974 10,505
Jan 36,000 11,804 10,346
Apr 35,413 11,512 10,073
Jul 36,285 12,317 10,835
Oct 36,489 12,261 10,765
1,426 5,048 158
1,461 5,098 166
1,400 4,856 152
1,472 5,088 166
1,464 5,273 177
1,509 5,154 169
1,469 5,394 199
1,458 5,323 193
1,439 5,487 212
1,482 5,391 193
1,496 5,373 197
2,926 130
2,894 142
2,849 134
2,846 130
2,947 145
2,937 160
3,031 150
3,009 157
3,063 137
2,995 140
3,057 164
1,834 17,011 6,446
1,891 17,925 6,736
1,721 17,560 6,635
1,951 17,595 6,681
2,004 18,294 6,725
1,888 18,250 6,901
2,014 18,680 7,040
1,964 18,874 7,063
2,075 18,414 6,885
2,062 18,577 7,050
1,955 18,855 7,161
953
1,010
988
976
1,064
1,012
1,063
1,104
991
1,034
1,121
2,590
2,679
2,660
2,628
2,694
2,735
2,721
2,736
2,741
2,697
2,709
368
369
337
389
376
375
399
384
383
419
411
953
1,064
1,044
1,023
1,090
1,100
1,147
1,120
1,061
1,164
1,243
1,676
1,749
1,659
1,794
1,772
1,771
1,846
1,823
1,959
1,831
1,771
1,071 392
1,138 421
1,157 435
1,068 408
1,157 428
1,168 412
1,175 450
1,146 432
1,156 447
1,234 456
1,165 464
833
877
857
907
876
868
913
850
984
862
855
1,729
1,880
1,785
1,718
2,110
1,908
1,925
2,114
1,804
1,829
1,954
1
2
3
3
1
2
2
3
1
1
Source: Based on data from NEDA (National Economic and Development Authority), Philippine Development Plan 2011–2016 (Pasig City: NEDA, 2011).
The Philippine Development Plan 2011–2016 noted that the agriculture and fishery sector remains a major contributor to employment and job creation. However, the services sector is now the largest and fastest-growing. In this case, Metro Manila’s advantage is to
243
strengthen these sectors through investing in knowledge and skills to enhance the quality and quantity of its workers.458 Another sector which can be further explored in Metro Manila is the micro, small and medium enterprises (MSMEs). In 2010, MSMEs contributed to 47 percent of the total employment in the economy. Significant reforms are required, however, to enable the services industries to become more competitive regionally. Metro Manila, which has the highest number of industries and services, must be able to attract more investment, both local and foreign, to these sectors. 9.4.2 Social Sustainability: Policies and Measures Despite the consistent growth, social challenges have grown. The Philippines is a lowermiddle-income economy, historically characterized by an uneven distribution of assets and unequal access to opportunities, resulting in one of the highest income inequalities in the region. Intra-urban inequities in Philippine cities are high (Figure 9.6). Manila’s Gini coefficient is 0.41 – above the international alert line for inequalities, raising concerns of negative social, economic and political consequences. It is, however, not as unequal as some rapidly developing cities in China; Thailand; and Viet Nam.459 Economic growth has been insufficient to provide sustainable employment for lowerskilled, low-income and vulnerable groups. Unemployment rates have been in decline since 2003 but are still high. With unemployment at 12.8 percent, Metro Manila displays a higher unemployment rate than the national average of 7.4 percent. As indicated, progress in reducing unemployment is hampered by the pace of economic growth, which is insufficient to absorb all new labour force entrants. Service sector opportunities are characteristically skills oriented and inadvertently increase inequality of access for disadvantaged groups. Greater effort is required to link educational attainment, vocational training and skills development for employment creation in the manufacturing and industrial sectors, to reduce regional disparities and promote inclusive growth.
244
Figure 9.6 Intra-urban Region Inequity (Gini Coefficients)
0.45
0.44
0.44
0.44
0.44
Gini Coefficient
0.43 0.42
0.42 0.41
0.41
0.4
0.4 0.39
0.38
0.38 0.37 0.36 0.35 Manila
Quezon City Caloocan City
Pasay City Cebu City
Davao City Zamboanga
Source: PSA (Philippine Statistics Authority), ‘2003 family income and expenditure survey (final results)’, accessed 1 June 2016, https://psa.gov.ph/content/2003-family-income-and-expenditure-surveyfinal-results
Housing is a challenge for Metro Manila – and indeed the Philippines more generally. The housing market has become a source of social exclusion. The production of affordable housing is well below needs, leading to crowding and the emergence of slums. Policies to relocate squatter households to the periphery of Metro Manila have been counterproductive and ineffective. The lack of any effective low-income housing process is a potential source of social instability. The results of existing policies are reflected in the ranking of Manila in the ‘social and cultural character’ category of the Economist Intelligence Unit’s Hot Spots index. The city received a score of 65.8, positioning it at 60th out of the 120 ranked cities. 9.4.3 Environmental Sustainability Metro Manila’s rapidly growing population and urban sprawl, which continues to extend to the nearby suburban areas of Cavite, Bulacan and Laguna, challenges the megacity’s natural and built environments. This expansion results in the conversion of remaining open areas of the city and agricultural lands in surrounding provinces to residential, commercial and industrial areas. Current agricultural lands cannot cope with the increasing needs of the growing population; and there will be pressure to convert forest lands to agricultural use.460 As more and more agricultural lands are being converted to residential and industrial uses, the economy is becoming increasingly vulnerable to food security issues. Further, the conversion of forest lands affects the ecosystem, which can result in soil degradation and
245
increased risks during natural disasters, e.g. flooding. Also, forests in the Mega Manila Urban Region are being degraded by informal settlements. The Philippine Agenda 21, a blueprint for the implementation of sustainable development, was adopted in September 1996. The Agenda is based on the imperatives of the situation in the Philippines and the emerging landscape for sustainable development; and looks at the different ecosystems (coastal/marine, freshwater, upland, lowland and urban). However, the Agenda, which has been in existence for almost 20 years, needs to be reviewed to address current sustainability issues. For example, the action agenda on urban ecosystems needs to be updated to reflect the environmental issues facing Metro Manila today. Environmental issues are a major challenge for the Mega Manila Urban Region, and include recurrent flooding, traffic congestion, air pollution, water pollution, sea-level rise and land subsidence. Manila is the largest urban agglomeration in the world at high risk of all the main disaster types – cyclones, floods and earthquakes. Encroachment along riverbanks and fragile coastal areas, lack of appropriate sewage disposal facilities, inadequate sewerage connections, and improper waste disposal, all cause environmental degradation of the waterways in the Philippines, increasing potential health risks to residents. Similarly, the deficit in urban infrastructure facilities further aggravates the vulnerability of coastal settlements to flash floods caused by upland deforestation and soil erosion. Water supply, sanitation, flood control, and solid waste management systems are inefficient and inadequate compared with demand. As such, the urban sector requires continued assistance in upgrading infrastructure facilities.461,462 In 2011, a Water Security Legacy Plan was laid out by the Metropolitan Waterworks and Sewerage System. The plan encompasses strategies to: improve water infrastructure, in particular through securing and maximizing Angat Dam; identify short-term water sources; and reduce non-revenue water by exploring new technologies and groundwater management.463 Angat Dam supplies 95.5 percent of Metro Manila’s water, with the rest taken from Laguna Lake and groundwater sources.464 However, the megacity’s growing population makes it hard for the Angat Dam to continue to meet demand. In the last five years, the dam’s water levels have fluctuated, particularly due to recurring summer dry spells, and reached critical levels of below 180 metres. In 2010, the Angat Dam reached an all-time low of 157 metres; the dam’s normal high water level is 212 metres. The Angat Dam and Dyke Strengthening Project, approved in September 2012 as part of the Water Security Legacy Plan, aims to increase water storage while managing the water level and mitigating flooding in surrounding towns.465 The project commenced work in July 2015 and is one of the key infrastructure projects for the Metropolitan Waterworks and Sewerage System. The project represents a significant step, as the Angat Dam and Dyke has not had any major rehabilitation work done to it for more than four decades. The expansion of Metro Manila has diffused the land-use pattern of the metropolis, increasing the commuting distance for many residents and raising the demand for basic services and infrastructure. The transport sector has been lagging in addressing current issues of traffic, public transportation, and road networks. Local transportation that use routes in and around the city vary from pedicabs and tricycles to jeepneys, buses and taxis. There is no integrated transportation system and these different types of public-use
246
vehicles clog the road networks of the city. The rail systems, while operational, are also in need of an upgrade, having experienced frequent breakdowns and service disruptions since 2010. With the ongoing expansion and population growth of Metro Manila, the metropolis continues to choke on its carbon dioxide emissions, due to the growing number of transportation and industries. The Philippines was ranked 39th in the world in 2005 in terms of overall greenhouse gas emissions, with about 142 million tons of carbon dioxide equivalent, excluding emissions due to land-use change. Based on trends in emission growth, policy conditions affecting primary energy supply and demand, and estimated abatement costs, the greenhouse gas emission reduction priorities should be in the power and transport sectors which account for 36 percent and 32 percent respectively of total energy carbon dioxide emissions (see Figure 9.7). Old technologies are a significant part of the problem. In the transport sector, 3.5 million registered motorcycles and tricycles release 10 million tons of carbon dioxide and consume close to USD 3 billion worth of fuel per year. New transport technologies like e-jeepneys are an option to mitigate transport emissions. There is need to redesign the transportation system to include an effective bus-rail-transit system integrated into the existing rail system. The current jeepney and bus routes should be phased out slowly to make way for the bus rapid transit and feeder system that will help decongest major thoroughfares. Pedestrianization and the development of pocket parks can also help mitigate transport emissions and encourage pedestrians to walk, cycle and use public transportation.466 The poor outcomes of existing policies are shown in Manila’s low ranking of 94th in the ‘environmental and natural hazards’ category of the Economist Intelligence Unit’s Hot Spots index.
247
Figure 9.7 Baseline Greenhouse Gas Emissions Estimates for the Power and Transport Sectors, Philippines
Source: World Bank, A Strategic Approach to Climate Change in the Philippines: An Assessment of LowCarbon Interventions in the Transport and Power Sectors – Final Report (Washington, DC: World Bank, 2010), Figure 7.
9.5
EFFECTIVENESS OF URBAN GOVERNANCE
The institutional structure for delivering urban services in the Philippines is complex (Figure 9.8). Compounding this is the fact that there is no overarching structure for the governance of the Mega Manila Urban Region. In Metro Manila, which was designated a special development and administrative region comprising 17 cities and municipalities in 1995, the Metropolitan Manila Development Authority (MMDA) has a key role. The policymaking body of the MMDA is the Metropolitan Manila Council, which is made up of all the mayors of the constituent local governments, the president of the Metro Manila Vice-Mayors League, the president of the Metro Manila Councillors League, and heads of Philippine government agencies. The MMDA is financed from a seed fund; budgetary appropriations from the Office of the President; fines, fees and charges; and contributions from constituent local governments. The MMDA coordinates between the 17 cities and municipalities of Metro Manila on the design and implementation of medium- and long-term development plans. It also has regulatory and supervisory authority over metro-wide services.467 While the establishment of the MMDA has introduced a level of central planning, monitoring and coordination, significant governance gaps remain: [The MMDA] prepares comprehensive development plans that are neither officially adopted nor followed. Municipalities and cities issue zoning codes and regulations that are not coordinated with metro-wide plans. MMDA is supposedly in charge of transport and traffic management, but the central government controls the financing,
248
construction and maintenance of roads and bridges. MMDA is in charge of garbage disposal, but provinces and municipalities will not allow it to set up sanitary landfills or dumps within their territories. MMDA handles urban renewal, but housing funds are controlled by the National Housing Authority and other agencies. MMDA has no control over the water system, which has been privatized, nor over the design and construction of rapid transit systems and toll roads, which have also been privatized. 468
These structural and jurisdictional issues are major stumbling blocks to effective governance of the metropolitan region.
Figure 9.8 Institutional Structure for Delivering Urban Development
Source: GHK International, TA 7062: Preparing the Philippines Basic Urban Services Sector Project, Final Report (Manila: ADB, 2009), 11.
9.6
PARTNERSHIPS FOR SUSTAINABLE DEVELOPMENT
Ideally the MMDA should lead the overall urban development of Metro Manila; and this in turn should guide the 17 member cities and municipalities in forming their development plans. However, since its creation, the MMDA has failed to come up with an overall development plan that would integrate the functioning of each of the 17 member cities
249
and municipalities into a working National Capital Region. It was only in 2012 that the MMDA began creating a Metro Manila Master Plan called Green Print 2030. Each city and municipality across the Philippines is mandated to develop a Comprehensive Land Use Plan (CLUP) to guide its growth. These CLUPs are anchored on the Philippine development plan and regional plans. In Metro Manila, there is no regional development plan or Metro Manila Development Plan; and each of the 17 cities and municipalities in Metro Manila created its own CLUP anchored on the Philippine development plan. Thus, the CLUP of any one of the cities and municipalities is not integrated with the rest of Metro Manila. Each city’s or municipality’s CLUP also does not complement that of other cities within the megacity. Each local government unit can partner with private corporations for various projects within its city. If Metro Manila is to go forward with its Green Print 2030 plan, it needs to reassess the value of the MMDA as a governing body for the whole of the megacity. At present, the MMDA has no direct control of the budget for planning and implementing metro-wide projects, nor does it have direct control of operations and management; there is thus a need for its role to be clarified. A stronger partnership between the MMDA and the various agencies and cities in Metro Manila is needed, ideally, with coordination of key infrastructure across the Mega Manila Urban Region clearly defined. 9.6.1 Metro Manila Green Print 2030 Strategy The Metro Manila Green Print 2030469 is a means to integrate the 17 cities and municipalities within the megacity. The plan has three main parts: the zoning or land-use plan; the street and transportation network plan; and the green open space plan. At present, the largest city in Metro Manila, Quezon City, has anchored its plan, the Quezon City Central Business District Plan, to Green Print 2030. The Plan is also called Triangle Park on account of the shape of the area and its location in the city’s West Triangle District (Figure 9.9). It showcases a CBD that is a walkable, mixed-use community near transportation hubs. Quezon City hopes that their initiative will serve as a model for Metro Manila.
250
Figure 9.9 The Triangle Park, Quezon City (Proposed Plan)
Source: Quezon City 2015.
The World Bank is supporting the development of the Green Print 2030. This strategic partnership with the World Bank allows the MMDA to strengthen its capacity and role in metropolitan planning. An area for consideration under Green Print 2030 is partnering with civil society and civic organizations. Such organizations can be key advocates of inclusive city development; and they can be strong allies and watchdogs in formulating and implementing development plans. However, such partnerships require structures. The Philippine Business for Social Progress that partners with local governments and poor communities to upgrade housing and local areas is an example of such a partnership. Its project is called STEP-UP (Box 9.2). The potential for effective partnerships includes Quezon City, home to the Philippines’ leading universities, and a network of non-government organizations. In particular, the University of the Philippines School of Urban Planning and Regional Development, and the College of Architecture are key resources. The involvement of academe could spark intellectual debate and knowledge exchange between experts, as well as among the private and public stakeholders in and around the city.
251
A report by the Urban Land Institute, an international land development NGO with a branch in Manila, has called for the application of the ‘Ten Principles for Sustainable Development’ in Metro Manila’s New Urban Core. It also advocates a similar approach to maximize the use of partnerships and engagement with a broad range of stakeholders. The institute has also suggested the creation of an Urban Development Commission to formulate and implement a Metro Manila master plan, along the lines of those developed by other organizations in, for example, Hong Kong, China (Harbourfront Commission), Vancouver (Urban Design Panel), and Singapore (Urban Redevelopment Authority). Box 9.2 Private Sector Partnerships for Urban Poverty Reduction: STEP-UP STEP-UP is a pilot project that involves the private sector in the upgrading of slum communities in Metro Manila. The project is NGO-led, and has ADB assistance to upscale an existing programme of the implementing NGO – the Philippine Business for Social Progress. The project uses a participatory process to plan and implement project activities in the participating communities. The communities in question are squatters living on both government and private land and, in some instances, households which have bought or are buying their land under the Government’s Community Mortgage Program. The Philippine Business for Social Progress is the Implementing Agency for 2014. The project was designed to demonstrate that a structured and significant programme of slum upgrading can be funded under corporate social responsibility programmes in Metro Manila. The ADB assistance targets 23 poor communities, or about 35,000 people, in Metro Manila, 60 percent of whom are extremely poor. The project: (i) promotes demonstrable strategic business sector involvement in integrated urban poverty reduction programmes through a focused, strategic framework; (ii) creates a strong multi-sector coalition capable of advocating urban poverty programmes and policies in a sustainable manner; (iii) under the ADB-funded component of the project, improves living conditions of 5,823 households; and (iv) undertakes an integrated urban poverty reduction programme, including a risk reduction and management component.
9.6.2 Potential APEC Partnerships A potential area for APEC participation, in terms of improving one of the largest cities in the world, is to encourage the creation of city stakeholder organizations geared toward sustainable urban planning and renewal. These organizations can act as catalysts for development within their cities and create dynamics within the city to involve more people in achieving the overall vision of the Green Print 2030.470 APEC can also participate by encouraging the development of Green Print 2030 and making the creation of this plan more transparent and available to various stakeholders. PPPs are mainly strong, with the government relying on such partnerships to meet infrastructure needs. An existing PPP Centre overlooks this function and is operating quite well. What is required, however, is stronger stakeholder participation, through the creation of active, dynamic, knowledge-based urban planning and renewal organizations
252
that have a stronghold in their cities. A balance between the partnerships of local government with private companies and civil society will be beneficial to the implementation of a sustainable urban development plan. Engagement with stakeholders is not just the practice of good urban governance but also encourages acceptance of new developments in the city. An example of a strong civil society organization that could be replicated in Metro Manila is the San Francisco Planning and Urban Research which works alongside the academe, government and various networks in creating a liveable and sustainable urban environment in San Francisco. It is a member-supported non-profit organization involved in urban issues in that city. In addition to development planning activities, San Francisco Planning and Urban Research carries out advocacy work and knowledge and information dissemination. The organization has a strong research arm that makes it a well-respected planning group.
9.7
CONCLUSIONS
While efforts within the Mega Manila Urban Region to put in place the supports needed for sustainable development are considerable, significant challenges remain, particularly in the areas of fiscal, social and environmental sustainability. The Mega Manila Urban Region is turning into an urban region almost of the scale of Shanghai, but lack of modern transport infrastructure counteracts this economic dynamism. Lack of investment has generated diseconomies that, in many instances, counterbalance agglomeration benefits. Key lessons include recognition of the significance of central and local governments working together to build the enabling environment for service sector development and essential infrastructure. Several areas of challenge need to be addressed. Innovation systems need to be boosted. Significant investment in human capital development and support to SMEs are necessary to enhance productivity, support higher value-adding industry, and to absorb the lowerskilled. Strategic infrastructure, particularly transport, social and environmental infrastructure, needs to be further developed as a high priority. In terms of governance, there is a need to coordinate better the response to these challenges across public and private sectors. A strengthened and well-resourced National Competitiveness Council could form the basis of a focal point to foster innovation through coordination of development programmes in the Mega Manila Urban Region across the three dimensions of sustainable development (economic competitiveness, social development and environmental improvement).
253
10. Mexico City, Mexico Fernando Ramirez and Florian Steinberg
10.1 INTRODUCTION Mexico has the second-largest economy and population in Latin America, after Brazil. For the past few decades, Mexico has been trying to lift its economic performance, as a partner to the North American Free Trade Agreement (NAFTA). However, it is still struggling with economic reforms, lack of infrastructure to enhance competitiveness, and governance reforms. Mexico’s economy has benefited greatly from the outsourcing of US manufacturing industries to provinces and cities close to the border. However, with its economy so tied to the US, its GDP decreased significantly during the 2007 global financial crisis; since 2011, its rate of growth has been less than 3 percent on average. Its GDP per capita in 2014 was USD 10,361.471 This is USD 1,358 more than, or 15 percent above, the Latin America and Caribbean average of USD 9,003.472 Nevertheless, many parts of the Mexican economy have been growing, especially industries associated with aviation and automobiles.
Photo 10.1 City Centre of Mexico City– Main Square with City Hall and Cathedral
Source: Florian Steinberg.
254
Mexico City, the capital city, also known as the City of Palaces due to the considerable number of palaces built during the Spanish occupation that started in the sixteenth century, is one of the world’s biggest megacities. The urban footprint of Mexico City, with a population of over 20 million,473 has expanded from its original jurisdiction (Federal District1) to the Estado de México (State of Mexico). The Federal District, which covers a relatively small area of around 1,500 square kilometres and has a population of almost 9 million, is one of the strongest economies in Latin America. This chapter explores the dynamics and change to Mexico City’s economy, its physical and social systems development, and its environmental and governance challenges. The city is beginning to address these challenges and has introduced programs and activities involving several types of partnerships to boost is economic, infrastructure, planning and development and governance performance. Some of these examples of sustainability partnerships are outlined in the latter section of the chapter along with directions the city needs to take to support sustainable development, to enable it to engage more beneficially from being a partner in the APEC region. 10.1.1 Mexico City in Context Mexico City has a large and diverse economy. Its gross state product (GSP) reached USD 200 billion in 2013, which is larger than the GDP of New Zealand, Ecuador, Viet Nam or Bangladesh.474 The Federal District is a sophisticated urban economy; its tertiary (services) sector represents 89 percent of the GSP. Moreover, the GSP per capita, of around USD 22,500 in 2013, is well above the average for Mexico of USD 10,100, 475 and equivalent to the gross national income (GNI) per capita of developed economies like Portugal, Malta or Greece.476 Estado de México, with a population of 16 million, has a lower GSP per capita (USD 6,800) than the Federal District;477 nevertheless, its GSP of USD 112 billion478 is larger than the GDP of Morocco, Ecuador, Croatia or Bolivia.479 The economy of Estado de México is driven by the manufacturing sector, which represents 34 percent of its GSP.480 For instance, Ford, Nissan, Chrysler and General Motors have motor vehicle manufacturing plants in Estado de México. One of the most recent expansions of the city is the business district of Santa Fe, located in the Federal District. Santa Fe has five university campuses and houses the headquarters of many companies that manufacture in Mexico, for example, Chrysler, Ford and CocaCola. In the coming decades, Mexico City will grow further and develop to become part of a huge economic corridor linking the Federal District to six states: Hidalgo, Morelos, Puebla, Queretaro, Estado de México and Tlaxcala (Figure 10.1). In 2013, this economic corridor – the Central Region – represented a GSP of USD 402 billion, or 34 percent of Mexico’s economy. The GSP of the Central Region is larger than the GDP of Thailand,
1
The Federal District was renamed Mexico City in the first half of 2016. To avoid confusion, this volume will use ‘Federal District’ to refer to the area.
255
Colombia, Iran, Malaysia or Philippines.481 The population of the Central Region is expected to reach 43 million by 2030.
Figure 10.1 Map of the Central Region, Mexico
Source: Wikimedia Commons / Alex Covarrubias (modifications by Fernando Ramirez).
Mexico City expanded rapidly during the twentieth century, but investment in infrastructure did not keep pace. For example, although the Mexico City Metro is one of the longest subway systems in the world with a length of around 225km,482 more than 90 percent of the metro system is concentrated in the Federal District.483 Estado de México has less than 20km of the metro system to serve its population of 16 million. Moreover, despite the tremendous success of the Santa Fe business district, there is not enough infrastructure in place to accommodate the more than 100,000 persons who travel daily to the area for work or study.484 Only a few roads link Santa Fe with the rest of the city; there is no metro or dedicated busway (or bus rapid transit system). Recently, the federal government announced plans to invest more than USD 550 billion in the next five years to fast-track the delivery of roads, rail and pipelines in Mexico.485 This opens many opportunities to create better infrastructure to link Mexico City with cities in the Central Region.
256
Photo 10.2 Reforma Street (left) and Santa Fe Business District (right) in Mexico City
Credit: Wikimedia Commons (left); Fernando Ramirez (right).
10.2 ECONOMIC ENVIRONMENT After being hit by the effects of the global financial crisis, Mexico’s GDP has gradually improved at an annual average growth rate of approximately 3 percent. Despite this relatively slow recovery, PricewaterhouseCoopers has forecast that Mexico will be the 66th largest economy in the world by 2050486 and Moody’s has recently lifted Mexico’s credit rating to an A. Table 10.1 shows some key economic facts. These signs of confidence are driven by many factors. The federal government’s major structural reform package which was recently approved, and cited above, is one of them. Other reforms are taking place in the energy, telecommunications, education and financial sectors. It is expected the reforms will strengthen Mexico’s potential growth and fiscal fundamentals. Moreover, the Organisation for Economic Co-operation and Development (OECD) Economic Survey states that ‘Mexico has embarked on a bold package of structural reform to break free from three decades of slow growth, low productivity, pervasive labour market informality and high-income inequality’. 487 The package of reforms also includes criminal justice and transparency reforms, which will be needed to improve Mexico’s governance and institutional capacity to ensure effective implementation of the reforms.
257
Table 10.1 Key Economic Facts – Mexico Federal District
Estado de Mexico
Central Mexico Region
Mexico as an Economy
Value of the economy (2013, billion USD)
200
112
402
1,196
Area (km2)
1,485
22,357
94,653
1,959,248
Urban area (km2)
792
2,370
6,246
22,241
Estimated resident population (June 2015, million)
8.85
16.87
38.08
121.01
Urban density (persons per km2)
11,175
7,119
5,925
5,275
Persons employed 15 yrs+ (Q4 – 2014, million)
4.06
6.88
15.91
49.82
Unemployment rate (Q4 – 2014)
6.0%
5.3%
5.0%
4.4%
Number of businesses (2014)
449,989
666,795
1,797,993
5,664,515
Value of exports (2013, million USD)
2,627
18,508
43,084
329,583
Key export sectors
Manufacturing Particularly, chemical products.
Manufacturing Particularly motor vehicles.
Mining and manufacturing Particularly motor vehicles and chemical products.
Petrol, mining and manufacturing Particularly motor vehicles, computers, video displays and medical equipment.
Source: Based on data from the National Council of Population; Mexican Bureau of Statistics; and Mexican Central Bank.
258
The package of reforms also includes criminal justice and transparency reforms, which will be needed to improve Mexico’s governance and institutional capacity to ensure effective implementation of the reforms. 10.2.1 Key Industry Growth Sectors Mexico has become a significant manufacturing economy. Its manufacturing sector accounts for 80 percent of all advanced manufactured exports in Latin America. Mexico is the leading producer of flat screens and refrigerators in the world, and the fourth largest exporter of motor vehicles.488 Figure 10.2 shows the breakdown of Mexico’s GDP using the North America Industry Classification System (NAICS). At the beginning of 2015, the manufacturing sector contributed 18 percent of Mexico’s GDP, followed by wholesale and retail trade (16%) and real estate (13%). The structure of Mexico’s economy has changed since its entry into NAFTA. The wholesale and retail trade sector increased from 12 percent to 16 percent of GDP. Mexico’s financial and insurance and information sectors increased significantly, from 3.9 percent in 1993 to 8.1 percent in 2015.
Figure 10.2 Breakdown of GDP (%) of Mexico’s Economy, First Quarter 2015
Administrative and Support and Waste Management and Remediation Services 3%
Health Care and Arts, Entertainment, and Social Assistance Recreation 2% 0%
Accommodation and Food Services, 2%
Other Services 2%
Educational Services 4%
Agriculture, Forestry, Fishing an d Hunting 3%
Mining, Quarrying, and Oil and Gas Extraction 7%
Management of Companies and Enterprises 1%
Construction 8% Professional, Scientific, and Technical Services 2% Real Estate 13%
Manufacturing 18%
Finance and Insurance 5% Information 4%
Wholesale and Retail Trade 16%
Transportation and Ware housing 6%
Source: Based on data from the Mexican Bureau of Statistics.
259
Utilities 2%
In the late 1930s, the Mexican government embarked on an expropriation of all oil resources and facilities from foreign companies; and created PEMEX, a monopolistic oil company run by the state. Unfortunately, the Mexican government had been depending on revenue from PEMEX’s profits. This had resulted in a lack of investment in the company, and in the sector. After many years of underinvestment, the mining, quarrying, oil and gas extraction sector decreased from 12 percent of GDP in 1993 to 7 percent in 2015. The decline in oil production and its profits are significantly impacting the government’s finances. In response, the Mexican government passed energy reforms allowing the nation’s vast oil resources, including offshore and unconventional fields, to be operated by international companies. 10.2.2 Employment Table 10.2 shows the employment numbers, the regional mix and the employment location quotient (LQ),489 a measure of employment in the region relative to the national average for various industry sectors, for the Federal District and the Central Region. The table does not include the public administration sector and partially covers the agriculture and forestry sectors (only includes the support activities for these sectors). The Economic Census data used is 2008 and 2013 so the regional mix analysis has been influenced highly by the impact of global financial crisis. While the Central Region is heavily dependent on the manufacturing sector, that is not its largest industry sector. The region’s LQ for manufacturing is only 0.8, as many of Mexico’s factories are located in cities closer to the US border. The retail sector dominates in the Central Region while finance and insurance (LQ of 2.1) is also a significant player. Mexico City is the seat of federal government, with the Federal District area having the highest level of concentration of public administration employees in Mexico City. The private business services sector has tended to concentrate in and around the Federal District, with the headquarters of many companies located there. Consequently, the Federal District has an even a smaller LQ for its manufacturing sector (0.4) than the Central Region, and a higher finance and insurance LQ of 4.1. The Federal District labour force (about 360,000 employees) is concentrated in the tertiary sector that provides governance, financial, retail, information, administrative, management, professional, scientific and technical services to the rest of Mexico, and that depends highly on the manufacturing sector. Given its dependency and competitive advantage in the information sector, the Federal District would be likely to benefit from the telecommunications reforms that passed in 2014.
260
Table 10.2 Employment, Regional Shift and Location Quotient (LQ), by Industry Sector, in the Federal District and the Central Region, 2013 Federal District Sector (North America Industry Classification System) Finance and insurance
Jobs
Central Region LQ
Jobs
355,347
Regional mix -9%
LQ
381,952
Regional mix -7%
4.1
Management of companies and enterprises Utilities
36,596
-54%
3.3
41,170
-57%
1.7
109,613
235%
2.9
136,872
52%
1.7
Information
100,120
22%
2.6
123,604
7%
1.5
Administration and support and waste management and remediation services Professional, scientific, and technical services Transportation and warehousing
689,255
5%
2.3
890,773
0%
1.4
212,370
-2%
2.0
295,123
-5%
1.3
172,221
-13%
1.5
284,350
-5%
1.1
Educational services
113,130
-16%
1.0
279,282
-10%
1.1
Arts, entertainment, and recreation
41,799
3%
1.1
93,247
-4%
1.1
Wholesale trade
205,826
-10%
0.9
459,168
-7%
1.0
Rea estate and rental leasing
39,780
-9%
0.9
91,036
-4%
1.0
Retail trade
575,568
-8%
0.7
1,783,098
-7%
1.0
Healthcare and social assistance
95,804
-2%
0.9
210,663
-5%
0.9
Other services
160,976
-14%
0.7
451,986
-10%
0.9
Accommodation and food services
257,794
-8%
0.8
607,682
-5%
0.9
Manufacturing
360,664
-25%
0.4
1,486,890
-14%
0.8
Construction
65,845
-21%
0.7
134,123
-10%
0.7
0.2
17,462
-26%
0.3
0.0
5,806
-14%
0.1
6,323 1% Mining, quarrying, and oil and gas extraction 101 88% Agriculture, forestry, fishing and hunting Source: Based on data from Mexican Bureau of Statistics 2013.
2.1
10.2.3 Trade Over the last 18 years, Mexico has made a dramatic transition from a relatively closed economy to become an open economy. Mexico has embraced international free trade
261
agreements as a means of promoting industrial competitiveness and export-oriented growth.490 Mexico has 10 free trade agreements with 45 economies, 30 reciprocal investment promotion and protection agreements (RIPPAs) and 9 trade agreements (economic complementation and partial scope agreements) within the framework of the Latin American Integration Association. In addition, Mexico is an active participant in multilateral and regional organizations and forums such as the World Trade Organization (WTO), APEC and OECD.491 The policy to become an open economy has resulted in Mexico’s trade increasing from USD 117 billion in 1993 to USD 797 billion in 2014. Clearly, NAFTA has been a very productive agreement for Mexico. Trade between the USA and Mexico increased from USD 88 billion in 1993 to USD 514 billion in 2014. Mexico has also diversified since NAFTA was signed; the USA accounted for 75 percent of Mexico’s trade in 1993, compared to 64 percent in 2014 (Figure 10.3). Figure 10.4 shows that Asia has also become a very important trade partner for Mexico. Its trade with Asia increased from USD 8.7 billion in 1993 to USD 145.3 billion in 2014. Asian economies represent 18 percent of all Mexican trade. China (USD 72.2 billion) accounts for around 50 percent of all Mexican trade with Asia. Currently, Mexico and China do not have a free trade agreement with each other.492 However, Mexico wants to strengthen ties with China, the world’s second-largest economy, especially since China has been investing more in Central and South America in recent years. Mexico is working to export more tequila and pork to China and attract investment in industries such as energy, infrastructure and tourism.493
Figure 10.3 Mexico’s Trade, by Region/Economy, 2014 Asia $145.3 Billion Europe $71.8 Billion
USA $513.6 Billion
South America $27.6 Billion Canada Central $20.8 america Billion $10.2 Billion Antillas $3.4 Billion Africa $2.3 Billion
Oceania $2.0 Billion Source: Based on data from Mexican Bureau of Statistics.
262
Figure 10.4 Mexico’s Trade with Asia, by Economy, billion USD, 2014 Others, $6.5 Singapore, $1.7 The Philippines, $2.1 Viet Nam, $2.3 Thailand, $4.7 India, $6.4 Malaysia, $6.8 China, $72.2 Chinese Taipei, $6.8
Korea, $15.8
Japan, $20.2
Source: Based on data from Mexican Bureau of Statistics.
10.2.4 Mexico City’s Exports Mexico relies heavily on exports, which are composed mainly of manufacturing goods and oil. In fact, exports represent almost 30 percent of its GDP. The Federal District of Mexico City does not rely as heavily on the export sector to support the economy as the rest of Mexico. Exports represent only 1.3 percent of its GSP. The Central Region has a slightly higher dependency on exports (11%), which includes vehicle manufacturing and chemical products. The Brookings Institution estimates that trade between Estado de México, Hidalgo and the Federal District and the USA was worth USD 55.9 billion in 2013. Electronics was the largest sector (USD 13.4 billion), followed by machinery and tools (USD 11.5 billion); chemicals and plastics (USD 6.4 billion); motor vehicles and parts (USD 5 billion); and energy products (USD 4.8 billion). The major US metropolitan trading partners were Los Angeles, San Jose and Houston.494 10.2.5 Human Capital Management and Development Mexico has a dual economy, comprising a skilled population that has been able to find jobs in high value-added sectors, and a low-skilled population with weak productivity that largely has been forced to work in the informal sector.
263
The Mexican economy experienced a slowdown in growth from the 1980s to 2000s, causing Mexico to fall behind other economies and adversely impacting the population’s relative living standards.495 A main reason for this was the erosion of Mexico’s comparative advantage in low-end production as imports from China and elsewhere in Asia entered its market. In response, the manufacturing industry in Mexico is increasingly turning to subcontracting work for more upstream industries in North America, where it still has a cost advantage. 496 Mexico City experiences similar issues. Historically, Mexico City’s demand for employees has attracted more rural migrants than there have been jobs available. Since the Mexican social security system is weak, low-skilled migrants are forced to work in the informal economy, which is estimated to be around 25 percent of Mexico’s GDP.497 Migrants take up jobs as domestic workers, construction builders, street vendors and artisans. They have developed independent economic activities quite different from the traditional productive activities of their rural communities.498 On the other hand, Mexico City has a strong demand for skilled labour. Mexico City remains the leading centre of tertiary employment. For instance, employment is concentrated in finance and insurance (LQ=4.14); management of companies and enterprises (LQ=3.27); information (LQ=2.6); professional, scientific and technical services (LQ=2.03); and administrative and support to business (LQ=2.33). Productivity of workers in the city in many service sectors of the economy is lagging. There is need for comprehensive skills improvement programmes in all sectors of the labour market, schools, technical colleges and universities. Education reforms are crucial to increase the quality and relevance of education, and to motivate students to pursue education.499 Reforms to improve teaching and learning, curricula and lifelong learning are critical to lifting the performance of the city’s economy. Increased training opportunities for low-skilled workers are also crucial, as they are currently not getting opportunities to improve their skills and productivity. This requires a commitment to invest in workers, not only by the authorities but also by businesses and society at large. This is important not just from the growth and wellbeing perspectives, but also to face the demands of the information economy and the profound changes in the global economy.500 10.2.6 Investment Environment Due to low oil prices in the early eighties, Mexico was in economic turmoil. In the midnineties, a strong devaluation of its currency, and a current account deficit, led to an economic crisis (known as the Peso or Tequila Crisis). After this crisis, Mexico undertook a series of economic reforms. It floated its currency and instituted reforms to the financial sector (mainly banks and superannuation funds). These culminated in an impressive turnaround for the Mexican economy. As a result, Mexico was relatively unaffected by the 1997 Asian financial crisis, with its GDP growing an annual average of 5 percent from 1996 to 2000.501 However, Mexico took a heavy hit during the global financial crisis. Its major trading partner, the US, entered into recession. Foreign direct investment (FDI) plummeted from
264
USD 32 billion in 2007 to USD 17 billion in 2009, and workers’ remittances to Mexico dropped from USD 26 billion in 2007 to USD 21 billion in 2009.502 Workers’ remittances have not recovered to pre-crisis levels, but FDI has started to improve. Mexico received USD 22.8 billion in FDI in 2014 and USD 7.6 billion in the first quarter of 2015. Historically, the Federal District receives more than 50 percent of Mexico’s FDI, while the Central Region (which includes the Federal District) receives more than 65 percent. After the Tequila Crisis of the mid-nineties, Mexico has been open to FDI in most economic sectors and has consistently been one of the largest recipients of FDI among emerging markets.503 Figure 10.5 shows the FDI flows into Mexico in 2014. The USA is clearly the largest contributor, with its investments going mainly to the manufacturing sector, followed by Spain (financial and insurance services) and Canada (mining). Mexico has not recovered from the global financial crisis at the same speed as it recovered from the Tequila Crisis. Moreover, its poor level of competitiveness does not augur well for a quick recovery. Its weak competitiveness can be attributed to corruption, relatively poor governance, low educational attainment, and the relatively poor quality of physical capital. In 2012, Mexico City was ranked 71st in terms of overall international competitiveness by the Economist Intelligence Unit in its Hot Spots study (Table 10.3), with its projected 2025 ranking remaining unchanged.504 Institutional effectiveness ranks well below the global median of a sample of 120 world cities.
Figure 10.5 Foreign Direct Investment (FDI) Flows into Mexico, by Economy, billion USD, 2014
Canada $2.4 b Spain $4.3 b
Netherlands $1.5 b Germany $1.5 b Japan $1.4 b Belgium $1.3 b
United States $6.4 b
Other Countries $1.3 b
Korea $0.3 b
Luxembourg $0.8 b France Brazil $0.7 b $0.5 b Switzerland $0.3 b
Source: Based on data from Secretariat Ministry of Economy (2015) ‘FDI Flows into Mexico by source country and industry’, accessed 3 June 2016, http://www.economia.gob.mx/trade-and-investment/foreigndirect-investment/official-statistics-on-dfi-flows-into-mexico.
265
Mexico City’s competitiveness is adversely impacted by its poor performance in respect to human capital relative to cities like Santiago (Chile), although overall the city performs relatively well in the Hot Spots ‘human capital’ category, at 52nd. Factors likely to further limit the city’s competitiveness in future include restrictions on employment of foreign workers, a decline in working age population and low levels of educational achievement. The primary education system in Mexico City receives the major part of the city’s budget for education, with the result that effectively all children in the city complete primary school. The concern now is post-primary level education, with only about 22 percent of the city’s population graduating from high school, 25 percent achieving a professional level education and 2.5 percent a graduate level education. 505 In 2014, the main public university in Mexico, the Autonomous National University, rejected 91 percent of the 126,683 applications for enrolment in a bachelor’s degree programme.506 While some of those who were rejected will pay for education at a private university, most will not be able to afford to do so. Mexico needs to invest more in human capital. The Autonomous National University is currently ‘free’ for those fortunate enough to get into the system; however, there are insufficient resources to provide university places for the majority of the younger generation. Mexico could consider implementing a scheme like the Australian Higher Education Contribution Scheme that was introduced during the mid-nineties. The system allows students to enrol in a course without paying fees until they earn a level of income defined by the Australian government. The loans paid back by students are redirected to the tertiary education system.
266
Social and cultural character
15.0%
5.0%
15.0%
5.0%
10.0%
Global appeal
10.0%
Environmental natural hazards
10.0%
Human capital
Financial maturity
30.0%
Institutional effectiveness
Physical capital
Category weight
Economic strength
Overall
and
Table 10.3 Economic Competitiveness of New York, Los Angeles and Mexico City, 2012
1
New York
71.4
54.0
92.0
100.0
85.8
95.0
76.5
66.7
35.7
19
Los Angele s
61.5
45.7
88.4
50.0
85.8
95.0
76.9
54.2
20.5
71
Mexic o City
46.2
35.5
65.2
50.0
47.1
55.8
64.6
58.3
15.5
Median
Global
46.6
35.7
71.4
33.3
54.4
56.7
61.9
66.7
7.7
Source: Based on data from Economist Intelligence Unit, Hot Spots 2025: Benchmarking the Future Competitiveness of Cities (London: Economist Intelligence Unit: 2013).
The relative cost of doing business in Mexico City has improved since 2012, due to many recent reforms supporting business development. According to a World Bank study in 2014, Estado de México and Puebla (both in the Central Region) showed the most improvement in the ease of doing business. Estado de México was also the most improved for construction permits.507 Mexico’s performance is now well above the average performance of Latin American economies. The regulatory environment for business in Mexico is also coming close to the average performance of high-income OECD economies. 10.2.7 Innovation and Business Support Mexico City is the hub for research in Mexico. The city accounts for 80 percent of Mexico’s total R&D activities, and is the largest contributor of patents.508 However, despite being home to many science and technology training institutes, the rate of innovation remains low. This has been attributed, in part, to the lack of a business-oriented mindset and culture within academia.509 The bureaucratic processes in the patent system may also be an impediment to innovation.510 Business support is significant and effective but delivered mainly through federal government agencies.511 The city ranks 41st in the ‘global appeal’ category of the Hot Spots index.
267
10.2.8 Constraints to Economic Development A boost to economic development in Mexico is desperately needed to reduce income inequality, improve the quality of education, encourage participation in the formal sector and reduce poverty. Investment in physical and human capital is a key constraint for Mexico’s economic development. Total investment as a percentage of GDP in Mexico has gone from 25 percent for the 1979–1981 period to 20 percent in the 2004–2007 period.512 Mexico City has experienced similar declines, with the most significant reduction being capital investment in infrastructure. Mexico City’s infrastructure faces major challenges, with upgrades and replacement urgently needed for its public transportation system as well as its water and sanitation system. Traffic is a serious problem. In IBM’s Global Commuter Pain Survey, Mexico City was considered the worst in commuting time, start-stop traffic, and drivers angered by traffic.513
10.3 STRATEGIC INFRASTRUCTURE 10.3.1 Highways The road infrastructure, which spans 377,660km,514 facilitates the movement of the majority of the freight in Mexico (55%) and most of the population (98%). The road network of Mexico City is well-connected to the USA and Canada. Figure 10.6 Map of Mexican Road Corridor to the NAFTA Region
Source: Adapted by authors from Mark Robinowitz, ‘Peaked traffic and transportation triage: NAFTA superhighways I-69, I-35 and the rest of the network of highway expansions between Canada and Mexico’, peaktraffic.org, accessed 3 August 2015, http://www.peaktraffic.org/nafta.html#top
268
10.3.2 Public Transport There are two important systems of public transport in Mexico: the subway (Metro) and the rapid bus transit network (Metrobus). Mexico City Metro operates one of the longest subway systems in the world, at around 225km. Annual ridership was 1.685 billion trips in 2013. It recorded a peak daily ridership of 4.4 million in 2012.515 The Metrobus network is more modest. It covers 105km and transports around 900,000 passengers daily.516 However, the Metrobus is slow, due to congestion on streets and poor signalling at intersections. Accident rates are also high, which adds to traffic holdups. Photo 10.3 Mexico City’s Metro (left) and Metrobus (right)
Credit: Wikimedia Commons / Daniel Manrique (left); Wikimedia Commons / ProtoplasmaKid (right).
10.3.3 Infrastructure Issues Among factors limiting the city’s competitiveness between 2012–2025 is the relatively low quality of its physical capital (95th in the Economist Intelligence Unit’s Hot Spots rankings). It is not surprising, therefore, that lack of investment in infrastructure has created some issues for Mexico City:
Airport: Mexico City’s airport is the busiest in Latin America. Energy: Mexico’s oil sector has suffered after years of underinvestment by the state monopoly company. Hospitals: Around 23 percent of the population in the Federal District do not have access to health services. This jumps to 30 percent in Puebla.517 Housing: Measured by the number of rooms per person, Mexican houses are overcrowded. For instance, the average Mexican home contains 1 room per person, which compares to 2.3 in the USA or 2.6 in Canada. Even across LatinAmerican economies, this figure is relatively low, for instance, Brazil has 1.4 bedrooms per person.518
269
Communications and transport: Mexico invested only 1.1 percent of its GDP in infrastructure for transport and communications from 1992 to 2011, which compares to 5.02 percent in China.519 Water and sewerage: Mexico’s growing population has led to over-exploitation of groundwater resources Seaports: There is a need to upgrade seaports, and these are far away from Mexico City.
10.3.4 Recent Infrastructure Projects During the last decade, the following major urban investments have been implemented:520
Santa Fe business centre Revitalization of the historical centre Two-tier motorways Extension of the Metro (subway) Introduction of the Metrobus Cultural centre: The Factory of the Arts and Crafts of the East (Faro de Oriente) The densification of the urban area surrounding the CBD (Bando Dos) The Housing Improvement Program.
10.3.5 Future Infrastructure Projects Under the National Infrastructure Program 2014–2018, USD 550 billion will be invested over the period to meet some of Mexico’s infrastructure needs. The plan encompasses the ‘development of an enhanced national network of highways and roads, in addition to other transportation and telecommunication projects to turn Mexico into a global logistics platform’.521 Mexico City will benefit from these projects:
New airport. This USD 9.2 billion project – probably the largest infrastructure development in Mexico – will include six runways and have the capacity to handle 120 million passengers. 522 Mexico City–Querétaro high-speed rail. This project involves the construction of a 210km line for high-speed trains (300km per hour) that can meet a daily demand of 23,000 passengers. However, this project had been deferred. 523 Mexico City–Toluca inter-urban train. This USD 2.9 billion project involves 57.7km of new railroads connecting Mexico City to Toluca. The line will have six stations and meet a daily demand of 270,000 passengers.524 New fibre optic cable. This USD 750 million project by the Federal Electricity Commission will expand the current network by around 57,500km. 525 New subway in Estado de México. This will expand the metro system to the east of the city at an estimated cost of USD 750 million. Valle de México II. This project involves an estimated investment of USD 650 million in the construction of an electric plant with a capacity of 543 MW in Estado de México. Highways around Mexico City. There are plans to build and expand a series of highways in the Central Region to connect better Mexico City to its surrounding cities.
270
Expansion of the Veracruz Port. The plan is to invest more than USD 700 million in expanding the Veracruz seaport to better connect it to the train system and provide facilities to support the oil platforms. Improvements to the water and sewerage systems. The plan outlines an investment of more than USD 2.6 billion to improve the water and sewerage systems of Mexico City. Hospitals. New hospitals are planned in the Central Region. The investment outlined in the plan is more than USD 500 million. Energy. The energy sector is the main pillar of the National Infrastructure Plan; and the plan suggests an investment of around USD 250 billion to extend and develop infrastructure for the extraction, exploration and transformation of hydrocarbons.
10.3.5.1 Financing the National Infrastructure Program The plan for Mexico’s National Infrastructure Program526 proposes that the government will provide 63 percent of the cost of new infrastructure with the rest coming from private investment. The plan sets out infrastructure investment for the Central State Region. A federal public–private partnership (PPP) law was enacted in December 2013 which contains features to give developers and investors greater certainty to invest in infrastructure, transparency in the bidding process and clearer rights for investors. Mexican local, state and federal governments are familiar with the use of PPPs to fund public goods. For instance, many of Mexico’s highways are funded by the private sector, which in return obtains fees from highway tolls for an agreed period.
10.4 SOCIAL AND ENVIRONMENTAL SUSTAINABILITY Mexico City’s high level of income inequality is shaping society in the city. Environmentally, Mexico City is no longer the most polluted city in the world. However, there is urgent need for further pollution reduction. 10.4.1 Social Environment Despite its poor overall human capital performance, Mexico has a large well-educated workforce. However, many decide to work abroad because of a lack of opportunity at home. Remittances by Mexican citizens working in the USA are significant. They amount to 0.2 percent of Mexico’s GDP (USD 26 billion in 2007527), and are the economy’s 10th largest source of foreign income.528 The average income in a typical urbanized area of Mexico City (i.e. the Federal District) is around USD 22,500 per year;529 while the average income of the poorest 20 percent of the rural population is less than USD 500 per year.530 Since 2006, Mexico City has imposed broad quality-of-life measures to improve the liveability of the city, some of which have impacted on the poor. These measures include bans on smoking in bars and restaurants, closure of many streets on weekends to allow joggers and cyclists to use them,
271
barring out-of-state cars from entering the city on certain days from 5 to 11 a.m. to cut down on pollution, outlawing plastic bags in stores and evicting thousands of vendors from public streets. New traffic laws have outlawed talking on mobile phones while driving, and banned children under 12 from riding in the front seats. However, crime and water shortages remain major problems despite these high-profile efforts to make the capital more liveable. Owing to these continuing problems, Mexico City scores 72nd in the ‘social and cultural character’ category of the Economist Intelligence Unit’s Hot Spots index. 10.4.2 Industrial Labour Market Reforms In the past, businesses were reluctant to hire staff due to the difficulties in dismissing them. Some employers opted to hire from the informal sector, with many of those employees’ suffering discrimination and unfair treatment. In 2012, the Mexican Congress passed labour reform legislation that includes:
Curbs on outsourcing. Companies which use outsourcing arrangements to avoid labour obligations could face major fines. Changes in laws affecting hiring and firing. Previously, Mexico’s labour laws made it difficult to dismiss poor performers or lay off workers. As a result, some employers preferred to hire workers informally. The new contract modalities allow probation periods of up to 6 months. Companies can now hire workers by the hour, something not previously allowed. The new laws also cap the amount of money employers must pay workers who are dismissed. Modernization of the administration of labour justice. Resolving labour disputes in Mexico could be a lengthy process. To address this, reforms in justice administration were introduced and incentives provided for the parties involved to seek more efficient and swift rulings. 531 Anti-discrimination provisions. The minimum acceptable conditions that any employment relationship must meet are specified. The legislation also adopts the concept of ‘decent work’ established by the International Labour Organization, which is based on respect for the dignity of workers, and prohibits discrimination based on gender, sexual preferences, disabilities, race or religion.532
10.4.3 Environmental Management and Sustainability: Policies and Measures In 1992, the United Nations declared Mexico City the most polluted city on the planet. In response, the government prohibited old cars, removed lead from gasoline, embraced natural gas, expanded public transportation and relocated refineries and factories to outside the city. The introduction of more fuel-efficient buses has reduced dioxide emissions. Today, air pollution in Mexico City has improved, but particle emissions levels are still high. The Federal District also has a major water supply problem. To address this, the city has developed a plan for a ‘City of Lakes’ that draws inspiration from Aztec times, when a system of interconnected lakes, and dikes to separate fresh water and control floods, served the population. This plan would increase water supply, create new parklands, and improve air quality.
272
The Ministry of the Environment and Natural Resources estimates that 40 million tonnes of waste are generated annually in Mexico, of which only 15 percent is recycled.533 It is estimated that the Federal District produced more than 10,000 tonnes of waste every day while Estado de México produced more than 16,500 tonnes per day. After the closure of a huge landfill (Bordo Poniente) that used to receive more than 12,500 tonnes daily, illegal dumping became widespread practice in Mexico City. In addition to these environmental threats, Mexico City is very vulnerable to earthquakes; it has a long history of seismic events, with the most recent major earthquake occurring in 1985.534 Given the different threats and risks, Mexico City scores 81st in the ‘environmental and natural hazards’ category of the Economist Intelligence Unit’s Hot Spots index.
10.5 URBAN GOVERNANCE The governance structure of metropolitan Mexico City is dysfunctional. The main issue is that Mexico City is spread over two federal entities or states – Estado de México and the Federal District. Most projects need to be endorsed and monitored by these two federal entities, which leads to governance inefficiencies. States are also responsible for regulating their own municipalities, which causes further fragmentation of governance in the greater metropolitan area.
273
Figure 10.7 Map of Mexico City’s Urban Footprint and Its Local Government Boundaries
Source: Wikimedia Commons / Yavidaxiu.
The percentage share of infrastructure investments as part of overall GDP has gone up steadily since 2000, from 3 percent to 4.8 percent in 2013.535 And, as discussed earlier, the second National Infrastructure Program 2014–2018 envisages further ambitious investments that would benefit Mexico City. More than USD 100 billion of the investment is expected to come from PPPs. In 2012, a new PPP law was enacted that provides more clarity and protection for the private sector. This law delineates more clearly the rights, obligations and risk that each party assumes. It also grants greater flexibility if a long-term contract needs to be modified once a project is underway. The PPP law also streamlines the process for land acquisition – a major obstacle that has delayed many infrastructure projects in the past.536 However, despite the positive initiatives by the government to create the conditions for development, corruption remains a hallmark of Mexican governance and is adversely affecting business and service delivery. A survey of households in 2011 by Transparency International’s Mexican branch found that, while Mexico’s level of corruption is
274
‘average’ by Latin American standards, the estimated cost of the corruption exceeded MXN 32 billion (approximately USD 2.5 billion) in 2010.537 Corruption varies widely by state, with the most corrupt being Mexico City and the adjacent Estado de México. A Transparency International survey showed that the poor are particularly vulnerable to demands for bribes. However, the situation has been improving, particularly with respect to federally run programmes. Less corruption is evident in the provision of government aid, the postal service and the electricity market.538 The city scores 86th in the ‘institutional effectiveness’ category of the Hot Spots index.
10.6 GOOD PRACTICE FOR SUSTAINABLE DEVELOPMENT 10.6.1 GLOBAL CITIES ECONOMIC PARTNERSHIPS Sister cities are a form of legal and social agreement between cities to promote cultural and commercial ties. Mexico City (Federal District), as a megacity, has many sister cities including Chicago, Los Angeles, Athens, Beijing, Beirut, Berlin, Rio de Janeiro, Sao Paulo, Seoul, Tel Aviv, Istanbul, Lisbon, Paris, Rome, Sydney, Bogota and Buenos Aires.539 10.6.1.1 Bogota–Mexico Partnership Mexico and Colombia have strong connections economically and culturally. Not only do Mexico and Colombia have a free trade agreement and share the same language, but it is also common to hear Mariachis (Mexican music) in Bogota and to see Colombia’s famous writer Gabriel Garcia Marquez as the subject of homework for Mexican students. Mexico and Bogota are very similar cities with similar problems. To tackle its traffic problems, Bogota introduced a bus rapid transit system (or Transmilenio) in 2000. After the success of this system, Mexico built the Metrobus. Colombian urban planners have helped to shape Mexico City, and Mexico has invested in Bogota. In 2014, Mexican direct investment in Bogota reached USD 430 million.540 Bogota and Mexico clearly are a good example of sister cities. Given the success of this relationship, Mexico and Bogota signed an agreement of cooperation in 2014 to expand those relationships further to include transport, environment and health.541 10.6.1.2 Chicago–Mexico Partnership Mexico City and Chicago have had cultural ties as sister cities since 1991. In 2013, they announced a new partnership aimed at extending their economic ties. Both cities pledged to work together to facilitate trade and investment between shared industries, and to boost research, innovation and human capital. It is expected that these efforts will help create jobs and increase economic opportunities for both cities. The similarities and complementarities between the two cities, economically and culturally, augur well for the success of this partnership. Chicago is home to the secondlargest population of Mexican immigrants in the USA. There is also strong city-to-city trade, amounting to more than USD 1.7 billion worth of locally produced products. They
275
have both experienced deindustrialization, and are looking to develop new growth trajectories. They have both also had some success in attracting global firms, for example, Siemens in Chicago, and Motorola Solutions in Mexico City.542 10.6.2 Sustainable Transport: The Suburban Train The federal government, Estado de México and the Federal District have partnered to build a ‘suburban train’ system (Photo 10.4). This is considered one of the nation’s most significant infrastructure projects; it connects the Federal District with Cuautitlan in the densely populated metropolitan area of Mexico City,543 and costs around USD 600 million.544
Photo 10.4 Suburban Train in Mexico City
Credit: Wikimedia Commons / Sofree.
Finding capital for the Mexican Metro has historically proved a real challenge for the government. Tickets for the Metro are about USD 0.23, which is very cheap when compared to New York (USD 2.50), London (USD 7.50) or Los Angeles (USD 1.50).545 However, with any fare increase seen as an impost on the poor, the government has continued to subsidize it. Thus, there has been no increase in revenue for years, either to improve the Metro or to provide proper maintenance. The prospects of cross-subsidizing the Metro expansion using profits from the state’s oil revenues did not occur because of inefficiencies, and more recently, falling oil prices. The city continues to grow; and congestion on the public transport system has continued to increase. The suburban train service has broken that pattern. The government, by calling the service a ‘suburban train’ rather than a Metro train, has been able to set the ticket price at around USD 1 per trip. The train serves around 160,000 passengers daily; and the revenue is helping to fund the extension of this service to 50km.546
276
10.6.3 Improving Air Quality: PROAIRE Three decades ago, Mexico City was one of the most polluted cities in the world. Vehicular and industrial emissions were out of control and there was no proper regulation for the protection of air quality.547. The pollution was having a major impact on public health, productivity and the quality of life for the city’s residents. The federal and local governments were forced to act. In 1990, the government developed its first programme, PROAIRE, to improve air quality and remove lead from petrol. This led to an immediate improvement with a drop in particulate matter and carbon monoxide levels. In 1995, the programme was updated, and again in 2001 and 2010. The latest iteration defines management policies to improve air quality to be implemented until 2020, and focuses on reducing ozone aerosols and greenhouse gas levels. The results have been quite remarkable. The concentrations of pollutants such as lead, sulphur dioxide and carbon monoxide have dropped to levels below the limits set under domestic standards; and in the case of ozone and certain particles, a reduction of over 30 percent has been achieved.548 Reductions of black carbon emissions and carbon dioxide have exceeded the original goal. Actions to be undertaken over the next six years include continued reductions in particulate matter, volatile organic compounds, carbon dioxide and black carbon. In 2013, Mexico City won the C40 Cities and Siemens ‘City Climate Leadership Award’ in the ‘air quality’ category, a remarkable achievement from previously being one of the world’s most polluted cities in terms of air quality. Today, air pollution in Mexico City has significantly improved, but particle emissions levels are still very high.
10.7 POTENTIAL APEC PARTNERSHIPS Mexico City has successfully partnered with cities with which it has previous economic and/or cultural ties like Chicago or Bogota. Under this pattern, Mexico City could strengthen or start new partnerships with the following cities:
Beijing – Despite being Mexico’s largest Asian trading partner and investing heavily in Latin America, China’s direct investment in Mexico was only USD 15 million in the first quarter of 2015.549 There is thus substantial potential for increased investments, particularly given that China’s reputation for its relatively new train network could be an advantage for Mexico’s infrastructure plans. Los Angeles – Because of the cultural connections arising from Mexican migration to Los Angeles, many Mexicans call Los Angeles the ‘Federal District’ of the USA. Manila – Although currently there are no economic connections between Manila and Mexico, these economies have a similar culture, both having been conquered by the Spanish. Both cities have similar industry sectors (in centralized cities), and urban and government structures created under Spanish influence.
277
Seoul – Korea’s direct investment in Mexico was USD 366 million during the first quarter of 2015,550 mainly in the manufacturing sector. Singapore – Singapore has a superb subway network, seaports and buildings. Its experience in these areas could be an advantage for Mexico’s infrastructure plan. Singapore invested USD 97 million in Mexico in the first quarter of 2015. Sydney – Some economic connections already exist between Sydney and Mexico. For instance, the Australian Macquarie Group manages the largest commercial and industrial property fund in Mexico; and this has led to interest in a USD 1 billion wind farm project.551 In addition, Mexico could learn from Australia’s experience with its Higher Education Contribution Scheme. Tokyo – Japan’s direct investment in Mexico was USD 622 million in the first quarter of 2015, mainly in the manufacturing sector.552 Vancouver – Currently Vancouver and Mexico City do not have a sister city agreement. Canada invested USD 184 million in the Mexican finance and insurance sector in the first quarter 2015.553 Mexico City could provide opportunities in its well-established financial and insurance sector to Canadian companies.
10.8 CONCLUSIONS Mexico City is a city of opportunity, but its development is being held back by significant disparities in income and wealth, and lack of opportunities for education and training across the city’s population. This is reducing its economic competitiveness. Opportunities exist for Mexico City to learn from other economies and cities. For example, Korea was a developing economy that now enjoys a better distribution of income and a higher level of wealth than Mexico, and as mentioned earlier, Australia has implemented a higher education funding scheme that could be considered by Mexico. From a sustainable development perspective, Mexico City has been able to improve the quality of its environment. It could use its experience to help cities that are suffering similar levels of air pollution, like Beijing. However, in the area of responsibility for water management, Mexico City needs to improve. After 10 years of drought, there are lessons that Mexico City could learn from Australian cities. Mexico City has implemented urban planning and transport systems that were initiated in Colombia and other South American economies, and could help Manila to improve its transport system by substituting its jeepneys with a rapid bus transit system similar to the Metrobus. To expand its Metro system, Mexico City could take advantage of China’s expertise in building fast intercity trains. Before the mid-1990s, Mexico was a relatively closed economy. There are still many taboos and barriers to improving trade, investment and partnerships with other economies that flow on from this period. Mexico, and Mexico City, needs to improve both productivity and competitiveness. While many sectors of the economy have gained from NAFTA, some have not reformed and continue to lose jobs due to competition. Much of the investment in Mexico City has been in low-wage manufacturing and services, with little investment in advanced manufacturing and services. The initiative to establish a
278
city-to-city partnership with Chicago, is the first of its kind, and is a very positive step in city-to-city trade development under NAFTA. The Mexican government’s infrastructure plan and its package of reforms will certainly help to provide a better platform for international trade and create stronger partnership opportunities for Mexico City. However, the success of Mexico’s reforms and infrastructure plan will depend significantly on improved confidence in Mexico’s institutions and governance. The problem of corruption involving Mexico’s drug cartels has permeated all levels of society and undermined investor confidence. Mexico City can learn much from cities like Medellin in Colombia about cleaning up drugs and crime, and the beneficial effects this can have in attracting investment. Mexico City urgently needs to improve its urban governance structure, which currently undermines the city’s economy and its ability to achieve its development potential. It needs to overcome barriers and taboos that hinder trading and creating partnerships with other economies. Mexico is expected to become the fifth-largest economy in the world by 2050. Therefore, its cities, especially Mexico City, must embrace the opportunities to partner with other cities in the APEC region to ensure that development occurs in a sustainable manner.
279
11. Pearl River Delta Supracity, People’s Republic of China Michael Lindfield, Xueyao Duan and Aijun Qiu
11.1 INTRODUCTION The Pearl River Delta area is now generally synonymous with the dense network of cities that covers nine prefectures of the province of Guangdong (Guangzhou, Shenzhen, Zhuhai, Dongguan, Zhongshan, Foshan, Huizhou, Jiangmen and Zhaoqing) and the Special Administrative Regions (SAR) of Hong Kong, China and Macau. It is part of an enormous configuration of interconnected cities which has become the world’s first supracity. The 2010–2011 State of the World Cities Report published by the United Nations Human Settlements Programme estimates the population of the Pearl River Delta region at 120 million people; and it is urbanizing rapidly.554 The Pearl River Delta is one of the most economically dynamic regions of the People’s Republic of China (PRC). Annual GDP growth for the region has consistently outpaced that of China as a whole over the three decades since 1978 – averaging 13.45 percent, or 3.5 percentage points higher than the average for China. The region has also attracted nearly a third of foreign investment into China.555 By 2007, its GDP had risen to USD 448 billion, which is almost 10 percent of China’s GDP.556 Since 1979, when China’s began its reform programme, the Pearl River Delta Economic Zone has been the fastest growing part of the fastest growing province in the fastest growing large economy in the world.
280
Photo 11.1 Macau Central District
Credit: John Courtney (2015).
281
Figure 11.1 Nine Policy Zones in the Pearl River Delta
Source: Department of Geography and Research Management 2009.
The economy of the Pearl River Delta is highly diversified. The largest cities are:
Hong Kong, China (population 7.1 million). Focusing on high-end services and finance, Hong Kong, China is also one of the largest ports in the world. Guangzhou (population 12.7 million). Guangzhou is the provincial capital and regional hub for southern China. Industries located in the city include: machinery and equipment manufacturing, petrochemicals, information technology, pharmaceuticals, and building materials. It has also been attracting investments from high-tech industries (including the manufacture and assembly of electronics equipment) and heavy industries, including automobile companies such as Honda, Toyota and Nissan. Shenzhen (population 10.4 million). Shenzhen has a very strong industrial sector mainly due to its geographical advantage of being the only municipality bordering Hong Kong, China. It has a large manufacturing base of traditional industries built up through companies (from Hong Kong, China and other areas) relocating their manufacturing base to the lower-cost Special Economic Zones (SEZs) in China. From this base, Shenzhen has seen significant high-tech development in the electronics and petrochemicals sectors. To establish the city as a sourcing centre for multinational corporations, Shenzhen has also been upgrading its logistics
282
sectorIt is also upgrading its logistics sector in order to establish itself as a sourcing centre for multinational enterprises. Dongguan (8.2 million). Dongguan is an important export base in China especially in electronics, information technology, toys, household electrical appliances and printing. Foshan (7.2 million). Foshan is the third-largest manufacturing base in the Pearl River Delta. Key industries include textiles and apparel, shoemaking, leather products, metal products, household electrical appliances, furniture, aluminium materials, and ceramics. Jiangmen (4.5 million). Jiangmen Port is the second largest river port in Guangdong province and was one of the original ‘treaty ports’ opened in 1902. The local government intends to develop a harbour industrial zone with heavy industries such as the petrochemical and machinery industries. Manufacturing predominates, with a particularly strong motorcycle industry. Zhongshan–Zhuhai–Macau SAR (5.2 million). Located on the western fringe of the Pearl River Delta, Zhongshan specializes in light manufacturing and agroprocessing; Zhuhai (with its SEZ) focuses on IT and electrical machinery manufacturing, but with growing biomedicine and medical equipment, software, petrochemicals, steel and shipmaking industries; Macau is a tourism focal point. Huizhou (4.6 million). Huizhou is a crucial manufacturing centre for electronics and IT products where its output being top of the world and among the biggest producers of computer circuit boards in AsiaHuizhou is an important manufacturing hub for electronics and IT products with its output being among the highest in the world. It is one of biggest producers of computer circuit boards in Asia. It also is strong in the petrochemicals sector.
11.2 ECONOMIC ENVIRONMENT Table 11.1 sets out some key facts about the Pearl River Delta. Its economy, if it was standing alone as a nation, would be globally significant. It has an area 60 percent greater than Belgium with twice its economic product, and six times its population. The Pearl River Delta exports twice as much as Belgium.
283
Table 11.1 Key Economic Facts – Pearl River Delta, 2013 Pearl Delta
River
Hong Kong, China
Macau
Land area (sq.km)
54,754
1,104
30
Population (000s)
57,152
7,188
592
as above 48025.5
Urban population (000s)
as above
Labour force (000s)
37,841
3,859
368
Unemployment rate
n.a.
3.4%
1.8%
GDP (million USD)
856,699
270,346
17,132
135
0
Secondary industry (million USD)
388,319
18,056
1,717
Tertiary industry (million USD)
451,247
248,393
25,773
37,611
81,233
458,724
1,139
48,090
Primary industry (million USD)
15,034 GDP per capita (USD)
Total exports (million USD)
607,093
Total imports (million USD)
440,338
523,286
23,062
Foreign direct investment (million USD)
10,138
76,633
2,33t1
Note: The Statistics Bureau of Guangdong province includes nine cities in the regional economic data for the Pearl River Delta: Guangzhou, Shenzhen, Zhuhai, Foshan, Jiangmen, Dongguan, Zhongshan, Huizhou and Zhaoqing. Source: Data based on Guangdong Province Statistical Yearbook 2014; United Nations Conference on Trade and Development (UNCTAD) Inward FDI Performance 2014.
The Pearl River Delta’s labour market employs around 38 million people, about 5 percent of China’s workforce. Of these, some 40 percent are employed by companies based in Hong Kong, China.557 The region also accommodates 52 million migrants, or some 21
284
percent of all migrants in China.558 Wages are significantly higher than averages for China as a whole. 11.2.1 City Economic Competitiveness The Economist Intelligence Unit Hot Spots 2025: Benchmarking the future of competitiveness of cities published in 2013 ranked the three major component cities of the Pearl River Delta. The overall rankings were: Hong Kong, China 4th (69.3/100), Shenzhen 52nd (51.7/100) and Guangzhou 64th (47.4/100). While these scores do point out the significant differences in the level of development within the Pearl River Delta, the relatively lower scores for mainland cities need to be put in perspective. Shenzhen ranks only one place behind Rome, and above Budapest, Lisbon and Tel Aviv. Guangzhou ranks above Santiago and Johannesburg. Further detail on components of this index will be given in the relevant sections of the chapter. 11.2.2 Key Industry Growth Sectors The Pearl River Delta’s regional industrial output (excluding Hong Kong, China and Macau) at 2013 prices was CNY 9,069.15 billion (USD 1.46 billion), where light industry contributed 36 percent, and heavy industry 64 percent. The number of enterprises with an annual revenue of over CNY 20 million (USD 3.2 million), in 2014 and their gross industrial output are summarized in Table 11.2, categorized by industrial sectors.
285
Table 11.2 Key Industrial Sectors in the Pearl River Delta, 2014 Industrial sector
No. of enterprises
Gross industrial output (million USD)
Manufacture of communication equipment, computers and other electronic equipment
4,319
401,962
Manufacture of electrical machinery and equipment
3,750
165,012 74,286
563
Manufacture of automobiles
Manufacture of raw chemical materials and chemical products
1,677
74,099
3,302 63,865
Manufacture of textile garments, apparel and footwear
61,995 2,638
Metal products Plastic products
2,655
53,478
1,080 47,785
Manufacture of cultural, educational and sports articles
1,294
42,683
Petroleum refining, coking and nuclear fuel processing
54
35,101
Agriprocessing
405
25,386
Smelting and pressing of metals
905
64,751
2,473
75,657
Nonmetal mineral products
Manufacture of machinery
Note: Data refer to enterprises with annual business revenue over CNY 20 million (USD 3.2 million). Source: Based on data from Guangdong Province Statistical Yearbook 2014.
It should be noted that the value of electronics is presently almost eight times that of automobile production and over five times that of petrochemicals; and that these two
286
sectors are seen as potential growth areas for the Pearl River Delta. While some labourintensive industries, such as garments, now constitute a smaller proportion of total output, electronics assembly is highly labour-intensive and currently low value-added. 11.2.3 Trade Annual exports from the Pearl River Delta totalled USD 608.17 billion in 2014, with annual imports totalling USD 411.54 billion.559 The foreign trade activity of the Pearl River Delta historically has been concentrated in the top-three export destination region/economies, which are Hong Kong, China; the United States; and the European Union. In 2013, Hong Kong, China saw USD 523,286 million import of goods and USD 458,724 million export of goods. Mainland China was the biggest trade partner, representing around half of the imports and exports with Hong Kong, China. Other major trade origin or destination economies and regions account for roughly a quarter of the foreign trade, including the United States; Japan; Chinese Taipei; Singapore; Viet Nam; and India. Hong Kong, China re-exports most of its imports (Table 11.3).
Table 11.3 Total Imports and Exports of Goods for Hong Kong, China, million USD, 2013 Imports
523,286
7,010
Domestic export
451,714
Re-export Total exports
458,724
982,010
Total trade
64,562
Trade balance Source: Based on data from China Statistical Yearbook 2014.
The bulk of its imports and exports are to the PRC (Figure 11.2), indicating that Hong Kong, China is a major node for PRC exports to the rest of the world and that many PRC imports are routed through Hong Kong, China, speaking to the quality of its logistics and value-added trade services.
287
Figure 11.2 Hong Kong, China’s Imports by Origin (right) and Domestic Exports by Destination (left), 2013
Others 27%
Others 32%
PRC 48%
USA 5% SGP 6%
CT 7%
VN 3% CT 4%
JPN 7%
PRC 46%
USA 10% SGP 5%
Note: PRC = China (mainland); JPN = Japan; SGP = Singapore; CT = Chinese Taipei; USA = United States of America; VN = Viet Nam. Source: Based on data from China Statistical Year Book 2014.
The composition of trade of the Pearl River Delta and Hong Kong, China has changed significantly since the turn of the century, with the percentage of exports destined for Japan, the United States and Europe declining, and the percentages destined for ASEAN and ‘other markets’ (Latin America, Australasia and Africa) rising. Further, there has been a gradual shift from labour-intensive to capital-intensive industries, particularly electronics.560 Much of this shift has occurred because of the relocation of industry from Hong Kong, China to the Pearl River Delta – mainly into the surrounding provinces (Figure 11.3). This restructuring represents a push factor of higher wages in the coastal provinces and the pull factors of lower wages and labour availability on the one hand; and significant subsidies for relocation on the other hand.
288
Figure 11.3 Relocation of Industry from Hong Kong, China
Source: Fung Business Intelligence Centre, ‘China’s industry relocation and upgrading trends: Implications for sourcing business’, China Distribution and Trading (56) (2008).
11.2.4 Investment Environment The strengths of the Pearl River Delta region were grounded in the effective use of China’s SEZ policy. This policy was a concrete manifestation of the government’s wish to foster a supportive investment environment, which would take advantage of China’s large pool of relatively well-educated, disciplined and lower cost labour. The influx of engineers and scientists from inland China and abroad has transformed Shenzhen, in particular, into a high-tech centre; and other areas in the Pearl River Delta have benefited from the spill-over effects. The integration of the Hong Kong, China and Macau SARs into the Chinese economy, substantially preserving their open investment climate, was further testament to the coherence of support to investment provided by the PRC government. As development has proceeded, the investment promotion activities have evolved, moving to foster higher value-added industries as manufacturing costs and sophistication increased. Through market feedback and administrative response, the costs of doing business in the Pearl River Delta have always been reasonably well-calibrated to world markets. While substantial initial infrastructure spending was required, cost recovery for the services, through both user charges and other taxes, was sufficient to provide good and constantly improving infrastructure.
289
The urban areas of the Pearl River Delta have exhibited high levels of innovation in response to the huge pressures of growth. Guangzhou has arguably China’s most effective busway, integrated with appropriate land-use planning to foster effective use of the infrastructure. Shenzhen has put in place effective infrastructure for its burgeoning industries, using innovative methods of mobilizing finance from developers. Hong Kong, China has long been a bastion of proactive and innovative land-use transport planning. However, these examples of innovation have not yet become ubiquitous, with systems of accumulating, disseminating and incentivizing the use of best practice largely lacking. Actual factory and housing construction were left to the private sector (including stateowned enterprises) and corporatized ‘industrial estate companies’ in multi-tenant factory buildings and on large sites for heavy industry. This policy was designed to allow flexibility to cater for a range of industries – smaller scale industries relocating from Hong Kong, China; state-owned enterprises from China; and foreign direct investment (FDI). Significant challenges remain in the area of human capital. The rising cost of labour is a concern. Also in question is the ability to continue attracting migrant labour in the face of increased job opportunities in the ‘sending’ provinces (due to the PRC’s policy of developing the western regions of the economy). The results of such policies in the current international context are shown in the ranking of component Pearl River Delta cities in the Economist Intelligence Unit’s Hot Spots index of 120 major cities.561 Hong Kong, China received the ranking of 18th and 1st in the ‘economic strength’ and ‘human capital’ categories, with Guangzhou scoring 4th and 70th, and Shenzhen scoring 2nd and 41st respectively. This shows a potentially highly synergistic pattern of existing development – but that human capital needs to be further developed. The realization of any these synergy synergies would will also depend on attracting the needednew investment for the required infrastructure and institutions. Another area of strength for the Pearl River Delta is that the transaction costs for running a business were systematically addressed over time. They included streamlined administrative control; relative independence for local planning authorities; direct access to provincial and central level planning units; access to tax breaks; free or low duties on imported equipment and production materials; free or low-rent business accommodation;562 flexibility in hiring and firing workers; depreciation allowances; negotiated limited access to the domestic Chinese market for goods produced within SEZs; and residence and work permits and income tax exemptions for foreigners working within the SEZs.563 While the region has been the focus of extensive, coordinated and effective policy reforms at various levels of government to promote urban efficiency and external trade, significant challenges remain in the context of encouraging more endogenous, service-focused growth. It is only recently that the issue of integration of the various economic initiatives existing in the region and the desire to coordinate and create synergies between them has emerged. Current practice has resulted in wasteful competition, with underutilized infrastructure being a burden on local authorities. While such destructive competition is recognized as a problem, the required analysis and institutions (see Section 11.4) to address it are not yet developed. In particular, the intra-Pearl River Delta flows of trade
290
and the spatial pattern of exports need to be better established, and the constraints to more effective utilization of investment need to be better understood. 11.2.5 Innovation and Business Support In regard to its enterprises, the Pearl River Delta region has significant capacity to support the development of local clusters and their supply chains, including financial support. Key interventions (relating to Shenzhen) include:
Quality support services. The Shenzhen Quality Assurance Centre was established in 1992, funded by the Shenzhen Technology Monitoring Bureau. Productivity enhancement services. The government funded the Shenzhen productivity promotion centre to maintain a wide range of productivity enhancement services, including laboratory facilities, specialized training courses and a variety of consultancies.564 Information services. The Shenzhen Science and Technology Bureau established the Technology Market Centre in 1993. The purpose of the centre is to present industrial firms with information on new technology, and promote the diffusion of new technology. Other such support has since been created. Protecting intellectual property. In order to encourage the transfer of more technologies to Shenzhen SEZ via FDI, and to motivate technological innovation, the Shenzhen SEZ government has taken numerous steps to protect intellectual property, including enacting and enforcing new laws
While such measures support existing industries, and foster higher quality production by those industries, most of them do not, of themselves, foster innovation. Support for innovation is a challenge that requires a commitment to world-class R&D and product development. Hong Kong, China has had an Innovation and Technology Commission since 2000. Significant resources are available for the support of R&D. There has been a joint Guangdong and Hong Kong Technology Funding Scheme since 2004. But generating results in terms of creating high value-added jobs (to replace those moving to the western provinces) remains a challenge. The results of existing policies are shown in the ranking of component Pearl River Delta cities in the ‘global appeal’ category of the Economist Intelligence Unit’s Hot Spots index. Hong Kong, China ranked 6th, Guangzhou 88th and Shenzhen 102nd. While Hong Kong, China fares well, the lack of support from the remainder of the Pearl River Delta is a challenge. The financial sector is also a strength of the Pearl River Delta, and especially in Hong Kong, China. Chinese officials and business leaders continue to stress the importance of Hong Kong, China as the facilitator and intermediary for investment business between China and the rest of the world. But new financial districts are being built in Guangzhou and Shenzhen to service the Pearl River Delta region in China. The second wave of cooperation between Guangdong and Hong Kong, China will need to focus on developing an integrated regional services industry – particularly in financial services – and the traditional model will reverse. Hong Kong, China will become the ‘back-end factory’, using its global connections and technical expertise to help Guangdong build a financial services platform, funnelling the investment and services expertise needed for the next
291
phase of economic expansion into the mainland. Guangdong will play the role of the ‘front-end shop’ in financial services by exploiting and utilizing its enormous economic potential to develop into a high-consumption province supported by dynamic financial services.565 The results of existing policies are shown in the ranking of component Pearl River Delta cities in the ‘financial maturity’ category of the Economist Intelligence Unit’s Hot Spots index. Hong Kong, China received a ranking of first along with eight other world cities. Guangzhou ranked 92nd, and Shenzhen was 25th. Hong Kong fares exceptionally well, but the lack of financial services support to companies in the remainder of the Pearl River Delta is a cause for concern. 11.2.6 Industry Clusters The Pearl River Delta has an extremely well-developed set of manufacturing clusters that are horizontally and vertically integrated, with effective supply chains, both within the Delta area and linking to broader global markets (Table 11.4). Interestingly, the two banks of the Delta are themselves specialized, with the east bank focusing on electronics and IT products, and the west bank on household appliances. Such physical focus shows the importance of competitive advantages, gained by concentrating geographically.
292
Table 11.4 Clusters in the Cities of the Pearl River Delta City
Clusters
Guangzhou
Autos and parts, transport equipment, electrical products, electronics, chemicals, garments, textiles, business services, software, toys
Panyu*
Sports goods, textiles, garments, jewellery, toys, electric supply equipment, shipping containers
Shenzhen
Electronics, computer products, telecom products, integrated circuits (ICs), toys, plastics, watches, clocks, oil paintings, port services, logistics, finance, printing, artificial trees
Dongguan
Electronic computers, components, peripherals, garments, furniture, shoes, toys, watches, clocks, cutlery, kitchen tools, soldering machinery, angling equipment
Huizhou
Laser diodes, digital electronics, CO-ROMs, telephones, batteries, circuit boards, precision machinery, plastics, chemicals
Zhongshan
Lighting fixtures, lamps, metal products, motorcycles, casual wear, locks, audio equipment
Foshan
Industrial ceramics, ceramic artwork, needlework, textiles, children’s garments
Chencun*
Flower farming, ornamental fish, turf farming
Nanhai*
Textiles, aluminium products, motorcycles, underwear
Shunde*
Electrical appliances, woodworking, shipping containers, furniture, machinery, bicycles Textiles, garments, paper, batteries
Jiangmen * Panyu is a district of Guangzhou; Chencun, Nanhai and Shunde are districts of Foshan. Source: Data from M.J. Enright, E. Scott and K. Chang, Regional Powerhouse: The Greater Pearl River Delta and the Rise of China. (Singapore: John Wiley & Sons (Asia), 2005)
The Pearl River Delta region’s success is in light manufacturing for the electronics industry; but heavy industry is growing relatively quickly. However, many firms are moving to less labour- and more capital-intensive enterprises, reflecting labour shortages
293
and a growing trend toward computer-aided manufacturing. The policy focus for future development will be the higher-value telecommunications, equipment manufacturing, auto and petrochemical industries. For example, Guangzhou is becoming one of the three auto manufacturing bases in China. The number of sedan cars produced in Guangdong reached 1.55 million in 2013, accounting for nearly 12.8 percent of the PRC total. Cities surrounding Guangzhou are strengthening the supply chain in this sector by establishing development zones catering to auto parts manufacturing, for example, in Foshan, Zhongshan, Shenzhen and Huizhou Daya Bay.566 Hong Kong contributes much of the marketing and financial services input to these supply chains, although Guangzhou and Shenzhen are rapidly developing such service inputs, particularly as they relate to sales within the domestic PRC market.567 11.2.7 Constraints to Economic Development The National Development and Reform Commission succinctly summed up the challenges to the Pearl River Delta: The overall industrial level is low, the value added to the products is not much, the trade structure is unreasonable, the innovative capability is insufficient, and the overall competitiveness is not strong; the land has been excessively developed, the ability to guarantee energy and resources supply is inadequate, the problem of environmental pollution becomes prominent, the constraints of resources and environment are outstanding, and the traditional pattern of development is unsustainable; the imbalance of development still exists between the urban and rural areas and among different regions, the distribution of production forces is not rational, and the use of space is not efficient; the social undertakings remain relatively backward, and the levels of human resources development, public services and the cultural soft strength need to be further improved; the reform of the government and social administration systems are still strenuous, and the prebreakthrough reforms face ever more challenging difficulties.568 While many of these issues are being addressed, collectively they remain significant and inter-related. Development of the service industry, and indeed higher value-added manufacturing, is constrained by the problems of pollution which dissuade the highly skilled but globally mobile workers that are needed. The development of heavy industry is restricted by water and other resource constraints. It is important to stress that almost all of these constraints are urban management issues. In recognizing this, China is very advanced. Economies burdened with policymakers steeped in conventional economic theory ignore the spatial aspects of the economy and the implications of the fact that most economic assets are physically located in cities. Chinese economic policy thinking specifically integrates implementation mechanisms grounded in city administrations and implemented through investment in urban areas. Several challenges are particularly important for the Pearl River Delta. Many industrial clusters there have a large operational scale, but (as flagged by the National Development and Reform Commission) the profit margin of many established industries remains low. For example, while the sales price of some types of cloth is 50 times the manufacturing
294
cost, the producer in the Pearl River Delta has a 3 percent (or less) profit margin. Further, as industries mature with consequent decreasing margins, and cities and towns compete for manufacturers in the same established sectors and types of industries, the returns on infrastructure investment decrease. There are about 18 major textile and apparel clusters across the Pearl River Delta producing comparable cloth with a similar design. This often means cut-throat competition for FDI and export contracts.569 The low-end and labour-intensive manufacturing industries based in the region are traditionally in need of cheap labour and resources. However, labour cost is rising. The new labour law implemented in January 2008 reduced the employer’s bargaining power and legalized mandatory social security and overtime payment for workers, increasing labour costs by up to 25 percent. In addition, many companies, but particularly SMEs, have been confronted by other rising cost of inputs. The global financial crisis, and its consequences, pushed up borrowing rates (after an initial loosening) and inflation is rising in China. Prices of oil-related products and other main raw materials, such as coal, fibre, paper and important raw materials, had been rising rapidly, although the post-2013 economic slowdown has eased these pressures. Competition from cheaper areas of China, especially in the case of lowerend manufacturing, is also being felt; this is occurring with the support of the central government as set out in the discussion of industrial relocation in Section 11.2.3.570
11.3 STRATEGIC INFRASTRUCTURE A core strength of the Pearl River Delta is its world-class logistics infrastructure. Urban and provincial governments in the area have focused on improving connectivity between and within cities with the goal of becoming a competitive mega-urban region. In addition to a network of expressways and metro systems, three of the twenty biggest ports in the world are located in the Pearl River Delta: Hong Kong, China; Shenzhen; and Guangzhou.571 However, various concerns remain. Despite an extensive network of expressways, the rapid rise of automobile use is an outcome of income growth and has overwhelmed the transport system with consequent congestion. The focus of public transport investment has been on high visibility metros, but the integration of feeder services generally is poor, despite such excellent examples as the Guangzhou bus rapid transit system. Rail infrastructure expansion has been slow, but ambitious plans are underway to connect the region. Urban infrastructure also remains a challenge. In particular, water, wastewater and solid waste services have lagged behind demand, except in Hong Kong, China. The results of existing policies are shown in the ranking of component Pearl River Delta cities in the ‘physical capital’ category of the Economist Intelligence Unit’s Hot Spots index. Hong Kong, China received a ranking of first together with seven other cities. Guangzhou ranked 59th, and Shenzhen 102nd. While Hong Kong, China fares well, the weak performance of the remainder of the Pearl River Delta is a surprise and reflects the lower
295
levels of service provided by the components of infrastructure other than roads and freight. Education and health services are also not keeping pace with the expectations of citizens. For the migrant population, services are even less accessible. Hong Kong, China boasts world-class education and health facilities. Even in Hong Kong, China, the cost of such services is a problem for many lower-income workers and their families. However, the situation in the remainder of the Pearl River Delta is even worse. Financing the required range of strategic infrastructure is also a challenge for the region. Hong Kong, China’s combination of effective property tax and use of land value capture has (among other factors) enabled it to build world-class infrastructure on a sound fiscal base. Other local governments in the Pearl River Delta are not so well established. While the use of land conversion to finance infrastructure has been very successful, the longterm viability of this strategy is very questionable, particularly in the context of the need to fund increasing levels of services for native-born and migrant populations. The Chinese government has recently allowed some local governments to issue bonds and has started to promote PPPs as a funding modality for infrastructure. This is a welcome expansion of the options open to city and provincial governments, although many have been issuing debt and doing what might be called ‘state-owned enterprise (SOE)–private partnerships’ for years through investment companies funded by domestic banks and trusts. Such financing modalities must, however, be based on a sustainable revenue base, either from general taxation and/or user-pays charges. Neither is currently in place. The introduction of a broad-based property tax at a significant rate is urgent. 11.3.1 Assessment of Physical Infrastructure and Assets The existing and planned highway and rail network serves as the backbone of the Pearl River Delta as illustrated in Figure 11.4. This backbone will be reinforced by high-speed passenger and dedicated freight railways. The network links the core airports and ports of the region, integrating the economy of the Pearl River Delta, reducing costs for enterprises in access to common-user infrastructure facilities and through savings in the time taken to reach markets. Figure 11.4 also shows the scale of regional infrastructure projects launched by the regional governments of Guangdong province and the Pearl River Delta to stitch the southern end of the area together, creating a closely integrated economic region. Such projects have focused on improving regional connectivity and access to export hubs. These investments will redefine the economic space and spatial relations among Pearl River Delta cities and further encourage the integration of the areas outside Pearl River the Delta region. The infrastructure projects boost regional connectivity on three levels: (i) improve connectivity within the Pearl River Delta region and other parts of Guangdong province; (ii) streamline and enhance cross-boundary links in the Greater Pearl River Delta region, especially the links between the Pearl River Delta region and Hong Kong, China and Macau; and (iii) expand the connectivity of the Greater Pearl River Delta
296
region to international economies and other mainland China regions. Key investments are set out in the Table 11.5.
Figure 11.4 Cross-Boundary Transportation Facilities in the Greater Pearl River Delta City–Region
Source: T.M.H. Chan, J.H.W. Yung and M. Chung, The Greater Pearl River Delta, 7th edn. (Hong Kong: Invest Hong Kong, 2014).
297
Table 11.5 Key Transport Infrastructure Investments in the Pearl River Delta Connectivity
Infrastructure
Within the Pearl River Delta region and Guangdong province
Railways
Expressways
Cross-boundary links in the Greater Pearl River Delta region
Railways
Expressways
International and external connectivity
Airport Development
Container Terminals
Selected Major Projects under Construction/Planning
High-speed railways to Nanning, Guiyang, Xiamen and Maoming
Intercity railways linking cities and major towns in the Pearl River Delta region
Metros or urban transits in Guangzhou, Shenzhen and Dongguan
1,110km network in the PRC and 3,410km provincial network in the 12th Five-Year Plan period
Guangzhou–Shenzhen–Hong Kong Express Rail Link
Hong Kong–Shenzhen Western Express Line
Hong Kong–Zhuhai–Macao Bridge
Liantang/Heung Yuen Wai Boundary Control Point
The third, fourth, and fifth runways of the Guangzhou Baiyun International Airport and its neighbouring economic zone
The third runway of the Hong Kong International Airport
The third runway of Shenzhen Bao’an International Airport
Phase three of Nansha Port in Guangzhou
The container ferry in Yantian Port and phase two of Dachanwan Port in Shenzhen
Source: Based on information from T.M.H. Chan, J.H.W. Yung and M. Chung, The Greater Pearl River Delta, 7th edn. (Hong Kong, China: Invest Hong Kong, 2014); Hong Kong–Zhuhai–Macao Bridge Related Hong Kong Projects, ‘Project benefits: Transportation’, accessed 31 October 2016, http://www.hzmb.hk/eng/benefits_transportation.html
11.3.2 Logistics and Information Systems Hong Kong, China is the site of the second-largest container seaport and the secondlargest freight airport in the world. Two other important ports are located in neighbouring Shenzhen and Guangzhou, making the region around the Pearl River Delta China’s most important logistics hub. Logistics has been a core focus of the various levels of governments – often to the exclusion of other infrastructure needs. Logistics hubs – ports,
298
trucking hubs, and intermodal facilities – have been strongly supported by governments in the following ways:
Assisting in project development: 85 percent of the logistics parks are initiated by local governments. Investing in infrastructure. Facilitating the provision of sufficient space for future development. Applying a special tax policy to logistics enterprises in logistics parks. Ensuring that cluster formation leads to high levels of synergy because the purchasers of logistics services are specialized and physically concentrated, e.g. Automobile Logistics Park, Food Logistics Park and Chemical Logistics Park . Promoting investment in logistics IT systems and platforms.
However, there are some problems in implementation, including:
Sometimes land speculation is the driving factor in the establishment of such parks, and easy finance for purchasers has led to unsustainable land price increases in some cities and regions. Overcapacity and bottlenecks exist. In general, the parks have a 40 percent utilization rate; but popular ones have traffic, resources (e.g. water) and pricing problems. Corruption in the allocation of land exists. Sometimes form rushes ahead of function; and high-quality campuses and other buildings are built with little consideration given to the market requirements of the clusters served. Detailed planning restricts flexibility and the capacity to change as the needs of a cluster changes. Multimodal transport is not sufficiently encouraged. Some logistics parks have only a road connection.572
In order to increase the efficiency, effectiveness and sustainability of the Pearl River Delta industry, multimodal transport options is particularly important. It is essential for the achievement of efficiency and sustainability goals that goods are routed through the most efficient mode of transport and the ease (transaction costs) of interchange between modes will determine this. 11.3.3 Operation and Maintenance of Infrastructure Except in Hong Kong, China, a lack of asset management systems and the ease of justifying and financing capital investments has militated against effective operation and maintenance (O&M). Old assets have been rebuilt. This is environmentally and financially inefficient. Better asset management and more rigorous project appraisal will help. Given the rebalancing of growth in China and a move away from an automatic recourse to new build, continuing growth in the Pearl River Delta will increase the stress on infrastructure. The region’s cities also need to increase their resilience to events occurring both inside and outside of the region as a result of natural or technological hazards, human error or equipment failure.
299
The need for Pearl River Delta cities to future-proof against disruption to infrastructure supply and network systems, particularly in respect of the vulnerability of the region to typhoons, requires a series of actions to improve the operation, maintenance and replacement of urban utility services. Infrastructure failure can be significant and costly. As a risk management strategy, utility service agencies need to undertake comprehensive asset management planning to reduce the possibility of future failure and ensure that services are re-established as soon as possible if failure does occur. 11.3.4 Future Infrastructure Needs Planned infrastructure projects feature a heavy continued emphasis on high profile transport infrastructure, specifically high-speed and freight railways (Figure 11.5). However, the need to further develop other aspects of strategic infrastructure, such as higher education, better health services, and a healthier environment, is not sufficiently emphasized. Reliance on Hong Kong, China alone for higher value-added internationally competitive services is unlikely to generate the incomes needed to further increase the GDP per capita and quality of life of the Pearl River Delta’s citizens. Much future investment in infrastructure is projected to include PPP elements. The main PPP modalities for key sectors are:
Railways. Passenger rail is highly subsidized but effective in minimizing car traffic. Freight rail is very important to reducing truck traffic, but also highly subsidized. Opportunities are mainly through availability payment schemes. Metro extensions. Property based value capture on the Hong Kong, China model is both possible and intended. Water supply. This is dependent on cost recovery tariffs or availability payments from the local governments. Health. The provision of health services by PPPs through availability payments is both feasible and equitable. Full-cost recovery PPPs in the sector will only serve the higher income groups. Education. Availability payments for schools are now routine, but performancebased contracts for teaching may also be possible.
300
Figure 11.5 Development of the Regional Intercity Railway Network, Guangdong
Source: Based on the Plan on the Development of Integrated Transportation System of Guangdong Province in the 12th Five Year Plan Period; T.M.H. Chan, J.H.W. Yung and M. Chung, The Greater Pearl River Delta, 7th edn. (Hong Kong, China: Invest Hong Kong, 2014).
For many of these PPP modes, a sustainable revenue base is essential. As many infrastructure projects are not able to cover capital and O&M costs from user fees, a stable subsidy stream, or availability payment, will be necessary from local governments. The key to such revenue streams is land-based revenues – from property tax in the case of availability payments and from development/land taxes for public transport. Structuring such projects to ensure the community does not lose out is not trivial and is not well understood by Pearl River Delta governments. Further, the use of land sales as a major source of such revenue is not sustainable and should be avoided.
11.4 SOCIAL SUSTAINABILITY Social challenges have grown as growth has accelerated. The rural migrants who provided the labour in the factories of the Pearl River Delta were largely shut out of the social services available to residents of the urban areas as they did not have the required residency permit. However, Guangdong has exhibited strong leadership in social policy, progressively extending to migrants the rights to such services.
301
Cities such as Foshan continue to prosper, powered mainly by migrant labour. Social stability hinges on providing services to attract and retain those workers. Half of Foshan’s population and about two-thirds of its workforce are migrants. Despite lower average incomes and living standards than Foshan citizens, migrants are making significant improvements to their productivity and lifestyle by moving to Foshan and other growth poles. They are also increasingly able to access the same social services as locals due to reforms, especially in the areas of vocational training, healthcare, housing and social security.573 Other cities are starting to emulate such practices. Despite reforms, strikes fuelled by price rises in relation to incomes and/or companies not providing statutorily mandated benefits have broken out – sometimes on a massive scale. In the Pearl River Delta, like in the rest of China, the housing market is a serious challenge and source of social exclusion, with the availability of affordable housing well below needs. This leads to crowding or use of dormitory accommodation, both of which do not promote social harmony. This is recognized by the central government, which has instituted a number of programmes to address the issue. However, the programmes are implemented mainly through local governments which have, in many cases, few incentives to pursue them; and progress has been slow. In 2014, the central government increased its support to the programme in an effort to speed up implementation.574 The results of existing policies are shown in the ranking of component Pearl River Delta cities in the ‘social and cultural’ category of the Economist Intelligence Unit’s Hot Spots index. Hong Kong, China ranked 42nd, Guangzhou 94th and Shenzhen 96th. While Hong Kong, China’s performance is best, it lies at the very low end of the developed cities with which it must compete. The performance of the other Pearl River Delta cities is poor.
11.5 ENVIRONMENTAL SUSTAINABILITY: POLICIES AND MEASURES Environmental issues in the Pearl River Delta are a major challenge. The Delta is notoriously polluted.575 The capacity of sewage and industrial waste treatment facilities have lagged behind the growth in population and industry. Much of the area is frequently covered with a brown smog, which affects Hong Kong, China and consequently its attractiveness to the very high value-added companies and individuals it needs. In 2007, the World Bank approved a USD 96 million loan to the PRC government to reduce water pollution in the Pearl River Delta.576 In December 2008, it was announced that CNY 48.6 billion (about USD 7.1 billion) would be spent by mid-2010 to clean up the river’s sewage problems in the Guangzhou area. The city is building about 30 water treatment plants, which will treat 2.25 million tonnes of water per day. The environmental improvement programme is intended to reduce the amount of sewage in the region by 85 percent. But much of the pollution is related to industrial activity. The 2009 Greenpeace East Asia report, Poisoning the Pearl River, detailed the results of a study in which 25 samples were collected from five manufacturing facilities in the Greater Pearl River Delta. 577 The study concluded that all the facilities sampled were discharging wastewater containing chemicals with proven or suspected hazardous properties, including heavy metals.
302
Action is being taken. In 2013, Guangdong announced a further CNY 117 billion (USD 18.9 billion) programme to cut water pollution. In 2014, the Guangdong government announced the implementation of its air pollution action plan, which requires PM 2.5 in populated regions and cities to be reduced by 15 percent by 2017. To achieve the goal, the action plan puts forward measures, including desulphurization and denigration, the removal of nitrogen compounds in industrial production, controlling ozone pollution and developing green transportation. Some 90,000 vehicles were phased out of use in 2013 because of heavy exhaust emissions.578 Cities in the Pearl River Delta are particularly susceptible to natural disasters and climate change. Given the concentration of infrastructure, non-agricultural activities and population in those cities, such disasters could severely impact economic activities and daily life. Rainstorms and typhoons frequently occur in the region and typically cause serious damage and huge economic losses. During the 2000–2007 period, for instance, rainstorms and typhoons in Shenzhen caused cumulative direct economic losses of CNY 525 million (USD 80 million) and 277 million (USD 41.5 million) respectively, accounting for approximately for 63 percent and 33 percent of total direct economic losses associated with all meteorological hazards in the city.579 The results of existing policies are shown in the ranking of component Pearl River Delta cities in the ‘environmental and natural hazards’ category of the Economist Intelligence Unit’s Hot Spots index. Hong Kong, China received a ranking of 72nd with Shenzhen and 12 other cities; with Guangzhou scoring 59th with 10 other cities. The overall result for the Pearl River Delta is poor.
11.6 EFFECTIVENESS OF URBAN GOVERNANCE The governance structure of the Pearl River Delta is set out in Figure 11.6. It is clear from various studies and observations that, despite the clear directions provided by the State Council and the National Development and Reform Commission, coordinating such a structure is a challenge. In addition to the level of complexity, the operational divisions between sectoral agencies are particularly challenging in China.
303
Figure 11.6 Government Structure in the Pearl River Delta (PRD)
Source: C. Miu, Pearl River Delta (Sydney: Australia-China Chamber of Commerce & Industry, 2005).
In the face of pressure from growing competition from cities in the Yangtze River Delta region, the Guangdong provincial government and other Pearl River Delta cities recognized the urgency and necessity for the development of a ‘Greater Pearl River Delta’ as an integrated economic region. The Guangdong provincial government has initiated a ‘Pan-PRD’ concept, to ‘avoid duplicating construction, achieving better coordination among nine PRD [Pearl River Delta] cities with two Special Administration Regions (Hong Kong and Macau), and exploring new development opportunities within the delta region’.580 In 2004, a Pan-PRD Regional Cooperation and Development Agreement was signed. The major changes and characteristics of Pan-PRD spatial development were finalized by the Cross-boundary Liaison System in 2007 and featured the following:581
Improving cooperation with neighbouring provinces (Fujian, Jiangxi, Hunan, Guangxi, Hainan, Sichuan, Guizhou, Yunnan). Strengthening transport linkages between regions of the Pearl River Delta. Developing the western region of the Pearl River Delta. Better integration of Hong Kong, China and Macau into the Pearl River Delta.
While such a structure is very desirable, the challenge is to create a coordination mechanism, and to institutionalize that mechanism and provide it with sufficient resources to undertake the analytical and liaison work required. This is difficult, given the autonomy of provinces and local governments in China. The results of existing policies are shown in the ranking of component Pearl River Delta cities in the ‘institutional effectiveness’ category of the Economist Intelligence Unit’s Hot Spots index. Hong Kong, China received a ranking of 22nd with Shenzhen and 12 other cities; and Guangzhou was 59th with 10 other cities. The overall result for the Pearl River Delta is poor.
304
11.7 PARTNERSHIPS FOR SUSTAINABLE DEVELOPMENT 11.7.1 Development Partnerships The component province, SARs and cities have different types and levels of partnerships that support the development and management of the region. Many of these involve the creation of formal structures, especially the public–private sector partnerships between government and business. Others are less formal and involve networks and associations of professional, community and cultural interest groups. The following describes the core partnership types.
Government-to-government partnerships
The Closer Economic Partnership Arrangements (CEPAs) between the central government of the PRC and the two SARS – Macau and Hong Kong, China – focus on coordination of economic development activities.582 The Hong Kong, China CEPA, signed in 2003, represents a major move toward economic integration between the mainland and Hong Kong, China, by reducing or eliminating tariffs and non-tariff barriers on substantially all the trade in goods between the two. This has given Hong Kong, China goods and services much greater access to markets in the mainland. Annual supplements to the agreement set out areas for further cooperation. The Macau CEPA, also signed in 2003, sets out the mechanisms for the liberalization of the goods and services trade and the conditions for improved economic relations, in particular in relation to investment. Under these agreements, separate ‘twinning’ of agencies occurs, for example, between the environmental agencies of Hong Kong, China and Guangdong.
International city-to-city relationships
These include sister city relationships and membership of specific interest groupings such as the C40 or Metropolis. These relations have been given a much higher profile with the establishment of the Guangzhou Institute for Urban Innovation which has instituted an international Award for Urban Innovation.
Partnerships involving institutions.
These are partnerships between institutions – such as educational institutions –resident in the cities of the region with other cities in the region or with international partners. For example, Sun Yat-Sen University, the top university in Guangdong province, has established the office of international cooperation and exchange for affairs related to Hong Kong, China; Macau; and Chinese Taipei. It now has two joint institutions: the Sino-French Institute of Nuclear Engineering and Technology and the Sun Yat-sen University–Carnegie Mellon University Joint Institute of Engineering. The office operates three international cooperative programmes offering Master’s degrees and PhDs in international business and business administration.
305
A good example of a regional partnership between an educational institution and the private sector is the School of Medicine and the Life Science Institute of the South China University of Technology. The school is run cooperatively by the university, Guangdong Provincial People’s Hospital and Shenzhen Baoneng Investment Group. The university also has a School of Continuing Education which organizes training courses for senior professional managers in regional enterprises and party members both within Guangdong province and other provinces in the Pan-PRD region such as Henan and Guizhou.
Partnerships involving the private sector
The private sector may enter into partnerships with the government or between industry associations. In particular, PPPs have occurred in the infrastructure space, the water sector and for rail investments. However, these have not been transparent in their structures and are unlikely to be replicated. The PRC government recently introduced an improved framework for such activity.
Figure 11.7 Outbound High-Speed Railways of the Greater Pearl River Delta Region
GPRD=Greater Pearl River Delta; PRD=Pearl River Delta Source: Planning Department of the Government of Hong Kong SAR, ‘Plans for cooperative development of transportation’, in Planning Study on the Co-ordinated Development of the Greater Pearl River Delta Townships (Hong Kong, China: Department of the Government of Hong Kong, 2009), Ch. 5.
Given the stated goal of ‘the prioritization of transport infrastructure promoting regional functional integration’,583 the Pearl River Delta Townships Coordinated Development,
306
Planning and Governance Office (which is implementing the Pearl River Delta Townships Regulation) is fostering institutional integration within the region. An example of the partnerships being forged under these structures is best given by considering the most prioritized infrastructure investment – the high-speed intercity rail in the region. There are 16 intercity railway lines operating or under construction in Guangdong province to enhance the connection within the Greater Pearl River Delta, the rest of Guangdong province and other provinces in the Pan-PRD region (Figure 11.7). 584 The Guangzhou–Zhuhai Line was the first high-speed intercity railway built in Guangdong province and also the first joint-venture line in the Pearl River Delta. Although there are no statutory clauses in China’s Railway Law (implemented since 1991) for the funding of railways, joint-venture projects are increasingly used for regional public infrastructure projects to alleviate the rising financial burden on the ministry responsible (up to 2013, this was the Ministry of Railways; it was succeeded by the State Railway Administration and the China Railway Corporation under the Ministry of Transport).
Figure 11.8 Institutional Arrangements for Railway Development in the Pearl River Delta through Province–Ministry Cooperation
Note: The Ministry of Railways has been dissolved and merged into State Railways Administration and China Railway Corporation under Ministry of Transport. Source: J. Xu and A.G.O. Yeh, ‘Interjurisdictional cooperation through bargaining: The case of Guangzhou–Zhuhai Railway in the Pearl River Delta, China’, The China Quarterly 213 (2013): 130–51.
307
Three major dimensions of relations are involved in the process of intercity railway provision. First, there are inter-ministry conflicts between the National Development and Reform Commission and the Mministry spearheading the development of railway infrastructure (the Ministry of Railways and its successors). The Commission wants to promote diversification of funding sources for regional infrastructure provision while the ministry is reluctant to reduce its influence in the projects. Second, there are tensions between the provincial government and the ministry in terms of the decision-making on the location of train stations, route design and alignment, carriage standards, etc. Third, inter-city politics among the nine Pearl River Delta cities complicate land acquisition and decisions on the level of control of joint-venture lines.585,586 11.7.2 Strategy for the Development of Partnerships While the partnerships developed so far have been important, a more strategic approach to partnership development could be taken. Such an approach would focus on the key economic development objectives and set out to establish relationships with partners in potential markets or commodity suppliers, and with collaborators with the technology related to priority sectors. Thus, other port cities in the APEC region are natural partners as sources of raw materials and/or markets that link to substantial existing or potential hinterlands. Examples include Lima/Callao (links to Brazil), Portland (links to US markets) and Brisbane (links to Australian markets and commodities). 11.7.3 Action Agenda for Development From the above discussion, it is apparent that key areas of focus for a regional strategy for partnership development should be:
Environmental infrastructure investment, particularly in the wastewater sector to augment current efforts and in building resilience Developing and implementing on sustainable basis investments in ‘soft infrastructure’, e.g. health and education Sustainable urban finance. e.g. property tax, cost recovery and PPP Low carbon planning and finance Developing international city-to-city economic links, especially in areas that the Pearl River Delta wants to prioritize, such as education (with partners such as Australian cities), automotive (with partners such as US cities), and heavy industry (with partners such as Korean cities) Establish a more formalized regional planning body capable of guiding development.
11.7.4 Potential APEC partnerships Through APEC, a more effective public–private dialogue can be fostered. This could include linking public–private groupings in the Pearl River Delta with other dialogue organizations (e.g. groupings in Sydney and Portland). This can be done by fostering an APEC-endorsed approach to developing a strategy such as the one discussed above, and to promoting the strategy so that the vision is shared by public, private and community stakeholders.
308
11.8 CONCLUSIONS The Pearl River Delta is a dynamic, globally important region undergoing rapid change. In the last decade, various developments – structural reforms to the central and local government; the opening of the economy to greater competition and FDI; and internal migration – have significantly changed the socioeconomic structure and governance of the region. However, it faces many challenges in managing its continuing rapid urban development, and the associated transport, social and environmental problems. There is widespread recognition and understanding of these challenges, and the need for collective action by government, business and communities to address these. Partnerships and other collaborative initiatives and efforts are important for developing a viable approach to sustainable development. Sustainability is a strong underlining principle of the region’s development objectives, but not necessarily of its implementing organizations. Operational policy and decisionmaking processes of provincial and local government, business and communities are sometimes at odds with the concept. In the area of local economic development, the region has developed a wide range of partnerships between government, business and institutions that do not necessarily make up a coherent whole. As the PRC economy cools, unemployment rates threaten to rise and investment to slow in many sectors. This situation will test the flexibility and adaptability of the region and the effective performance of such partnerships will be key to a successful response to such circumstances. Urbanization is a major challenge to the sustainable development of the region. Rising wealth drives lower density, more energy inefficient housing and the use of cars. There is a pressing need for the region to focus on the greater integration of component cities while retaining high-density development along corridors, between urban nodes and within cities. Decentralization of employment, investment and services through planning support for polycentric city development is essential if the city is to develop more sustainable land-use, employment, transport and urban services delivery systems. Social problems, particularly those relating to migrants and encroachment on rural communities, are potentially significant and are a concern for the future sustainable development of the region. Similarly, its environmental problems are a competitive disadvantage. The Pearl River Delta has the beginnings of an effective governance structure. More effective coordination of local governments will be needed to achieve the ambitious goals for the region set out by the PRC government. It is necessary to develop a structure that will enable local bodies to act uniformly in the interests of the region, to improve the coordination of planning and infrastructure and to make the region’s economy more competitive. Better asset management systems are needed to provide a basis for more effective financial management. Such a governance structure is also the basis for improved use of partnerships underpinning the development of the region, and these partnerships need to be better focused. Thus, while the performance of the Pearl River Delta in putting in place the needed support for sustainable development is impressive, significant challenges are emerging, particularly in the areas of fiscal, social and environmental sustainability. Key lessons learnt relate to the significance of central and local governments working together to build
309
the enabling environment and the logistics components of strategic infrastructure as a basis for productive and complementary domestic and international private-sector investment. Key areas that need to be addressed are clear. Innovation systems need to be bolstered. Significant investment in human capital development is needed to enhance productivity and to support higher value-adding industry. Strategic infrastructure other than logistics, particularly social and environmental infrastructure, needs to be further developed as a high priority. In terms of governance, there is a need to coordinate better the response to these challenges across public and private sectors. A focal point for evidence-based prioritization of development programmes across the three dimensions of sustainable development – i.e. economic competitiveness, social development and environmental improvement – is needed to ensure continued growth on a sustainable trajectory. Such a focal point would have the capacity to break through bureaucratic silos which currently stifle attempts at coordinated development, but need not be a ‘supra-provincial’ entity mooted in some quarters.
310
12. Santiago, Chile Florian Steinberg, Marcela Allué and Jose Tomás Videla
12.1 INTRODUCTION Santiago is the capital of Chile and seat of the federal government. Located in the metropolitan region, and central valley of the Andes mountain range, the city has a population of nearly 6 million, or about 35 percent of Chile’s population. Despite its rather modest size compared with Mexico City or Sao Paulo, Santiago is the seventh most populated city in Latin America. Its metropolitan area (Figure 12.1), known as Greater Santiago, is Chile’s largest urban conurbation. (Greater
Figure 12.1 Map of Santiago Metropolitan Region
Santiago, Greater Valparaiso and Rancagua constitute an even bigger intermetropolitan area.)
Santiago is a dynamic city, and considered one of the best Latin Source: Google Maps 2016. American cities for investment587 and doing business.588 It is Chile’s industrial and financial centre, generating 45 percent of Chile’s GDP of CLP 137.21 trillion ( USD 247 billion) in 2013.589,590 The development of its Sanhattan business district as a major financial hub has been a major boost to its economy. Santiago also has a high quality of life, commensurate with Montevideo and Buenos Aires.591 In 2013, Santiago was classified as the most ‘intelligent’ city in Latin America,592 while its environmental performance was assessed as average in the Siemens Green City Index 2010 for Latin America.593 While the city has undergone an impressive period of physical and economic transformation and development since the 1990s, it still faces many development problems. It is an economically divided city, with significant areas of slum settlement, and high levels of inequality, urban poverty and income disparity. The city also faces many environmental challenges associated with air and water pollution, water shortages and waste management. 594 Despite these difficulties, Santiago is pressing ahead with reforms and improvements to its governance, development and environmental management practices, which include a strong commitment to sustainable development. This chapter profiles the Santiago metropolitan region – its economy, planning and development, environmental
311
management, and social and governance systems. It presents some examples of good practices that could have wider application in Latin America and the Asia-Pacific region.
12.2 THE CITY IN CONTEXT Santiago city sits in the province of Santiago and has 37 communes (districts). The city is part of Greater Santiago, which includes the province San Bernardo and Puente Alto to the south of the capital. The periphery of Greater Santiago includes areas belonging to the provinces of Cordillera, Maipo and Talagante (see also Section 12.8). Santiago city is also part of an inter-metropolitan area in central Chile that also includes the city of Rancagua and the metropolitan area of Valparaiso. Greater Valparaiso’s economic structure is a mix of services and industries related to port activities, tourism, and new technology;595 and Rancagua is a major agricultural hub for central Chile. The three urban areas make up a diverse economic macro-zone of more than 7.5 million inhabitants, which is served by an international airport, two major seaports and one terrestrial connection to the Mercosur zone through the Andes.
Photo 12.1 Sanhattan Business District, Santiago, Chile t
Source: Costanera Norte.
Santiago is the cultural, political and financial centre of Chile. The regional headquarters of many multinational corporations are located there. The city also hosts international institutions such as the United Nations Economic Commission for Latin America and the Caribbean (ECLAC).
312
The city has developed along the axis of a street that crosses it from west to east. Its segments have different names and usually known as Alameda, Providencia and Las Condes as it advances from west to east (close to the mountains). The older area is to the west (the Alameda). Since the early 1990s, a modern financial district has developed in Las Condes. Today, the zone is known as Sanhattan, due to its similarities to Manhattan. The area is seeing rapid growth, with many office and residential buildings in various stages of construction. In 2011, Gran Torre Santiago, a skyscraper that is part of the Costanera Centre project, reached the 300m mark, making it the tallest structure in Latin America. As mentioned earlier, Santiago accounts for the bulk of the economic activity inChile. Its main activities are financial and business services, together with commercial activity. Manufacturing and personal services are also important. The film industry and marketing have developed successfully through small entrepreneurships. In addition, the rail line to the south of Chile and the coast, together with a highly developed regional road system, enhances commercial, processing and marketing activities all across the Santiago metropolitan region. The area also has productive agricultural lands that produce fruits, grains, and vegetables. Dairy and beef production are also significant. To the south and northeast of the capital are mining activities, including copper, gypsum, and limestone mining. Santiago is Chile’s retail capital. Well-known department stores like Falabella, Ripley and La Polar originated in Chile and have expanded within South America. The capital is known for its numerous shopping malls; from older ones like Parque Arauco to Alto Las Condes Mall Plaza (a chain of malls present in Chile and other Latin American economies) and the Costanera Centre, which offers luxury shopping. The Santiago metropolitan region accounts for 45 percent of Chile’s GDP, 53 percent of Chile’s industrial activity, and 68 percent of its commercial activity.596 In this sense, it is a true primate city. Santiago is the home to the most renowned centres of higher education in Chile and virtually all foreign and national banks. The economy of Santiago has become highly oriented toward services, with commercial and financial services accounting for nearly 60 percent of gross regional product; and government, social services, and commercial activities accounting for 50 percent of all employment.597 The strong economy and low government debt is attracting investors from Europe and the United States. The city has a strong east–west division in terms of income, poverty, and access to services. The northeast is predominantly middle and high income, while the west and south are lower income and home to the majority of the poor. Maipu, La Florida and Puente Alto (to the south and southeast) are examples of middle-income districts developed in the 1990s with the end of military rule. Quilicura (to the north), Peñalolen (to the southeast) and the barrio alto or high-income suburbs (to the east), all on the urban fringe close to the mountains in the Precordillera, are more recent residential areas. Although urban poverty has declined considerably over the past few years, the Gini coefficient remains at 0.47, indicating high levels of income inequality. A marked
313
dichotomy continues between the modern globalized city of Santiago and the rich neighbourhoods of the upper middle class in the northeast on one side, and the poor neighbourhoods in the south and west. This imbalance in the geography of income groups, housing and services adds to the planning and development problems associated with transport and traffic congestion, distribution of jobs, pollution and capacity to provide services to the city efficiently.
12.3 ECONOMIC ENVIRONMENT Santiago’s steady economic growth over the past few decades, driven primarily by a mining boom, has transformed it into a modern metropolis. Table 12.1 provides basic information on the metropolitan region’s economy. The region is home to a range of manufacturing industries and trade services. It is also a major centre of the theatre arts, restaurants, and scientific and cultural events. It has two of Chile’s leading universities. Its connectivity standards are also way ahead of other cities in Chile. There is a 25km metro network and its modern transportation infrastructure includes a free-flow toll-based network of highways and a partially underground urban freeway.
Table 12.1 Key Economic Facts – Santiago Chile
Greater Metropolitan Region
GDP (2011)1
USD 201.1 billion
USD 88.4 billion (45% of economy)
GDP per capita, PPP (2013)
USD 1,898
USD 24,342
Estimated population (2014)
17,819,054
6,246,244 (35% of economy) 7,228,581 (Metropolitan Region)
Employment (Dec 2014)
8,003,050
3,248,220 (Greater Santiago)
Unemployment rate (Dec 2014)
6.2%
5.9%
Key export sectors (2014)
Agriculture, mining and manufacturing
Tourism, mining, wines and manufacturing
Note 1: Chain-linked prices; total GDP for Chile includes value-added tax and import duties. Source: Central Bank of Chile, National Accounts: Evolution of Economic Activity (Santiago: Central Bank, 2014); Banco Central de Chile (2014); INE (Instituto Nacional de Estadísticas [National Institute of Statistics]) Compendio Estadístico 2014 [Statistical Summary] (Santiago: INE, 2015); UN (2015); McKinsey Global Institute (2015).
314
12.3.1 Key Industry Growth Sectors Chile is one of Latin America’s strongest economies, and is ranked globally as a highincome economy.598 GDP per capita in 2013 was USD 21,898, the highest in Latin America. Its political and institutional stability together with an open policy has resulted in a fruitful, competitive and attractive environment for investment. Corruption, by Latin American standards, is also low.599 In 2010, Chile became the first South American economy to join the Organisation for Economic Co-operation and Development (OECD).600 Chile has a great diversity of natural landscapes and protected areas, and tourism has experienced sustained growth in recent decades. Chile is also the second-largest producer of salmon in the world. Its unique geography (a long and narrow strip between the Pacific Ocean and Los Andes mountains) and the temperature differences during the day provide ideal conditions for growing wine grapes; and Chile has become one of the world’s top wine producers. Services has also grown rapidly, in tandem with the development of information and communications technology (ICT), greater access to education and an increase in the skills level of the workforce. Table 12.2 gives a breakdown of GDP for the economy of the metropolitan region. The largest contributors to the region’s economy are business services, personal services, manufacturing, and wholesale and retail trade. The manufacturing sector accounts for 34 percent of national exports, with food products, chemicals and pulp and paper being the main contributors.601 Agriculture, and allied sectors like forestry, logging and fishing, accounts for only a small portion of GDP, and due to their highly mechanized nature, they employ a relatively limited labour force (13.6%). Chile’s major agricultural products include grapes, apples, pears, onions, wheat, corn, oats, peaches, garlic, asparagus, beans, beef, poultry, wool, fish (mostly salmon), timber and wine.
315
Table 12.2 GDP by Sector, Santiago Metropolitan Region, 2011 Greater Metropolitan Region million CLP
million USD2
Economy million CLP
million USD2
Agriculture and forestry
353,883
684
0.8%
2,876,570
5,562
2.8%
Fishing and aquaculture
814
2
0.0%
420,654
813
0.4%
233,621
452
0.5%
12,535,539
24,239
12.1%
Manufacturin g industry
5,323,875
10,294
11.6%
11,100,605
21,464
10.7%
Electricity, gas and water supply
761,350
1,472
1.7%
3,451,198
6,673
3.3%
Construction
2,073,221
4,009
4.5%
7,094,649
13,718
6.8%
Wholesale and retail trade, hotels and restaurants
7,245,145
14,009
15.8%
11,477,918
22,194
11.0%
Transport and telecommunic ations
3,082,340
5,960
6.7%
6,973,413
13,484
6.7%
31,506
35.6%
19,228,250
37,180
18.5%
Mining
Financial and business services
16,293,790
Home services
2,785,309
5,386
6.1%
4,922,844
9,519
4.7%
Personal services
6,007,289
11,616
13.1%
10,998,735
21,267
10.6%
State administratio n
1,653,835
3,198
3.6%
4,199,103
8,119
4.0%
45,734,113
88,431
100.0%
103,963,086
Total GDP1
201,023
100.0%
Note 1: Chain-linked prices; total GDP for the economy includes value-added tax and import duties. Note 2: 2011 average exchange rate CLP 517.17 per USD. Source: Central Bank of Chile, Cuentas Nacionales, PIB Regiones [National Accounts: Regional GDP] (Santiago: Central Bank, 2014).
316
12.4 COMPETITIVENESS OF THE ECONOMY Santiago ranks 68th (equal to Delhi) in the Economist Intelligence Unit’s Hot Spots index measuring the competitiveness of 120 cities around the world.602 Table 12.3 shows the rankings for Santiago, New York and Buenos Aires, the most competitive Latin American economy. Santiago performs reasonably well in human capital development globally and performs about the Latin American median in most other categories. However, in areas like ‘global appeal’and ‘environmental and natural hazards’, it falls below the global median for the survey. The weakness in the city’s competitiveness is reflective of other Latin American economies, indicating the need for improvement if the city is to compete more effectively for business and investment in the future. The city ranks 24th in terms of ‘physical capital’, no doubt helped by its well-developed telecommunications infrastructure. It also ranks highly on ‘human capital’ (35th). It scores less well on ‘global appeal’ (65th), and this is attributed to its relative isolation.603 Plans by the government to increase the capacity of Santiago’s airport should help it improve on this measure in the future.
Economic strength
Physical capital
Financial maturity
Institutional effectiveness
Social and cultural character
Human capital
Environmental and natural hazards
Global appeal
Table 12.3 Economic Competitiveness of New York, Buenos Aires and Santiago, 2012
30.0
10.0
10.0
15.0
5.0
15.0
5.0
10.0
Overall
Category weight (%)
1
New York
71.4
54.0
92.0
100.0
85.8
95.0
76.5
66.7
35.7
60
Buenos Aires
49.2
34.6
69.6
50.0
54.4
66.7
66.6
66.7
21.0
=68
Santiago
46.7
32.0
71.4
33.3
63.1
60.0
70.1
50.0
11.7
Global
46.7
35.6
70.5
33.3
54.4
57.1
61.8
66.7
7.4
Median
Source: Based on data from Economist Intelligence Unit, Hot Spots – Benchmarking Global City Competitiveness (London: Economist, 2012).
12.4.1 Constraints and Opportunities The existence of mineral resources has been the driving force in the development of Chile. The economy’s growth significantly depends on the price of mining products, particularly copper. Notwithstanding this, Santiago’s economic base is dominated by services and trade. Personal, financial and home services represent over 50 percent of the economic activity in the region, followed by trade with 15 percent. This distribution reveals a source of opportunity for Santiago. The capital brings together expertise in almost every area. In
317
Chile, it is said that ‘Santiago is Chile’ since many of the decisions related to the development of other cities and regions are made in the capital. In Santiago, it is relatively easier to perform any action than in any other area of Chile. On the other hand, this centralization has resulted in over 30 to 35 percent of Chile’s population living in the capital. The city’s population and the urban area will continue to grow, resulting in longer commuting distances and time, and increased costs. Sustained growth in Chile and opportunities in the capital are reflected in immigration. According to the Casen survey,604 the number of international migrants doubled between 2006 and 2013, growing from 1 percent of the total population to 2.1 percent. There are 354,581 registered migrants, of which more than 60 percent reside in the capital. As for the origin of the immigrants, 33.3 percent come from Peru. This is followed by Argentina (15%); Colombia (13.8%); Bolivia (7.4%); and Ecuador (4.8%). The challenge for the capital is to improve the living conditions of its inhabitants, especially given the connection this has to economic development, a concern discussed later in this chapter. 12.4.2 Exports Santiago is a significant export economy, with the metropolitan region accounting for 15 percent of Chile’s exports. As shown in Table 12.4, mining is the most significant exporting sector in the metropolitan region, contributing 36 percent of the total value of exports, followed by manufacturing at 29 percent. Metalworking products represent almost half the region’s manufacturing exports. Table 12.5 shows the destination of exports from the metropolitan region. Most of the metropolitan region’s exports went to other South American economies. However, exports to Asia and Oceania (APEC region) grew 565 percent from 2007 to 2013.
Table 12.4 Exports by Industry Sector, Santiago Metropolitan Region, million USD Industry sector Forestry Manufacturing industry Mining Non-trade Agro-industrial products Products of the sea Services
USD FOB million 2012 183.8
USD FOB million 2013 197.1
USD FOB million 2014 176.2
% Change 2014/2013 -11
% Share 2014 1.5
3,576.1
3,272.3
3,425.2
5
29.3
4,408.9
3,796.5
4,195.9
11
36.0
220.5
211.3
229.0
8
2.0
1,613.0
1,756.4
1,636.3
-7
14.0
68.1
53.0
50.8
-4
0.4
979.1
1,014.4
965.6
-5
8.3
Wine 954.5 1,008.8 991.7 -2 8.5 Total metropolitan 12,004.0 11,309.8 11,670.7 3 100.0 region FOB=’Free on board’, meaning seller pays for cost of loading and transportation. *Includes goods, services and copper. Source: Inteligencia Comercial [Commercial intelligence], based on data from Servicio Nacional de Aduanas [National customs service].
318
Table 12.5 Value of Exports from the Santiago Metropolitan Region, by Geographical Zone, million USD Dec 2007 Dec 2010 Dec 2013 14.4 13 Africa 72.8 93 Central America and the Caribbean 390.8 417.8 442 North America 728.3 889.8 917 South America 104.1 214 693 Asia and Oceania 357.2 322.6 416 Eurozone 65.6 103 Other Euro economies 334.7 43.6 54 Others Total 1,915.1 2,040.6 2,729 Source: Based on data from INE [National Institute of Statistics, Chile] and Encuesta Economica Regional [Regional Economic Survey] 2013, 2010, 2007, 2010, 2013.
12.4.3 Free Trade Agreements As of 2015, Chile is part of 24 trade agreements involving more than 60 economies.605 With these agreements, the economy reaches more than 60 percent of the world’s population in preferential terms. In addition to these, it has signed a number of conventions for the avoidance of double taxation, a move which favours trade. 12.4.4 Investment Environment Santiago ranks as the most attractive city for investment in Latin America, 606 well above cities in Brazil, Mexico and Argentina. The World Bank’s ease of doing business index ranks Chile 34th in the world as of 2014.607 The privatized national pension system has encouraged domestic investment and contributed to an estimated total domestic savings rate of approximately 21 percent of GDP.608 As mentioned earlier, Chile and therefore Santiago – since it accounts for a significant percentage of Chile’s activities – is an attractive investment destination. Since the 1980s, under the military government and the democratic governments that followed, Chile has made significant structural changes. It introduced, among others, export promotion policies, boosted free trade through agreements and instituted reforms to pension and health security systems, all of which favoured growth and halved poverty rates. Many state-owned companies were also sold, except for a few companies like the copper giant CODELCO. The government’s role is thus mainly limited to regulation. According to Chile’s Central Bank, the economy grew at a rate of 5.3 percent between 2010 and 2013. However, 2014 was a challenging year, mainly due to the end of the global mining boom, the fall of commodity prices and growing domestic uncertainty. From January 2014 to March 2015, the economy grew at an average annual rate of 2 percent. Major reforms in tax, education and labour by the new government have undermined business confidence, and this is reflected in lower rates of investment. Legislation on education and labour is proceeding. Tax reform has increased the tax burden for companies from 17 percent to 35 percent, which runs contrary to the trend in most OECD economies, which is to reduce business taxes.
319
Foreign direct investment (FDI) is critical to the development of the metropolitan region’s economy. Since 2011, the region has received an average of USD 3,300 million in investment, mainly in the chemical, rubber and plastic, financial services, transport, public utilities and mining sectors.609 The metropolitan region received 27 percent of FDI in Chile in the period 1974–2014. The United States; Japan; Spain; and Canada are the main sources, with Australia also being important. 12.4.5 Innovation and Business Support Chile is known for its economic and political stability, and has a strong financial system. Its international credit ratings are high; and public debt is relatively low at only about 5 percent of its GDP in 2013.610 Chilean firms are able to raise funds abroad (to finance domestic investment), through bank loans, the issuance of bonds and the selling of stocks in US markets through American Depository Receipts. Following the 1982 economic crisis, Chile strengthened the regulation of its financial system, creating a healthy framework to develop a robust market for banks, insurance companies and pension funds. Chile’s financial sector has grown quickly in recent years. A reform to its banking law in 1997 broadened the scope of permissible foreign activity for Chilean banks, and in 2001, the government liberalized the capital markets. This sophistication is reflected in its capital city’s rank of 32 for ‘financial maturity’ in the Economist Intelligence Unit’s Hot Spots index. Beyond emphasizing its economic and political stability, the government has promoted Chile as an ‘investment platform’ for multinational corporations planning to operate in the region. It has been very successful in instilling investor confidence: in 2014 the United Nations Conference on Trade and Development ranked Chile 17th among the economies that received higher foreign investment during 2012–2013.611 Its Foreign Investment Law has been key to attracting FDI. The law gives foreign investors the same treatment as Chileans. Business registration is also simple and transparent; and there are provisions for repatriation of profits and capital. According to the 2013 Heritage Foundation Index of Economic Freedom, Chile also provides the strongest private property rights in Latin America.612 To attract further investment to new parts of the economy, the government has formed a Council on Innovation and Competition to identify new sectors and industries to promote. It has also introduced tax reforms to encourage domestic and foreign investment in research and development.
12.5 STRATEGIC INFRASTRUCTURE While the development performance of Chile and the Santiago region over recent years has been strong, it nevertheless faces significant challenges in the development of strategic infrastructure. The region has a well-developed network of roads and urban services, and a good international airport with services to most Latin American and key North American destinations and Australia. The region has 35 universities, which
320
produce 50 percent of Chile’s graduates.613 It also has excellent research facilities and community services infrastructure. The World Economic Forum’s Global Competitiveness Report ranked Chile 27th on infrastructure investment in 2006–2007.614 In the 2014–2015 report, it ranked 33rd among 144 economies.615 The decline in the level of competitiveness of Chile’s strategic infrastructure calls for an increase in the level of investment, especially in network systems that improve communications, logistics and knowledge development. 12.5.1 Public Infrastructure Investment In the 1990s, the government tried to improve Santiago’s public transport system, and introduced new bus routes. However, the system was beset by problems. Complaints ranged from overlapping routes to high levels of noise and air pollution and safety issues. In response, a new system, called Transantiago, was introduced in 2007. It combined core services across the city – bus lines, the metro network and local feeder routes – with users paying for all these services using a contactless smartcard. Users were not impressed. Problems included a lack of buses, too many bus-to-bus transfers and reduced route coverage. Some issues were resolved, but the system earned a bad reputation. As of 2011, fare evasion rate was high. Since 2000, Santiago has made important progress in the development of its road infrastructure, thanks to the contributions of the private sector through urban expressways concessions. The free-flow Regional Metropolitan highway network provided 199km of new roads that enlivened the activity of the capital (Figure 12.2).
Figure 12.2 Regional Metropolitan Highway Network
During the last decade, the following major urban investments were implemented:
Costanera Centre. A megaproject in Santiago’s financial (Sanhattan) district. Revitalization of the historic city centre. Roads and basic Source: Copsa A.G. [Association of public works infrastructure were improved concessionaires]. with support from private investors. Modernization of the railway system. Trains arrive and depart from Central Station, which is well connected with the city’s bus lines and the metro, and provides modern connectivity between Santiago and several cities in the southcentral part of the economy.
321
Interurban buses. Several modern bus terminals (Terminal San Borja, located close to the Estación Central Metro station; Terminal Alameda; Terminal Santiago; Terrapuerto Los Héroes; Terminal Pajaritos; Terminal La Cisterna; Terminal La Paz), which provide buses to all destinations in Chile and to some towns around Santiago. Free-flow toll-based highway network. The Vespucio Norte, the San Cristobal Tunnel and the Vespucio Sur A series of three highways surround the city in an almost complete circle. Autopista Central, a section of the Pan-American highway crosses Santiago from north to south, and divides into two highways 3km apart. The Costanera Norte, which runs next to the Mapocho River, crosses the city west to east and connects it with the international airport, the downtown and wealthier areas of the city to the east, where it divides into two highways. Other non-free flow toll roads connect Santiago to other cities, particularly Valparaiso, San Antonio and Rancagua. Social housing programme. This is a government initiative that provides targeted subsidies using a much-acclaimed voucher system.616 Santiago Centro Oriented Project. This aims to improve road connections in the neighbourhoods of Providencia, Vitacura, Las Condes and Lo Barnechea. The USD 500 million investment is developed through a public–private partnership (PPP). Parklands. For example, a new park is being built along the Mapocho River, which will be navigable for leisure purposes.
These initiatives have improved Santiago’s image and performance, and quality of life for many of the city’s inhabitants. However, a pressing need remains to extend such innovations to the whole city. The coming years will see more major development projects, especially in transportation. There will be a complete renewal of the international airport and an expansion of railway services, including a proposal for a highspeed rail connection with the port city of Valparaiso and the resort city of Viña del Mar. Added to these are urban highways (Vespucio Oriente and Costanera Central) and new metro lines. Financing for infrastructure may be from public and private sources. The aforementioned initiatives are leveraged by different financial arrangements. Public infrastructure projects are generally financed using public funds, which come from different levels of public administration, such as ministries, regional government and municipalities. For example, affordable housing programmes and urban parks by the Ministry of Housing, and the metro by the Ministry of Transportation, are mainly financed using public resources through the Ministry of Housing and the Ministry of Transportation respectively. Projects may also be financed through public–private partnerships (PPPs). The Ministry of Public Works (Infrastructure), for example, develops roads, bridges and water resources with funding from both public and private resources. The private sector has been involved in funding major public infrastructure such as intercity routes, urban highways, prisons, hospitals and airports. The private sector has also played a key role in developing other strategic infrastructure. Development of projects such as the Costanera Centre was totally private, through the
322
issuance of private debt, which is traded on the domestic capital market and in some cases also internationally. 12.5.2 Future Infrastructure Needs Currently, Santiago shows a significant deficit of urban transport. Travel and waiting times have progressively deteriorated due to the continued increase in the rate of vehicles per household; this was 0.46 in 2001 and 0.57 in 2012.617 Though still low compared with the OECD region, the greater metropolitan region accounted for 1,721,328 vehicles in 2013, 40 percent of the economy’s total and 41 percent more than 2007 (an average annual growth of 7 percent).618 The percentage of daily trips performed by public transport is 29.1 percent, very similar to the 28 percent performed by private transport. The bus remains the most important public transport mode, though bicycle trips doubled in 10 years, reaching 747,000 in 2012. According to estimates by the Chilean Chamber of Construction (CCHC), the relative deficit of investment in public mass transportation in Santiago compared to the OECD is 71.4km, or 82km for the capital’s city’s underground metro network (Table 12.6). An additional 809km of roads will also be required for private transportation. Five hospitals are needed, three of which will be developed through PPPs.
Table 12.6 Infrastructure Deficit Projection in Santiago Type of infrastructure
Deficit (km)
Estimated cost (million USD/km)
Required investment
No. of projects
(million USD) Urban road infrastructure for private transport
809
0.8
647
-
Underground public transport network (Metro)
82
85
6,970
-
-
-
2,483
5
Hospitals
Source: CCHC (Chilean Chamber of Construction), Infrastructure critical para el desarrollo 2014–2018 [Infrastructure for Development] (CCHC, 2013), 72.
As the Atisba Monitor urbanist, Ivan Poduje stated, if this deficit is viewed from the perspective of social development, you should plan what is needed: a network that improves the connectivity of the most vulnerable residential areas with the city’s employment centres.619The scope of this challenge is shown in Figure 12.3 which suggests that Santiago’s infrastructure would need to encompass suburban trains, intermodal stations and civic centres. The investment required would be USD 21.6 billion.
323
These resources are not available, so it has become necessary to create a Fund for State Infrastructure involving public financial instruments such as bonds to finance new projects. These proposals are under development and are expected to materialize shortly.
Figure 12.3 Infrastructure and Social Development Needs, Santiago
Source: I. Poduje, ‘Long-term vision in infrastructure’ (presentation at the 2015 conference of the Chilean Council of Infrastructure Policies, Santiago: CPI, 2015)
12.5.3 Logistics and Information Systems As Santiago is an inland city, most of its trade is reliant on land transport. In the 1980s, the government began to close the railway network; and it now accounts for only 2 percent of the freight transport in Chile. Santiago is the economy’s principal international airport and receives more than 17 million passengers annually. The region is serviced primarily by two ports: Valparaíso and San Antonio. Santiago is also connected to Mendoza (Argentina) through the Cordillera de Los Andes, though the road is closed several days a year due to weather conditions, especially in winter. There is a need to improve the region’s logistics systems, thus increasing the efficiency of its urban transport and freight systems. The ports of Valparaiso and San Antonio are 127km and 100km respectively from the capital and account for 55 percent of the national movement. However, they are currently accessed mainly through two concession toll roads (Routes 68 and 78 respectively). Significant investment is needed to expand transportation options to those ports.
324
There is growing momentum to build a low-level rail tunnel through under the Andes between Chile and Argentina. It is expected to cost an estimated USD 3 billion and, if built, the railway would carry some 80 percent of the freight between Argentina, Brazil and Chile.620 The railway is a critical piece of strategic infrastructure needed to open up Pacific trade for Argentina, Uruguay and Brazil along the emerging Mercosur corridor. 12.5.4 Operation and Maintenance of Infrastructure Most of Santiago’s public infrastructure is state-owned. The infrastructure operated by the state is affected by short-term budgetary constraints that affect its long-term life. For example, public hospitals suffer from low budgets for operation and maintenance, resulting in the deterioration of those assets. Also, most infrastructure is not covered by insurance and lacks sinking funds for replacement, so in the event of a natural disaster, the restoration of infrastructure will need to be financed with public funds. In the case of concession arrangements governed by the terms of PPPs, private operators are responsible for much of the operation and maintenance of infrastructure. Concession agreements cover insurance as well as standards of operation and maintenance for the duration of the contract. Such assets are in much better condition than public assets. The benefits of the PPP model in Chile could be clearly seen in February 2010, when an earthquake severely affected infrastructure, causing damage of more than USD 6 billion.621 About 1,500km of roads were cut off, 200 bridges affected and 9 airports damaged. The long and narrow Chile was divided into two. The concessions, supported by insurers, reinstated provisional connectivity in hours, and complete connectivity in 10 months. In contrast, non-PPP public infrastructure shows damage even after five years.
12.6 SOCIAL ENVIRONMENT Employment and equity are critical issues that affect social sustainability. Santiago, like most cities, experienced high levels of unemployment during the 2007 global financial crisis, but nothing like many other OECD economies. The mining boom boosted growth and demand for labour, bringing skilled and unskilled migrant labour from other economies in the region. Real wage and labour markets have grown steadily. However, they remain distorted, leading to significant inequality and inequity in income and wealth distribution. Poverty, affordable housing and accessibility to essential services have become significant social issues, impacting on the sustainability of development. This following section discusses briefly labour market and poverty issues affecting sustainability in the Santiago region. 12.6.1 Labour Markets and Human Resource Development In December 2013, the metropolitan workforce was around 3.5 million, with 5.2 percent unemployment. The economic sectors with the highest levels of employment are trade (22.7%), manufacturing (13.1%), real estate and business activities (9.9%) and construction (8.9%). These four sectors make up almost 55 percent of total sector employment in the region. By occupational category, employees represent the largest
325
share of the total employed workforce, at 71.2 percent, or 2.3 million workers. Almost 18.4 percent of the active workforce, or 605,520 people, are self-employed. Figure 12.4 shows the changes in employment structure since 2007. Salaried positions (employees) show the greatest increase, due mainly due to the growth of the national economy from the mining boom. Unemployment rates have increased to 6.5 percent following the end of the mining boom in early 2014.
Figure 12.4 Labour Market Occupied Persons by Occupational Category, Santiago Metropolitan Region
2500
Thousands of people
2000
1500
1000
500
0 Employers
Self-employed (independents) 2007
Employee 2010
Service
Unpaid (family service)
2013
Source: Based on data from INE (Instituto Nacional Estadisticas [National Institute of Statistics]), Informe Economico Regional [Regional Economic Report] 2007, 2010, 2013; and Encuesta Economica Regional [Regional Economic Survey] 2007, 2010, 2013.
12.6.2 Labour Market Reforms GDP productivity per hour in Chile is still below the average among OECD economies. This is having a direct impact on the competitiveness of Chile’s, and Santiago’s, labour market. Labour productivity is a central issue since it represents the best tool to increase the salaries of workers and enhance growth; and regulations aimed at improvements in this area are essential. The administration of President Bachelet proposed labour market reform in December 2014. Key reforms include an increase in the scope of collective bargaining rights for apprentices and contracted workers, and greater negotiating rights for labour unions.
326
Nevertheless, national labour market policies are still not inclusive. They do not ensure improvements in the wages and participation of women and youth, nor do they support young people in the transition from education to employment. 12.6.3 Poverty and Inequality Measured by the Gini index, economic inequality is high although in the regional mean.622 In 2011, the Gini coefficient was 0.51 for Chile and 0.47 for Santiago, which reveals significant deficiencies in the economy and the distribution of wealth. In the same year, the richest population decile earned 27 times the income of the poorest decile. In 2008, 2.7 percent of the population lived on less than USD 2 a day.623 As shown in the map of the distribution of Human Development Index scores (Figure 12.5), the city is separated between eastern and southern poor communes and western rich communes, where better public and private facilities are concentrated. Santiago reflects the socioeconomic inequality and geosocial fragmentation of Chile as a whole.624 From the late 1990s onwards, a large middle class developed; but income inequality worsened. Despite the city’s unquestionable competitiveness, the obscure social reality is persistent poverty. Despite good economic indicators, and a notable reduction in poverty from 38.6 percent in 1990 to 15.1 percent in 2009, a persistent 11.4 percent of the population still live below the poverty line. The Economist Intelligence Unit’s Hot Spots index ranks Santiago 65th in the ‘social and cultural character’ category.
Figure 12.5 Human Development Index of Santiago by Commune (District)
Source: Authors, based on data from: UNDP (United Nations Development Programme), Human Development Report 2014 (New York: UNDP, 2014).
12.7 SUSTAINABILITY AND ENVIRONMENTAL MANAGEMENT Since the 1990s, Santiago has encountered growing environmental problems related to urbanization. Air pollution reached critical World Health Organization (WHO) levels, and smog has become a permanent feature in the winter months. The authorities have introduced legislative measures for industries and instituted control of vehicular movements. At times, the large number of private buses has caused paralysis in the city centre. To combat the chaos in urban transport, the city embarked on a major expansion of its public transport systems. The underground metro has been extended with three new lines to the southeast over the period 1997–2006, and a new line towards Maipú in 2011, augmenting the city’s networks to 105km.
327
Environmental issues seem to plague Santiago.625 This, combined with its vulnerability to earthquakes and other natural disasters, is reflected in the Economist Intelligence Unit’s Hot Spots index where, for the ‘environment and natural hazards’ category, it ranks joint 85th.626 Moreover, in the Latin American context, its environmental performance has been assessed as average.627 Nevertheless, the city has implemented policies in areas such as waste, water and sanitation, transport, energy efficiency and climate change, green buildings and urban regeneration, which are relevant to this review. 12.7.1 Air Quality Air pollution fell by about a third in the 1990s, but progress slowed considerably in the 2000s, 628 and Santiago’s air is still one of the most polluted in Chile.629 The Plan for Prevention and Atmospheric Decontamination630 implemented since 1998 has helped improve air quality in the city. On average, monitoring stations have recorded declines – albeit slow – over the last 15 years in all regulated pollutants (PM10, O3, CO and SO2) except NO2. The improvement had been made possible by implementing a series of measures to lower emissions from transportation, industry, fuels, volatile organic compounds and residential heating, among others. This included the replacement of public transport buses and of the transit system starting in 2005. 12.7.2 Potable Water and Sanitation Water management in Chile is based on the principle of transferable rights as a way to enhance its efficient use. Water services have been provided by private enterprise since 1998; and in Santiago, the water supply is managed by Spanish-owned Aguas Andinas. More than 99 percent of Santiago’s population have access to potable water, and 97 percent to sanitation services. There is a 30 percent leakage rate, which is lower than the Latin American average. The government pays for the first 15 cubic metres of water used by families in extreme poverty, and between 25 percent and 85 percent of the bill for the first 15 cubic metres used by low-income households.631 Aguas Andinas regularly monitors the quality of drinking water to ensure that it meets the standards set by the national environmental agency. A significant environmental challenge for Aguas Andinas was the cleaning of Santiago’s main river. The Mapocho River, a major source of water, had become contaminated by sewage and waste from copper mining operations and sewage upstream. Under the plan, the company decommissioned 21 pipes that had been discharging untreated wastewater into the river. Though illegal dumping into the river persists in some areas, there is an ongoing public programme to clean and monitor further dumping. In 2007 almost 40 percent of Santiago wastewater was untreated. In response, the government implemented a strict national sanitation body, which in association with the private sector, increased wastewater treatment capacity. By mid-2012, the Mapocho wastewater treatment plant began operation. The increase in capacity resulted in Santiago becoming the first capital city in Latin America to treat all of its municipal sewage. 632 According to Agbar (the Spanish company that owns Aguas Andinas), this is a landmark
328
project in the southern hemisphere. It was made possible only because the investment cost could be transferred to end-users, increasing the bill by just USD 0.03 per cubic litre, or about USD 0.66 for an average household monthly water bill. Moreover, the La Farfana treatment plant, which treats 60 percent of the city’s wastewater, produces methane as a waste product of the treatment, covering the gas demand of about 35,000 households. The capture of methane and its use has been recognized by the United Nations Framework Convention on Climate Change (UNFCCC) as a strategy to reduce greenhouse gas emissions; in this case, part of the investment on the treatment plant came from selling carbon credits. 12.7.3 Waste Management The city generates a relatively large amount of waste; but its management and disposal is relatively efficient. The approaches vary with each commune. Some have founded their own company while others have contracts with private firms.633 Santiago complies with central government guidelines on landfills and the disposal of hazardous waste. However, it needs to be noted that although Chile has strict regulations regarding waste, and while open-air dumps are illegal, an estimated 20 percent of waste in Chile is disposed of in inappropriate dumps.634 Several districts have also teamed up with charities to encourage community participation in recycling. The charities manage the process up to the transfer to recycling plants. Though more than 50 percent of the waste in Chile and Santiago could be recycled, the current rate is around 10 percent. The Ministry of the Environment has proposed a new law on Extended Producer Responsibility, which will cover waste from priority products such as oils, electronic waste, medicines, paper and cardboards, tyres, vehicles and so forth. Producers of these products will be liable for the management and disposal cost at the end of the product’s lifecycle. 12.7.4 Transport and Noise As indicated earlier, the city’s public transport system is underpinned by a metro and a bus rapid transit system, which are further supported by a large fleet of feeder buses. Santiago’s overall network635 is efficient, with metro and bus rapid transit lines extending an estimated 220 km, one of the longest in Latin America. In terms of environmental policies, authorities have reduced the total number of buses from 7,000 to 4,500 and are gradually replacing older vehicles with lower-emission models.636 In addition to overhauling its mass transport system, and particularly, expanding its metro, the city has also adopted several traffic management measures, including a traffic information system and some toll roads. Moreover, investment in bicycle lanes has increased substantially, and some web-based car sharing private initiatives have arisen. In terms of noise, more than 70 percent of Santiago’s population are exposed to noise levels above the 55 dBA recommended by the WHO, and rising to 85 dBA in some areas of the city – mainly due to traffic noise. Many communities cite noise as the city’s main environmental issue.637 In response, the authorities have introduced several policies at the central-government level and more stringent city-level schemes, imposing noise limits for industries, construction work, vehicles and other sources.
329
12.7.5 Climate Change and Greenhouse Gas Emissions While Chile is not a major global emitter of greenhouse gases, climate change would have several impacts, particularly in the central area in which Santiago is located. They include a rise in drought frequency, more rainfall, a reduction in glacier mass, and an increase in average temperatures and desertification. Chile has voluntarily committed to a 20 percent reduction in its greenhouse gas emissions by 2020. It has developed a Mitigation Action Plan and Scenarios, called MAPS-Chile, which includes actions in the private and public transportation system, land use and buildings, and waste. Besides the already mentioned La Farfana wastewater treatment plant, an innovative case is the Santiago Transportation Green Zone project. The initiative – a collaboration between the Chilean Ministry of Transport, its Ministry of Environment and the UK government – aims to reduce greenhouse gas emissions through a comprehensive plan that includes: the promotion of zero and low-emissions vehicles as well as non-motorized vehicles; the use of clean and energy-efficient public transport buses; and traffic redesigns and traffic management. The project, which will be partly financed by issuing carbon credits, is one of the Nationally Appropriate Mitigation Actions (NAMAs) recognized by the United Nations. 12.7.6 Energy Efficiency The private and public sector have a shared view that clean, yet relatively cheap, energy, is a key condition for the further development of the economy. Along with structural changes in the energy market, enhanced connectivity and a more active role for the state, energy efficiency is an essential component of Chile’s new Energy Agenda enacted in 2014, boosting the ongoing Energy Efficiency National Plan 2020 which covers the industrial and mining sector, housing and small business, as well as the public sector and national army. It is important to note that those efforts started in 2005 with the Energy Efficiency Program, which became a formal institutional arrangement in 2010 with the creation of the Chilean Energy Efficiency Agency. The agency received in that same year the EE Visionary Award for the Americas, granted by the Alliance to Save Energy. The agency has implemented several projects in Santiago that have successfully reduced the energy consumption of a myriad of different buildings, such as hospitals, shopping malls, housing developments and public buildings. 12.7.7 Green Buildings Santiago has also addressed environmental concerns beyond energy efficiency, particularly with regard to non-residential buildings. The city is one of a number of nonUS cities with buildings achieving and pursuing the Leadership in Energy and Environmental Design (LEED®) certification scheme established by the US Green Building Council. The trend toward green buildings is mainly driven by the real estate market for new office buildings and retail space, which has identified that energy efficiency and environmental design are not only good in terms of reducing operational costs, but also in terms of the market value of the properties.
330
Moreover, in 2014, Chile launched its own certification scheme for green buildings, known as CES, an initiative that started in 2008 as a collaborative effort between the major stakeholders in the construction sector, including private companies, public agencies, universities and consultants. This new and local system focuses on a different market than LEED. It aims to encourage the implementation of best environmental practices during the design, construction and operation stage of small- and medium-sized non-residential buildings, particularly for healthcare, primary education and public services. 12.7.8 Green Space Santiago has a low ratio of green areas per capita, below the 9 square metres per inhabitant recommended by the WHO. Moreover, since the management of most green areas is the responsibility of relatively small district councils, the rate varies significantly between one district and another. A typical low-income district has 1.8 square metres per inhabitant while the highest at 56 square metres per inhabitant is seen in Vitacura, a highincome district. Several initiatives address this issue. By the end of 2014, a total of 396 hectares were added to the city’s stock of green areas, increasing the total area by 16 percent, most of which was introduced in the low- and medium-income areas of the city, including the first park aimed at reducing flooding in surrounding areas. Furthermore, a local NGO has introduced a new and successful charity model for developing and financing small green areas in low-income neighbourhoods, raising the interest of different corporations to participate in the scheme. 12.7.9 Urban Regeneration To reduce counter-urbanization in the Santiago metropolitan region and tackle the decline in the population of the city’s inner areas, several regeneration policies have been implemented. While most of them have been based on the densification of low-density inner-city areas through subsidies granted to middle-income households, some interesting culture-led regeneration processes have emerged in at least three areas: Bellavista, Barrio Italia and Lastarria. These areas have been able to capitalize on a particular sense of genius loci based on their existing physical characteristics to attract more residents and new businesses, particularly restaurants and art-related enterprises. Santiago has also witnessed the growth of at least three business districts – Sanhattan, Rosario Norte and Ciudad Empresarial – complementing the functions of its main CBD area, Santiago Centro. These areas are well-served by public transport and connected to the city’s main road infrastructure.
12.8 EFFECTIVENESS OF URBAN GOVERNANCE As indicated earlier, Greater Santiago does not fit neatly into any one administrative division. The major part of its 641.4 square kilometres (as of 2002)638 lies within Santiago
331
province. However, some of its peripheral areas belong to the provinces of Cordillera, Maipo or Talagante. With so many authorities involved, problems of coordination arise.
Figure 12.6: Santiago Local Government Communes (Districts)
Two types of agencies manage Santiago: the 37 communes or district councils elected through popular vote (Figure 12.6); and the Regional Council for the metropolitan region, which is indirectly elected, and chaired by a Governor (Intendente), who is appointed by the President of Chile. The Governor is in charge of overall coordination. This structure has its advantages in that the central government can intervene when there are problems of coordination between the districts. But the Source: Marcela Allué. division of powers has also contributed to the fact that Santiago often faces problems when it comes to achieving consensus on strategic development plans or master plans.639
12.9 PARTNERSHIPS FOR SUSTAINABLE DEVELOPMENT Many different types of partnerships have developed in the metropolitan region to support economic and social development, infrastructure, environmental management and local governance. Table 12.7 lists examples of partnerships that demonstrate strong features of sustainable development. Three of these – infrastructure partnerships for Santiago metropolitan region, urban rehabilitation of Bajos de Mena, and Fundación Chile – are presented as brief case studies of sustainable development activities.
332
Table 12.7 Examples of Sustainable Development Partnerships, Santiago Metropolitan Region Infrastructure and development
Government
Infrastructure Partnerships
Fundación Chile
http://www.minvu.cl/opensite_ det_20120607153314.aspx
http://www.fch.cl/sobre-fch/
Bajos de Mena rehabilitation programme http://www.minvu.cl/opensite_ det_20140819155335.aspx http://radio.uchile.cl/wpcontent/uploads/2014/12/PlanIntegral-deReahbilitaci%C3%B3nUrbana.pdf
Local business and communi ty
Research & innovation and entrepreneurship
Social and environmental
Concurso Emprendedores Globales: Start-Up Chile http://www.corfo.cl/program as-yconcursos/programas/concur so-emprendedores-globalesstartup-chile
Desafío Levantemos Chile
América Solidaria
http://www.desafiolevantemosc hile.cl/quienessomos/conocenos/
http://chile.americasolidaria .org/pais/chile/
Chile Verde – Green Chile http://www.porunchileverde .cl/
Public utilities
Intervial Chile http://www.intervialchile.cl/
Source: Authors.
12.9.1 Infrastructure Partnerships for Santiago Metropolitan Region In the early 1990s, Chilean authorities agreed on a strategic goal: to turn Chile, and especially Santiago, into a business platform for Latin America. This challenge required significant improvement in public infrastructure. The Chilean Chamber of Construction (CCHC) estimated that there was a USD 11 billion deficit in available infrastructure. In this context and given Chile’s budget constraints, the government of President Frei RuizTagle focused on PPP infrastructure projects. The first intercity highway – Route 78 from Santiago to San Antonio – was tendered to a private concessionaire in 1995. There are currently 27 projects in the metropolitan region under the PPP model, including an international airport; 6 intercity routes connecting the capital with different regions; 9 urban highways; and 12 public infrastructure buildings and public transport corridors. These were handed over to the private sector for an average term of 25 years and a total initial investment of USD 10.47 billion. As a result of this PPP model, almost 500km of roads were built, enhancing the connectivity of the capital. PPPs have been a driving force in the growth of paved roads at local and national level. Before the implementation of the PPP model, paved roads
333
grew at a rate of 1.1 percent in Chile. After the PPP model was introduced, the rate increased to 2.5 percent. Santiago’s road infrastructure operating under concession was severely affected by the 2010 earthquake. However, connectivity was quickly restored by the private management and the relevant insurers at no cost to the state. The metropolitan region has experienced success with PPPs; international groups, mainly from Canada, Spain, France, Germany and Italy, manage most of these projects. 12.9.2 Urban Rehabilitation of Bajos de Mena While Chile’s public housing policy is internationally recognized for its success in increasing the availability of affordable housing at relatively low cost, its implementation has created externalities for major cities in Chile, particularly Santiago. One of those externalities is urban segregation, which is considered a socially unsustainable characteristic of many developing economies. In response in 2013, Chile’s Ministry of Housing and Urban Development has included in the 2013 National Urban Development Policy, several measures aimed at enhancing urban integration, such as: improving the standard of the public services necessary to develop housing projects, increasing land availability for affordable housing, retrofitting public housing stock, increasing accessibility and mobility, and building the capacity of existing communities. These new policies will boost public agencies such as the Ministry of Housing and Urban Development’s Neighbourhoods Executive Office. They will also bolster programmes such as ‘Quiero mi Barrio’ (I love my neighbourhood), a multi-agency effort that works toward the physical and social regeneration of neighbourhoods. The programme has already been implemented in more than 100 neighbourhoods in Santiago. One of the most successful cases of regeneration is the Integral Plan for Urban Rehabilitation.640 Between 1998 and 2004, this programme had built 25,466 units of social housing for more than 120,000 people in a 600-hectare area 20km south of the centre of Santiago in Puente Alto. One of the areas to benefit from the new urban rehabilitation policy is Bajos de Mena, a large social housing area experiencing high social vulnerability and poverty levels and a lack of public and private services. The area lacked connectivity and green spaces, and had poor quality housing with overcrowding. These problems had given rise to serious social problems. To remedy the situation, the Ministry of Housing and Urban Development proposed a housing and urban intervention plan worth CLP 44 billion for the families of Bajos de Mena to be implemented in the period 2012–2014. The plan included investment in roadworks and connectivity, new housing for families, public spaces and green areas, the installation of a police station and improved street lighting, among others. 12.9.3 Fundación Chile: Partnerships for the Creation of Innovative Companies Fundación Chile is a private non-profit organization that brings together the government of Chile and BHP-Billiton-Minera Escondida, one of the biggest mining companies in the world. The three main objectives of Fundación Chile are:
334
To create direct value: This involves technology transfer to support the development of the economy, through creating companies that spread innovation, or patenting technologies that introduce and disseminate solutions. To create indirect value: This involves supporting enabling initiatives to generate the conditions for the installation of new technologies in Chile, and creating business ecosystems with more capacity to promote development through innovation. To provide innovative services: The vision is for these services to support the adoption of knowledge and technologies according to the needs of customers. The services should provide real-time connection to markets, and knowledge and information to support business innovation.
Achieving these objectives requires joint management with local and international networks, which in turn requires an organization operating independently from the public and private sector. Fundación Chile has directed efforts into areas such as mining, energy, aquaculture, human capital and entrepreneurship. The initiative has been very positive and has led to companies in Santiago developing innovative projects and partnerships that reduce risk, and lead others in the use of innovation to drive change. Many of the companies that have participated in Fundación Chile are committed to addressing the future challenges facing Chile’s development through the use of approaches that support sustainable and equitable development. The organization has been very successful in bringing government, international and local business together in partnership arrangements at arm’s length from the political system and generating impacts that meet the challenges facing the economy.
12.10 INTERNATIONAL PARTNERSHIPS Santiago has sister city partnerships with 12 cities (Table 12.8). All but three of these are capital city partnerships. The capital city partnerships are extensively political and cultural, and involve knowledge and business exchange. The sister relationships do not have a strong trade, co-investment and business development focus, but trade missions and exchanges are conducted with sister cities. There is significant potential for Santiago to consider more direct trade development partnerships, especially with cities in other Latin American economies and also with Auckland (New Zealand) and Sydney (Australia), both of which are multicultural and cosmopolitan cities and have similar types of economies.
335
Table 12.8 Sister City Partnerships for Santiago Buenos Aires, Argentina (1992)
São Paulo, Brazil (1998)
Tokyo, Japan
Guayaquil, Ecuador
Riga, Latvia
Warsaw, Poland
Ankara, Turkey
New York, United States
Paris, France (1997)
London, United Kingdom
Minneapolis, Minnesota, United States (1961)
Miami, Florida, United States
Source: Authors.
12.11 POTENTIAL PARTNERSHIPS THROUGH APEC Several opportunities exist for the development of partnerships involving the Santiago metropolitan region that could be facilitated and supported by APEC. 12.11.1 Bi-oceanic Corridors Opportunities exist in the metropolitan region to support the development of partnerships for the sustainable development of trade corridors. The most significant potential lies with intraregional city axes and bi-oceanic corridors (Figure 12.7). Figure 12.7 Bi-oceanic Corridors: Pacific–Atlantic Axes in the 1990s
Source: Author.
Intraregional connectivity and access to port terminals present a major challenge for South America. Enhancing connectivity is part of Chile’s policy strategy. As noted by
336
President Michelle Bachelet at the APEC Summit in Beijing in November 2014, ‘Chile wants to be a port and bridge between Asia-Pacific and Latin America economies’. The establishment of bi-oceanic corridors in South America takes into account the facilitation and intensification of trade to create a more integrated economic space and to achieve convergence between regional mechanisms and institutions. At the same time, it has meant expanding the platform of international integration, through strengthening land links between the various production centres to the ports of the Pacific and Atlantic Oceans, thus opening new connections to external markets. For example, a load from Chile to Europe routed through Argentine ports would take 12 days less to reach its destination compared with the Panama Canal route. Currently, there are several bi-oceanic corridors being studied. From a strategic point of view, any one of these corridors is necessary, keeping in mind that Peru is working on the enlargement of the port of Callao. For Santiago and the metropolitan region, the best alternative is the one that passes through the Region V–South corridor, because it is closest to the area. Within these corridors, there is potential to develop secondary cities as growth nodes, which could serve as hubs and logistics centres that are fully integrated into regional supply chains. Three corridors that have significant potential to enhance the development of Santiago metropolitan region are the Capricorn, South and Iquique corridors.
Capricorn Corridor (Norte Capricornio)
This would improve the connection between Mejillones in Antofagasta province and north-western Argentina through the Jama Pass, traversing the territories of Paraguay, Uruguay and southern Brazil. This corridor coincides with a significant portion of the geographic area of influence of the Capricorn corridor, which also incorporates areas of southern Bolivia. In the Chilean stretch, the route from Antofagasta to the Jama border crossing is fully paved. A new border post close to the border has been planned, which would be ideal for the establishment of an integrated border control system. The total estimated cost of the Chilean stretch is of USD 13,700 million, an amount that includes both land and sea connections.641
South Corridor
This includes the connection between Valparaiso Region V in Chile and the province of Mendoza and the Cuyo region in Argentina via the Cristo Redentor border crossing. From that point in Argentina, it converges with the main routes of the Mercosur economies. There is a private project in the area, the Aconcagua Bi-oceanic Corridor,642 which aims to develop a system of integrated transport and logistics that effectively links Buenos Aires to the Valparaíso, San Antonio and Ventanas ports. The initiative would cost an estimated USD 3 million. This corridor would directly benefit Santiago and the its metropolitan region since it is adjacent to the area passing through the region of Santiago.
Iquique Corridor643
337
This is said to be the shortest and most economical and efficient way to transport products from Bolivia, Brazil, Argentina, Paraguay and Uruguay to the Pacific, and from there to the Asia-Pacific economies. The conditions along the corridor allow for the passage of large volumes of cargo using trucks and railway as it is located on a low plain and low slope of the Andes. It also allows mega-traffic of more than 14,000 TEUs. 12.11.2 City-to-City Partnerships Chilean trade statistics do not capture data on city of origin for exports or imports. It is difficult, therefore, for Santiago to know the magnitude and growth of trade between the city and other cities. If Santiago were to have better data on how and where it trades with other cities, this would improve planning. Such information could help the city establish priorities in building strategic infrastructure and supporting capacity to expand opportunities for trade and investment. It may also enable blockages to trade and investment flows to be identified and remedied. Santiago has many city-to-city connections which have developed from the expansion of trade in mineral resources and agro-industrial products, its main exports. Opportunities exist to add value to existing supply chains in these industries if the nature of the trade flows and the gaps in critical strategic infrastructure supporting them can be identified. Partnerships for city-to-city development that appear to have good prospects for development under the umbrella of APEC include:
Santiago and Los Angeles
The USA is an important destination for Chilean exports, especially fruit and wine. Santiago and Los Angeles already have a strong trade relationship. Opportunities exist to value-add to the food industry production and supply chain systems by identifying common user infrastructure where collaboration between export and import companies would help to reduce transaction costs. In addition, both cities are unlucky to be in a highrisk earthquake impact zone. There is much to be gained by collaborating in research and development in building design and emergency response capabilities.
Santiago and Sydney
Santiago and Sydney are cities with large mining, tourism and food processing service industries and logistics centres. There are regular daily air connections between the two cities. The development of synergies between the two cities would create opportunities to develop sub-regional hubs to collaborate in service industry development.
12.12 CONCLUSIONS The government of Chile recognizes the importance of the tertiary sector in boosting its international connections, trade liberalization, and development and investment opportunities. Chile is geographically isolated from large markets that offer opportunities to expand merchandise trade. If the economy is to grow, it must develop its service exports, particularly in sectors where it has some competitive advantage – maritime and aeronautical services, tourism, retail (department stores, supermarkets and shopping
338
centres), engineering and construction services, informatics, health and education. Santiago, as the capital and largest city, could be expected to play a key role in leading the thrust into the development of a more service- and export-orientated economy. This chapter has sought to provide insight into the state of the Santiago economy, covering its physical, social and governance environments. It describes some of the significant challenges facing the development of the economy. Despite having higher income levels than most of its regional competitors, Santiago has significant levels of inequality. Addressing the inequalities will be challenging and require further economic and social reforms. By 2025, the city is expected to have improved its competitiveness, based on the strength of its economic policies. However, it must address its social and environmental problems; this will be critical to ensuring greater inclusiveness, equality and prosperity. By 2025, Santiago is expected to reach a population of about 8 million. The city will have to continue to support business innovation and provide for the maintenance of its public assets and strategic infrastructure, to make it the best Latin American city for investment, and ensure sustainable development. Key recommendations for Santiago governance are improved governmental coordination and concerted management of its long-term planning issues such as infrastructure development, environmental issues and infrastructure backlogs. Santiago’s labour force will also need skills and competencies enhancement to reduce the service quality gap of existing human capital. Santiago is a dynamic and proud city. However, the city recognizes that many of its development practices are not sustainable, and inefficiencies in its urban systems are holding back opportunities for investment, trade, jobs and economic development. Steps are being taken to introduce sustainable development practices. Government and private efforts are becoming increasingly focused on fostering innovation, entrepreneurship and start-ups, but there is still a way to go before momentum for change and reform gains traction and results. The strengthening of APEC economies’ relationships and city-to-city linkages for trade and investment is a key element to fostering integration of Santiago to trade hubs such as Buenos Aires, Sao Paulo, La Paz and other cities of the APEC region. The city recognizes the importance of strengthening the linkages between cities and along trade development corridors to enable it to play a more dominant role in the sustainable development of cities in the APEC region. APEC could play a significant role in the development of the economy of the Santiago metropolitan region. Opportunities exist for learning and information exchanges between Santiago and APEC cities with which it has direct links, especially by air. Several key areas for cooperation and collaboration are tourism, freight, light industries and the perishable goods trade. The development of regional corridors, especially the Mercosur corridor, would open up trade and investment opportunities, not only for Santiago but also for economies and cities in southern Latin America. APEC provides a mechanism for Santiago to work with other cities in the region to realize the potential for further trade and economic linkages. It is important that the development of the economy and new partnerships are underpinned by a focus on sustainable, equitable and inclusive growth.
339
13. Seoul, Korea Miree Byun, Chang Yi, Mook Han Kim, Jun Sik Bae and Inhee Kim
13.1 INTRODUCTION The Republic of Korea, as the 5th largest economy in APEC, and the 11th largest economy in the world, has undergone a significant transformation from a manufacturing to a services based economy. Seoul, as the capital of Korea, and the area with the highest population and concentration of economic activities in the nation, has been leading this change. Functionally, Seoul is a part of a greater metropolitan area that includes the City of Incheon and Gyeonggi Province. The metropolitan area is one of the largest and densest urban agglomerations in the world (Photo 13.1). This chapter describes the current state of the economic, social, physical development and governance environments of Seoul, and the sustainable development initiatives involving various types of partnerships undertaken to create a more liveable and prosperous city. After a period of rapid development in the 1960s and 1970s, serious environmental and urban development problems began to emerge in the city and metropolitan region. These necessitated strong actions by the government, often in partnership with business and the community, to address issues like water and air pollution, traffic and housing.
Photo 13.1 Central Seoul
Credit: The Seoul Institute.
340
In recent years, the economy has been changing rapidly, with an enormous shedding of manufacturing jobs and firms; and a vigorous response was required to create new jobs and affordable housing for people. Many old industrial areas, freeways and parts of the old economy have already undergone a transformation. Some of the transformation has been difficult, but out of it is emerging a new regional economy in Seoul. Lessons have been gained from the painful adjustment to these changes, but the innovations that have taken place are turning Seoul into a more exciting, greener and smarter city. The final section of this chapter presents three case studies of the way Seoul has used a range of partnership initiatives to contribute to its sustainable development. Some of these initiatives have the potential to be replicated and adapted elsewhere in the APEC region. Other cities could learn much from Seoul about making cities sustainable.
13.2 POPULATION GROWTH AND ECONOMIC DEVELOPMENT 13.2.1 Population Trends According to the 2010 Population and Housing Census, there are an estimated 9.63 million people living in Seoul.644 The Seoul Metropolitan Area (which includes Seoul) had a population of 24.5 million in 2011, or 48.9 percent of Korea’s population, in 2011. Seoul has seen a gradual decline in its population since 1990, when it had 10.6 million inhabitants. In the same period, population had continued to rise in the Seoul Metropolitan Area and Korea as a whole. According to Statistics Korea, the population of Seoul is projected to increase slightly from 2013 until it reaches a peak in 2026 (Table 13.1). The population of Seoul Metropolitan Area is expected to reach a peak of 26.7 million in 2031, while Korea as a whole will reach a peak of 52.16 million in 2030.
Table 13.1 Estimated Population of Seoul and the Seoul Metropolitan Area, 2011– 2014 2011
2015
2020
2025
2030
2035
2040
Seoul
10,026,451
10,025,756
10,135,026
10,214,422
10,202,243
10,101,828
9,924,373
Seoul Metro Area
24,564,036
25,227,848
25,957,255
26,464,910
26,691,182
26,620,275
26,258,981
Source: Korean Statistical Information Service (KOSIS).
13.2.2 Key Economic Facts Seoul is one of the largest manufacturing cities in the world, but its economy is changing rapidly as wages and salaries, China’s manufacturing strength and capital-labour costs rise with the move toward technology-based manufacturing. These changes have had a significant impact on Seoul’s economy. This section describes the changing dynamics of the metropolitan region’s economy and the city’s response to it.
341
Seoul is the single largest economic region in Korea, although its share of national GDP has declined from a stable 24 percent in 2005–2008 to 22.2 percent in 2013. On the other hand, the metropolitan area during the same period maintained its share, with 48.9 percent in 2005 and almost half of Korea’s GDP in 2013. The gross regional domestic product (GRDP) growth rates of Seoul and the capital region show that the region has outpaced the city itself (Figure 13.1). Between 2005 and 2013, Seoul’s GRDP grew an annual 1.6 percent, while the capital region’s GRDP increased by an annual 2.8 percent. The average for Korea was 2.2 percent.
Figure 13.1 GRDP of Seoul and the Seoul Metropolitan Area, million USD, 2005– 2013
Note: calculated in 2010 constant price. Source: Korean Statistical Information Service (KOSIS).
Seoul is Korea’s key business and employment centre. In 2013, Seoul was host to 21.4 percent of Korea’s business establishments (785,094) and accounted for 23.9 percent of employment in Korea (4,585,090 employees). The metropolitan area had 47.2 percent of total establishments (1,736,300) and 50.8 percent of total employment (9,739,962 employees). Seoul’s unemployment rate has been one of the highest since 2005. The rate was 4 percent in 2013, which is higher than the national average of 3.1 percent. Despite a declining residential population in Seoul, the number of establishments and employed people has risen since 2005. Between 2005 and 2013, the residential population declined by 0.2 percent, from 10,167,344 persons to 10,143,645, while that of the metropolitan area grew by 7.6 percent and that of Korea as a whole by 4.8 percent. During the same period, the number of business establishments in Seoul increased by 5.9 percent and employment by 19.3 percent. Growth has been slower in Seoul than for the metropolitan area and fore Korea. The number of business
342
establishments in the metropolitan area rose by 16.4 percent, higher than the average for Korea of 14.7 percent, and the number of employed people grew by 27.5 percent, higher than the average for Korea of 26.6 percent (Table 13.2).
Table 13.2 Key Economic Facts – Seoul and Seoul Metropolitan Area Residential Population 2005 Seoul
Metro
2005
Employed Persons
2013
2005
2013
10,167,344
10,143,645
741,229
785,094
3,843,010
4,585,090
(20.8%)
(19.8%)
(23.1%)
(21.4%)
(25.4%)
(23.9%)
23,465,054
25,258,057
1,492,099
1,736,300
7,637,127
9,739,962
(48.1%)
(49.4%)
(46.6%)
(47.2%)
(50.4%)
(50.8%)
48,782,274
51,141,463
3,204,809
3,676,876
15,147,471
19,173,474
(100.0%)
(100.0%)
(100.0%)
(100.0%)
(100.0%)
(100.0%)
Area Korea
2013
Establishments
Source: Korean Statistical Information Service (KOSIS).
Table 13.3 Number/Share of Establishments and Annual Growth Rate by Industry, Seoul, 2010 and 2013 Industries
2010
2013 Share %
No.
Annual Growth Rate
Share %
No.
729,731
100.0
785,094
100.0
2.5
Information and communications
13,690
1.9
19,240
2.5
12.0
Professional, activities
26,414
3.6
33,624
4.3
8.4
and
10,033
1.4
12,495
1.6
7.6
Sewerage, waste management, materials recovery and remediation activities
379
0.1
448
0.1
5.7
Electricity, gas, steam and water supply
106
0.0
122
0.0
4.8
Health and social work activities
22,042
3.0
24,984
3.2
4.3
Construction
19,077
2.6
21,027
2.7
3.3
Manufacturing
53,950
7.4
58,551
7.5
2.8
209,989
28.8
226,629
28.9
2.6
30,044
4.1
32,240
4.1
2.4
115,415
15.8
123,634
15.7
2.3
9,581
1.3
10,165
1.3
2.0
Membership organizations, repair and other personal services
68,226
9.3
71,509
9.1
1.6
Transportation
92,893
12.7
93,368
11.9
0.2
22
0.0
22
0.0
0.0
Total
scientific
and
technical
Business facilities management business support services
Wholesale and retail trade Education Accommodation activities
and
food
service
Financial and insurance activities
Mining and quarrying
343
1,281
0.2
1,267
0.2
-0.4
Real estate activities and renting/leasing
35,100
4.8
34,629
4.4
-0.4
Arts, sports services
21,467
2.9
21,122
2.7
-0.5
22
0.0
18
0.0
-6.5
Public administration and compulsory social security
and
defence;
recreation-related
Agriculture, forestry and fishing
Source: Korean Statistical Information Service (KOSIS).
13.2.3 Key Industry Growth Sectors Although wholesale and retail trade (28.9%), accommodation and food service activities (15.7%) and transportation (11.9%) had the largest shares by industry, the growth rates of those industries were around or lower than the average growth rate of all industries in Seoul. Between 2010 and 2013, information and communication showed the highest annual growth rate of 12 percent. During the same period, Seoul recorded a growth rate of 2.5 percent for all industries. The share of the information and communication industry also expanded from 1.9 percent in 2010 to 2.5 percent in 2013. Professional, scientific and technical activities grew by 8.4 percent, followed by business facilities management and business support services at 7.6 percent. These fast-growing industries are the growth sectors for the city. 13.2.4 Trade China is the city’s largest trading partner. In 2014, exports to China were valued at USD 17.85 billion; with imports valued at USD 32.563 billion. The total trade deficit with China was USD 14.713 billion. The total value of exports to other nations includes: the USA (USD 7.472 billion), Viet Nam (USD 4.587 billion), and Japan (USD 3.32 billion). After China, Japan (USD 17.039 billion) and the USA (USD 16.426 billion) rank second and third in terms of import sources. Overall, Asia was the largest market for Seoul: the destination for 60.1 percent of its exports, and the source of 52.2 percent of its imports (Table 13.4).
344
Table 13.4 Exports, Imports and Growth Rates by Economy, Seoul, 2014 Economy / City
Exports (thousand USD)
Growth rate (%)
Imports (thousand USD)
Growth rate (%)
Trade balance (thousand USD)
17,850,397
-0.5
32,563,499
13.7
-14,713,102
US
7,472,263
11.8
16,425,673
6.3
-8,953,410
Viet Nam
4,587,347
13.5
3,384,722
26.7
1,202,626
Japan
3,320,042
-0.2
17,038,768
-3.8
-13,718,726
Hong Kong, China
2,492,689
-2.7
617,177
-9.3
1,875,512
Russia
2,181,875
-5.9
1,474,650
-5.9
707,225
Indonesia
1,562,261
-4.4
2,658,938
-2.5
-1,096,678
India
1,498,232
17.7
2,069,694
-4.2
-571,462
Slovakia
1,274,925
17.7
102,552
29.3
1,172,373
Thailand
1,070,671
9.3
2,401,002
8.2
-1,330,331
China
Source: Korean Statistical Information Service (KOSIS).
13.2.5 City/Regional Economic Competitiveness As indicated, Seoul is the largest economic entity in Korea. In 2013, more than half of the total establishments in information and communication were in Seoul. Including the ICT industry, Seoul has the highest number of business establishments engaged in professional, scientific and technical activities (38.3%), business facilities management and business support services (26.9%), transportation (25.1%), financial and insurance activities (24.5%), and wholesale and retail trade (23.6%). In real estate activities and renting and leasing, Seoul represents the second biggest agglomeration in Korea, but still showed an impressive share of 26.9 percent of the total number of establishments in the industry. Seoul’s industrial specializations were assessed by determining the location quotient (LQ) of each industry. LQ is an analytical statistic measuring a region’s industrial specialization in relation to a larger region, typically the economy in which the region is located. If the LQ of an industry is higher than 1.0, the region has a higher concentration of that industry than the economy; if lower than 1.0, vice versa. The LQs of the seven industries cited above are higher than 1.0, indicating that Seoul is more specialized in those industries than Korea as a whole ( Table 13.5). Other industries also rank highly in 16 provinces, special and metropolitan cities, but none of them has an LQ over 1.0. Although most industries exist in Seoul, not every industry in Seoul is more competitive than in other regions in Korea. For example, despite its overall economic scale, agriculture, forestry and fishing and mining and quarrying barely exist in Seoul. Table 13.5 Industrial Specialization and Competitiveness by Industry, Seoul, 2013
345
Industry
Location quotient (LQ)
Share
Rank
Information and communications
2.54
54.1
1
Professional, scientific and technical activities
1.80
38.3
1
Business facilities management and business support services
1.26
26.9
1
Real estate activities and renting/leasing
1.22
26.1
2
Transportation
1.18
25.1
1
Financial and insurance activities
1.15
24.5
1
Wholesale and retail trade
1.11
23.6
1
Arts, sports and recreation-related services
0.95
20.3
2
Health and social work activities
0.93
19.9
2
Education
0.87
18.6
2
Accommodation and food service activities
0.84
18.0
2
Construction
0.84
17.9
2
Membership organizations, repair and other personal services
0.84
17.9
2
Manufacturing
0.74
15.8
2
Public administration and defence; compulsory social security
0.49
10.5
2
Electricity, gas, steam and water supply
0.34
7.3
7
Sewerage, waste management, materials recovery and remediation activities
0.30
6.4
4
Mining and quarrying
0.05
1.2
10
Agriculture, forestry and fishing
0.03
0.7
13
Source: Korean Statistical Information Service (KOSIS).
13.2.6 Innovation, Creativity and Business Entrepreneurship Innovation and creativity are hard to measure quantitatively. Typically, however, patents and R&D investments in a region are good proxies. In Seoul, the number of applications for intellectual property, such as patents, declined from 2007 to 2010, but rebounded after 2010. Between 2010 and 2013, the number increased from 118,459 to 138,695, at an annual growth rate of 5.4 percent. The annual growth rate itself grew 7.7 percent in 2013 over the previous year (Table 13.6).
346
Table 13.6 Applications for Intellectual Property, Seoul, 2007–2013 No. of applications
2007
2008
2009
2010
2011
2012
2013
128,575
124,811
122,494
118,459
120,548
128,734
138,695
108.54
105.36
103.41
100.00
101.76
108.67
117.08
Index
Source: National Science & Technology Information Service
R&D investment in both the private and public sectors has grown steadily since 2010. In 2013, R&D investment in the public sector was valued at USD 3,109 million, an increase of 1.2 percent over the previous year; while the private sector invested more than twice that – USD 6.62 billion – representing an increase of 11.4 percent over 2012. In general terms, this indicates that the level of innovation and creativity in Seoul has been improving consistently since 2010.
Table 13.7 New Business Formations, Seoul, 2013 Industry
No. of existing businesses (A) 319,308
Wholesale and retail trade
No. of new businesses (B)
Percent Growth (B/A)
48,098
15.1
Real estate activities and renting/leasing
329,030
34,046
10.3
Accommodation and food service activities
137,879
26,111
18.9
51,222
8,321
16.2
Transportation
103,450
8,165
7.9
Manufacturing
72,377
7,171
9.9
Information and communications
36,553
6,702
18.3
Membership organizations, repair and other personal services
49,507
6,061
12.2
Education
28,182
5,989
21.3
Construction
56,979
5,311
9.3
Arts, sports and recreation-related services
24,431
4,488
18.4
Business facilities management and business support services
20,584
3,680
17.9
Financial and insurance activities
9,995
2,542
25.4
Health and social work activities
18,641
1,666
8.9
Electricity, gas, steam and water supply
166
45
27.1
Sewerage, waste management, materials recovery and remediation activities
478
23
4.8
47
6
12.8
Professional, scientific and technical activities
Mining and quarrying Source: Korean Statistical Information Service (KOSIS).
347
Seoul is Korea’s city of entrepreneurship. In 2013, 22.4 percent of total new businesses were formed in Seoul, while more than half (53.1%) started in the metropolitan area. In the same year, wholesale and retail trade (48,098 businesses), real estate activities and renting/leasing (34,046 businesses) and accommodation and food service activities (26,111 businesses) saw the largest increase in the number of new businesses. These new businesses represented 64.3 percent of total new businesses in Seoul. In terms of share of new businesses, financial and insurance activities (25.4%) and education (21.3%) recorded the highest levels. Electricity, gas, steam and water supply had the highest of all at 27.1 percent, but had a lesser impact on the number of new businesses in the industry than those in other key industries. In addition, accommodation and food service activities (18.9%), arts, sports and recreation-related services (18.4%) and information and communications (18.3%) showed higher growth rates than other industries (Table 13.7). 13.2.7 Local Economic Development Competitiveness According to a report by the Economist Intelligence Unit, Hot Spots 2025, Seoul ranks 15th in city competitiveness. However, Seoul’s economy is not growing at the rate residents expect, with the slowdown in growth resulting from the size of the city itself.645 Seoul is the biggest city in Korea: almost one-fifth of the people and businesses and onefourth of the jobs are located in this city which takes up only 0.6 percent of the total land area of Korea. Seoul produces about 38 percent of Korea’s total GDP. As the growth rate of the city declines, the scale of Seoul’s economy and its growth rate may be undervalued. The changing industrial structure of Seoul may also lower its regional economic growth. The rise of service industries in juxtaposition with the decline of manufacturing industries has been one of the dominant trends emerging in the Seoul region. Since the productivity of manufacturing is generally higher than that of the service industry, the overall productivity of a regional economy can go down. Seoul realizes the seriousness of this trend and has made efforts to identify and support new growth engines and upgrade old industries. Lastly, to capture a whole picture of Seoul’s regional economy, the spatial pattern at the metropolitan level should be considered. Seoul may be slowing down, but the Seoul Metropolitan Area as a whole, composed of the Seoul Metropolitan Government (SMG), Incheon City and Gyeonggi-do, is still growing strongly. Spatial division of labour, driven by the economies and diseconomies of the megacity, has been developed by municipalities in the Seoul Metropolitan Area. Seoul has become more of a ‘command and control’ service centre, whereas other municipalities accommodate the spatial needs for production and logistics. Thus, it is important for Seoul to imagine and pursue a winwin regional economic and industrial policy framework at the metropolitan level, which is still in the pipeline.
13.3 STRATEGIC INFRASTRUCTURE AND ASSETS 13.3.1 Infrastructure Needs
348
With a population of 10 million, it is of critical importance that the SMG manages key strategic infrastructure properly. The transportation network undoubtedly is a key part of the physical infrastructure and of major importance. As of 2012, the number of trips in and out of Seoul was reported as more than 60 million including 25 million trips within Seoul. As shown Table 13.8, about 66 percent of these travellers used public transportation.646 The number of automobiles registered in Seoul has also been increasing steadily since the 1980s. The number of cars reached 3 million in 2014.647 The SMG has been a large consumer of electricity, increasing its use at an annual rate of 3.5 percent from 2000. In 2012, the city used 47,000 GWha of electricity.648 In that same year, a person living in Seoul was provided 303 litres of water per day and consumed 286 litres.649 As residents of Seoul seek a better quality of life, energy consumption, including electricity and water, is likely to increase.
Table 13.8 Transportation Mode Share in Seoul, percent Mode Share
2002
2003
2004
2005
2006
2007
2008
2009
2010
2011
2012
Public Transit
60.6
61.2
62.0
62.3
62.3
62.5
62.8
63.0
64.3
65.1
65.6
(Bus)
(26.0)
(25.6)
(26.2)
(27.5)
(27.6)
(27.6)
(27.8)
(27.8)
(28.1)
(28.0)
(27.4)
(Subway)
(34.6)
(35.6)
(35.8)
(34.8)
(34.7)
(34.9)
(35.0)
(35.2)
(36.2)
(37.1)
(38.2)
Automobile
26.9
26.4
26.4
26.3
26.3
26.3
26.0
25.9
24.1
23.5
23.1
Taxi
7.4
7.1
6.6
6.5
6.3
6.2
6.2
6.2
7.2
7.0
6.9
Other
5.1
5.3
5.0
4.9
5.1
5.0
5.0
4.9
4.4
4.4
4.4
Source: Seoul Statistics.
A strong commitment to education is one of the key factors for economic success in Korea. With 37 universities, the SMG has become the centre of major educational institutions. The Seoul Metropolitan Office of Education administers 235 collegepreparatory high schools, 80 vocational schools, 377 middle schools and 33 special education schools.650 Seoul is a highly-connected city with an expansive information and communications infrastructure. Internet penetration rate is 80 percent, meaning that more than two-thirds of residents have access to broadband Internet. Nationwide, nearly 60 percent of Koreans own smartphones. Korea has one of the highest Internet and communication technology access rates among OECD nations.651 As one of Asia’s megacities, Seoul needs to contain and maintain essential physical infrastructure to support its economic activities.
13.3.2 Assessment of Physical Infrastructure
349
Of the various types of infrastructure, the transportation network is the most important as it supports economic activity in the city. Seoul has an extensive roadway network of 8,173km with two inner-city highways along the Han River. In addition, a system of inner and outer ring roads exists within the city.652 Despite this, Seoul suffers from severe traffic congestion. In 2010, the average travel speed on the main roads in Seoul was 20km/h. The Korea Transport Institute estimates that the cost imposed on residents in the form of time wasted on the road is USD 9.5 billion per year. Improving travel speed is a significant challenge for the SMG.653 While Seoul is highly motorized, the SMG has continued to invest in its subway system since opening the first subway line in 1974. Seoul now operates nine rail lines totalling 327km with 306 stations. Bus networks complete the public transportation network. With 7,500 buses, the SMG provides a three-tiered bus service of express, long-distance and community buses. As part of the 2004 ‘bus reform’, the SMG integrated the bus and subway systems, allowing free transfers between the two systems, with a transit card granting convenience to users of both systems. More importantly, dedicated bus lanes at the centre of major arterials are in place. These lanes effectively guarantee a free flow of bus traffic. As a result of the bus reform, bus speed, capacity and regularity of the system have substantially improved.654 Seoul is a transit-oriented city and invests approximately USD 300 million annually into subsidizing the public transport system. Another key to sustaining economic activity is the provision of energy through a stable network. A single public provider of electricity, the Korea Electric Power Corporation, generates 70 percent of the city’s electricity from thermal power plants and the remaining 30 percent from nuclear power stations. About half of this power is consumed for commercial and industrial uses while households take up 14 percent. After the Fukushima nuclear disaster in Japan, serious concerns were raised about the safety of nuclear power plants, but it has been difficult to find alternative sources of energy. The SMG continues its effort to upgrade the electricity network. While providing electricity to Seoul is still a one-way process, the Korea Electric Power Corporation plans to set up a smart grid to take advantage of advanced information technologies in the city.655 The SMG established a centralized municipal water system covering major parts of the city. All Seoul households have access to safe tap water 24 hours a day. To ensure this access, the SMG manages six water purification plants. Supply comes from 109 reservoirs and is carried through 13,720km of water pipes connecting 2 million taps in Seoul.656 At USD 5.29 per cubic metre, the cost of producing water is high compared to other cities such as Beijing (USD 1.64), Bangkok (USD 4.72) and Manila (USD 3.70). To address this issue, at least in part, the SMG charges more per unit of water to entities with higher consumption than to those which consume less.657 13.3.3 Plans for Reinvestment in Public Infrastructure Reinvestment is required in various forms of public infrastructure in Seoul, but the urban railway system is in the greatest need of an upgrade. Since a specific reinvestment plan has been developed, this chapter focuses on the components of the railway network. As shown in Figure 13.2, 11 new light rail lines, totalling 100km, were proposed around Seoul in 2008. This plan was based on a concession agreement to attract funds from the private sector. The Ui-sinseol line began construction in 2014. The SMG has been
350
revising initial plans for other proposed lines to estimate better travel demand and is in the process of negotiating with private developers.
Figure 13.2 Proposed Light Rail Lines in Seoul
Source: Authors.
Another major SMG investment plan is a proposed 30km rail line extending from east to west on the south side of the Han River. While Subway Line 2 services the same corridor and carries 2 million passengers each day, the level of congestion has been notoriously high, at 200 percent of capacity. Moreover, the roadway parallel to the second line, the Nambu Sunhwan Road is severely congested during peak hours. The proposed rail line, called the Nambu Express Line, is expected to reduce travel time to one-third of the current level. Figure 13.3shows the proposed route.
351
Figure 13.3 Nambu Express Line (Proposed)
Figure 13.4 Shin Bundang Extension Line (Proposed)
Source: Authors.
352
The SMG also plans to extend regional rail services into the city. At present, there is only one subway line to access the CBD from the northwest of Seoul, which is inadequate for the increasing travel demand. Transportation planners have long suggested the need to plan for new transit service. The extension of the Shin Bundang Line by 20km could better serve citizens living in the northwest who commute to the CBD (Figure 13.4).
Figure 13.5 KTX Extension Line (Proposed)
Another plan is to extend service to the city for the Korea Train Express (KTX), a high-speed rail Source: Authors. system connecting the whole nation. KTX is planning to set up a new 32km line that passes through the east side of the city from south to north (Figure 13.5). With the population in the east of Seoul at about 5 million, the current level of access to the KTX is inadequate. With this plan, local access to transit within Seoul will improve, as well as nationwide access to Seoul. 13.3.4 Operation and Maintenance of Infrastructure While it is important to expand infrastructure, it is also critical that it is well maintained. Accidents in public infrastructure facilities can be catastrophic. For nuclear power plants, in addition to frequent and constant monitoring to prevent malfunctions, regular inspections are scheduled to follow the nuclear fuel reloading cycle, which is 13–16 months. Thermal power plants are examined every 2–4 years depending on the condition of the facilities. To minimize energy shortage, the Korea Electric Power Corporation puts emphasis on maintenance of its power plants. The management of water works is an area where operation and maintenance are more important than expansion. Currently, the SMG uses its geographic information system (GIS) database for all water pipes in Seoul. The database records location, physical structure, year of installation and history of repairs. This information is key to carrying out repairs to prevent leakage from water mains. As an effort to ensure water quality, the SMG analyzes its water in close adherence to the standards established by the WHO.
353
Since 2011, the SMG has invested USD 58 million to replace deteriorating water pipes in 450,000 households. There are 22,000 buildings in Seoul that still provide water from rooftop water tanks, which have the potential to reduce water quality. In recognition of potential problems and since the buildings are relatively small structures, such as fivestorey buildings, the SMG is replacing these water tanks with pipes. An additional, secondary benefit will be an improved cityscape.658 In the transport sector, a lot has been achieved to increase the mobility and accessibility of citizens in Seoul. As the first subway line was opened in 1974, many railway cars are now wearing out and need repair or replacement. Currently, the SMG operates 4,500 round-trips with a total of 3,715 railroad cars. While the transport share of the subway was 38.2 percent in 2012, approximately 20 percent of the railroad cars are operating beyond their life expectancy of 20 years. Some equipment in the control centre is also older than its lifespan. Thus, the SMG is investing heavily in improving facilities and equipment including railroad cars and tracks and the control system. In 2013 alone, the SMG spent USD 290 million (about 20 percent of the total subway system budget) on subway system upgrades. The efforts to keep the subway system safe and convenient are ongoing. Similar efforts are being made to improve the roadway infrastructure. The major issue in operating and maintaining the roadway network is managing the citywide expressways. As noted, there are 8,173km of roads in Seoul, with 177km designed as freeways for the exclusive use of automobiles. The SMG spent USD 80 million in 2013 maintaining the safety of these freeways; work included maintenance of safety facilities, repairs to road signs, and pavement works. In a city such as Seoul where most roads are congested during peak hours, the expressway has the same issue. The average travel speed of all highways is estimated at 36km/h during the morning rush hour. Considering the speed limit is 70– 80km/h, the expressway does not realize its potential as an urban highway.659 So far the infrastructure of Seoul has kept pace with growing economic activity and energy demands. Now things are different. Concerning transportation, the SMG needs to increase travel speed on urban highways since there is almost no opportunity to expand roadway capacity in the city. The efforts to promote public transit use should also continue even though infrastructure reforms for public transportation were completed in 2004. Problems regarding energy and resources are also serious. According to Population Action International, the available amount of water per capita in 2025 will be between 1,199 and 1,327 cubic metres which places Korea in the category of ‘water-scarce’ economies.660 Together with soaring demand for resources, another growing concern in Korea is potential electricity shortfalls. In 2012, blackout warnings were issued several times in August as well as during the winter. Considering the recent lacklustre national growth rate, the economy may be crippled further if the electricity supply remains uneven.661 Further strain is expected on the electrical grid. To promote further sustainability in the transport sector, Seoul has invested heavily in expanding the use of electric vehicles that produce no carbon dioxide emissions. This is one area that the SMG has been successful in planning for the future. Although the current transport share of electric cars is less than
354
1 percent, an additional 50,000 electric vehicles will be on the roads by 2018. The SMG plans to replace gasoline cars with electric vehicles in certain sectors such as taxis and buses and has allocated USD 200 million toward this in 2015. To cope with the increasing energy demand, the SMG is replacing the current one-way electricity grid with a smart grid. Utilizing matching funding from the national government, USD 22 million was invested in 2015. Such investment will continue; with substantial assistance from the national government, a fully operational smart grid will be realized shortly. It has, however, been an uphill battle to increase the use of renewable energy in Seoul; its topography and geographical features make installation of production facilities for renewable energy difficult.
13.4 SOCIAL SYSTEMS AND SUSTAINABILITY 13.4.1 Labour Market and Human Resource Development The discussion below looks at trends in population, the educational profile of residents in Seoul and the employment structure. Of note is the ageing population, which is becoming an important issue for the Seoul labour market. Population trends In Seoul, the young (age 14 and under) made up just 13.8 percent of the city’s population in 2010, down from 31.3 percent in 1980.662 Meanwhile, those aged 65 and over accounted for 2.5 percent of the city’s population in 1980, but by 2010, they made up 9.3 percent of the city’s population. Similar patterns are being seen in the Seoul Metropolitan Area and the nation as a whole. The working-age population (those aged 15–64) in Seoul increased from 5.6 million in 1980 to 7.7 million in 2010, or 76.7 percent of the city’s population.663 Similar trends and percentages were seen in the Seoul Metropolitan Area and Korea as a whole. Educational Levels Residents in Seoul tend to be better educated than those in other areas. 664 In 2010, those who had completed a four-year college programme accounted for 34 percent of the city’s population. The corresponding figure for Seoul Metropolitan Area was 28 percent. Employment Structure The employment rate of Seoul in 2013 was about 60 percent. That is 0.3 percent point higher than the national average, but unemployment is 4 percent, which is one percentage point higher than the whole nation (Figure 13.6).
355
Figure 13.6 Employment and Unemployment Rates, Korea
Source: Korean Statistical Information Service (KOSIS).
As of 2014, employed persons and job seekers together totalled 5.4 million, accounting for 63 percent of the 8.5 million people aged 15 or older in the city. From this population willing to engage in economic activity, some 5.15 million people – the highest number since 1989 – were employed. The number of workers has soared, particularly in the last decade, by 315,000 (from 4.831 million in 2004 to 5.146 million in 2014), largely owing to a significant rise in the number of workers aged 55 or older. However, the city’s workforce is increasingly ageing. The percentage of older workers (65 or older) has steadily climbed, surpassing the number of young workers aged 15 to 29 in 2012. By 2014, 22 percent of all workers were 55 or older, which is noticeably higher than the younger workforce aged 15 to 29, which accounts for 17 percent. The composition of workers by industry is as follows (as of 2014): self-employed, public services and others (40.3%); wholesale/retail, accommodation and food services (27.7%); and electrical, transportation, communications and finance (16.0%) (Figure 13.7). The last decade has seen a major increase in the number of self-employed, and those working in public services and other industries – by 560,000 people – and in electrical, transportation, communications and finance – by more than 100,000. In the meantime, the number of workers in wholesale or retail trade, accommodation and food services, and the construction industry dropped by 9,000 each. The manufacturing industry saw a reduction of some 260,000 people. These statistics show a shift in the industrial structure, from traditional manufacturing and unskilled industries to the professional services, high technology and financial sectors. This has been the trend in the city’s labour market and industries for a prolonged period and Seoul has responded to the change by, for example, providing various learning opportunities to its people in a proactive manner and has accomplished much.
356
Figure 13.7 Percentage of Workers by Industry, Seoul
Source: Korean Statistical Information Service (KOSIS).
In recent years, however, the industrial structure has shown a rather different change. The number of people who are self-employed, or working in public services and other industries as well as the electrical, transportation, communications and finance sectors, continued to grow until 2014 when it began to decline, while growth was seen in manufacturing, wholesale/retail, accommodation, and food services. There is no knowing whether this will become a trend in the future, but it is certainly time to pay more attention to how the urban industrial structure might be affected by the demographic changes caused by the retirement of baby boomers. 13.4.2 Addressing Unemployment Issues Seoul recognizes that unemployment, especially youth unemployment, is a serious problem. As of 2014, approximately 240,000 people were jobless and actively searching for jobs, up by 14.8 percent (30,000) year on year, the highest growth rate since 2000. Compared to 2013, the number of unemployed grew in all age groups; 54.8 percent were between 15 and 29 years of age. Youth unemployment has become a major issue. In 2014, the rate of unemployment for youth reached 10.3 percent. Since the financial crisis in 2008, Seoul has borne the brunt of the effects of the global economic slowdown on Korea. To minimize the pain felt by residents, the city has given priority to unemployment countermeasures above all other economic policies and has addressed the issue in the context of all other policies. These unemployment countermeasures look at various aspects of the issue and strive to create jobs through public projects, local community programmes and various assistance programmes (e.g. financial assistance by a centre for young start-ups in Seoul).
357
The SMG also develops spatial policies according to specific employment needs. Seoul has a concentration of certain industries in certain regions: jewellery in Jongno; design and publishing in Mapo; and IT in Seongsu. The city plans to build facilities in each of these regions to act as anchors for job creation. To do so, it has intensively invested to encourage ripple effects in the economy. These policies are not confined to certain regions or industries. In the areas that specialize in traditional manufacturing (e.g. sewing and textiles), education services required for the relevant industries are provided, along with financial assistance to encourage hiring. In the high-tech R&D industrial complexes collaboratively run by academia, industry and research institutes, technology development is strongly supported as a way to sustain knowledge-based industries. In 2012, Seoul announced that 0.48 persons were hired per USD 90,909 spent on R&D investment. Recently, there have been efforts to create more jobs by inviting multinational companies to establish their regional headquarters in Seoul. The city expects that the high-tech R&D centres built with foreign capital will lead to the creation of sustainable and quality jobs.
13.5 ENVIRONMENTAL MANAGEMENT AND SUSTAINABILITY: POLICIES AND INITIATIVE The SMG initiated a set of Smart City Initiatives to promote sustainable development. Under the policy direction of the initiatives, the SMG declared a Sustainable Policy Initiative along with action plans. The initiative encompasses environmental management, creative economic development, and improvement of social equity. The policy goals for each sphere are: 1. Environmental management Become a world-leading city in climate protection Build an energy-efficient recycling system Create a pleasant and green city with resident participation Build a people-oriented transportation system. 2. Creative economic development Construct a creative economy Generate sustainable jobs Build a global economic city Expand the social economy and diversify industries. 3. Improvement of social equity and cultural vitality Construct a social system without polarization or discrimination Create a society that includes all people Build a safe and healthy city Create a cultural ecosystem and expand opportunities for activities.
358
The following action plan has been announced and is designed to materialize the benefits from the initiative for the city’s people:
Sustainable Energy Action Plan: This calls for a10 million-ton reducti on in greenhouse gas emissions by reducing the quantity of energy used by an amount equal that created by one nuclear power plant between 2012 and 2014 and again by a similar amount by 2015. Sustainable Transportation Action Plan. The target is for eco-friendly transportation to have an 80 percent transport mode share. Sustainable Regeneration Action Plan. The aim is to build an entire system within the city that can regenerate for the next 100 years.
Table 13.9 shows indicators for periodic evaluation of progress on the Smart City Initiatives. With these indicators at work, the city can carefully monitor the performance of policies for sustainability. While it is true that progress from the base year has been moderate at best, it is too early to discuss policy outcomes. To set more ambitious goals for the future, the SMG proposed a range of policy strategies. What is promising among them is the ‘One Less Nuclear Plant’ policy that affects various environmental management schemes. The policy attempts to increase production of renewable energy, thereby reducing fossil fuel consumption in buildings for different uses and promoting citizen participation in the process. To advance that policy, the SMG initiated a Building Retrofit Project to reduce energy consumption in buildings with at least 2,000 square metres of total floor space. These large buildings are known to consume 22 percent of total energy used by buildings in Seoul. Financial assistance is available to building owners to install energy reduction devices. The Feed-In-Tariff system is also being introduced in Seoul to support photovoltaic systems. The SMG plans to provide a half-cent subsidy for production of 1 KWh using photovoltaic facilities. Energy consultants from the SMG also provide technical advice to businesses and households interested in renewable energy, a timely programme in the process of implementation that is designed to actively involve the city’s citizenry. The eco-mileage programme, which provides financial incentives to households that reduce their consumption of electricity, water and gas, saved 100,000 tonnes of emissions between 2011 and 2013. As of 2013, 700,000 people have participated. The ‘One Less Nuclear Plant’ policy is not without shortcomings. For example, the city failed to install photovoltaic systems in any schools, including universities. Private investment has also been insufficient to expand the base for solar energy use. However, with tangible improvement from environmental policies, residents are optimistic that environmental progress can be monitored, and they can adapt to new challenges.
359
Table 13.9 Evaluation Indicators of Seoul’s Sustainable Development Sector
Indicator
Base Year (2010)
Present
Target (2020)
(as of 2013) Environment
1. CO2 emissions
49,751,000 tons
48,551,000 tons (2012)
37,220,000 tons
34
29
0
15,717,000 TOE
15,496,000 TOE
13,787,000 TOE
0.6%
1.4% (2012)
5%
5. Recycling rate of municipal waste
43.0%
45.9%
57.3%
6. Water reuse rate
3.86%
9.1%
14.4%
30㎍/㎥ (2007)
25㎍/㎥
20㎍/㎥
6.84 m (2012)
9.44 m
11.5 m
16.06 ㎡
16.37 ㎡
17.5 ㎡
70%
71.3% (2012)
75%
51.2%
52.6%
60%
2. Decent income rate
84.4% (2013)
84.4%
88.2%
3. Life-long education participation rate
32.6%
34.4%
50%
164,581
215,530
357,000
23.6%
24.8%
35%
7,878 (2012)
8,178
11,000
429
371
212
8. Healthy life expectancy
73.18
74.38
77
9. Satisfaction with cultural environment
5.93
6.41
7.10
11 (2011)
135
375
3,706 (2008)
6,237
10,000
2. Percentage of people employed in the creative industry
23.4%
23.7%
30%
3. Employment rate
63.5%
64.9%
70%
4. Youth employment rate
43.6%
43.9% (12)
50%
5. Foreign resident satisfaction with the living environment
6.78
6.86
8
6. No. of international visitors
7.07 m
9.85 m
20 m
522
1,503
8,000
37(2013)
50(2014)
100
272,510
286,674 (2012)
310,000
2. No. of areas prone to flooding 3. Total energy consumption 4. Renewable energy rate
7. Ultrafine particle concentration 8. No. of citizens visiting Han River 9. Park area per person 10. Eco-friendly transport mode share Society & Culture
1. Economic activity participation rate by women
4. No. of public rental houses (accumulated) 5. Senior citizen employment rate 6. No. of citizen proposals 7. Traffic accident fatalities
10. No. of community cultural spaces Economy
1. No. of ventures
7. No. of social enterprises 8. No. of sharing groups/companies 9. No. of employees in manufacturing
360
10. Areas for urban agricultur e
29.1 ha (2011)
108 ha
430 ha
Source: Seoul Metropolitan Government, 서울시 지속가능발전 기본계획 [Seoul Master Plan for Sustainable Development] (2015).
13.6 URBAN GOVERNANCE 13.6.1 City Vision While the processes of urbanization, and trends in trade liberalization and globalization, have contributed to the creation of wealth, the same processes have caused a whole host of problems. Chief among these are increasing socioeconomic polarization and social exclusion. Seoul has not escaped these impacts: ‘Social exclusion, generational unemployment, material poverty, wealth inequalities and an ageing population are growing problems.’ 665 This led the SMG to adopt the concept of Social Innovation under Mayor Park Won Sun’s administration in 2012. This initiative sought to introduce social innovation ideas to the public sector.666 Social innovation is being promoted in two directions. The first looks to enhance the transparency of policy procedures and ensure substantive participation by residents. The second, collaboration and integration, is the focal part of social innovation. The SMG makes use of innovative technologies, cross-sector collaboration and social integration to advance social innovation; the SMG’s strategy is to focus on a ‘community rebuilding project’ and the promotion of a ‘sharing economy’.667 During Mayor Oh Se Hoon’s administration (2006–2012), Seoul Creative Governance was Seoul’s vision. The focus was on creativity in the process of innovating the public sector.668 Under the paradigm shift from a supply-oriented administrative system to a custom- (or citizens-) oriented system, the public sector would have to change its process of decision-making, its organizational culture and relations between civil servants and residents. 13.6.2 Governance Reforms and Initiatives 13.6.2.1 Collaborative Governance Initiatives The fundamental concept of Social Innovation is collaborative governance. The Seoul City Administration established an Information Disclosure Policy Division, which is in charge of information disclosure. The city administration planned to disclose 1,200 types of information in 150 areas, including administrative information, public data and minutes of meetings by the end of 2014. The Information & Communication Plaza aims at the disclosure of administrative information and the creation of new economic and social values through information sharing.669 In 2012, for the first time for a large-scale local government in Korea, the SMG adopted a Residents’ Participation Budget System. Of the approximately USD 19,090 million in the annual city budget, residents will be able to decide how around USD 45 million should be utilized. For 2013, USD 42 million was spent on 120 projects proposed by residents.
361
Creative Governance, as viewed from the perspective of city residents, is to identify residents’ needs and the sources of inconvenience. Creative governance, in essence, aims to achieve two goals. One is to enhance Seoul’s competitive edge, and the other is to improve the residents’ quality of life. Most cities have systems to hear the opinions of their people and reflect them in governance. In Seoul, this is carried out through the ‘Ten Million Imagination Oasis’. Under this initiative, policy workshops were held frequently to gather the opinions of experts and residents on SMG policies, and to reflect those views in future policies. The SMG also runs a variety of other communications channels to listen to and communicate with people. It also uses text messaging to collect people’s opinions more quickly. The SMG seeks to make Seoul a sharing city to help solve a variety of urban problems through people sharing space, things and information. Based on close cooperation among people, corporations and the city government, Seoul city shares resources needed for daily life such as parking lots, automobiles, rooms, books and tools. Its advanced IT makes such sharing easier. 13.6.2.2 Smart City Initiatives The Smart City Initiatives, mentioned earlier, also aim to tap the potential of technology to improve administration and governance. Seoul has been relatively successful in this regard, topping the UN-supported Rutgers Global E-Governance Survey since 2003.670 However, other economies are catching up. Recognizing this, the city has launched Smart Seoul 2015, a three-phase plan that begins by building a smart infrastructure based on existing ICT projects (2011–2012). The next phase focuses on the provision of smart services (2013–2014) while the final phase moves ahead to develop smart services (2015). 671 13.6.3 Public Finance All these social and physical reforms require financial assets. In 2014, Seoul issued USD 275 million in local bonds but none in 2015. In 2013, total tax revenue in Korea was approximately USD 237 billion, of which the central government’s share was 79 percent and the local government’s 21 percent.672 According to the Ministry of Strategy and Finance, national tax revenue includes income tax, corporate tax, value added tax, transportation and energy tax, education tax, liquor tax and other charges. Local taxes include local income tax, local consumption tax, acquisition tax, automobile tax, leisure tax, resident tax, tobacco consumption tax, regional resources and facilities tax, local education tax, property tax, and registration and licensing tax. Among these taxes, property tax and registration and licensing taxes are levied by autonomous Gus (districts); others are city taxes in Seoul. The SMG has two different revenue structures. One is independent revenue such as local taxes and non-tax revenues and the other is dependent revenue such as grants and subsidies from the national government. The total SMG budget increased from USD 22.895 billion in 2014 to USD 23.401 billion in 2015, with local tax revenue making up 53.4 percent of the total budget. In the general account, independent revenue such as local
362
tax and non-tax revenues makes up 81.6 percent of the budget while national subsidies represent only 11.2 percent. National subsidies offer support for the development of social infrastructure and social welfare in the local government. In the case of Seoul, the share of dependent revenue is relatively insignificant in terms of the total city budget and Seoul (unlike many other local governments in Korea) enjoys an excellent level of fiscal independence. At present, Seoul has the most outstanding and stable financial structure of all local governments in Korea. However, social welfare is the most significant and rapidly increasing expenditure in Seoul, consuming 34.3 percent of total spending. This trend will continue in the future due to the growing demand for social and welfare investment. The second largest spending is the support for autonomous Gus. Seoul provides over USD 3 billion in subsidies every year for autonomous Gus because of their limited ability to generate revenue. This subsidy is financially crucial for Gu management and also alleviates the financial imbalance between the regions. Support for the Seoul Metropolitan Office of Education is mandatory and includes subsidies for students, schools and free meals. These major expenditures take up over 60 percent of the total spending in Seoul. After these, spending on roads and transportation, and parks and the environment represents the greatest share. In spite of the financial stability enjoyed by Seoul, the city also faces critical challenges. Increasing demand for social welfare, low birth rates, an ageing population, and income polarization are the dark side of the future financial environment in Seoul, as well as in Korea as a whole. To cope with these financial risks, the SMG continues to reform its fiscal structure through tax increases and reduction of spending as it focuses on fiscal efficiency and stability. 13.6.4 Development Planning 13.6.4.1 Seoul’s Urban Planning Structure With its explosive economic growth since the 1970s, demand for housing development soared in the private sector. Seoul needs to prevent sprawl and contain its housing development in an orderly fashion. The city established an institutional framework to manage new development or physical improvement of existing built-up areas. This framework is still effective. Brought into the legal system in 1981, the Urban Master Plan is comprehensive, proposing a 20-year vision and direction for development. To date, the SMG has developed and shaped the Urban Master Plan on four different occasions: in 1990, 1997, 2006 and 2014. The Urban Master Plan presents directionality for the plans and sub-plans on spatial and land use. In other words, it is the top plan and serves as a guideline for carrying out lowerlevel plans (e.g. the Urban Management Plan, plans by sector, major independent plans) in a consistent manner. It embraces a wide range of fields – society and the economy, environment and energy, transportation, infrastructure, and culture and welfare. Due to its significance the Master Plan requires input from residents, experts, administrators, etc. which can be incorporated into the planning stage.
363
Along with the Urban Master Plan, the Urban Management Plan is crucial for managing new and existing development. While the Urban Master Plan acts as a citywide guideline, the Urban Management Plan provides the basis for restricting urban development at the level of individual lots. It includes the Zoning Plan, the Special Regulating Areas, the Urban Facility Plan, the Detailed District Plan; as well as the Urban Development Projects Plan and the Urban Renewal Projects Plan (Figure 13.8). 13.6.4.2 Status of Urban Development Programmes Pursuant to the Urban Planning and Utilization Act, urban planning programmes are categorized into urban development projects and urban renewal projects. The former refers to programmes implemented to develop new residential complexes or new built-up areas; its basis is in the Urban Development Projects Plan. Currently, the SMG pursues seven urban development projects.
Figure 13.8 Plans to Guide Development in Seoul
Source: Authors.
The second of the two programmes, the Urban Renewal Projects Plan, aims to restore and renew the deteriorating urban functions in existing built-up areas; its basis is in the Urban and Residential Environment Renewal Act. Urban renewal projects can be further categorized into housing redevelopment that targets residential areas with a high concentration of aged and deteriorating buildings; and city centre redevelopment that focuses on restoration of urban functions and target areas where promotion of commercial activities is necessary. In Seoul, 434 renewal projects have been implemented so far, and more are scheduled to be carried out in 492 target areas.
364
13.6.4.2 Seoul’s Urban Planning: Limitations and Challenges Since 2010, low growth has been the general trend and has affected the urban structure. Impacts include lower demand for urban development and a decline in land and housing purchasing power. Socioeconomic polarization has also become more entrenched. City centre redevelopment and housing rearrangement programmes have thus far been land owner- and demolition-oriented. These programmes were viable because the market structure guaranteed ample development profits. In the latest low-growth trend, however, such methods are no longer profitable. What is more serious is that this trend may be prolonged and even take root in society. In the future, Seoul will be challenged to modify its urban planning system to suit this low-growth trend. For this, the city will need to: (i) pursue urban restoration, with a focus on people, not on physical improvement; (ii) revise the existing demolition-oriented development methods to meet the needs of local communities; (iii) engage the citizens and residents in the whole process, from planning to execution; and (iv) invest more resources in developing sustainable engines than pursuing short-term accomplishments. In fact, Seoul has developed comprehensive long-term urban restoration strategies and ensured consistency with the policies of the national government since 2014, working hand in hand with the local Gu districts and communities in building the necessary plans.
13.7 PARTNERSHIPS FOR SUSTAINABLE CITY DEVELOPMENT To achieve various ambitious goals of the SMG, the city needs to establish partnerships with the private sector. Seoul has partnered with business networks (both global and local) and public institutions. Some of the public–private partnerships have binding formal structures and rules for the participating entities. Informal partnerships are not without their own merit since they can be flexible in responding to changes. The types of partnerships are shown in Table 13.10. Seoul has 23 sister cities around the world, including San Francisco, Bogota, Beijing, Rome and Athens. However, Seoul lacks tangible developments from its international connections with cities abroad. To expand and strengthen these international partnerships, the SMG recently established a Global Urban Partnership Division at the Seoul City Hall. The division carries forward cooperative projects with various international organizations such as the Asian Network of Major Cities 21, the C40 Climate Leadership Group and the International Council for Local Environment Initiatives (ICLEI). In the age of a ‘new normal’, the SMG has focused on creating decent jobs for residents through public–private partnerships and has mobilized local business networks to create jobs and attract investment into communities around Seoul. Such efforts continue within the city. In every urban regeneration project in Seoul, the SMG collaborates with communities and local industry to sustain economic activities and promote new opportunities. Project success is measured on the basis of economic development as well as physical improvement.
365
Three examples of best practice are described in the case studies below, each of which demonstrates Seoul’s efforts to build a sustainable city: the Yonsei-ri Transit Mall Project; the Energy-Independent Villages; and the G-Valley Development. These case studies show how the urban environment and the economy can be transformed through public–private partnerships. We hope that Seoul’s experience offers valuable lessons to cities in the APEC region.
Internation al Council for Local Environme nt Initiatives (ICLEI)
Government
City
Asian Network of Major Cities 21
Citynet
Global business
Global business network
Local business
Local business network
C40 Climate Leadership Group
Public utilities Seoul Metropolita n Governmen t (SMG) cooperating with the Korea TradeInvestment Promotion Agency (KOTRA), embassies
Public institutions
Community
Urban regeneratio n
Dispute Resolution Committee
The Seoul Institute
Industry– university cooperation
EcoMileage Program
partnership Other
Source: Authors.
366
Technology
Social and environmental
Labour and skills
Research and innovation
Infrastructure and development
Governance
Economic
City
Table 13.10 Examples of Partnerships for Sustainable Development
13.7.1 Yonsei-ro Transit Mall Project The Yonsei-ro Transit Mall Project is an example of how carbon dioxide emissions can be reduced by encouraging the use of public transport, and how local communities in the city centre can be revitalized. Seoul developed the Seoul Comprehensive Plan for Transit Malls in 2012. The idea is to not only encourage public transport but also provide a pleasant pedestrian environment for residents. Vehicles are not allowed within a transit mall, with the exception of public transport (e.g. trams, light rail, buses). Yonsei-ro was selected for the pilot project in August 2012. Selection of Candidate Districts. In line with its policy of building an urban environment where people and public transport come first, Seoul began to review the introduction of the transit mall system in late 2011. The city worked with the Seoul Institute to establish the criteria for selecting candidates for the mall. Next, the city considered various elements such as land use, floating population, access to public transport, the number of public transport users, extension of target roads, road continuity, access to parking facilities, the presence of restricted access facilities, characteristics of the commercial district, and symbolic significance. Based on these assessments, the city finally selected Yonsei-ro. Minimizing Potential for Traffic Congestion Caused by the Transit Mall. Yonsei-ro was a congestion-prone zone. To identify the cause of the congestion, Seoul monitored licence plates and examined the characteristics of vehicles entering and exiting Yonseiro. To devise a solution, the city implemented a Car-Free Day in Yonsei-ro once or twice a year to analyze the effect of vehicle restrictions on detours in the vicinity. Based on this, the city identified a detour route that could alleviate the congestion, and it built an intersection in front of the underpass for Shinchon Train Station. Management of Conflict between Interested Parties. Because the transit mall restricts vehicle access, pedestrians may find access to the area inconvenient while vendors may experience a reduction in revenue. Yonsei-ro also experienced conflict between the SMG and other interested parties. The city, therefore, organized a programme committee and held public hearings. Seoul also made it a priority to be in constant communication with residents, and to talk to interested parties in the region to improve the traffic system and commerce. Table 13.11 lists some of the conflicts that occurred, and how they were resolved. The list illustrates how complex it is to resolve silo issues between public agencies and stakeholders within major inner city projects in Korea. In 2013, this project was selected as a successful example of conflict management by the city and by the central government in a joint evaluation. As the next step, a comprehensive project promotion committee was organized with six different institutions working together (Figure 13.9), and three subcommittees (Transportation, Design/Construction, and Public Relations).
367
Figure 13.9 Promotion Committee for the Yonsei-ro Transit Mall Project, Seoul
Source: Seoul Solution.
Table 13.11 Resolving Conflicts between Major Stakeholders of the Yonsei-Ro Transit Mall Project, Seoul Parties involved Residents and merchants
Conflicts
Resolution
- Reduced business due to controlled vehicle access - Congested nearby road networks due to detours - Demand for large public parking facilities
-
-
Hyundai Department Store
Seoul Metropolitan Police Agency
- Reduced revenues due to access control - Demand for a new intersection in front of Hyundai Department Store on Yanghwa-ro - Concerns of traffic congestion from the extra crosswalk in front of Yonsei University and a new intersection in front of Severance Hospital
368
-
-
80 percent of vehicles passing through cause congestion, but only a few enter the area The positive effects of the increase in the number of pedestrians for businesses in the area were explained, based on actual examples from home and abroad Ways to attract visitors explained (e.g. cultural events) Effective transportation plans (e.g. detour, new intersection) Traffic simulation results explained Extra parking capacity after investigating parking facilities in the Shinchon area Agreement signed with Hyundai Department Store and night-time discounts offered to merchants Potential issues from building a new intersection explained Allow left turns from Sogang Bridge to Donggyo-dong Intersection to secure an extra access route Work with Yonsei University to simplify and link the signals by removing the straight-ahead/left-turn signals for vehicles leaving Yonsei University
-
- The definition of the programme as prescribed by the Urban Traffic Readjustment Promotion Act - Moving of 40 power distribution units to be financed by the city
-
- Demand to stay in the current locations even after transit mall opens - Demand for a new intersection in front of Hyundai Department Store on Yanghwa-ro Source: Seoul Solution.
-
Korea Electric Power Corporation (KEPCO)
Street vendors
-
Propose a detector that prevents lines of tailgating cars entering the intersection at the red signal The merchant’s association can participate in a review of traffic safety facilities to understand necessity for the programme The transit mall as prescribed by the Urban Traffic Readjustment Promotion Act is related to the operation of the roads. The construction itself is controlled by the Road Act. Three legal advisors were employed to argue that the mall is not consistent with the KEPCO guidelines and the Road Act. Proposal to move to alternative locations A council formed, consisting of the Seodaemun-Gu district office, the merchant’s association and street vendors to develop a protocol that specifies the locations, numbers, sales methods, etc.
Pedestrians First. Passenger vehicles are not allowed in the Yonsei-ro Transit Mall. For pedestrian safety, other types of vehicles are required to travel at 30km/h or slower. Vehicles seating 16 or more, vehicles for emergency use, and bicycles are allowed. To prevent congestion, taxis are only allowed between midnight and 4 a.m. when other modes of public transport are not in operation. Any vehicles that are necessary for business must obtain approval in advance and can only travel between 10 a.m. and 11 a.m., and between 3 p.m. and 4 p.m. All other vehicles are prohibited from stopping or parking on the road. From 2 p.m. every Saturday to 10 p.m. on Sunday, all buses passing through Yonsei-ro take a detour to protect the pedestrians-only system in the transit mall. Hub for Life and Culture. From the beginning, the transit mall was discussed in the context of local, long-term development strategies. Due to vehicle access control, no through-roads were formed on either end of the intersection, and the space could be utilized to hold open theatres, festivals and oher events. There is space for spontaneous performances (without the need to go through the complicated administrative process). Such liberal use of space by the public helps create a culture unique to Shinchon and provides visitors with more to see and enjoy. Benefits. In the six months after the transit mall opened, traffic accidents decreased by 34 percent over the previous year. When surveyed, a majority of people said they felt much safer than when both people and vehicles used the roads. Many responded positively to questions on user convenience and improved appearance. Another survey on bus routes showed an increase in bus ridership of 11.1 percent between the first quarter of 2013 and the same period in 2014. This was due to the fact that congestion in Yonseiro had substantially improved, the timely bus service and the transition of the area into a transit mall. The mall also brought financial benefits. Compared with 2013, the number of visitors to the shops in Shinchon rose by 28.9 percent, the number of transactions that resulted in revenues increased by 10.6 percent and total revenues increased by 4.2 percent.
369
The first transit mall in Seoul has been rated a success. Plans are being reviewed to turn this area into a complete pedestrian-only zone in the future. Another candidate district is also being reviewed. The current transit mall on Yonsei-ro, however, is still in its infancy and lacks adequate amenities, trees and landscaping, and other necessary facilities. Moreover, there may be issues in the future that have not been revealed just yet. Before moving onto a second candidate, it would, therefore, be wise to review the problems of the first example and take necessary countermeasures. 13.7.2 Energy-Independent Villages Seoul’s energy consumption has been steadily on the rise, but the city’s power selfsufficiency rate is only 2.95 percent (as of 2011). When disaster hit the Fukushima nuclear plant in March 2011, public awareness of the dangers of nuclear energy became widespread, and people began to worry more about a sustainable future for the next generation. At a public forum in 2012, a year after the Fukushima disaster, a plan for an Energy-Independent Village was first officially proposed and later became one of the projects under the One Less Nuclear Plant policy that was announced by the SMG in May 2012. It was against this background that the project was launched in the latter half of 2012. The aim of Seoul’s plan to build energy-independent villages through private–public collaboration is to encourage the public to save energy, be efficient in energy use, and produce renewable energy at the local level. This will enhance the energy independence of local communities.
Photo 13.2 High Concentrations of Solar Power Panels Installed on Homes in Shipjaseong Village
Source: Guangdong-Gu District Office.
Implementation. The Energy-Independent Village programme is based on public bidding, with final candidate communities selected from applicants that submitted plans, and provided with financial assistance. The programme does not support multiple
370
candidates simultaneously but focuses its assistance on communities that show significant enthusiasm for the project. Support is continuous to help improve achievements. Interim reports determine adjustments to the subsidy. Assistance may be extended for up to three years according to annual performance, with subsidies used for energy consultations, energy saving, energy efficiency, and installation of renewable energy facilities. Designation of Energy-Independent Villages. As of 2014, 15 Energy-Independent Villages had been designated. Eight are detached housing communities, and seven are mostly multi-household housing. Figure 13.10 shows their locations. Six villages participated in the programme launching in 2012, with four joining in 2013, and five in 2014.
Figure 13.10 Energy-Independent Villages in Seoul
Source: Authors.
371
Energy-saving and Efficiency Initiatives. The Energy-Independent Village programme has led to the development of a number of energy-saving and efficiency initiatives by local communities. One is the Energy Saving Centre in Seongdaegol. At this Centre, the monthly energy consumption of participating households is displayed in bar graphs so participants can check their own usage and compare with others, helping them learn more about energy and motivating them to save energy. This system was shared and soon spread across the city. Some Gu districts such as Jongno and Seongbuk have selected this as one of their main initiatives. The energy efficiency initiatives launched by the EnergyIndependent Villages include energy diagnostics, insulation, window systems and building retrofit projects. In multi-household housing, lights in public areas were replaced with LED while detached housing communities chose to conduct energy diagnostics. Some of the other participating households focused on efficiency by stopping drafts, installing LED, and replacing window systems. Community Production of Energy. In urban areas, it is not easy to build energy production facilities due to the low number of home owner-residents, inadequate types of natural energy sources, insufficient energy reserves and lack of space. Nonetheless, the Energy-Independent Villages have endeavoured to provide the necessary facilities to produce energy. They have installed and expanded the use of solar power and miniature generators, and other such facilities. In areas with a high concentration of detached housing, 3kW solar power generators have been installed. One of these areas is Shipjaseong Village, where 60 percent of the participating households opted for solar power. In areas with multi-household housing, some have installed photovoltaic power generators on rooftops and share the produced energy, but generally, the residents chose to install small generators on their balconies. From 2014, the SMG began providing all-out assistance to distribute small photovoltaic power generators in collaboration with the Energy-Independent Villages programme. Results. As of 2013, total household power consumption of the city was 13,319,847 MWh, down by 81,595 MWh from 13,401.442 MWh in 2012, or about 0.6 percent of the power use in all of 2012. In 2013, power use by the Energy-Independent Villages was 15,004,063 kWh, down by 1,074,699 kWh from 16,078,762 kWh in 2012, or approximately 6.7 percent of the total consumption in 2012. As such, the villages saved at least 10 times the energy that other households did during the same period in 2013 (Figure 13.11). This is one of the most significant achievements of the programme.
372
Figure 13.11 Power Savings in 2013 and 2012, Seoul and the Energy-Independent Villages
Source: Authors.
Challenges. When the SMG announced the ‘Sustainable Energy City, Seoul’ (Environment Policy, Seoul City Climate Headquarters), the second phase of the One Less Nuclear Plant programme, in August 2014, it said its plan was to increase the number of Energy-Independent Villages to 200 by 2018. However, it is important to note that voluntary participation is crucial, and the programme cannot be implemented over a short period. It is crucial to work with the residents to make the villages sustainable. The city plans to make necessary adjustments to the programme and organize a network that involves residents, activists and administrative organizations. By doing so, the city will be able to offer training on saving energy or other learning opportunities, enhance the efficiency of energy use, and install renewable energy generators. The villages will be encouraged to continue their efforts based on the firm platform created by the city, which will increasingly advance the energy economies of local communities. Continued collaboration between residents, the city and the relevant systems will help them work together to find the best solutions to local energy issues and improve energy selfsufficiency. 13.7.4 G-Valley Development Innovation can be also found in the economic development of Seoul. There is a key industrial hotspot at the southwest end of Seoul, between Guro-gu and Geumcheon-gu. It is a manufacturing centre, as seen in Figure 13.12. The hotspot embraces Seoul Digital Industrial Complex, which is one of three industrial complexes in Seoul, and one that has been dramatically transformed from one of the oldest industrial complexes in Korea (let alone in Seoul) into a unique high-tech industrial district.
373
Figure 13.12 Establishments in the Manufacturing Industry by Neighbourhood (Dong), Seoul, 2011
Source: Seoul Institute e-Cluster.
The previous name for the Seoul Digital Industrial Complex was Guro Industrial Complex (G-Valley), named after the Guro neighbourhood, the original name of the place in which it is located. The complex began with eight sewing and textile companies in the late 1960s. Until the late 1970s, textiles dominated the industrial structure of the region, with electronics becoming the leading industry in the 1980s. In the 1990s, Guro Industrial Complex, due to the availability of cheaper land and labour at other industrial complexes (both in and outside Korea), lost its competitive edge and the region suffered a steep industrial decline. The Asian financial crisis of 1997 was a real disaster for the complex, but also motivated local businesses to get together and for change. When new IT businesses opened in the Guro area, they were given tax breaks and other forms of financial assistance. The SMG also provided educational opportunities for these new start-ups, and it facilitated connections to academia, where advanced, unrealized technologies could be sourced. In essence, the development of the Guro area was initiated by the private sector, but the role of the public sector was not insignificant in terms of financial and technical assistance. In the early 2000s, the complex was renamed the Seoul Digital Industrial Complex and successfully transformed into an IT and high-tech centre. Figure 13.13 shows that the number of businesses increased more than tenfold, and total workers more than fivefold in the 2000s. In 2013, more than 160,000 employees worked for about 12,000 companies at the complex, in businesses ranging from manufacturing to services. Now Seoul Digital
374
Industrial Complex is the most densely packed and most diverse industrial complex in Korea, and a state-of-the-art technology centre.
Figure 13.13 Trends in Establishments and Workers at the Seoul Digital Industrial Complex
Source: Korea Industrial Complex Corporation (KICOX).
Many factors have influenced the evolution of the complex, for better or for worse. Researchers agree that the successful transformation of the complex resulted from passing through the windows of opportunity at the right time. When the IT industry became the new engine of growth in the 2000s, it required an enormous amount of new industrial space in a short period. The complex was able to convert its old factory buildings into apartment-type factories in good time, becoming a new model for high-density, compact industrial space. It was ultimately able to provide sufficient space for the fast-growing IT companies in the city. From 1997 to 2000, apartment-type factories in the complex increased from 4 to more than 100 buildings. Now the vast majority of companies at the complex are located in these apartment-type factories. Recently, tenants at the Seoul Digital Industrial Complex have given the complex a new nickname, ‘G-Valley’, after Silicon Valley, and have since enthusiastically promoted a new governance structure of academia, industry and government. Certainly, it is a hard task now to envision the image of G-Valley in the future, but it is safe to say that the relentless evolution of the Seoul Digital Industrial Complex is well underway.
375
13.8 CONCLUSIONS Through the last half of the twentieth century, the Korean economy went through a remarkable transformation amid a rapidly increasing population. To people outside Korea, it is known as the ‘Miracle on the Han River’. Seoul was the centre of this sensational development. With housing booms and high-rise apartments, increased car ownership and growing manufacturing companies in the city, Seoul had to keep up with the demand for better infrastructure and more energy, which it was more or less successful in doing through building and managing key strategic infrastructure. Seoul now has an extensive roadway network of 8,173km, along with inner and outer ring highways, that facilitates the movement of 3 million vehicles. The city is very much oriented toward public transit as well, with 9 rail lines and 7,500 buses in operation every day since the first subway line opened in 1974. Commitment to education has resulted in approximately 40 universities making the city their home. Electricity is provided through a stable network. To handle increasing development pressure, the SMG regulates land use through its planning authority. The Urban Master Plan and Urban Management Plan have been important planning tools and are still critical. In the process of developing a growing city, there have been unintended consequences of drastic changes. The building of roadways accommodated the growing transportation demand but attracted more car ownership rather than encouraging the use of public transit. Thermal power plants emit greenhouse gases. Although physical improvement is visible in the city, environmental issues have become problems. Moreover, social and economic polarization has increased in the city, and this is becoming more apparent with the spread of neo-liberalism across the world, including Korea. In a nutshell, Seoul has been successful in addressing and managing urban development. At the same time, it continues to take on the challenges posed by transport, environmental and social problems. Today, sustainability is the definite underlying principle of any urban policy or programme in Seoul. The SMG is making every effort to convert urban policy and programmes into useful tools to handle growth in a sustainable way. The One Less Nuclear Plant programme, the bus system reforms in 2004, its Smart City Initiatives, and the Seoul Creative Governance vision are all innovative urban policies to promote this sustainable development. The SMG realizes that sustainability can be achieved when old problems from the growth orientation of the past are acknowledged and tackled. Public–private partnerships in various forms are also important parts of this sustainable development. These partnerships range from cooperation with international entities and global business networks to partnering with communities in urban regeneration projects. The case studies in this chapter provide more detailed examples of partnerships for sustainable development. We believe there are lessons to be learned from Seoul’s experience, and good practices can be adapted and applied to cities in the APEC region. The lessons are perhaps especially relevant to cities presented with new economic opportunities such as Manila, Bandung and Lima. When there are prospects for economic growth, it may be easy to overlook some aspects of sustainability, as a city government gives higher priority to economic growth and decides to take care of sustainability later. The experience in Seoul
376
indicates that the public sector must continue its policy efforts to focus on sustainability while handling economic growth. Cooperation and constant communication with communities are also critical to translate sustainable development into practice. As seen in the case studies, it is important to be as inclusive as possible in identifying interested parties. Most importantly, interest groups should include members of communities. Their cooperation and understanding are critical to the success of any project. Seoul, the capital of an ‘Asian Tiger’, is evolving from a growth magnet of the world into a centre of sustainable development actions. Seoul has thus far been successful in altering its course to cope with its increasing social and environmental challenges. While it is difficult to predict the outcome, it is hoped that current sustainable development efforts will benefit residents for years to come.
377
14. Taipei Metropolitan Area, Chinese Taipei Wei-Bin Chen and Brian H. Roberts
14.1 INTRODUCTION This chapter explores the development of the Taipei Metropolitan Area or Greater Taipei Region of Chinese Taipei, which includes Old Taipei and New Taipei City (Figure 14.1). The chapter profiles the region’s economic, urban development, social, environmental and governance environments. It discusses the development challenges facing the metropolitan region, and describes best practices in partnerships for sustainable city development.
Photo 14.1 Taipei: A Metropolitan River City
Credit: Min-Ming Chen.
The Taipei Metropolitan Area, has been shaped strongly by the topography of the Taipei Basin formed by the Xindian River to the south and the Tamsui River in the west (Photo 14.1). Taoyuan to the west is separated by hills and river valleys from Keelung to the east. These are separate geographic regions, but their economies and transport systems are linked closely with that of the Taipei Metropolitan Area. Keelung City, a major port, is connected by road and rail through a narrow valley to the two cities. Taoyuan is becoming an emerging industrial centre with a growing urban spillover population from New Taipei. Taipei serves as the core city of the metropolitan area; it is the location of the central government and major commercial districts. Metropolitan Taipei has become one of Asia’s fastest-growing cities, with a dynamic economy and vibrant urban life. It has one
378
of the tallest buildings in Asia, the Taipei 101 tower. It also has the second highest GDP per capita in Asia after Japan.
Figure 14.1 Taipei Metropolitan Region
Source: Modified from Google Map.
Like most cities in the APEC region, the Taipei Metropolitan Area is experiencing significant urban development pressures. Land for development is at a premium, with the natural topography placing constraints on urban development. Urban population density is over 15,200 persons per square kilometre, making it one of the most densely populated cities in the region. New Taipei developed as an extension to the old city, but as mentioned previously, it has begun to spill over into Taoyuan. The metropolitan area faces the challenge of protecting agriculture and environmentally sensitive areas from development and establishing a governance system for improved metropolitan management. 14.1.1
Classification of Cities in Chinese Taipei
The government has developed a system for classifying urban settlements.673 Metropolitan areas are defined as economically and socially integrated areas comprising one or more core cities with a population of over 300,000.674 A core city in a metropolitan area must have: (i) a population of more than 200,000; (ii) more than 70 percent of its residents living in the urbanized area; and (iii) more than 70 percent of the employed
379
residents working within the city. There are seven metropolitan areas in total: Taipei, Kaohsiung, Taichung, Taoyuan, Tainan, Hsinchu and Chiayi. A satellite city is defined as a smaller city within the same region of the core city. Satellite cities must have more than 10 percent of the employed residents commuting to the core city and more than 40 percent of the residents living within the same urbanized area as the core city. The Taipei Metropolitan Area comprises the core city of Taipei and several satellite cities, including New Taipei. 14.1.2
Population
The population of the Taipei Metropolitan Area grew 12.3 percent between 1995 and 2014, from 5.9 million to 6.7 million (Figure 14.2). Over the period, average population growth rate in Taipei City was 2.6 percent (2.6 million to 2.7 million) and in New Taipei City 20 percent (3.3 million to 4 million).675 These population statistics excluded students, military persons, and new immigrants who lived in the city but were not registered as residents. The daytime population in Taipei City is more than 4 million, with more than 1.3 million commuters travelling from surrounding cities such as New Taipei City, Taoyuan City and Keelung City. Since the mass rapid transit (MRT) system opened its first line in 1996, many people have chosen to live in New Taipei City, where housing is more affordable, rather than Taipei City.
Figure 14.2 Population Trends, Taipei Metropolitan Area, 1995–2014 8,000,000 7,000,000 6,000,000 5,000,000 Taipei
4,000,000 3,000,000
New Taipei
2,000,000
Great Taipei
1,000,000
1995 1996 1997 1998 1999 2000 2001 2002 2003 2004 2005 2006 2007 2008 2009 2010 2011 2012 2013 2014
0
Sources: Department of Budget, Accounting and Statistics, Taipei City Government Online Statistics Abstract.
14.1.3
Challenges of Regional Urbanization
The effect of rapid urbanization and development since the 1960s has led to Old Taipei – once a compact, densely populated city – spilling over into Taipei County. In 2010, the
380
county’s population overtook that of Taipei, and it was decided that the county should be upgraded to city status. As the Taipei Metropolitan Area has spread, urban densities have fallen; and the need to extend public transport, infrastructure, housing and urban services has become more pressing. Central and local governments have found it a challenge to plan, develop and finance these demands. Urban development in Taipei has been prolific, but it has come at a cost to the region’s environment and now its social systems.
14.2 THE ECONOMY Taipei City and New Taipei City are the two largest cities for business and industry.Table 14.1shows key facts on the two cities and the metropolitan area. The two cities form Chinese Taipei’s principal gateways for the economy’s trade and development. Over 32 percent of domestic economic activity occurs in these two cities. The headquarters of more than 41 percent of the top 1,000 local businesses, by value, in Chinese Taipei are located in Taipei City and New Taipei City.676 Nearly 31 percent of small- and mediumsized industries also are located in these two cities.677 The impact of the 1997 Asian financial crisis on the economy was much less severe compared to economies in Southeast Asia. Its economy has expanded by around 5 percent annually over the past decade, with low unemployment and inflation rates. The estimated 2007 nominal GDP of Taipei City was USD 160 billion while that of the metropolitan region was around USD 260 billion. It is 26th among the world’s strongest city economies by GDP in 2007. The GDP per capita of Taipei Metropolitan Area in 2011 was USD 48,400, the third highest in Asia, behind Tokyo and Seoul.678 The Brookings Institution estimated GDP in 2014 at USD 327,295 million at PPP, making it the 29th largest urban economy in the world. GDP per capita (PPP) was estimated at USD 46,102.679
381
Table 14.1 Key Economic Facts – Taipei Metropolitan Area Taipei City
New Taipei City
Taipei Metropolitan Area
Value of the economy (2012), million USD
83,170
84,010
167,180
Residential population (2014/12)
2,702,315
3,966,818
6,669,133
Employment (2014/12)
1,262,000
1,927,000
3,189,000
Unemployment rate (2014/12)
4.00%
3.90%
3.94%
Number of businesses (2014)
215,882
206,626
422,508
Key export sectors
Wholesale and retail trade, transportation and storage, information and communication, finance and insurance activities, scientific and technical, support services activities
Manufacturing, construction, transportation and storage, information and communication, professional, scientific and technical
Source: Ministry of Interior, Department of Statistics, Statistical Yearbook 2013; ADB (Asian Development Bank), Asia Regional Integration Centre online database 2015.
14.2.1 Economic Output Table 14.2 shows a breakdown of the Taipei Metropolitan Area’s economic output for 2014. Business and finance is the largest industry sector. The sector has been growing very rapidly, as the economy has transformed from manufacturing to services over the past two decades. Taipei’s main industries include urban light industries, urban services, high-tech industries and technology-intensive industries. From the perspective of enterprise capitalization, most are small- and medium-sized. Taipei City’s economy is reliant on small- and medium-sized industries and is commerce, finance and service industry-based. In response to a world shaped by fast-paced globalization and competition among the regional economies, city governments in the Taipei Metropolitan Area have worked hard to improve the business environment, and to enhance the region’s competitiveness.
382
Table 14.2 Output by Industry, Taipei Metropolitan Area, 2014 Industry sector
Percentage 31.3
Business/finance Trade and tourism
21
Manufacturing
20 19.3
Local/non-market Transportation
3.6
Utilities
2.5
Construction
2.2
Commodities
0.1 100.0
Total
Source: Brookings Education, Global Metro Monitor, Taipei (2015).
14.2.2 City Competitiveness The Economist Intelligence Unit’s Hot Spots index ranks Taipei at equal 37th among 120 of the world’s largest cities in 2012 (Table 14.3). Its ‘economic strength’ category are comparable to Shanghai and Beijing, but below that of Seoul. Taipei City’s scores in ‘economic strength’, ‘physical capital’, ‘institutional effectiveness’ and ‘human capital’ are above the global and regional mean. However, on ‘social and cultural character’ and ‘environmental and natural hazards’, it scores below the global mean and around the regional mean. The Hot Spots index is a relatively good indicator of the city’s competitiveness and identifies factors that the city needs to concentrate on to enhance its competitiveness position.
Physical capital
Financial maturity
Institutional effectiveness
Human capital
Environment al and natural hazards
Global appeal
Overall
New York
54
92
100
85.8
95
76.5
66.7
35.7
71.4
1
Singapore
46
100
100
87.8
77.5
69.8
87.5
43.2
70
3 37
Social and cultural character
Economic strength
Table 14.3 Economic Competitiveness of Taipei
Taipei
41.9
90.2
50
77.5
61.7
66.1
58.3
24.8
56.6
Global
35.9
77.3
50
63.3
63.8
63.7
66.7
9
49.1
Category weight
30.00%
10.00%
10.00%
15.00%
5.00%
15.00%
5.00%
10.00%
100%
Source: Based on data from Economist Intelligence Unit, Hot Spots – Benchmarking Global City Competitiveness (London: Economist, 2012).
383
New Taipei City is a major city for business services and manufacturing activities, second only to Taipei City. It has over 250,000 privately owned companies and 20,000 factories, with a total capitalization of NTD 1.8 trillion (USD 56 billion). The high technology industry alone generates an annual revenue of NTD 4 trillion (USD 124 billion). High technology, services and tourism are some of the major industries in New Taipei City, attracting a large volume of workers with their abundant employment opportunities. As a result, 70 percent of the population of New Taipei City are from places outside the city.
Photo 14.2 Taipei 101 Tower
Credit: Min-Ming Chen.
14.2.3 Unemployment Unemployment occurs when people are without work and actively seeking work and it is an indicator of a city’s economic condition. In Taipei City and New Taipei City from 1995 to 2014, unemployment rates have been under 6 percent. In 1995, the unemployment rate stood at 2 percent. It grew to a peak of 5.2 percent in 2010, but has declined to below 4 percent since (Table 14.4).
384
Table 14.4 Unemployment Rate in the Taipei Metropolitan Area, 1995–2014 Year
Taipei City
New Taipei City
Taipei Metropolitan Area
(%)
(%)
(%)
1995
2.1
1.9
1.99
2000
2.7
3
2.87
2005
3.9
4.1
4.02
2010
5.2
5.2
5.20
2014
4
3.9
3.94
Source: Taipei City Online Statistics Abstract; New Taipei City Online Statistics Abstract.
14.2.4 Household Income Given the intermittence of official GDP data for local cities, household income is a good indicator of economic conditions in the Taipei Metropolitan Area. Average annual household income in Taipei City in 2013 was USD 49,852; in New Taipei, it was USD 38,390. The higher household income in Taipei City reflects the greater competitiveness of its industries. However, neither city showed significant growth in household income in the past decade or so. Household income of Taipei City changed only 2.65 percent between 2001 and 2013; while in New Taipei City, it increased just 4.2 percent (Table 14.5). Household income for the Taipei Metropolitan Area increased 2.73 percent over the period. The slow growth seen in household income over the last decade is an issue for Chinese Taipei generally.
Table 14.5 Trends in Average Annual Household Income for the Taipei Metropolitan Area, 2001–2013 Taipei City
New Taipei City
Taipei Metropolitan Area
(USD)
(USD)
(USD)
2001
48,565
36,842
41,929
2005
48,841
38,628
42,947
2010
50,461
36,564
42,253
2013
49,852
38,390
43,074
Source: Taipei City Online Statistics Abstract; New Taipei City Online Statistics Abstract.
385
14.2.5 Key Industry Growth Sectors The Taipei Metropolitan Area is a magnet for resources and capital domestically and internationally. It is the primary population centre and employment hub, as indicated by the employment location quotient (LQ) data for industry sectors shown in Table 14.6. (LQ is a measure of industry, employment or economic activity concentration in a region compared to a larger geographic area such as the state or nation.)
Table 14.6 Employment Location Quotient (LQ) for Industry Sectors, Taipei Metropolitan Area Sector
New Taipei
Taipei City
Manufacturing
1.496
0.326
Construction
1.25
0.605
Wholesale and retail trade
0.952
1.071
Transportation and storage
1.331
1.093
Information communications
1.07
2.708
0.813
2.537
0.982
1.466
1.035
2.097
0.879
1.077
0.85
1.626
Education
0.754
1.817
Human health and social work activities
0.597
1.391
Finance activities
and
and
insurance
Real estate Professional, scientific technical activities
and
Support services Public administration defence
and
Source: Taipei City Online Statistics Abstract; New Taipei City Online Statistics Abstract.
Taipei City is the key business centre of Chinese Taipei. It has high employment LQs for finance and insurance activities, information and communications, and professional, scientific and technical activities. Professional services, real estate, education, support services, public administration and defence, compulsory social security, and human health and social work activities are also significant. The low LQ figures for manufacturing and construction reflect the shift of investment in housing and new industries into New Taipei. Taipei City is experiencing some level of de-industrialization
386
as the city’s economy becomes more service-industry orientated, while New Taipei has seen significant industrial expansion as a result of increasing connectivity to Taipei city. New Taipei has become the manufacturing centre of the Taipei Metropolitan Area. The relatively higher LQs for transportation and storage and for construction reflect the development of new housing and industries in the city. In the rural areas surrounding New Taipei City, the residential construction sector is important. Some small- and mediumsized technology and R&D-based industries are emerging; but by and large, these are commuter areas. Figure 14.3 shows the number of businesses by industry sector for the Taipei Metropolitan Area. The largest sector is wholesale and retail trade, with more than 200,000 registered businesses. However, the LQ for this sector is around the national average. This is partly because there tends to be a more equitable distribution of employment and investment in the cities of Chinese Taipei, compared to economies such as the Philippines and Indonesia. There are also more than 40,000 manufacturing companies in the region, most of which are in New Taipei City, in several important industrial parks. Accommodation and food services are also important, with more than 32,000 companies. Some of these are very important in supporting international business.
Figure 14.3 Distribution of Industries, Taipei Metropolitan Area
Total Industry Distribution
8,486 20,654 12,580
17,387
40,936 1,492 31,263
14,947 10,726
Agriculture, Forestry, Fishing & Animal Husbandry
Mining and Quarrying
Manufacturing
Electricity and Gas Supply
Water Supply and Remediation Activities
Construction
Wholesale and Retail Trade
Transportation and Storage
Accommodation and Food Services Activities
Information and Communication
Finance and Insurance Activities
Real Estate Activities
Professional, Scientific and Technical Activities
Support Services Activities
Public Administration and Defence; Compulsory Social Security
Education
Human Health and Social Work Activities
Arts, Entertainment and Recreation
Other Services Activities
Activies Not Adequately Defined
32,402 11,773
210,828
Sources: Taipei City Online Statistics Abstract; New Taipei City Online Statistics Abstract.
387
14.2.6 Labour Market Table 14.7 shows employment in the primary, secondary and tertiary sectors in the Taipei Metropolitan Area. The tertiary sector is the major labour market, contributing to 71 percent of total employment in the Taipei Metropolitan Area. In New Taipei City, the tertiary sector workforce is 64 percent, while in Taipei City it is 81 percent. Only 0.4 percent of the workforce in the Taipei Metropolitan Area is engaged in the primary sector (agriculture, fishing, forestry).
Table 14.7 Employment by Sector, Taipei Metropolitan Area Sector1
New Taipei City
Taipei City
Taipei Metropolitan Area
Primary industries
12,000 (0.6%)
2,000 (0.2%)
14,000 (0.4%)
Secondary industries
684,000 (35%)
238,000 (19%)
922,000 (29%)
Tertiary industries
1,232,000 (64%)
1,023,000 (81%)
2,255,000 (71%)
Total
1,928,000
1,263,000
3,191,000
Note 1: Based on the international Standard Industrial Classification (SIC) system. Source: Taipei City Online Statistics Abstract; New Taipei City Online Statistics Abstract.
14.2.7 Innovation, Creativity and Entrepreneurship Chinese Taipei is facing the challenge of sustaining its competitive advantage: localized transaction cost of production is rising due to ageing technologies; logistical issues are slowing down the efficiency of supply chains; construction costs are rising; and largescale manufacturing operations can no longer rely on cheap wages. To regain their competitive position, companies must become more innovative, and place greater focus on knowledge-based industries.680 They would have to develop new areas of production where innovative design is the core element, whether in reducing costs or creating new markets. To achieve this, international collaborations would be key, and the R&D culture in Chinese Taipei would have to adapt accordingly. The implications for the Taipei Metropolitan Area are clear. The future of its manufacturing industry would hinge on developing a culture of collaborative relationships between business and research institutions from different cities and economies. Such collaborations would be vital to strengthening creativity and design capabilities, and to promoting the adoption of effective business management methods. Better English language skills would be needed, since that is the primary language for commerce, publishing, and the sharing research and development ideas, data and information, especially over the Internet.
388
Greater emphasis would also need to be given to the cultural and creative industries, which encompass the development and inclusion of greater local and international culture, art, philosophies and traditions into the creation of a ‘smart region’. These are priorities for the central and city governments, but it takes time and broad consensus to make changes. Nevertheless, the region must continue to look at ways to support endogenous growth through its creative industries if it is to build competitive service industry sectors and create a more sustainable basis for employment growth. Given the ageing population, the region will also need to promote the development of robotics as a way of filling the skills and technology gaps it will need to ensure continued prosperity and rising wages and boost domestic consumption. 14.2.7.1 Developing Social and Cultural Capital Some important initiatives have been implemented in the Taipei Metropolitan Area to enhance social and cultural capital and a more creative society. Two cultural and creative parks have been developed in Taipei City by the city government and private foundations: the Songshan Cultural and Creative Park, and the Huashan 1914 Creative Park. Both were originally industrial factories. The Songshan Cultural and Creative Park was once the Songshan Tobacco Plant; it was designated a historic site by the Taipei City government in 2001. In 2011, the park was refurbished as a venue for diversified cultural and creative exhibitions and to restore its usefulness to the public. The park is now a premier site for the cultural and creative industries in Taipei City to display their achievements. The Huashan 1914 Creative Park had its origins in 1914, and housed one of the island’s largest wine producers throughout the 1920s. The site was abandoned many years ago, but in 2007 the Taiwan Cultural-Creative Development Co. Ltd assumed responsibility for the renovation and operation of the park681. It now serves as Taipei’s primary creative arts centre and hosts the most significant cultural activities. New Taipei City has also been exploring and supporting ways to establish creative businesses. One example is Liuli Gongfang, a glassware workshop established in 1987.682 The company started in small workshop located in Tamsui, New Taipei City with seven employees. They had to develop their production technology from scratch. Liuli Gongfang gradually introduced new production systems based on methods developed by its employees. It currently has more than 800 employees. The company has exhibited its products in Japan, the USA, the UK, Italy, Germany and South Africa. Several arts pieces have been acquired by leading international museums. The company has succeeded in building its own distinctive brand and continues to play a leading role in the development of modern Chinese glassware-making. The three initiatives described above are examples of successful partnerships to advance industry innovation and cultural development. All three are directly or indirectly supported by city governments, but the facilities are operated privately with minimal government support. However, there is a need for more efforts to reach out to international partnerships to foster cultural exchange, innovation and creativity.
389
14.3 STRATEGIC INFRASTRUCTURE AND ASSETS 14.3.1 Transport Infrastructure Transport is the key strategic infrastructure for the sustainability and prosperity of the Taipei Metropolitan Area. Two important transport infrastructure projects in the region which have been essential to maintaining the efficiency of the transport system and bolstering the economy and wellbeing are the MRT system and the Port of Taipei. The region’s highways, rail and public bike systems have also been vital to inner city transportation and connecting the core city with surrounding satellite cities. 14.3.1.1 Mass Rapid Transit (MRT) The Taipei Metropolitan Area is served by an MRT system, Chinese Taipei’s first. The system was planned in the early 1990s, and began operations in 1996. The respective Departments of Rapid Transit Systems of the Taipei City government and the New Taipei City government are responsible for building it; while the Taipei Rapid Transit Corporation is responsible for operating it. It covers 131.1km, and has 117 stations and 5 main routes. In 2015, the system carried an average of over 2 million passengers per day.683 Conversions have been made to existing railway lines to integrate them into the system, and more than 12 lines are still under construction and planning, including the Xinzhuang Line extension and the Circular Line. The Taoyuan Airport MRT has become operational as of March 2017, which further integrates the transport network of the Taipei Metropolitan Area. The Taipei MRT system not only connects the cities of Taipei and New Taipei, it also serves the important function of providing improved connectivity to the international airport. By increasing the transportation options available to those commuting into and out of the city, it has helped ease traffic congestion. The greater ease of travel afforded by the system has also provided the impetus for urban renewal. Tourist traffic to outlying towns such as Tamsui has also increased.
390
Figure 14.4 Taipei Mass Rapid Transit (MRT) System, 2017
Source: Metro Taipei Mass Rapid Transit, Taipei Rapid Transit Corporation, Taipei City (2017)
14.3.1.2 Port of Taipei The Port of Taipei, or Taipei Harbour, is Chinese Taipei’s largest international port. Located in New Taipei City, it covers an area of 3,102 hectares. Work on the port began in 1993, and two terminals were completed in 2009. In 2011, a third terminal became operational. The port handled 1.26 million TEUs in 2014 and focuses on trans-oceanic shipping and international logistics services for the north of the island. Besides the port extension project, the Taipei Harbour Special District Project684 is also underway to make the Port of Taipei an international commercial harbour. The plan is to develop the surrounding area into a recreational, transportation and entertainment complex. 14.3.1.3 Public Bicycle Sharing System YouBike685 is a public bicycle sharing service offered by the Taipei City Department of Transportation. It was implemented through a build-operate-transfer collaboration with local manufacturer, Giant Bicycles. YouBike changes the behaviour of commuters in the metropolitan area, as it brings the green transportation concept into their lives. In 2009, 500 bicycles were available at 11 rental stations. The system now offers over 190 stations throughout Taipei City, New Taipei City, Taichung City and Changhua County, with over 6,000 bikes available for rent. The system is increasingly well received by the populace. Over 1.9 million people use it. In 2014, the system saw 22 million
391
rentals, twice that of the previous year. Figure 14.5 shows the extent of the Bikeway Parkway, which is undergoing further development.
Figure 14.5 Taipei Riverside Bike Parkway Map
Source: Taipei City Government, ‘Activation of the Tamsui River’, Taipei Yearbook 2012 (Taipei: Taipei City Government, 2012).
14.3.1.4 Highways Three major highways cross the Taipei Metropolitan Area: Freeway Nos. 1, 3 and 5. Freeway No. 1, also known as Sun Yat-sen, is the first highway in Chinese Taipei. This 372.9km highway begins in Keelung and ends in Kaohsiung. Freeway No. 3, also known as the Formosa Freeway, connects Keelung City to Linbian, Pingtung. It is 430.5km long, with 55 interchanges, 13 junctions, 11 toll stations and 7 service areas. Freeway No. 5 begins in Taipei City and ends in Su-ao, Yilan. 14.3.1.5 Railway System There are two railway systems in the metropolitan area: a conventional railway system and a high-speed one. Most of the main lines in the conventional system are fully electrified and service is generally efficient and reliable. In 2011, it carried 563,915 passengers per day. The other system, the Taiwan High-Speed Rail, runs approximately 339km along the west coast, from Taipei to the southern city of Kaohsiung. The line, which opened for service
392
on 5 January 2007, reaches almost 90 percent of Chinese Taipei’s population. With trains running at a top speed of 300km/h, the journey from Taipei to Zuoying could be completed in as little as 96 minutes. Ridership has fallen short of forecasts but over 129,000 passengers per day were using the system in 2013. While the system has experienced significant financial difficulties, it is an essential piece of infrastructure that enables the whole island to be travelled in one day. It also expands the influence of the Taipei Metropolitan Area to other regions of the island. 14.3.7 Universities The Taipei Metropolitan Area has the highest density of universities in Chinese Taipei. There are 46 universities in all. Taipei City has 25 universities, comprising 13 public universities and 12 private ones, including the National Taiwan University. New Taipei City has 3 public universities and 18 private ones. These universities play an important role in the city’s human capital development and creativity. Local public universities receive substantial funding from the central government and usually provide better quality education than private universities. 14.3.8 Public Utilities Public utilities take several different forms in the Taipei Metropolitan Area. Responsibility for construction management and maintenance ranges from local community-based groups to government monopolies. Taipei City and New Taipei City have cooperated to build most of the public utilities in the region, the first partnership between the two cities. This cooperation has been important in providing for the longterm planning and maintenance of the utility services. 14.3.8.1 Water Supply and Wastewater Treatment Facilities There are two well-developed partnerships for water supply and wastewater treatment. Both facilities are physically located in New Taipei City, but administered by the Taipei City government:
Feitsui Reservoir686. This concrete dam sited on the Beishi River in Shiding District in northern part of the island provides around 50 percent of the metropolitan regions water. The dam and catchment is managed by the Taipei Feitsui Reservoir Administration, under the Taipei City government. The Reservoir has a water storage capacity of 460 million cubic metres and an active capacity of 335.5 million cubic metres. The principal purpose of the reservoir is for water supply, with flood control and hydropower generation as secondary purposes. The main purchasers of water are the Taipei Water Department and the Taiwan Water Corporation. The Bali Wastewater Treatment Plant687. The plant was built in 1984, and is located in Bali District, New Taipei City. It is the biggest wastewater treatment plant and is managed by the Taipei City government. The capacity of the wastewater treatment plant is 3.3 million cubic metres. It services Taipei City, New Taipei City, and Keelung City.
393
14.3.8.2 Power Plants Some may argue that nuclear is not a sustainable development option, but for an economy heavily reliant on energy imports, the two nuclear power plants in New Taipei City help to significantly reduce emissions levels. New Taipei City also has a hydropower plant. The Jinshan Nuclear Power Plant is located in Shimen District, with a capacity of 1,208 MW. The Kuosheng Nuclear Power Plant is located in Wanli District and generates 1,896 MW. The Gueishan Hydro Power Plant is located in Wulai, sith a capacity of 111 MW. These three power plants provide stable electricity service. Since Taipei City has little rural land available for the development of utilities, it is highly reliant on New Taipei City for many of its utility services. It has therefore been important that the partnerships between the two cities and private service providers and managers have worked well. Without good levels of cooperation, there would have been risks to the quality of services provided to Taipei City, which would have had direct impacts on the performance and competitiveness of the Taipei Metropolitan Area as a whole.
14.4 PLANNING, ENVIRONMENTAL AND URBAN GOVERNANCE SYSTEMS The early planning and governance systems of Chinese Taipei were shaped by the Japanese imperial system of government. After 1949, the island adopted a more western system of planning and governance to support the modernization of the economy. By the early 1990s, the Taipei Metropolitan Area was one of the most heavily built-up industrial cities in East Asia.688 However, this period of development was one in which an enormous gap developed between planning and implementation. The issues related to urban planning, development and governance of Chinese Taipei and the cities of the Taipei Metropolitan Area over the past half century have been extensively documented.689,690 Environmental and economic structural changes from a manufacturing to a more service driven economy have also proved challenging. The speed of industrialization and urbanization left central and local governments ill-equipped to regulate and control much of the growth.691 The city developed severe shortages of infrastructure; there was unplanned urban sprawl; open spaces and parkland were taken over by new industries; and serious environmental and congestion problems began to arise.692 Community disquiet in the late 1980s over the state of the environment, the loss of amenities and the need for democratic reforms led to significant changes and the modernization of the urban planning, governance and development systems. A more engaging and inclusive planning system was progressively introduced, one focused on what was required to promote sustainable economic growth, and a more liveable city.693 During the late 1990s, urban neighbourhoods underwent spectacular modernization and transformation,694 and programmes to improve the state of the urban environment and transportation systems began.
394
Intergovernmental relationships are important, as the central government controls most of the resources; and since 2000, centralization of control over resources has increased, which has affected the levels of autonomy and control cities and regions have over development.695, 696 Such governance problems gain greater importance when weighed against the new demands on cities. Post-industrial cities face qualitative issues centred on urban restructuring and competition, democracy in urban governance, and the new urbanism of community empowerment, environmental sustainability and cultural conservation. In response to these new institutional requirements, it has been suggested by Bristow that Chinese Taipei’s administrators ‘need to take a more holistic planning approach that emphasizes the necessity of strategic planning and urban restructuring and development and integrates the process towards new goals of environmental sustainability, economic competitiveness and social equity’.697 Building a partnership network for future metropolitan governance is important to the sustainability of Taipei’s development. There is need for improved integration among the governments that make up the Taipei Metropolitan Area. Better vertical integration is needed in passing policy from the central government to the local government, especially when there are party political differences. Also, within Taipei City alone, there are 33 bureaus which need to be streamlined to facilitate communication and sharing of responsibilities. Improving horizontal integration, and collaborative governance, between these many agencies and the city government would be essential. Regulations relating to climate change or sustainable development policies also need to be updated.
14.5 SUSTAINABLE DEVELOPMENT INITIATIVES In response to growing concern by residents and business on the need for better planning, governance, environmental management and economic initiatives to foster the development of the region, the central and Taipei Metropolitan Area governments have promoted initiatives involving different types of partnership. Some of these are described briefly as follows. 14.5.1 Northern Taiwan Development Commission Driven by globalization and an awareness of the need to reduce business and government transaction costs to attract business and enhance the performance of the domestic economy as a whole, Taipei City and New Taipei City have joined with other six counties and cities in the north to promote regional cooperation, regional resource integration, inter-regional spatial function improvement and the effective use of resources. The growing level of regional cooperation includes the Taipei International Coworkshops by Universities/NGOs Grant Programme to foster international exchange and cooperation on urban planning and urban design. The purpose is to introduce multidimensional and innovative ideas and encourage creative teams to utilize unoccupied property.
395
The Northern Taiwan Development Commission is the first inter-regional cooperation platform. Since its inception in 2004, the commission has reached a consensus to promote general regional development. Each of the eight counties and cities in the north serves as host county/city in turn. The members of commission are Taipei City, New Taipei City, Taoyuan City, Hsinchu City, Hsin Chu County, Maolin County, Yilan County and Keelung City. The commission seeks to address eight important development issues: recreation, transportation, industrial development, environmental resources, disaster prevention and safety, culture and education, health and welfare, and aboriginal and new immigrants. Each city or county will take responsibility for one of these issues (Figure 14.6). The commission is currently focusing on the industrial development, health and welfare sectors. Cross-Boundary Cooperation The commission was created to break barriers created by administrative boundaries, and emphasize strategic and cross-boundary collaboration among members. It aims to promote effective utilization of diverse resources to increase overall international competitiveness and synergies built on joint regional development. The commission is similar to the Core Cities Network developed in New Zealand (see chapter 2) and the United Kingdom, which collaborate on sharing resources to reduce the cost of providing services to business. Taipei and New Taipei, as the largest cities, play an important role in fostering greater collaboration between cities. Cross-boundary cooperation under the commission includes horizontal and vertical integration of activities. Horizontal cooperation involves improving the working relationship between central and local governments, with communication platforms to address issues using bottom-up and top-down approaches. Vertical cooperation involves cooperation between and across bureaus, the private sector, academic institutes, nongovernmental and non-profit organizations, as well as young students. Flagship Projects New Taipei City is leading other regions to create innovative and competitive economic and industrial environments to enhance regional economic development. Under the flagship programmes, local governments seek to promote demonstration zone projects and policies under partnership arrangements. Each partner city considers its own industrial development orientation, as well as its resource characteristics, and planning or local characteristics; and share this knowledge to create new high value-added industrial innovation. The flagship projects support sustainable economic growth and development, as well as better environmental outcomes and cleaner production methods.
396
There are eight flagship projects, four of which are in the cities of Taipei and New Taipei: 1. Flagship Project 1: Promoting Competitive Advantage in the Global Economy (i) Building an industrial alliance and cooperation platform (ii) Encouraging local industrial linkages and value-added integration. 2. Flagship Project 2: Low Carbon and Green Energy Environment (i) Planning and constructing a living carbon footprint record and management mechanism (ii) Conducting a carbon consumption and information system to help every city to set up their carbon reduction policies (iii) Promoting green energy resources, and green environmental planning. 3. Flagship Project 3: Building a Smart Technology City (i) Conducting an online (live) digital public service system (ii) Building a cross-boundary control and response system, such as a flood warning system (iii) Organizing a smart city alliance and platform to exchange experience 4. Flagship Project 4: Green Transportation System (i) Planning and constructing green public transportation (MRT and light rail transit systems) (ii) Promoting a car-pool system (iii) Conducting and promoting the YouBike and E-Bike systems. These projects involve significant integration and cooperation to ensure quality of service inputs and outputs to production processes. The two cities are working together to integrate two public bike systems into one. Citizens can easily rent a public bike and return it anywhere in the two cities. The MRT is operated by one company even though it travels across city boundaries. The free economic zone is in New Taipei City, but most of the companies and industries come from Taipei City. 14.5.2 Taipei Clean Air Initiative The Clean Air Initiative launched in 2005 is a partnership programme to encourage air quality protection in cities across the Asia-Pacific region.698 Its main focus is to reduce air pollution from motor vehicles. Taipei City has 1.8 million registered motorcars and 1 million registered motorcycles, one of the highest vehicle density rates in Asia. Also, about 250,000 vehicles travel into
397
Taipei City every day. These vehicles are responsible for 57 percent of the air pollutants and 33 percent of the greenhouse gas emissions in the city.699 By the early 2000s, air pollution had become such a serious environmental and health hazard that city authorities took steps to address the issue. Emissions from diesel vehicles were measured and efforts made to control emissions from those vehicles. By 2014, the programme had resulted in a reduction of 104.7 tons of PM2.5 emissions per year. 700 The YouBike project (discussed in Section 14.3.1.3) was launched in 2009 to achieve a modal shift from motor vehicles and motorbikes by offering a bicycle sharing option for commuters. Extensive consultations were conducted with business and the community over the introduction of the project, and to educate drivers and motorcyclists on the environmental and health benefits. Improvements in public transportation systems also served to increase use and thereby improve air quality. In 2013, the daily traffic volume of the Taipei Metro and bus system exceeded 3.3 million, having grown 22.4 percent from 2003.701 In 2014, Taipei received the Siemens C40 award for its clean air initiative.702 14.5 Corporate Green Competitiveness Alliance In 2010, the Taipei Computer Association worked with members of domestic information and communications technology (ICT) industry to create the Corporate Green Competitiveness Alliance. The aim was to help members of the industry address global environmental guidelines and create green value, as well as collaborate on sustainable industrial development recommendations and policy. Acer has played a key role as convener of the brand group, promoting exchanges of green information and technical specifications in the ICT industry. The alliance includes original design manufacturers (ODMs) and original equipment manufacturers (OEMs), brand enterprises and consultancy firms, and through this, a multiparty communication platform. Through its collaborations with industry and government, the alliance has been able to provide brand enterprises with a greater understanding of the capacities of ODM/OEM firms, and of the relevant product standards. The alliance also plays a key role in providing government with information on the needs of brand enterprises and ODM/OEM firms, which could help spur industry growth. In 2014, the alliance began collecting advice from industry regarding recycling and energy labelling regulation.703 This is one of many initiatives in Taipei, whereby industries are entering into partnerships and collaborating on sustainability initiatives to reduce industry transaction costs and reduce waste in industry manufacturing processes. 14.5.4 New Taipei City Sustainable Development Commission New Taipei City established a Sustainable Development Commission in 2007.704 Its mission is to promote a Healthy City and Sustainable Development. Its activities cover 10 sectors (see Table 14.8 for the department in charge of each sector, and the sector missions). Each sector invites professionals from academia, private business and third parties to participate in the discussion. The Chairperson of the commission is the City Mayor (see Figure 14.6 for the organizational structure of the commission).
398
Figure 14.6 Organizational Structure of the New Taipei City Sustainable Development Commission
Source: National Council for Sustainable Development (NCSD); New Taipei City Sustainable Development Commission, New Taipei Environmental Protection Department, 2014, accessed 1 September 2015, http://www.epd.ntpc.gov.tw/en/
399
Table 14.8 Sector Missions of the New Taipei City Sustainable Development Commission Sector
Department in Charge
Mission/goal
Carbon reduction and energy saving
Research, Development, and Evaluation Commission
Green economy Low carbon ecological city Lifestyles of Health and Sustainability (LOHAS)environment
Health and LOHAS
Public Health Department
Healthy and safe society
Resources and industrial development
Economic Development Department
Green economy
Bio-diversity
Agriculture Department
Low carbon ecological city
Water resource
Water Resource Department
LOHAS environment
Social welfare
Social Affairs Department
Healthy and safe society Low carbon ecological city
Public safety
Fire Department
Healthy and safe society
Sustainable education
Education Department
Low carbon ecological city
Urban and rural development
Urban and Rural Development Department
LOHAS environment
Source: New Taipei City Sustainable Development Commission, New Taipei Environmental Protection Department, 2014, accessed 1 September 2015, http://www.epd.ntpc.gov.tw/en/
14.5.4.1 Benefits of Sustainable Development in New Taipei City The New Taipei City Sustainable Development Commission has achieved many positive outcomes through its partnership with universities, industry and other parties. The most significant of these are: A More Liveable City: With assistance from local businesses, the city government built social housing for the younger generation using the build-operate-transfer system. As of 2016, more than 1,000 units have been completed to be rented to young citizens.705 A total of 7,000 units are due for completion by 2019. The city government also recruited community planners to build a green low carbon community, and help businesses find ways to reduce energy consumption. Schools are helping to improve ecological environments. The Noah Education Project (bio-diversity campus),706 for example, which involves 15 schools, have rehabilitated 100 damaged or neglected eco-areas. Fifty-eight schools have student environmental organizations, which help to reduce carbon by 360 tons per year. The project also provides employment opportunities, and improved walking and living environments for the community.
400
Improved Management of Tamsui River: Tamsui River is the most important river running through the Taipei Basin. However, flooding risk remains high as coordination among governmental agencies over catchment management is insufficient. Taipei is highly vulnerable to flooding, and the risks are not distributed equally among the population.707 Under pressure from the community to prevent flooding and to clean up and restore the water quality of the river, the government has engaged with the community, interest groups and other cities, including Singapore and the Gold Coast in Australia, to develop a more collaborative approach to river catchment management and redevelopment to promote recreation and tourism opportunities. New Taipei City works with Taipei City under a whole watershed management concept to: (i) increase flooding protection capacity to 200-year flood levels, which will protect more the 650 million people; (ii) improve the water quality by constructing a new wastewater treatment plant in Taipei City; and (iii) redesign riverbank parks using ecological engineering approaches, to provide citizens with more opportunities to reach the water body, and also allow the community to help patrol the river to identify problems in the first instance.708 To have better flooding control management, the city is also improving the previous surface in the built environment to reduce the surface runoff. The Taipei Yearbook 2012 notes that cleaning up and reviving the Tamsui River, which has been polluted for many years, has not been easy. There are many underlying challenges, including land acquisition, political factors and the need for change in attitudes (and behaviour) toward using the river as a cesspit. The considerable efforts still being made by the city government, and the contributions from all sectors, have depended on the supervision and participation of the public. Only through partnerships with the community can the aim of ultimately revitalizing the Tamsui River and creating a wonderful place to visit and enjoy be achieved. It will take some time, but the goal of emulating the river clean-up in Singapore and other great river cities of the world is looking increasingly more realistic. Bio-Diversity Plan: There are four main aspects to improving the bio-diversity in New Taipei City: life, live, producing and ecology. ‘Life’ refers to the protection of the native species and the prevention of intrusive species. ‘Live’ is about enhancing biodiversity, education and training, and encouraging citizen participation. ‘Producing’ is using environmentally friendly approaches to producing agricultural products. ‘Ecology’ is about protecting the ecological habitat. Currently many private enterprises are involved in these projects and in working with communities.
14.7 METROPOLITAN PARTNERSHIPS Taipei City and New Taipei City have their own independent plans for making a better, more liveable and sustainable city. However, the cities have many issues in common, and cooperating on these are important in ensuring success. Three kinds of metropolitan partnerships exist: city-to-city partnerships; private industry developments; and partnerships involving non-governmental or non-profit organizations. These are discussed below.
401
14.7.1 City-to-City Partnerships Taipei City and New Taipei City are geographically connected, and they share the same water and natural resources in the same basin area. There are four important partnerships between the cities of the Taipei Metropolitan Area. Public Transportation: Taipei City and New Taipei City are geographically connected and economically reliant on each other. Thousands of commuters travel daily between the two cities by public transport, such as bus, MRT and train. Taipei City and New Taipei City work together to plan future metropolitan development and planning of the MRT system, which covers the whole Taipei Metropolitan Area. The MRT system is run by the Taipei Metro under Taipei City government supervision. As discussed in earlier sections, Taipei City’s YouBike and New Taipei City’s NewBike have been merged into one system, allowing bicycles to be hired and returned anywhere in the metropolitan area. At the end of 2015, a public electronic motorbike service (EBike) was introduced. It replicates the YouBike concept and serves the whole Taipei Metropolitan Area. The success of public transportation connections, including the bus system, is due not only to the physical structure, but also to the software management which underpins it. An ‘easy card’ e-payment system connects all the different transportation ticket systems. The Easy Card Company is run by the Taipei City government. Easy card is the first and the biggest e-payment system in Chinese Taipei. Originally, it was designed for the MRT system, but subsequently was expanded to include bus, train travel and small purchases from convenience and grocery stores. The convenience of the easy card system is key to the success of the green public transportation system; it helps to reduce carbon emissions directly and indirectly. Water resources management: Three hundred years ago Taipei City was a lake (Taipei Lake), with most of the current city area under water. Many ground surface areas are, therefore, unstable. Excessive drawdown of the water table has left many parts of the city sinking. The Taipei City government has now restricted all groundwater usage. With help from the central government and New Taipei City, the issues of water access and subsidence prevention are being addressed. The Feisui Reservoir, located in New Taipei City, provides clean water to Taipei City. The majority of water consumption is by the citizens of Taipei City; however, if the need arises the Taipei Running Water Company will also provide clean drinking water to New Taipei City. The New Taipei City government also helps the Taipei City government to control the upstream land use management of the watershed. Taipei City is located on the east side of Tamsui River while New Taipei City is on the west side. Both cities have a responsibility to maintain good water quality and manage flood risks. They work together on different platforms, such as Northern Taiwan Development Commission, to achieve best practices in water resource management. Spatial Planning Strategy: Through the platform of the Northern Taiwan Development Commission, the cities of Taipei and New Taipei exchange spatial development experiences to create a better strategic plan. Spatial planning is no longer determined by
402
city boundaries, but a watershed. This also applies to the transportation network, which uses a Transport Orientated Development (TOD) concept to allocate resources. For example, the Tamhai New Town project in New Taipei City was built using the TOD concept and provides new, affordable residential areas for those who work in Taipei City. With the MRT and light rail transit network, people can reach the Taipei Main Railroad Station (in the heart of Taipei City) in 50 minutes. The partnership cooperation and new watershed management concept has enhanced the spatial planning of the Taipei Metropolitan Area. Citywide Emergency Response System: Taipei City and New Taipei City also work together on the emergency response system, including their fire and police departments. For example, in 2012, one of the water gates in Taipei City malfunctioned causing major flooding.709 New Taipei City immediately sent water pump equipment to Taipei City to help. 14.7.2 Private Enterprise Developments The governments of the cities of Taipei and New Taipei not only work together as partners; they also work with private enterprises. For example, the YouBike system is provided by the Giant Bicycles, the biggest bike manufacturer in Chinese Taipei. The ICT industry provides the knowledge and technology to build the smart city system. The telecommunications company helps to build the optical fibre environment. Private companies not only provide professional support, they also set up foundations for ecological restoration. For example, many IT companies invest in farmland to practise organic farming. They also participate in environmental protection or conservation activities in the weekends, such as cleaning rivers and hiking trails. Businesses have adopted socially responsible approaches to environmental sustainability. 14.7.3 Partnerships with Non-Governmental and Non-Profit Organizations Non-governmental and non-profit organizations play a very important role in emergency response in Chinese Taipei. Many religion-based charitable organizations, such as the Tzu Chi Foundation, show great leadership during a disaster. Because of their strong connections with the community, they can reach disaster sites quickly, and provide appropriate assistance. Such organizations also focus on environmental education activities. The Tzu Chi Foundation has the biggest recycling system in the nation. They go into the elementary schools to spread the concept of sustainable development and enlist volunteers. Such organizations play a key role in sustainable development, and empower communities to improve. The Northern Taiwan Development Commission platform provides opportunities for collaborations with non-governmental and non-profit organizations, especially community-based organizations. Such partnerships could help governments to better understand local communities and provide improved support directly to local communities. Communities also benefit from the organizations’ ability to respond quickly to emergencies, which in turn reduce response costs.
403
14.8 CONCLUSIONS The Taipei Metropolitan Area dominates the Chinese Taipei economy. In 2014, the Global Liveable Cities index ranked it 27th among 64 cities as the most liveable city in the world, or 7th most liveable city in Asia.710 However, the region is experiencing significant growth management problems along with structural change issues as it transitions from a manufacturing export growth economy to a more services-driven economy. The need to innovate, an ageing population and the need for integrated urban planning and regulatory reforms are having an impact on the region’s competitiveness. Air and water pollution, loss of natural habitat, congestion and waste management are issues which need to be addressed to facilitate a balance between development and environmental preservation. Over the past 10 years or so, there have been growing concerns about the sustainability of development in the Taipei Metropolitan Area. Significant efforts have been made by government, business and communities to make Taipei City and New Taipei City more sustainable. The initiative by the New Taipei City Sustainable Development Commission to improve the management of Tamsui River and its YouBike and bikeway systems are important initiatives that are helping to make the development of the metropolitan region more sustainable. The two Taipei’s are moving toward a more sustainable model of development, but there is still a long way to go. Crucial to improving the sustainability of development in the metropolitan region is the presence of responsible government that is moving toward the important reforms necessary to cope with the economic, social, technological and environmental changes. This call for fresh ideas, concepts and approaches to the management and development of the city involving the development of a wide range of partnerships and other collaborative governance and business initiatives. The region also needs to focus more on endogenous local economic development opportunities and on fostering innovation and creativity. Better systems, and collaborative and critical thinking are needed to understand the interaction and relationship between bureaus searching for co-benefits and trade-offs to reduce current inefficiencies. The city is facing uncertainty and must learn to accommodate the new trend of disruptive technology change. Greater cross-jurisdiction cooperation is needed across all levels of government, such as on watershed management, emergency rescue and water resources with New Taipei City and Keelung City. The participation of non-governmental and non-profit organizations is also necessary to engage the community in the decision-making process and the management of the city. This requires the support from government and the private sector, and citizens of the city need to be educated to understand the urgency of these changes. Despite these difficulties, the cities of Taipei and New Taipei are beginning to reach out to other cities in the region to develop partnerships to improve environmental management, improve government and regulatory systems, and adopt smart industry and city ideas. From these exchanges, it is hoped that new partnerships will develop that will enable the metropolitan region to diversify, adapt and develop a more collaborative and engaging model of economic development, and through that, bring about a more
404
inclusive, prosperous and creative society that is able to embrace the challenges it faces as a small island economy in the APEC region.
405
15. I-5 Highway Corridor (Seattle–Vancouver) Richard McAlary
15.1 INTRODUCTION This chapter examines one of the newest global metropolitan megaregions, the Interstate 5 (I-5) highway corridor, stretching some 500km in the Pacific Northwest of North America. The economic and urban planning challenges facing the corridor are examined, as well as some policy and planning oversights. The corridor starts in Vancouver, Canada, and transverses the entire state of Washington, running south through metro Seattle to Portland, Oregon (Figure 15.1).
Figure 15.1 Map of the I-5 Corridor (Seattle– Vancouver)
This study concentrates on the northern Seattle to Vancouver section, some 180km of the I-5 corridor, as it has many transborder issues to solve and some clear bilateral and APEC related trade opportunities that require United States and Canadian governmental action. The corridor, with 2015 estimated population of 9,630,000,711 is on the verge of mega-region status as the population approaches the 10 million mark. True global cities and urban corridors set the agenda, shape the trade culture and even create global fads.712 Seattle and Vancouver are both showing signs of becoming true global cities. Depth of the technical, research and other ‘green’ industries is a feature of the region, which was previously focused on the export of raw products from the now declining forestry and mining sectors. The fact that the region has been able to adapt and create a multi-nodal urban corridor of growth along the I-5 corridor is testimony to
Note: Built-up urban areas are shaded yellow; national parks or conservation areas are shaded green; the I-5 highway corridor is shown in red. Source: Wikipedia Commons / Citynoise.
406
the success of creating a strong diversified economy able to sustain itself and grow, even in times of economic recession.713 This chapter examines some of the key areas and challenges of economic, social and environmental sustainability in a multi-nodal megaregion that crosses an international border. 15.1.1 Population Base The I-5 corridor is geographically clearly defined by the mountains to the north of Vancouver, British Columbia; by the metropolitan area of Portland, Oregon, to the south; by the Pacific Ocean to the west; and by the Cascade Range to the east. The populations of the respective state and provincial areas in 2014 were: Washington (7,062,000), Oregon (3,970,000) and British Columbia (4,629,000). The I-5 corridor is the fastest-growing population and economic area of the states of Washington and Oregon and the province of British Columbia. Annual population growth within the corridor is projected to be an average of 135,000 persons per year: between 30,000–35,000 in Metro Vancouver and Metro Portland and upwards of 70,000 in the nine counties along the I-5 catchment area in Washington State. (Population catchment areas in Oregon along the I-5 highway south of Portland are not included in this study and do not form part of the analysis.) Two out of every three residents in British Columbia and Washington State depend on this ‘corridor of trade’ every day of their lives. The condition of the I-5 Highway directly affects approximately 8 million of their combined population of nearly 12 million. The Seattle metropolitan area, including bedroom suburbs around Puget Sound, has an estimated population of 4,461,470 in 2015. It is the largest city area within the corridor; it is also the centre of employment growth, with the lowest unemployment rate, and it is home to many global companies. The city of Seattle, with a 2015 estimated population of 640,000,714 grew by 2.8 percent in 2012–2013, the fastest growth rate that year of any city in the United States.715 Continued growth, spurred by an economic revival in the downtown core will push the city centre population to over 700,000 within three years. The metropolitan Seattle population is expected to reach over 4.7 million716 during this time. The population growth rates are being driven up, in part, by national and international migration inflows seeking jobs or new business ventures. Seattle and Vancouver have strong economies, with triple A or equivalent credit ratings and growing employment levels. Seattle, in particular, is going through a generational growth spike due, at least in part, to a decision by international tech giant Amazon to locate many thousands of employees in the downtown area. The growth of companies like Amazon, Microsoft, Expedia Inc., Zillow, Costco, Starbucks, Nintendo America and before them, Boeing, have fuelled metro Seattle’s growth over the past 35 years.
407
Table 15.1 Population of the Pacific Northwest Metro Area, 2015 City Seattle
2015 estimated metro population 4,461,470 (including Puget Sound suburbs)
Vancouver
2,870,000 (lower mainland British Columbia)
Portland
2,383,470 (including Washington State suburbs)
Source: Statistics Canada and US Census base figures, May 2015
15.1.2 Economic Base The economic base of the corridor is heavily dependent on healthy world trade and tourism, specifically from APEC member economies. Both Washington State and British Columbia are export-driven economies.717 Nearly 50 percent of their combined economies are affected by foreign trade; approximately one out of every two jobs in the corridor has a link to either bilateral trade between the United States and Canada or foreign trade, mostly in the Asia-Pacific. Export of raw materials. The export of raw materials from the corridor remains very important to the development of the US and Canadian economies. It has, in part, given way to international trade from the new generation of companies like Microsoft, Intel and Amazon but remains a key economic factor for the Asia-Pacific gateway ports of Vancouver and Seattle. Bilateral trade. Bilateral trade and short-stay visitors between the United States and Canada also make a significant contribution to income and employment generation in the destination cities, as do the shiploads of cargo or planeloads of tourists from overseas.718 With better transportation, the trade links between Port Metro Vancouver and the Puget Sound twin ports of Seattle and Tacoma will strengthen. The volume of shipping and the economic significance of the ports to the region and the continent will increase. Emerging sectors. The traditional Pacific Northwest economic core sectors of forestry, fishing and mining have been in either real or relative decline for more than a generation.719 While the export of raw products from the region remains important, it will be employment by the new sectors of the economy that will fuel further growth. The booming tech sector, the creative film and television sector, the financial sector which is long overdue for expansion, the health and education sectors and the rapidly growing tourism sector should all outperform (both in economic and employment terms) the growth of the more traditional sectors of the economy over the coming years within the corridor.
408
15.2 ECONOMIC DYNAMICS 15.2.1 Economic History of the Region Historically, social isolation from the rest of the continent, rich natural resources, relatively easy primary export markets and limited road and rail corridors through the various west coast mountain ranges helped form the Pacific Northwest economic and social culture around the major population centres of Seattle and Vancouver. In the early 1900s, the two cities were linked by rail, road, boat and even frequent float plane connections. In the 1950s, the road infrastructure was enhanced by a ‘superhighway’ between the two cities, which included the building of Deas Island, now known as the George Massey Tunnel, under an arm of the Fraser River, near Vancouver City in 1957– 1959. During the 1960–1980 period, the Boeing Company dominated the manufacturing sector of the economy within the corridor. The primary forestry, mining, fishing and agricultural sectors were still all relatively strong. Microsoft, Intel, Amazon and even Starbucks had yet to enter the scene. The cruise ship tourism market had yet to emerge and tourism from the Asia-Pacific had yet to develop. Seattle hosted the Century 21 Exposition, better known as the 1962 Seattle World’s Fair. Seattle was positioning itself to become a world city with ultra-modern transport systems. The World’s Fair was a ‘defining moment in the history of Seattle’.720 The 1962 fair attracted almost 10 million persons through the gate during the six months it was open and left a legacy of landmark buildings and infrastructure, including the downtown monorail and the Seattle Space Needle, which has been the main identifying icon of Seattle ever since.
409
The World’s Fair that year was not the first defining moment for Seattle, but it had a lasting effect and set the stage 24 years later for Vancouver to also experience, the ‘biggest single catalyst for dramatic change in the city’.721 The city hosted Expo 86, officially known as the 1986 World Exposition, with a motto of ‘World in Motion – World in Touch’. It attracted over 22 million visits in only six months and was a catalyst for today’s booming international tourism sector in Vancouver. Legacy buildings from Expo 86 include the Canada Place Cruise Ship Terminal and the Sky Train light rail system as well as regeneration of a major inner city space on the site of the fair in False Creek. Expo 86 helped turn Vancouver into an ‘exciting, cosmopolitan city, a place hailed around the world for its beauty and livability’.722
Photo 15.1 Seattle Space Needle
During the 1980–2000 era, spurred on, in part, by the success of Expo 86, the economic base began shifting very rapidly in the corridor. The new computer generation companies started to grow and the homegrown coffee society started to mature with Starbucks exporting itself to Credit: Richard McAlary. the world. International tourism started to make its presence felt and, with the construction of the Canada Place cruise terminal, Vancouver became a major cruise ship port. In the most recent 2000–2014 period, the importance of hi-tech, green industries took a firm hold. Boeing made even more planes, and the technology, moviemaking and tourism sectors continued to boom. Vancouver co-hosted the 2010 Winter Olympics in the mountain resort of Whistler Blackcomb. Major infrastructure projects built for the 17-day event included many sporting venues and at least two very significant infrastructure improvements for Vancouver and the province of British Columbia. These were the Canada Line light rail connection from downtown Vancouver to the international airport and beyond, and the upgrade to the Sea-to-Sky Highway north of Vancouver, which connects to the world-renowned Whistler Village. Both of these infrastructure improvements will have lasting positive effects within the corridor and for tourism in particular.
410
15.2.2 Key Economic Indicators A stable, well-educated and growing workforce, combined with the excellent seaports and airports, plus a focused external trade culture, has been key to the corridor’s economic strength. The foundation for continuing economic growth remains very strong. A snapshot of employment statistics for March 2015 shows a relatively low average unemployment rate of 5.2 percent across the three main metro areas, with Seattle clearly the best performing at that point of time (Table 15.2). The national unemployment rate in March 2015 for the United States was 5.6 percent and for Canada 6.8 percent. In the current economic cycle, the economic performance of the I-5 corridor is continuing to outperform national employment averages. The city of Seattle is nearing full employment. King County, which incorporates the city of Seattle and much of the inner Seattle metropolitan area, recorded a 3.3 percent unemployment rate in April 2015,723 the lowest since April 2008.
Table 15.2 Metro Labour Force (Non-Farm Employment), I-5 Corridor, March 2015 Metro area
Labour force
Employment
Unemployment
Unemployment (%)
Seattle
1,979,400
1,887,600
91,800
4.6
Vancouver
1,357,700
1,277,600
80,100
5.9
Portland
1,206,100
1,141,600
64,500
5.3
Total
4,543,200
4,306,800
236,400
5.2
Note: Rounding and seasonal adjustments have been applied to source documents. Source: US Bureau of Labor Statistics, extracted May 2015, and Statistics Canada, Table 282-0136, Labour Force Survey, date modified May 2015.
In terms of gross metropolitan product (GMP), the value for the Seattle area is as great as Vancouver and Portland combined (Table 15.3). This is in part due to its relative size and also to the dollar value of the Boeing products produced within the Seattle metropolitan area. It is the economic strength of the entire urban corridor which makes the region so significant.
411
Table 15.3 Estimated Gross Metropolitan Product (GMP), I-5 Corridor, 2014 Metro area
GMP (GDP) USD
Seattle
281,000,000,000
Vancouver
134,520,758,000
Portland
160,900,000,000
Total Estimated Value
576,420,758,000
Sources: Stats Canada experimental CMA Table381-5000 and estimate derived from BC Province GDP figures for 2013. Seattle and Portland figures are sourced from US Metro Economics Estimate by IHS Global Insight for the US Conference of Mayors and the Council on Metro Economies.
Export values are difficult to determine due to differing reporting regimes. Seattle’s export value of over USD 52 billion is reflective of its bigger metropolitan-based export industries with shipments of Boeing aircraft a major component. The value of technology export earnings is difficult to determine due to the globalization of technology markets and may be understated for all three urban areas in Table 15.4. The estimated 2014 export value of USD 100 billion will be easily exceeded in 2015, based on the current growth in the technology, aerospace, moviemaking and tourism sectors within the corridor.
Table 15.4 Estimated Valuation for Exports, I-5 Corridor, 2014 Metro area
Export values (USD)
Seattle
51,918,000,000
Vancouver
24,625,000,000
Portland
28,514,000,000
Derived Estimated Total Value
97,670,000,000
Note: The Vancouver figure is derived from the 2013 Stats Canada Data of Export of Goods and Services from British Columbia, and assumes a 50 percent valuation for Vancouver, with a five percent growth factor added for 2014 adjustment, and CDN dollar value set at 0.94. Source: Export Monitor, Global Cities Initiative, Joint Project of Brookings and JPMorgan Chase, May 2015.
In terms of the largest export sectors, data are much more easily obtained for physical products shipped by land, sea or air. In this regard aircraft products and parts at nearly USD 33 billion are clearly a dominant export product for the entire corridor, while shipments of semiconductors, mostly from Intel in the Portland area, are also a major item at nearly USD 12 billion in 2014 (Table 15.5). Vancouver, by comparison, does not have a Boeing or Intel to include in its more traditional raw primary export figures of forestry, agricultural and mineral products, especially coal.
412
Table 15.5 Largest Export Sector by Metro Area, I-5 Corridor, 2014 Metro Area
Sector/Sectors
Seattle
Aircraft products and parts
Vancouver
Primary products, including forestry
Portland
Semiconductors
Value (USD) 32,814,200,000 12,382,902 11,729,200,000
Source: Derived from 2013 BC Stats, Statistics Canada and Export Monitor, Global Cities Initiative, retrieved May 2015.
The interlocking economic and social bonds within the corridor include a common language and cultural development, geographical proximity, shared values, military alliances including the North American Aerospace Defense Command (NORAD, the joint military command to defend both economies from external attack) and millions of cross-border family ties. Both economies are commercial partners with economies that are integrally bound together in the world’s largest bilateral trading relationship.724 The Pacific Northwest is North America’s closest air and sea gateway to the Asia-Pacific region.
Table 15.6 Key Economic Facts – United States and Canada, April 2015 United States
Canada
0.2%
-0.1%
Inflation
-0.2%
0.8%
Interest rate (US Federal Reserve / Bank of Canada)
0.25%
0.75%
5.4%
6.8%
62.8%
65.8%
GDP growth rate
Unemployment Labour force participation
Source: Statistics Canada, May 2015; US Department. of Labor, May 2015.
15.2.3 Key Industry Growth Sectors 15.2.3.1 Tourism Tourism, be it international, regional or national, is a big business within the corridor. The expansion of the cruise ship traffic to Alaska out of Vancouver or Seattle, the new cruise market to Hawaii, the international ski destinations and the booming scenic train business through the Rocky Mountains all contribute to the rapid growth in this sector. Tourism employs tens of thousands within the region and generates billions of dollars of trade; much of the trade is international. In the 2015 MasterCard Global Destination Cities Index (based on 2014–2015 data), Vancouver is estimated to have 3.76 million international visitors staying at least
413
overnight, having arrived through the Vancouver International Airport. These visitors spent an estimated USD 2.7 billion dollars, ranking Vancouver’s ‘export earnings’ from this sector the highest in Canada and third highest on the west coast of North America after Los Angeles and San Francisco.725 This survey does not cover land-based international tourists arriving via train, boat or road but does give an indication of just how valuable international tourism can be to a local economy. Tourism, being, for the most part, a ‘clean’ industry, is encouraged throughout the region and is seen by the federal, state and provincial governments as a major growth sector in the years ahead. One relative weakness in regional tourism is the delays evident in cross-border automobile traffic between Canada and the United States on the I-5 at the Blaine border crossings. The I-5 north to Vancouver has the second busiest passenger vehicle crossings (Blaine border crossings) along the United States–Canada border and the fourth busiest commercial crossing (Douglas border crossing).726 There are almost constant calls from virtually every advocacy group involved in international trade and bilateral US–Canada trade for improved border procedures for what is geographically and historically one of the most open borders in the world. However, despite many attempts to improve the processing time per automobile or truck, the wait time has actually increased steadily since the last round of major improvements in 2010–2011.727 Some serious policy rethink is needed by the relevant United States and Canadian agencies as to how to make the I-5 border crossings more efficient and not a deterrent to the growth of both the product and services trade, including the all-important tourism market. It would seem, from an outside observer, that at least during the peak tourism times, more inspection lanes could be facilitated by having temporary inspection stations either in front or behind the permanent structures. Longer term solutions could include extending the port of entry to allow more inspection lanes or use of new technology.
Photo 15.2 False Creek, Vancouver
Credit: Richard McAlary.
414
15.2.3.2 Technology The economic strength and the resulting population growth of the corridor are being driven by technology-based companies. For example, Boeing was established in Seattle and half of the company’s global workforce is still located in the corridor. According to 2014 figures published by Boeing,728 the company directly employs more than 82,000 staff in the area under study in this chapter. The company reported USD 5.7 billion worth of purchases in the local economy during 2014 as well as USD 53.4 million in charitable contributions. The aerospace industry continues to be a growth sector, and Boeing remains an important cornerstone to a strong aerospace assembly, manufacturing and research component in the corridor’s economic future. The software, motion picture animation and information technology sectors are driving forces in the urban corridor. The international headquarters of Microsoft and Amazon alone have combined to add more than 70,000 direct full-time, relatively high-paying technology jobs in the Seattle area over the past 20 years. Intel employs approximately 17,500 in the Portland area, making it the largest private employer, not only in Portland but also of the state of Oregon. On the motion picture technology front, Sony Pictures Imageworks relocated in 2014 from California to downtown Vancouver in a state-of-theart visual effects and animation facility that is designed to house up to 700 artists. More than 30,000 are now employed in the motion picture and television production sector in Vancouver. 15.2.3.3 Education Cooperation and collaboration with the business sector have been a hallmark of universities in the region for the past hundred years. For example, Boeing, in its early years, funded various studies and facilities at the University of Washington, including a wind tunnel to test the flight characteristics of its early planes. 729 Today the major universities within the corridor have adjacent corporate research parks and strong commercial ties to numerous companies requiring research. The University of Washington in Seattle and the University of British Columbia in Vancouver, the two leading universities in the corridor, are among the top 35 universities in the world according to the 2014–2015 Times Higher Education rankings.730 These two universities lead an impressive list of colleges and universities in the corridor that attract students from around the world (see Table 15.7).
415
Table 15.7 Enrolment of Selected Universities within the I-5 Corridor, 2014–2015 Name of university
Student enrolment 2014–2015
University of Washington (Seattle)
45,000
University of British Columbia (Vancouver)
43,000 full-time 16,000 part-time
Simon Fraser University (Metro Vancouver)
17,000 full-time 13,000 part-time
Washington State University (Pullman and other campuses)
26,000
Oregon State University (Metro Portland)
23,000
University of Oregon (Eugene)
21,000
University of Victoria (Victoria, BC)
16,500 full-time 5,000 part-time
Source: University websites (2015).
In the 2014–2015 university year, the University of Washington and the University of British Columbia together had more the 25,000 graduate students enrolled, with a teaching faculty of more than 10,000.731 Seattle, Vancouver and Portland all have highly educated workforces with an estimated 300,000 students enrolled in post-secondary education in 2014. The close working relationships between universities and colleges and the private sector, plus the aggressive worldwide recruitment efforts of the technology sector located in the three cities, will ensure a competitive economic edge for the education sector in the region for many years to come. 15.2.4 City/Region Economic Competitiveness 15.2.4.1 Seattle Seattle is in the heart of the corridor and is a metropolitan area that is benefiting from a renewed interest in its harbourfront downtown core. The annual US Census figures for 2012–2013 showed the city of Seattle growing by 2.8 percent, the fastest population growth rate of any major city in the US. According to Seattle’s Office of Economic Development, the city is currently adding approximately 15,000 new jobs a year. Amazon, already with an estimated 15,000 employees located in the city of Seattle out of its global workforce of over 100,000, is expanding with a new global headquarters precinct in downtown Seattle. This one company could have upwards of 30,000 staff working in downtown Seattle within three years. As a direct result of the Amazon plans, other development in Seattle is occurring. For example, Seattle issued more residential building permits in 2014 than at any time in the past 30 years. Many of these new apartments are within walking or biking distance of the Amazon buildings. Starbucks, another well-known Seattle-based ‘internationally focused company’, is opening yet more stores to cater to the influx of new workers.
416
Microsoft, another global technology company, has its headquarters in the Seattle suburb of Redmond. It has more than 42,000 employees in the Seattle metropolitan area, plus a significant presence in Vancouver, BC. Boeing, long a major employer in metro Seattle, had over 82,000 direct employees in 2014, plus another 55,000 retirees in the area. Microsoft, like Boeing did before it, has attracted many companies to the corridor area. Spinoff Microsoft companies such as Expedia Inc. and Zillow have remained in the Seattle area; and they are growing into global technology companies with thousands of employees. The Bill and Melinda Gates Foundation, established in 2000, has Seattle as its global administrative home. The philanthropic organization has become the largest private foundation in the world, having trust endowments in 2015 of USD 42.9 billion.732 15.2.4.2 Vancouver Quality of life remains a strong positive in terms of attracting commerce and retaining trained workforces. Metro Vancouver accounts for more than 50 percent of British Columbia’s population and more than 50 percent of the province’s economic output. The metro economy is well on its way in transitioning from a resource-based economy to a knowledge-driven economy. Goods production accounts for only 20 percent of regional employment; the bulk of employment is in services production. The city’s economy is diversified and comprises mainly thousands of small business enterprises; 60 percent have between one and four employees. Compared to Seattle and Portland, Vancouver has fewer larger publicly traded firms and more government and privately owned enterprises. In recent years, it has been the tech companies and the motion picture and television sectors which have been diversifying the Vancouver economy. Microsoft and Sony Pictures Imageworks are expanding into the same downtown Vancouver location in 2015. Other major employers in Vancouver include: the Jim Pattison Group, Tech Corp, Telus Corp, HSBC Bank Canada and BC Hydro. Unlike Seattle or Portland, the list does not include any well-known international technology, product or retail companies. The billion dollar plus moviemaking business is big and growing with 2015 expected to be the strongest yet.733 The Vancouver Economic Commission is the city’s economic development agency with responsibility for the city’s economic development strategy. The strategy has identified clean technology and digital media as the major growth sectors for the next two decades and contends that targeted incentives focused on these sectors will lead to exceptional growth.734 Moving forward, the commission cites the need to enhance economic development tools, including significant incentives, to be competitive with other cities. 15.2.4.3 Portland Portland has a highly specialized export economy with Intel dominating export product value. The earnings from the export-focused economy support 8.6 percent of the workforce in Portland.735 Intel has around 17,500 employees in the metro area and with
417
it’s soon to be completed Development Fabrication Facility, the number of employees is expected to increase significantly.736 Another internationally well-known company in the Portland area is Nike, with nearly 9,000 employees. The Providence Health System is also a large local employer along with various government agencies. 15.2.5 Innovation, Creativity and Business Entrepreneurship The corridor has a history of innovation, creativity and business entrepreneurship. Innovator organizations such as Microsoft, Amazon and Boeing have developed a climate of creativity which has influenced the entire economic development of the corridor. International trade and private-sector business entrepreneurship appear to be the core economic driving forces in the corridor. Financial incentives from state and provincial government are used to attract selected new businesses or to retain key new investments. The tax regimes of Washington State, the province of British Columbia and the state of Oregon are all quite different. Each government, through taxation and provision of services, plays a crucial role in the economic and social health of the corridor. The effectiveness of the different tax regimes and industry incentives is worthy of a study in its own right. At the very high level of taxation difference, Washington State has no state personal income tax and Oregon has no state sales tax. British Columbia has both sales tax and income tax but has free state-supplied medical care for all. Both Oregon and British Columbia appear on the surface to offer tax breaks for selected industries to offset other perceived economic benefits offered by other jurisdictions. In the final analysis, all three sub-federal governments in the corridor are globally competitive in providing favourable economic and taxation conditions and their major cities continue to grow and prosper through the innovation, creativity and business entrepreneurship of the organizations that have chosen to locate there. 15.2.6 Economic Development Partnerships 15.2.6.1 Seaport Alliance Agreement Every year brings new partnerships of some form or another to the corridor. Some of the more significant in recent years include the 2015 Seaport Alliance Agreement that will unify the operations of the marine cargo terminals and related functions of the Port of Seattle and the Port of Tacoma.737 While the two adjacent ports in Puget Sound will continue to retain existing port commission governance and ownership, the Seaport Alliance is a major achievement and will undoubtedly add to the 48,000 jobs in the Seattle area that depend on the two ports. Washington State is the most trade-dependent state in the United States, with approximately 40 percent of all jobs related to international trade.738 The efficiencies that will ensue from this alliance of two historically competing ports cannot be overstated. This ‘in the public interest” act backed by a USD 2.2 billion capital improvement budget will increase trade and economic activity through Puget Sound. The Commissioners of
418
the two ports jointly received the 2015 Public Sector Economic Development Champion Award for their role in forming the alliance. 15.2.6.2 International Mobility and Trade Corridor Project Another example of economic partnership is the International Mobility and Trade Corridor Project, a United States–Canada coalition of government and business formed in 1997. It has directed approximately USD 40 million from government and the private sector toward projects aimed at decongesting the border and improving mobility in the British Columbia and Washington State Cascade gateways.739 The project is led by the Whatcom Council of Governments, based in the Washington State I-5 corridor border city of Bellingham. It publishes a book of annual statistics on border-crossing traffic that is funded by the US Federal Highway Administration. The project has also received funding from the Bill and Melinda Gates Foundation.740 The International Mobility and Trade Corridor Project is perhaps the best source of data on border crossings within the corridor. As a forum for over 70 organizations, its strength lies in its ability to identify effectively, prioritize and raise funds for cross-border mobility improvements; and it could be a model for other cross-border projects.
15.3 STRATEGIC INFRASTRUCTURE 15.3.1 Roads The elongated rectangular nature of the Pacific Northwest as a defined geographic area means that as a region, the north/south transportation links are essential. The inclusion of the key highway, the I -5, in the title of this chapter underscores the importance of this highway corridor to the region. The I-5 and the British Columbia Highway 99 road infrastructure within the corridor were built in the 1950s as a joint United States–Canada infrastructure project. The George Massey Tunnel on Highway 99 is located approximately 20km from downtown Vancouver and 30km from the US/Canada I-5 border crossings at Blaine, Washington, and is perhaps the key road infrastructure link on the I-5 corridor from Seattle to Vancouver. The opening ceremony of the tunnel in 1959 was considered such a significant event for Canada that it was presided over by Queen Elizabeth II. More than a quarter of the population of Greater Vancouver drove through the new tunnel the first weekend it was opened for public inspection, toll-free. The tunnel was so well-used that most of the construction cost was recovered after only five years of operation, and tolls were removed in 1964. However, the tunnel is nearing its use-by date. The government of British Columbia has announced, subject to environmental review, a new eight- to ten-lane bridge to be constructed to replace the four-lane tunnel, with construction to start in 2017.741 The tunnel has been a regular traffic bottleneck and potential earthquake evacuation weak spot for a generation, and the expansion of this river crossing is long overdue. Other significant
419
bottlenecks along the route are at the Blaine border crossings, as previously identified in Section 15.2.3.1, and along the section of the highway traversing through metropolitan Seattle, where traffic regularly comes to a standstill. When completed, the new bridge will increase cross-border traffic and will certainly stimulate housing growth and provide lower commute times to the city centre within the southwest section of metropolitan Vancouver. It will also have a direct economic impact on Whatcom County, WA. The next step will be to upgrade the other substandard sections of the highway to bring the road network it back to its original, superhighway status and better support economic growth within the entire corridor into the future. 15.3.2 Rail The I-5 corridor is served by Amtrak Cascades, a passenger train service between Seattle and Vancouver. This service is one of 11 federally designated rail corridors in the United States which receives federal funding. It runs for 483km in Washington State, 53km in British Columbia and 215km in Oregon. Amtrak Cascades carried approximately 232,000 passengers in 2014.742 The service operates on BNSF Railway’s tracks. Upgrades on the privately owned BNSF tracks to accommodate improvements in passenger service are funded by the US federal government and the state of Washington. Work has commenced on upgrades to the rail line from Seattle to Vancouver, with funding from federal and state sources. A major contribution comes from a USD 794 million grant from the US Federal Rail Administration to the state of Washington in 2010.743 This funding was provided under the US 2009 American Recovery and Reinvestment Act;744 and has the aim of upgrading passenger rail in the state to encourage more high-speed train services in the United States as a nation. One example of the current upgrades is the USD 8 million track upgrade at the BlaineSwift Customs Facility in Washington State on the Canadian border that was constructed in 2015. The realignment of tracks and creation of a second siding allow a better flow of passenger train traffic in the congested freight train inspection area at the border. The cost of improvements like this is sourced from the USD 792 million US Federal High-Speed Intercity Passenger Rail Grant that Washington State received for the Amtrak Cascades service. In Washington State, this programme is administered by the State Department of Transportation. Additional federal funding, if highway realignments are necessary, can be sourced from the Federal Highway Administration. The breakdown for the work at the Blaine border crossing area is as follows: Federal Rail Grant funds, USD 7 million; Washington State, USD 3.5 million; and Federal Highway funding of US 4.7 million.745 These long overdue upgrades are significantly improving the rail link through the entire length of the corridor. A major challenge is that the rail tracks along the Seattle– Vancouver corridor are used primarily for freight carriage, not passenger traffic. The Amtrak Cascades service and the private Vancouver train tour operator, Rocky Mountaineer, operate by agreement with BNSF on the BNSF tracks. The existing conflict between passenger and freight trains operating on the same track (exacerbated by the historic right-of-way for freight traffic) will continue and increase as passenger and freight traffic increases. BNSF is very clear that their first priority is freight.746 BNSF and Amtrak have, however, reached numerous agreements on sharing and upgrading the
420
tracks between Seattle and Vancouver in the last few years. This includes the construction of a 3.35km long siding within the boundaries of Metro Vancouver at a cost of USD 7 million. The Roberts Bank Rail Corridor also may have a role to play in the future of passenger train movements between Seattle and Vancouver. Roberts Bank is a major coal terminal within Metro Vancouver only a few kilometres from the I-5 and the United States border. The Roberts Bank Rail Corridor was completed in 2014, at a cost of over USD 300 million.747 The 70km stretch of rail and road involved cost-sharing by 12 partners, including railway companies (BNSF Railway, Canadian National Railway, BC Rail and Canadian Pacific Railway), the Canadian government and local municipalities. The Canadian federal government allocated funding of USD 75 million. This model of collaborative funding could be a forerunner of what will be needed to address future improvements to passenger train operations within Metro Vancouver. 15.3.3 Seaports and Airports The combined marine cargo operations, passenger ship operations, air traffic freight, air passenger uplifts and road and rail infrastructure operations in the I-5 corridor now rival, indeed surpass, Los Angeles as the busiest ports and transit points on the North American west coast. When the annual passenger boarding numbers of international airports operating in the I5 corridor are combined, they exceed the Los Angeles International Airport’s figures. The Los Angeles International Airport is the second busiest airport in the United States after the Hartfield-Jackson International Airport in Atlanta. The Seattle-Tacoma International Airport on its own is ranked the 15th busiest airport in the United States, just after Orlando International Airport in Florida.748 The legal operation and ownership structure of the port and airport facilities in Vancouver differs significantly from Seattle and Portland. In Canada, the organizations, while operated locally, are owned by the Canadian federal government. In Seattle, it is the local government who owns the infrastructure, while in Portland it is the state of Oregon. The manner of appointments to the controlling Boards also differs significantly. 15.3.3.1 Vancouver International Airport Vancouver International Airport is operated by the community-based, not-for-profit Vancouver Airport Authority. The authority’s 10-member board is appointed by various organizations that were selected by Transport Canada when the airport operations were assigned to the then newly created Vancouver Airport Authority in 1992. The airport is owned by the Canadian government although the federal government has only one permanent member on the board. The governing department is the Federal Ministry of Transport, known as Transport Canada. Sea Island in Richmond, just a few kilometres south of the Vancouver central business district (CBD) was chosen as an airport site in 1930 and expanded in the 1940s when Boeing opened an aircraft manufacturing facility onsite.
421
The airport is a key element in the economic strength of Metro Vancouver, generating an estimated USD 7.4 billion to the local economy in 2015.749 It serves as a core component of the tourism sector and has been a key player in the growth and development of both cruise ship traffic and the Rocky Mountaineer scenic train service. The airport estimates that more than 26,000 people work in a variety of aviation industries at the airport, helping to move freight, service aircraft and transport more than 19 million passengers in 2014.750 The airport, like Port Metro Vancouver, is a major employer in the metro area. Vancouver International Airport has the second highest passenger traffic to the Asian and Pacific markets among airports in North America, after Los Angeles International Airport. The Seattle-Tacoma International Airport has far more North American air traffic than Vancouver but fewer international flights. In the 2015 Skytrax World Airport Awards, Vancouver International Airport was voted Best Airport in the World in the 10– 20 million passenger category and Best Airport in North America for the sixth straight year. Currently, 53 airlines serve the airport, covering more than 110 non-stop destinations worldwide.751
Photo 15.3 Aerial View of Vancouver
Credit: Richard McAlary.
15.3.3.2 Port Metro Vancouver Port Metro Vancouver is Canada’s most important and largest port. In terms of tonnage shipped, it ranks among the top five largest ports in North America. Port Metro Vancouver is linked to three North American rail lines: the BNSF Railway south to Seattle and then throughout North America; the Canadian National Railway east through the Rocky Mountains and then to the rest of North America; and the Canadian Pacific
422
Railway also east through the mountains and then to the rest of Canada and the United States. Port Metro Vancouver operates as a financially independent corporation established by the government of Canada pursuant to the Canada Marine Act, and is accountable to the federal Minister of Transport. Despite the common ownership, Vancouver International Airport, Port Metro Vancouver and Vancouver International Airport operate quite separately from one another. The Vancouver Fraser Port Authority, now doing business as Port Metro Vancouver, was created in 2008 through the amalgamation of three local port authorities which had been operating for nearly 150 years in separate operations. An economic impact study commissioned by Port Metro Vancouver in 2013 estimated that the port generated USD 9.7 billion in GDP. It was responsible for creating 75,000 jobs in the local area, and 98,000 jobs overall. The flow-on effects include USD 1.3 billion in tax revenues and USD 20.3 billion in economic output. In 2015, the port traded over USD 172 billion in goods to more than 160 trading economies.752 Some 140 million tons of cargo were shipped through the port in 2014. It claims to be the most diversified port in North America. According to Port Metro Vancouver 2014 data, the three source economies with the most inbound tonnage of cargo are, in order, China, United States and Korea. In terms of outbound cargo, China, Japan and Korea are the main destinations.
Photo 15.4 Ships Awaiting Loading, English Bay, Vancouver
Source: Richard McAlary.
As the home port to much of the Alaska Cruise Ship traffic, between 800,000–900,000 cruise ship passengers per year are now transiting via Vancouver. During the 2014 summer season, 29 cruise ships managed 243 separate port calls in Vancouver, boarding more than 812,000 passengers. Over the same period, an estimated 440,000 hotel night stays were generated by the cruise ship industry, 283,000 in Vancouver.753
423
15.3.3.3 Seattle-Tacoma International Airport The Seattle-Tacoma International Airport was built between 1942 and 1944, after a grant was offered by the US Civilian Aviation Authority to any local government that would build a new ‘super airport’ in the Seattle-Tacoma area. The capacity of the existing Boeing Field, at that time, was completely being used for military purposes.754 The airport is operated by the Port of Seattle Commission, a local government agency owned by the taxpayers of King County (which includes Seattle). The airport is governed by a fivemember Commissioner Board, who is elected at-large to a four-year term by voters of King County.755 According to the Port of Seattle Commission, the airport operation had an estimated economic impact in 2013 of over USD 13.2 billion, and generated over 138,000 indirect and 89,902 direct jobs in the Seattle area.756 While the airport is a significantly larger operation on a domestic basis than Vancouver International Airport, it has fewer airlines and fewer international flights than Vancouver. Twenty-four scheduled passenger airlines serve the airport, less than half of the carriers currently landing at Vancouver. Alaska Airlines uses the airport as a hub for their operations and has the most air traffic through the airport, with 51.7 percent of all passengers on their planes. International flights are dominated by those to Vancouver at 26.8 percent and Victoria, BC at 10.7 percent.757 Flights to Vancouver and especially Victoria are in relatively small aircraft compared to long-haul flights to Asia. In 2014, the airport recorded 37,497,941 air passengers and more than 319,000 metric tons of air cargo. Passenger and air cargo grew by 7.7 percent and 9.1 percent respectively over 2013 levels.758 The capital budget for the airport in the period 2015–2020 is USD 1.9 billion.759 In 2015, the airport was named by Fodor’s Travel as one of the 10 most high-tech airports in the USA. In keeping with the high-tech employment base of Seattle, some of the improvements to the main passenger terminal are impressive. For example, over 2,400 additional power outlets, including USB points for electronic devices, have been installed. There are also standing and sit-down areas at departure gates for passengers using the airport’s free Wifi service. A new Mobile Passport Control app for Customs has also been introduced, the third airport in the USA to introduce such an innovation. 15.3.3.4 Port of Tacoma and Port of Seattle The Port of Tacoma and the Port of Seattle are both located on Puget Sound, and are often referred to as the Puget Sound ports. They are owned by their respective municipalities and operated through separate Port Commissions. (The Port of Seattle Commission also operates the Seattle-Tacoma International Airport.) The Puget Sound ports are linked by rail to the rest of North America by the BNSF Railway, north to Vancouver, south to Portland, and east through the mountains. America’s largest railway, the Union Pacific, also serves the ports, operating on BNSF tracks south to Portland. This agreement to use the Seattle to Portland BNSF tracks dates from 1910.760 Competitors for generations, the commissions operating the two ports announced in late 2014 that they plan to form a Seaport Alliance to unify management of the two ports’
424
marine cargo terminals and related functions, as referred to previously in Section 15.2.6.1. The two ports will retain existing port commission governance and asset ownership under the agreement. The combined Tacoma and Seattle ports in 2014 were the third largest container gateway in North America and the two marine cargo operations support more than 48,000 jobs in the local area.761 The merger of operations is expected to position better the Puget Sound Ports for the competitive challenges ahead. The two ports have to submit a detailed agreement to the US Federal Maritime Commission in June 2015. At present, they are operating under an Inter-Local Agreement which came into effect on 1 December 2014. Formal due diligence continues through 2015.
Photo 15.5 Seatle Waterfront
Credit: Richard McAlary.
With an estimated 40 percent of Washington State’s economy impacted by the two ports, the formation of what will effectively be one operation is considered a major step forward in trade and has received much local and national praise within the United States. Forward economic impact estimates provided by the Port of Seattle predict that 100,000 new jobs will be created over the next 25 years by having effective and growing port operations. The new port structure is also expected to reduce the environmental footprint of the two ports’ operations. The Port of Seattle, having reached a merger of sorts with the Port of Tacoma, remains in commercial competition with Port Metro Vancouver. However, the three ports are working together on shared environmental issues. Most noticeable on the cooperation side is the clean air strategy that is shared by all three ports and sets a goal of a 75 percent reduction in diesel emissions by 2015 and 80 percent by 2020. 762 While cooperation between the Puget Sound ports and Port Metro Vancouver is ongoing and increasing, so is the competition, none so fierce than in the cruise ship business. The Port of Seattle
425
operates two cruise ship terminals and some 192 sailings from the port, with upwards of 900,000 passengers expected in 2015.763 15.3.3.5 Portland International Airport The Portland International Airport was built in the 1940s, and is operated by the Port of Portland Commission, a regional government agency of the state of Oregon. The commission has nine members who are appointed by the Governor of Oregon and ratified by the State Senate prior to serving four-year renewable terms of office.764 The commission is responsible for the airport and marine ports. While designated an international airport, the Portland International Airport has few international flights and only a single Asia-Pacific service to Tokyo. Despite this lack of direct international air connections, the airport recorded almost 16 million passenger movements in 2014,765 and has won several domestic airport travel awards. Like the Seattle-Tacoma International Airport, the major air carrier is Alaska Airlines and its subsidiary Horizon Air. The busiest international routing is to Vancouver, and the most frequent domestic destination is Seattle, not surprising given the significance of the economic corridor. Some of this passenger traffic would be through-traffic on connecting or stopover Alaska Airlines flights. 15.3.3.6 Port of Portland The governance structure of the Port of Portland is the same as for the Portland International Airport. The port’s marine terminals, unlike at Puget Sound or Vancouver Harbour which are ocean harbours, are located along the banks of the Willamette and Columbia Rivers. The terminals are served by two railway networks, the Union Pacific and BNSF. BNSF also serves Vancouver, BC and Seattle. Major exports include grain, soda ash, potash, automobiles and hay. The major import category is automobiles. Portland, like Vancouver, is a major port for the export of farm products especially wheat. 15.3.4 High-Speed Train Service A high-speed passenger train service on a dedicated line between Portland, Seattle and Vancouver could bring enormous economic benefit to the I-5 corridor. High-speed trains are considered normal infrastructure in many areas, and especially in Europe and Japan, and is on the drawing boards for the I-5 corridor and in other areas of the United States. Within the corridor, there is local government support from the mayors of Seattle, Vancouver and Portland and a private group, Cascade High-Speed Rail based in Portland; they are promoting the idea of a high-speed passenger service to support future tourism and economic growth. Until a new high-speed rail link is established, the existing 100-year-old railway track bed needs to be continually upgraded in conjunction with BNSF to facilitate increased rail freight traffic between the Puget Sound ports and Metro Port Vancouver and to allow the limited passenger service on the same tracks to function efficiently.
426
15.3.5 Seattle Transport Infrastructure The Seattle transportation system received a big boost in 2004 when voters passed a referendum to raise the local sales tax so that an extra USD 17.8 billion could be raised for a new light rail and to expand express bus lanes and the Tacoma–Seattle commuter rail capacity. That referendum passed with a 57 percent ‘Yes’ vote. The airport connects to central Seattle by a light rail line. By 2020, it is estimated that 3,000 people per day will board at the airport station. A significant modernization and expansion programme for the airport is underway and includes new, expanded and renovated terminals, a third runway and taxiway system, roadways and parking structures, an upgraded baggage system, an upgraded and expanded people mover system, and an improved light rail interface. 15.3.6 Vancouver Transport Infrastructure Between 16 March and 29 May 2015, the Metro Vancouver Transportation and Transit Plebiscite was undertaken by the provincial government through Election BC, a nonpartisan Office of the Provincial Legislature.766 The referendum was on the question of increasing the provincial sales tax in Metro Vancouver by half a percentage point to set aside dedicated funds to help solve the area’s ‘significant’ transportation challenges as a result of continued population and economic growth. There was a voter response rate of approximately 45 percent of eligible voters on the 10-year USD 7.5 billion transportation plan. The result was a 61.7 percent ‘No’ vote. This has put planned transportation infrastructure projects on hold until alternative funding solutions can be found. The need for expanded transportation infrastructure remains. This was a unique event for Vancouver voters as no prior referendum had ever been held in Canada on a transportation infrastructure tax, let alone through a mail-in ballot. The referendum was modelled, in part, on the 4 November 2004 Seattle Mass Transit Referendum. 15.3.7 Portland Transport Infrastructure Portland has developed an extensive rail system, intended to transfer travel demand from cars to transit. Six rail lines (five light rail) radiate toward the urban periphery, from the downtown CBD.767 The city also supports cycling and has developed a bicycle transportation system of nearly 500km.
15.4 SOCIAL AND ENVIRONMENTAL SUSTAINABILITY Agencies in the Pacific Northwest have been recognized as early adopters of climate change planning, in terms of both climate change mitigation and adaptation. Key challenges include better integration of Climate Action Plans and long-range transportation planning documents.
427
15.4.1 The Changing Face of the Pacific Northwest The Asian, especially Chinese, influence is clearly evident in the streets and businesses of Vancouver and Seattle. Based on the 2011 census in Canada, Metro Vancouver has achieved the distinction of being the most Asian ‘major city’ outside of Asia.768 What that means in terms of economic or social development is not clear. Starbucks is still selling lots of coffee, and the local professional ice hockey games are still sold out. The ‘Asian-ification’ of Metro Vancouver and a few suburbs of metro Seattle is pronounced and will increase, according to the figures produced by Statistics Canada.769 The trend of the past 20 years or so of an increasing number of Metro Vancouver residents having Asian roots will continue; and the Asian population is expected to grow at a faster rate than the non-Asian population over the coming years. The Asian population in Metro Vancouver, like Asia itself, is made up of many different groups. The largest population groupings in Metro Vancouver in the 2011 census were ethnic Chinese, followed by Indians and Filipinos, then by a much smaller number of residents identifying themselves as coming from Korea, Pakistan, Iran, Viet Nam, Afghanistan and elsewhere.770 The ethnic mix of Seattle and Portland is also different from that of most major USA cities. 15.4.2 Relative Isolation of the Region The Pacific Northwest and the I-5 corridor are geographically separated from the rest of North America by mountain ranges to the north, east and south. This physical separation has contributed to a culture and racial mix different from that of the rest of the United States or Canada. The economic and social ties to Asia of this area should contribute to an increase in trade with the Asia Pacific region. In terms of nearby major cities, Vancouver and Portland only have Seattle (Table 15.8). Vancouver, separated by a series of mountain ranges to the east, is a 10- to 11-hour drive away from Calgary, the nearest city other than Seattle. Similarly, San Francisco, the closest West Coast major city to Portland, is between a 10- and 11-hour drive away from it, or more than 1,000km to the south. By comparison, Vancouver’s southern suburbs are less than two hours’ drive, or 160km, away from the northern urban area of Seattle. As a point of reference, the US/Canada I-5 border crossing is located a mere 40- to 45-minute drive, or 50km, away from downtown Vancouver. Virtually the entire population of the corridor lives within a one-hour commute to the I-5 or the connecting BC Highway 99. (Highway 99 was originally signposted to correspond with US Route 99.)
428
Table 15.8 Distance between Downtown Seattle and Other I-5 Corridor Cities Metro area
Km
Miles
Average Drive Time Good Traffic Flow 2 hrs 31 min
Seattle to Vancouver
229.5
142.6
Seattle to Metro Vancouver border crossing Seattle to Portland
179.9
111.8
1 hr 50 min
279.9
173.9
2 hrs 41 min
Seattle to San Francisco
1,300.0
807.8
12 hrs 53 min
1826.9
1,135.2
17 hrs 29 min
Seattle to Los Angeles Source: Google Maps, May 2015.
The I-5 goes through the heart of Greater Seattle and touches Portland. It is very heavily used and is the only major north–south corridor within the metropolitan areas of Seattle and Portland. Vancouver does not have a freeway within its downtown urban area. However, Highway 99, the extension of the I-5, does run through the Vancouver city centre, indeed within metres of the Canada Place cruise ship terminal and across the iconic Lions Gate Bridge, and eventually to the internationally known Whistler Blackcomb ski and recreation area and beyond. With increased tourist traffic on the I-5, it would make sense if Vancouver and Seattle considered constructing or allowing the private sector to construct parking structures on the edge of the city centres to allow visitors to park and take public transportation to the city centre. This approach has worked for many years in Europe. 15.4.3 Harmonized Border Clearance Procedures With increased traffic on the I-5 border crossings almost a certainty once the Massey Tunnel is replaced, an argument can be made that it is time for the two economies to consider harmonizing international border procedures at land border entry points. They could look into random checks at crossing points between linked cities such as Seattle and Vancouver or invest in technology to process transborder activity more quickly. This is already effectively happening with pre-clearance at Vancouver and other Canadian airports for entry into the United States, and an ‘enhanced’ driver’s licence programme in British Columbia and Washington State to help speed up transit time for residents. To obtain the driver’s licence, residents need only to present the required documentation and attend a face-to-face interview which takes approximately half an hour. The main border crossing on the I-5 between Seattle and Vancouver would be an ideal area for testing speedier approaches to transborder crossings and trade. An increase both in tourism and the shipment of goods would probably occur rather quickly. 15.4.4 Affordable Housing and Transport Housing affordability presents a real challenge to the region’s urban planners. Affordable housing and rental options for low-income households, supported by affordable transportation, is a shared goal of all three cities. Affordability has been a persistent problem, and one of the reasons that light urban rail transportation has been a priority.
429
The mass gentrification of the inner-city core of Vancouver and now Seattle and Portland is leading to a greener, more environmentally sound development in all three cities. However, inner-city high-rise developments are pushing up prices and completely changing many inner-city neighbourhoods. The housing affordability issue is not new, and it continues to be a major economic and social challenge, especially in Vancouver and increasingly so in Seattle. 15.4.5 Environmental Sustainability The Pacific Northwest is renowned for its pristine environmental assets. This includes significant forested areas, wilderness and the world’s largest temperate rainforest. Water is a significant environmental regional resource. The Pacific Northwest bioregion covers less than 10 percent of the continent but contributes between 20 and 25 percent of total surface runoff. Whatever the future pressures on economic development are, the natural resources of the region need to be protected for the ecological wellbeing of the continent. The region is a highly active geologic area in proximity to the Cascadia Subduction Zone – a fault that stretches from northern California to mid-Vancouver Island, located to the west of the city of Vancouver. It is a seismically active region and an area of damaging earthquakes, volcanic activity and landslides.771 The issues associated with the natural environment and those relating to future seismic activity are significant factors in the region and may have implications for future planning and economic development.
15.5 URBAN GOVERNANCE AND PLANNING The metropolitan areas of Vancouver, Seattle and Portland all provide leading examples of planning for urban growth management and sustainability in a North American and APEC context. This is linked to the existence of effective governance arrangements at the metropolitan level in each urban area. The core cities of Seattle, Vancouver and Portland are all relatively small within their respective metro census areas, with population bases of between 600,000–650,000 people. The involvement of numerous local governments and federal and state level governments in urban issues means that urban governance arrangements are important and raise many challenges. Growth management and urban transportation issues are very important as the increasing residential urban sprawl needs to be managed, and people need to travel to employment located in the urban core. 15.5.1 Metro Vancouver The Vancouver metropolitan area has a long history of regional planning and governance going back to the 1940s following devastating flooding in the Fraser River delta. The Greater Vancouver Regional District was established in 1968; and in 2007, it became known as Metro Vancouver. Metro Vancouver is a regional-level government which operates as a federation of local municipalities. It includes 21 municipalities, one Treaty First Nation and one Electoral Area. Municipalities appoint directors onto the Metro
430
Vancouver Board. The board has 38 directors, and each is allowed one vote for every 20,000 residents, up to a maximum of five votes.772 Metro Vancouver has statutory powers773 to provide a wide range of regional and urban services. These have been mandated up from municipalities or down from the British Columbia provincial government and include: water supply, sewerage, environmental regulation, regional parks and regional planning. They do not include regional transportation planning and services that are the responsibility of Translink, a separate statutory authority. The Greater Vancouver Regional District (and later Metro Vancouver) has been a world leader in planning for liveability and growth management. In the 1970s, the Greater Vancouver Regional District developed and operationalized the concept of Vancouver as a ‘Liveable Region’ based on an innovative and interactive process of community engagement involving the public, planners and politicians.774 These ideas have informed and inspired planning and plans in the region ever since and have underpinned Vancouver’s recognition as one of the world’s most liveable cities.775 They are expressed in the Metro Vancouver 2040 plan776 adopted in 2011 in terms of five goals and strategies, as follows:
Create a compact urban area
Support a sustainable economy
Protect the environment and respond to climate change impacts
Develop complete communities
Support sustainable transportation choices.
The Metro Vancouver approach has several key strengths. One is active collaboration by municipalities at the regional level. Members also benefit from joint borrowing on collective credit; the region respects local municipal autonomy where not in conflict with the regional purpose; and the regional arrangement allows for a united front in dealing with senior (provincial and national) governments. Challenges777 include: local municipal interests overriding the regional interest; failure to deal effectively with regional economic and social issues; lack of involvement by the provincial government; and a fragmented approach to planning and funding regional transportation. 15.5.2 Puget Sound Regional Council The Seattle metropolitan area is governed by the Puget Sound Regional Council.778 The council is a regional-level government established in 1991 by an inter-local agreement signed by all member governments. It includes four county governments (King, Kitsap, Pierce and Snohomish) and 76 cities, towns and tribal councils. An Executive Board of 32 representatives meets monthly. All mayors and elected representatives meet annually in a General Assembly to pass the budget and elect office holders. The council exercises some powers (e.g. land use) devolved upwards from local governments, and a wide variety of powers delegated down from the state of Washington
431
and the US federal government. These include powers in relation to urban growth management, air quality management and economic development. The council is also a federally mandated metropolitan planning organization for transportation planning and funding. The Washington State Growth Management Act applies to Seattle and sets out directions for metropolitan governance. It covers: designation and conservation of natural resource lands of long-term commercial significance designation and preservation of environmentally critical areas directing new growth to urban growth areas ensuring new developments are contingent on transportation and other public facilities requiring local governments to include essential public facilities or affordable housing in their jurisdictions. Under the Growth Management Act, the Puget Sound Regional Council has prepared a comprehensive growth management strategy called Vision 2040,779 which was adopted in 2008. Vision 2040 is a strategy and growth pattern for accommodating the 5 million people expected to live in the region by 2040. ‘People, prosperity, and planet’780 provide the central themes for the strategy and indicate that leaders of the Council will take into account social, cultural, economic and environmental aspects when making decisions. Some key strengths of the approach taken by the Puget Sound Regional Council include involvement in regional issues by member local governments and transport agencies; integration of land-use and transport planning and funding; and a regional approach to economic development. Some weaknesses and challenges include: continuing lowdensity urban sprawl outside of the urban growth boundary, failure to deal effectively with environmental and social issues, and growing urban traffic and freight congestion. 15.5.3 Portland Metro The Portland metropolitan area consists of Portland, Oregon, and across the Columbia River, Vancouver, Washington. Portland, Oregon is governed by Portland Metro Council,781 an elected regional-level government established by the state of Oregon in 1979. A major difference, therefore, between it and Metro Vancouver or the Puget Sound Regional Council is that the six members of the Portland Metro Council and its President are directly elected by the public.
432
Photo 15.6 Portland Waterfront
Credit: Richard McAlary.
The Portland Metro area incorporates three county governments (Clackamas, Multnomah and Washington) and 25 municipalities as well as unincorporated areas. The council has its own statutory powers in relation to land use, growth management, transport, solid waste, parks and open space. It also has powers delegated from the US federal government as a metropolitan planning organization for transportation planning and funding. Oregon has been a leader in urban growth management in the USA. It introduced the first state-wide urban growth boundary policy in the early 1970s aimed at protecting the state’s natural environment and beauty. This required the preparation of long-range plans addressing urban growth. In 1995, Portland Metro adopted a 50-year plan called the 2040 Growth Concept. Policies in the plan encourage:782
Compact development that uses land and money efficiently A healthy economy that generates jobs and business opportunities Protection of farms, forests, rivers, streams and natural areas A balanced transportation system to move people and goods Housing for people of all incomes in every community.
Some key strengths of the Portland Metro approach include: integration of land-use and transport planning and funding; a regional approach to economic development and the natural environment; and a clear regional focus and mandate by elected members. Members are elected to serve renewable four-year terms.
433
15.6 PARTNERSHIPS FOR SUSTAINABLE DEVELOPMENT There are many well-developed partnerships between governments, business and communities in the urban centres supporting the development of the corridor. The following describes some that demonstrate good practice elements of sustainability. 15.6.1 Federal Partnerships The most significant recent example of partnerships for development in the corridor is the 4 February 2011 ‘shared vision’ document released by President Barack Obama and Prime Minister Stephen Harper entitled ‘Beyond the Border’. This declaration articulated how the United States and Canada would work together to address threats while at the same time ‘facilitating the legitimate movement of people, goods, and services across our shared border’. To further strengthen the trade aspect of the shared vision, the White House released the declaration with the subheading ‘A shared vision for perimeter security and economic competitiveness’.783 The Civilian Extraterritorial Jurisdiction Act was also introduced to the US Congress in 2011 but failed to be enacted. This bill was reintroduced on 14 July 2014, but as of May 2015, had yet to pass the US Congress. Despite this lengthy process, the US Secretary of Homeland Security and the Canadian Public Safety Minister, on 16 March 2015, signed a new Preclearance Agreement which covers marine and rail, in addition to the existing air transport, among other enhancements to pre-clearance and joint or co-location of border security in small areas. The Preclearance Agreement specifically lists improvements at the British Columbia and Washington State border area, including enhancements to the rail link between Seattle and Vancouver. In the accompanying press statement released by the US Embassy in Ottawa, the US Secretary of Homeland Security described the agreement as ‘a major achievement that will produce benefits for the United States and Canada’.784 His Canadian counterpart stated that ‘it will enhance security at our border and create jobs and growth in Canada by improving the flow of legitimate goods and people between our two countries’.785 15.6.2 State- and Provincial-Level Partnerships At the state level, there are also numerous agreements that try to improve the restricted trade within the corridor. One such agreement is a memorandum signed on 9 October 2009 between Washington State and British Columbia entitled ‘Action on Regional Transportation Planning and Coordination’. This memorandum also refers to other agreements such as the 2006 British Columbia–Washington State Transportation Protocol and the 2008 British Columbia–Washington State Action Plan for Border Management.786 15.6.3 Municipal-Level Partnerships At the municipal level, there are also very positive signs of wanting to achieve greater inter-corridor linkages. The mayors of Vancouver, Seattle and Portland signed a ‘pact’ to lobby other levels of government to secure a high-speed railway service through the
434
Pacific Northwest.787 The mayors also lobbied for a second Seattle to Vancouver Amtrak Cascades service to remain in place following its temporary approval for the Vancouver 2010 Winter Olympics. This lobbying effort was successful and the second daily train service is now operating on a permanent basis. The Whatcom Council of local governments in north western Washington State shares the border with metropolitan Vancouver. As previously highlighted in Section 15.2.6.2, the council provides coordination and secretariat services on behalf of the International Mobility and Trade Corridor Program. It produces an annual Resource Manual that is a statistical compilation of cross-border activity within the I-5 corridor. The council receives funds from a wide range of sponsors and is credited with having lobbied for some USD 40 million dollars’ worth of service and infrastructure improvements in the border area of the I-5 corridor since its establishment in 1997.788 15.6.4 Joint Federal Authority for the Trans-Border Section of the I-5 Corridor There is no shortage of interested parties trying to improve bilateral trade and tourism in the I-5 corridor. What appears to be needed is a bilateral federal administrative body that has the authority and budget to make infrastructure and service improvements happen more efficiently and in a more timely manner. When a span of the I-5 bridge collapsed into the Skagit River in Washington State in 2013, a ‘State of Emergency’ was declared by the Governor of Washington.789 The bridge, located not far from the Canadian border and the I-5, was deemed to be a vital transportation link between Vancouver and Seattle, and in the national interest, needed to be repaired quickly. The total cost to repair the bridge was USD 19,844,383. The US federal government reimbursed USD 18,773,638 or nearly 95 percent of the total cost to Washington State, given the national economic importance of the bridge.790 This sort of federal fiscal intervention for the I-5 is an example of what could happen, and should be happening, from a preventative perspective, on both sides of the border to upgrade and enhance the I-5 corridor. 15.6.5 Strategy for the Development of Partnerships Given that the three main cities within the I-5 corridor are all striving to be world leaders in sustainable city culture, the sharing of information on ways to achieve this from some of the larger urban populated areas of the Asia-Pacific would seem an excellent start to a new form of city-to-city relationship, and could potentially be facilitated by APEC. Vancouver, for example, through its ‘Greenest City 2020: A Bright Green Future’ initiative, plans to become fully sustainable and the greenest city in the world within five years. The city planners refer to Vancouver’s international reputation as a ‘Mecca of green enterprise’.791 From Portland’s and Seattle’s planning documents, all three cities appear to be after similar accolades. Seattle and Vancouver have existing sister city relationships. However, neither Seattle nor Vancouver has had any new activity for almost 20 years, and neither are seeking to
435
enter into any new agreements.792 There also appears to be little ongoing activity in the sister city programme of Seattle or Vancouver in 2015. Portland does have an active programme, with nine sister city relationships and one ‘friendship city’ agreement. In a unique arrangement, all sister city associations must be operated through community non-profit organizations and be independently funded by donors and grants. No funding is provided by the city, but sister city associations must maintain at least USD 10,000 in their bank accounts, hold regular meetings and submit financial reports to the city through the Director of International Relations, who works in the Mayor’s office. The City Ordinance states these associations are ‘financially independent’ yet accountable to the Mayor of Portland.793 The funding issue may have been a factor in limiting the number of such agreements in other cities within the region, perhaps the Portland model could overcome this funding and sustainability issue. 15.6.6 Action Agenda for the Corridor The airports and seaports within the region have received billions of dollars in investment and are well-positioned for future increase in trade across the Pacific. On the other hand, there has been some neglect of the intra-corridor road and rail infrastructure compounded by more restrictive border security protocols since 2001. Truck and rail bilateral declared trade value through the I-5 corridor between Seattle and Vancouver in 2013 was USD 17.3 billion, excluding trans-shipment of goods between ports and the value of tourism expenditure. Given this, the governments of the United States and Canada need to find a way to resolve the border issues. The state of Washington and province of British Columbia, working with their respective federal governments, need to upgrade the road and rail infrastructure. Earthquake tolerant bridges and roadways should be a priority if only from a health, safety and disaster planning perspective. The 60-year-old I-5 and associated 100-year-old rail link infrastructure are critical to the future development of both US and Canadian bilateral and international trade in the AsiaPacific. Without a clear funded focus or a vision to improve this critical intra-corridor infrastructure, billions of dollars in the Asia-Pacific and intra-corridor trade and tourism will be foregone. The two Blaine ports of entry are designed to handle the I-5 traffic. Due to congestion at one entry, the Peace Arch border crossing has been limited to cars only and is the main tourist entry point. Together, the Blaine border crossings, approximately one mile from each other, handle the second largest volume of commercial and private automobile traffic between the two economies. The largest volume is the Detroit crossings, thousands of miles to the east. This section of the I-5 on either side of the border could be designated a ‘federal gateway secure highway’. For a distance of say 10km either side of the border, the highway could be controlled jointly by US and Canadian border services. Enhanced security screening could begin before an automobile reaches the actual border. Suspect vehicles could be pulled over for selected or random screening before reaching the traditional inspection
436
lanes operational at present. This pre-screening and video and physical screening of traffic prior to the actual border crossing could significantly speed up the border crossing process while enhancing security. Taking a page from airport duty-free shopping zones, a commercial, shopping and tourism complex could be created adjacent to the Peace Arch crossing. The revenues could go toward offsetting the cost of border highway improvements. The section of roadway designated as a secure gateway to enter the United States or Canada could also be subject to tolls collected either before entering or within the zone, with revenue shared between the US and Canadian authorities. The development of a Border Zone Highway Precinct could work financially, eventually self-funding border crossing improvements, and providing much more efficiency in handling security and screening than is currently possible. 15.6.7 Potential APEC Partnerships With so many of the world’s leading companies operating in this corridor, and the larger state and provincial economies so dependent on trade, there would appear to be almost unlimited opportunities for commercial partnerships. With the value of just the top ten publicly traded technology companies within the corridor already exceeding USD 600 billion,794 and the thousands of technology start-up companies there, no scale of project would seem too large (or too small). Consultations with Japan Railway to assist on costings for a new high-speed rail link between Seattle and Vancouver is but one of the many hundreds of opportunities for joint commercial ventures between APEC member economies and the I-5 corridor economic area. Tourism development could be another area for potential APEC partnerships, especially as the fastest growing source of international tourism is from APEC member economies. Tourist spend in the west coast of North America by visitors from China and Japan alone is estimated to exceed USD 3 billion in 2015.795
15.7 CONCLUSIONS Blessed with a temperate climate, stunning scenery and ample job opportunities, the region is currently experiencing rapid growth, and the ties to the Asia-Pacific are real and growing. The cities in the region, relatively speaking, are well-run, safe and environmentally clean. Strong planning regulations have been in place for many years in the core cities. The innovativeness of local industry and commitment to a sustainable urban environment are well established within the population. Goals of being the ‘greenest’ business or ‘most liveable city’ have been achieved and are being built upon by citizens and all levels of government. The provision of basic needs such as electricity and clean water are not currently an issue. Ample water supplies and renewable hydroelectric generation are a feature of the region. The region does however still have areas to be addressed, including urban sprawl issues such as affordable housing, increase in traffic congestion and other social issues such as homelessness.
437
Billions of dollars in new infrastructure for seaports and airports in the corridor have also been invested, and the economy of the region is reaping the financial benefits. Among all these positive developments in economic and environmental sustainability, the glaring weakness is the relative lack of attention given to the inter-regional road and rail infrastructure between Seattle and Vancouver. The railway right of way for freight is founded on a former economic base, and even the rail beds are over 100 years old in places. The I-5/BC Highway 99 infrastructure was built between 1954 and 1959, making the design, construction and load forecasts 60 years old. Immediate attention and billions of dollars will need to be spent on this critical infrastructure. A shared federal vision is needed to better link Seattle and Vancouver. Other than the obvious replacement and updating of existing I-5 corridor infrastructure, the demand for better transportation methods is also real. A high-speed rail link along the corridor would enhance the region’s development beyond the predictions of any current economic model. Finally, there is the reality that the enhanced security procedures at the border between the United States and Canada implemented over the past 15 years are proving economically harmful and a detriment to both trade and tourism in the area. New innovative ways need to be found to satisfy the necessary security issues at the I-5 fixed border crossings and the handling of inter-port transfer of goods within the Seattle and Vancouver economic zone. This is not just a local issue but a challenge of economic significance to the national economies of the United States and Canada.
438
16. Sustainable Development Agenda for APEC Cities Brian Roberts, Michael Lindfield and Florian Steinberg
The 21 APEC member economies located around the Asia-Pacific region make up almost 46 percent of the world’s population and produce more than 58 percent of its economic output. Most of this output occurs in cities, especially large cities. With more free trade agreements signed between APEC member economies, the prospects for the region’s future development and its cities appear good. However, the development of the cities in the region have proceeded largely without regard for sustainability. Many cities face significant challenges in managing problems related to urbanization, the environment, human capital, governance and infrastructure shortage. There is rising income disparity, unemployment and an ever-present threat of terrorism. These pose significant threats to the future sustainability, prosperity and livelihood of people living and working in the region’s cities. This study set out to investigate the dynamics of the changes occurring in the cities and growing urban economic and trade development corridors of the region. Using an urban systems approach to analysis, the various chapters have identified issues and development partnership practices that support the operation and management of sustainable cities in the APEC region. The findings have added to the knowledge about cities in the region, and especially to the growing importance of fostering wide-ranging partnerships to support the sustainable development and management of cities. The findings and lessons gained from the research reveal opportunities for APEC to work with cities within an Asia-Pacific Partnership to support the sustainable development of cities in the region. A rationale for APEC to lead the development of a new agenda and paradigms for developing sustainable cities in the region are outlined, followed by a vision, framework and roadmap for implementing an APEC urban agenda. The agenda calls for APEC to lead an initiative focused on Building Better Partnerships for Inclusive and Sustainable Growth of Cities in the APEC Region. This agenda will encourage more collaborative approaches to urban development and management; trade, economic and investment linkages and partnerships; knowledge sharing and problem-solving; and innovative ideas for green, inclusive and creative cities. The agenda will help make cities more dynamic, liveable and sustainable places for people to live, work and do business. The conclusion to the chapter calls for action by APEC to move forward on this agenda.
16.1 FINDINGS FROM THE CASE STUDIES OF APEC CITIES The case studies presented in the preceding chapters identify some common factors affecting the sustainable development of cities in the APEC region and highlight the need and opportunities for action. The findings of the case studies clearly indicate that, despite the overwhelming importance of cities to the economies of the region, there is still a poor understanding, at
439
all levels of government, of the structural base for local economies, and how to manage the economic base of cities to proactively support competitive, inclusive and sustainable urban development.
16.1.1 Key Issues Affecting the Sustainability of APEC Cities The research shows that the analytic, policy and implementation shortfalls of national and city governments have resulted in many of the region’s cities failing to achieve their potential as drivers of national economies. The current approaches to urban development are, in most cases, not having a significant impact on entrenched problems of inequality, poverty, under- and unemployment, and better living conditions for all. The cities of the region, in general, are not providing the economic and social infrastructure needed to create new enterprises and trade development, investment and endogenous job growth opportunities. These issues, together with poor metropolitan and urban governance and planning, severe congestion of networks and service failures, are adding to the transaction costs of production and externality costs in cities across the region. Efforts to address climate change and environmental issues, and create greener economies, have been inadequate. Ways to scale up promising initiatives to address these concerns at national and regional levels must be found. Cities in the region are failing to make sufficient provision for the social infrastructure needed to maximize the productivity and inclusiveness of their human resources. They are also failing to preserve the social and natural capital on which they depend for future development. Sustainable development is recognized as an important issue for cities, but the efforts by cities to become more sustainable are not sufficient to reduce the negative externalities resulting from rapid urbanization, congestion, housing shortages and rising inequalities. On the positive side, cities in the region are remarkably creative, innovative and competitive in attracting business and investment when compared to other regions. Many have shown remarkable resilience in the face of natural and man-made disasters, and global economic shocks, to recover and grow back into healthy and dynamic cities. Christchurch in New Zealand and Yogyakarta in Indonesia are examples of cities that have suffered severe earthquakes and had strong recovery pathways. Cities in the region have also come through the 2007 global financial crisis better than any other region, but the continuing economic downturn will continue to challenge them. The case studies illustrate significant opportunities to improve the productivity and liveability of cities in the region. In many cities across the APEC region, a range of partnerships are emerging that demonstrate strong elements of sustainable city development. Some cities have advanced into developing collaborative networks for economic cooperation and trade partnerships. However, most cities do not realize their full development potential, which suggests that there is scope for new policies and initiatives that foster greater collaboration in leveraging resources and infrastructure so as to increase creativity and innovation and enhance the social contracts that give greater protection to the vulnerable and disadvantaged.
440
If the cities of the APEC member economies are to become more sustainable, ways to realize the latent potential of cities need to be addressed through a range of policies, plans and actions by governments, business and communities. The global economy is evolving rapidly under transformative social, technological and climate changes. Exogenous growth models, even in successful examples such as China, have been found to have limits in relation to propelling economies past ‘middle income’. Endogenous growth models will be needed for the next stage of development. Such models rely on acquisition, adaptation, dissemination and adoption of new techniques and practices in key industry clusters. But, despite the far-reaching international relations of their enterprises, the strategic infrastructure of most cities does not support international learning and their links are mostly confined to symbolic sister city relationships. Fostering improved linkages is a national economic priority but, generally, is not seen as such. Good policy depends on good data and analysis. In this area, shortfalls occur in the measures and dimensions of city assets, product data, trade data, and data on natural capital; and in the techniques of analysis that enable formulation of appropriate economic, environmental and social policy. Effective partnerships for gathering, sharing and assessing data are needed, but do not exist. 16.1.2 Challenges in Implementing Sustainability On the implementation front, the major shortfalls identified by the study that are resulting in the mediocre performance of cities include:
Limited role of city-to-city partnerships: While there appear to be many sensible theoretical reasons why city networks and partnerships could make a contribution to lifting regional and national economic outcomes, the case studies and other literature have found little hard evidence of them actually doing so.796 The case studies present good examples of sustainable development practices, but very few demonstrate how these could be applied at the scale of a city or national system of cities. Partnerships between and among cities and regions on trade and economic development, such as the Mexico City–Chicago trade agreement, are significant avenues for scaling up and applying the good practices that could improve economic and sustainable development outcomes for cities across the Asia-Pacific region. Inefficient hierarchy of urban systems: The dominance of one very large city, e.g. Jakarta, tends to multiply agglomeration diseconomies and intensify underutilization of enterprise and human capital in smaller cities. The lack of institutions to manage trade corridors constrains national and international economic opportunities, and is also a contributor to such problems. The development of trade corridors comprising networks of linked and interdependent cities is an emerging phenomenon; the challenge lies in how these are developed and managed. The Jing-Jin-Ji Region, the Pearl River Delta, the Vancouver– Seattle corridor, the Bangkok to Ho Chi Minh corridor, and the Mercosur trade development corridors are vital to fostering trade and development between cities. However, managing, financing and developing these will be a significant
441
challenge, which is best addressed through partnership arrangements between the governments of APEC member economies and city governments. Inappropriate urban form: Many cities have evolved toward lower-density, high-carbon and dispersed forms of urban development which are environmentally unsustainable and economically inefficient. Poor integrated metropolitan planning of land use and transport, ineffective logistics solutions, and weak management and governance are the primary causes of such problems. The chapters on Mexico, Lima, Auckland and Manila all show that urban sprawl adds to the costs and challenges associated with congestion for business, government and communities. An increase in urban density and consolidation of development are vital to improving the sustainability of development across the region. Ineffective development and implementation mechanisms for strategic infrastructure: Infrastructure investment tends to be opportunistic and ad-hoc, and lacks the context of a ‘nested’ set of integrated metropolitan plans, asset management plans and local development plans. Private sector and community inputs are not systematically and properly canvassed in respect of such investments. Investments are also not subject to public and transparent analysis that would relate to performance criteria established under the plans. Established cost-benefit techniques and implementation mechanisms are also neither inclusive nor do they have the necessary mandates to effectively implement the planned investment. Systemic issues in meeting financing needs: Financing is an important element of sustainable development plans, but one that systems at all levels do not appear to be adequately prepared to address. Many city governments do not have revenue-raising mandates in line with their city infrastructure needs. Local governments also have no incentive to maximize tax yields or to leverage private and community resources. Many of them do not have strategic and asset management plans; but where such plans exist, the financing required to realize those plans have seldom been fully estimated. In the case of enterprises, those in secondary cities often have less access to funding for investment; and micro, small and medium enterprises have restricted access to investment no matter where they are located. Poor information and data: Information and data are the new energy required to manage and operate the world’s cities in the twenty-first century. However, there is a lack of good data on cities in the APEC region, especially the smaller cities. Without reliable data, especially economic data (e.g. trade, value of public and private investment, value of private transfers), it is difficult to conduct market research and achieve better planning. It is not just government and larger corporations that need better access to data. Micro business and the urban poor also need better and more equitable access to information and data to play a more direct role in service-orientated urban economies in the region. Equity, social justice, and inclusiveness: The right of citizens to participate equitably in their city’s development and to benefit from it, especially in APEC cities in middle-income economies, has been denied to many. The poor, women,
442
children and the poorly educated are barred or severely restricted from access to essential services, justice, training and other needs that could significantly enhance their employment prospects, incomes and wellbeing. Many are marginalized and excluded from meaningful participation in governance and other decision-making processes that shape the development of their cities. Many just live in urban areas because there is nowhere else to go, but feel little sense of ownership, pride or belonging to the cities in which they live. These urban residents are usually a silent majority. However, the distaste of being forced to live in low-cost housing estates, ghettos and slums, and the sense of being forgotten and hopeless, could turn into an urban cancer that could develop into violence and anger. Recent elections in several APEC economies bear testimony to how the failure of governments to address equity, social justice, and inclusiveness could destabilize markets, economies and social systems in cities across the region. The approach used in this report to analyse the sustainability of the region’s cities involved an extensive literature review and case studies. Case studies are an excellent learning tool for studying the way cities in the APEC region address and adapt to problems that impact on the sustainability of urban development. Fourteen case studies were prepared, each of which investigates the five elements for sustainable city development, namely, governance environment, physical environment, economic environment, social environment and natural environment. The case studies identify examples of good practice in cities and economic development corridors in the APEC region, and a selection of these are summarized in Table 16.1. There are, however, too few such examples of good practice. A survey of the literature finds that most good practice examples are found in only a few cities and in limited sectors of the economy, e.g. urban finance in Auckland, and very few are documented for smaller cities. Gathering more examples and knowledge of good practices is vital to enable the APEC member economies to learn how to adapt better to disruptive technologies, ‘megatrends’, and social, climate and technological change, and to support the development of ideas, policies and actions to underpin a more broad-based approach to urban development that could have a transformative impact on APEC cities. In each of these areas, partnerships among APEC economies and cities could facilitate better knowledge and practical action to improve outcomes. Limited examples of such partnerships exist and have been discussed in this report, and the preceding 2014 APEC report document.797 However, there is not, as yet, a systematic effort to address the scope of issues required to promote sustainable urban development in APEC. APEC, as the representative organization for 21 economies in the Asia-Pacific region, should play a leading role in facilitating partnerships for the development of sustainable cities.
443
Table 16.1 Examples of Development Partnerships from the Case Studies of APEC Member Economies City
Economic
Auckland
Regional Business Partnerships: Established by New Zealand Trade and Enterprise to support SMEs throughout the region
Bandung
Sister Cities Partnership Programme
Brisbane
Free Trade Agreements: International partnerships encouraging trade and economic competitiveness
Kitakyush u
Yellow Sea Partnership: An East Asian network for economic interaction
Lima
Alliance for the Cooperation of Euro-Latin American Cities. Strengthening city cooperation to improve public policy and development in LAXC cities Philippine Competitiveness Council: Boosts innovation and business support for sustainable development
Manila
Mexico
Santiago
Seoul
Global Cities Economic Partnership: Sister city alliances, both international and crosscontinental Free Trade Agreements: International partnerships involving free trade and encouraging trade and economic competitiveness International Sister City Partnerships: With 23 sister cities globally
Physical
Social
Auckland North West Transportation: Auckland Council and Royal New Zealand Air Force collaboration to redevelop unused air force base High Speed Train (Jakarta– Bandung): Public–private partnership project to reduce travel time, vehicle emissions and private travel between the two cities Public-Private Partnerships: To improve the sustainable development of strategic infrastructure and physical development Marine Transportation Network: Maintains 'sister-port' relationships nationally and internationally
Auckland Regional Settlement Strategy: Collaborative strategy and partnerships for migration and integrated public relations
Environmental Auckland Environment Observatory: University of Auckland and Auckland Council partnership for regional natural resource management
Bandung Social Media Command Centre: Partnership with IBM and Bandung Institute of Technology (ITB) to improve public services Local Area Multicultural Partnership (LAMP): Integrates multiculturalism and promotes intercultural relations in the region
Governance Core Cities Network: Removes barriers and allows business to grow develop and create high-value jobs
Bandung Integrated Resource Management (BIRMS) is an integrated governance system for managing development Healthy Waterways Network: Multiple levels of authorities and communities working to improve river water management
Local, State and Federal Government Collaboration: Holistic governance leading to sustainable development.
Kitakyushu Asian Centre for a Low Carbon Society: International partnership to promote a low carbon society
The City Assembly: Members of the board from seven wards to address sustainable development challenges and policy responses
The Philippine Agenda 21: Collaborative initiative to address broad sustainable issues with particular attention to clean water and sewerage PROAIRE: Intergovernmental partnership to improve air quality and reduce pollution
Metro Manila Green Print 2030 Integrated Strategy for Development Partnership: Between 17 cities and municipalities in the megacity region Mexico City Green Plan: Backed by the UN and the World Bank, the initiative with the government is to make the city more sustainable
International Gastronomic Fair: The Annual International Gastronomic Congress, Qaray, attracts renowned international chefs Public-Private Partnerships: To increase and aid the sustainable development of strategic infrastructure and physical development Suburban Train: Federal Government, Estado de Mexico and Federal District partnerships to build a significant infrastructure project Private-sector Partnerships: To provide sustainable strategic infrastructure development including toll-free transport networks
STEP-UP: Private-sector partnership for slum upgrading in Metro Manila.
Santiago Transportation Green Zone Initiative: Collaboration between the Chilean and UK governments that aims to reduce greenhouse gas emissions Sustainable Policy Initiative: Focuses on environmental management, economic
Private-sector Partnerships: To provide sustainable strategic infrastructure development – Nambu Express Line
444
Collaborative Government Initiatives: Collaborative initiatives in all areas of governance
City
Economic
Physical
Social
Environmental
Governance
development and improved social equity Taipei Clean Air Initiative: Aims to reduce air pollution and create a more sustainable city
Taipei
Ho Chi Minh City
Beijing
Southern Economic Corridor: An important trade corridor between Bangkok and Ho Chi Minh–Vung Tau Free Trade Agreements: International free trade agreements promote trade and encourage competitiveness
Pearl River Delta
Hong Kong SAR CEPA: Free trade agreement between Hong Kong SAR and the PRC government
Vancouver
2015 Seaport Alliance Partnership: For unifying the operations of terminals in the Port of Seattle and the Port of Tacoma
Public-Private Partnerships: To increase and aid the sustainable development of strategic infrastructure and physical development Public-Private Partnerships: To improve the sustainable development of strategic infrastructure and physical development Interstate I-5 Corridor: Crossborder highway involving public and private partnerships and intergovernmental management
Metropolitan Partnership: Taipei to New Taipei collaborative governance partnership to ensure smooth running of the cities in parallel
Government-to-Government Partnerships: Cooperative governance and administrative autonomy Institutional partnerships: Information and knowledge sharing, interconnected university systems and research
Source: Authors.
445
NGO Partnerships: World Bank funding to address water pollution in the Pearl River Delta; Greenpeace researching Pearl River Delta poisoning levels Climate Action Plans: Corporative structure to mitigate and adapt to climate change
Beyond the Border: Intergovernmental partnership for managing cross-border threats, security and people and good movement
In shaping an agenda for such partnerships, the key economic, spatial, social, environmental and governance dimensions need to be addressed. Cutting across these are the issues of climate change, public–private partnerships, community involvement, risk and resilience, and knowledge sharing. The potential form of such an agenda is presented in the following section. Finally, partnerships must be flexible, especially when dealing with the need to respond to change and destabilizing events. The best-case studies examined by the research show that partnerships need to be innovative, focused, responsive and progressive. They need to be inclusive and accountable in their governance arrangements. Partnerships for sustainable urban development also need to recognize that there comes a time for renewal and closure when a better solution comes along.
16.2 NEED FOR A NEW AGENDA FOR APEC CITIES The case studies presented in this report highlight some of the significant development difficulties facing many cities in the region. The current economic model – based on Kuznets’ 1955 postulation that increasing levels of economic output over time will eventually reduce income disparity – is being challenged.798 The relationship between the level of urbanization and GDP per capita growth does not seem to follow the model in the case of some economies and cities.799 Many cities are experiencing rapid population growth, but without commensurate reduction in income disparity.800 Significant revenue and wealth disparities are also occurring between cities, especially in economies where more than one-third of national economic output is produced by one or two very large cities. Such concentration of wealth and economic output in a small number of large cities has the advantage of creating strong agglomeration economies, where scale can reduce transaction costs and offer a competitive advantage. However, the over-concentration of economic activity in one large city is a very high-risk urban development strategy, as was shown in Bangkok in 2011 when the production system was severely affected by a major flood event. Many large coastal cities in Asia and Latin America are among the most vulnerable in the world to the impacts of natural disaster and climate change.801 In the event of a major disaster in the capital cities of the Philippines, Indonesia, Chile, Mexico or Japan, the national economies would struggle to recover. Existing insurance and reinsurance arrangements would not be able to meet the full recovery costs of a disastrous event that destroys as much as 50 percent of a nation’s economy. The current economic development model for cities in the APEC region, based on everincreasing levels of investment pouring into megacities and large metropolitan areas, is also severely disadvantaging the development of secondary and smaller urban settlements which make up the national and regional system of cities. As a consequence, inequalities are widening throughout the region. Given the problems with the current development model, new thinking and new approaches are called for. In arguing the need for APEC to play a lead role in setting a new agenda for the sustainable economic and physical development of cities in the region,
446
it is recognized that this will be challenging. The agenda will need to apply the principles of collaboration, cooperation and openness that ensure mutual benefit, respect and equality among the cities of member economies. It will also have to account for change and reform taking place over an extended period of time. While there are no short-term solutions to the development problems of cities in the region, many efficiency gains can be made through improvements in technology, maintenance practices and governance. Given improved governance and financial arrangements, it may take 30 to 40 years to replace existing inefficient urban and energy systems, infrastructure and utilities, based on the average lifecycle for replacement of the built environment and the ability to raise capital to fund improvements. No city has all the answers, but many exhibit areas of good practice. To consolidate, draw on and adapt these practices, the agenda will also need to support an exchange of knowledge, peer learning opportunities, joint projects and investment opportunities in activities of mutual benefit.
16.3 PRINCIPLES UNDERPINNING A SUSTAINABLE DEVELOPMENT AGENDA FOR APEC CITIES If the development of cities in the APEC region is to become truly sustainable, member economies need to agree on a set of principles to guide development. Cities and economies of the region are becoming increasingly interconnected and interdependent and can no longer act independently without affecting the activities of other cities. Cities in the region are linked to intricate networks of cities, where political boundaries are becoming less relevant in decisions that affect trade, investment, travel, and environmental issues such as climate change. The region is moving very rapidly towards a new model based on a shared economy, which requires all cities to be much more responsible for their actions and the impact these have on people, economies and the environment. A principle is a set of conventions, practices or behaviours that has to be, or usually is, followed in a way that actions and decisions taken by governments, business, communities and individuals are intended to realize benefits for all. Principles enshrine ethics, customs and good practices that should be adopted and enacted when the consequence of a predictable event occurs that will be harmful to a city’s urban systems. The principles of sustainable urban systems must be understood by those responsible for planning and managing the cities of the APEC member economies. This understanding is essential to maintaining the order, balance and stability of the system and its effective operation.802 While there are no universal principles for developing sustainable cities, several cities have established principles to provide a foundation for the sustainable development of their cities. The Metropolitan Green Plan for Manila, for example, sets out 10 principles covering a common vision, mobility, good governance, empowerment, smartness, etc.803 Other studies document various principles for the development of sustainable cities.804 Drawing on the examples and lessons gained from the case studies in this report and the
447
literature, some guiding principles can be developed for a sustainable development agenda for cities, as outlined below.
In respect of economic issues: o Progressively moving to a model of urban economic development based on the sharing economy and collaboration, and providing individuals, corporations, non-profit organizations and governments with information that enables the optimization of resources through the redistribution, sharing and reuse of excess capacity in goods and services. o Enhancing the investment environment through improving human capital productivity, providing value-for-money infrastructure services, and keeping bureaucracy to a minimum. o Fostering innovation by providing the research and development support appropriate to the industry clusters in the urban area. o Building a strong framework of business support services and encouraging the establishment of a full range of financial services accessible to the spectrum of the enterprises in the city. o Planning, financing and building resilient strategic infrastructure appropriate to the industry clusters in the city and the systems and institutions for managing that infrastructure efficiently. o Fostering collaboration between cities in response to the development of the emerging sharing economy. In respect of physical development issues: o Fostering increased urban density and polycentric structures for the development of cities. o Fostering public transport orientated development along urban development corridors. o Encouraging the growth of economic and trade development corridors but ensuring also that secondary and smaller cities have the opportunities to advance as economic and logistics hubs to ensure a wider distribution of development benefits. o Fostering improvements in infrastructure that improve the efficiency of logistics, movement and business systems and increase safety in cities. o Fostering integrated development planning for cities, metropolitan regions and corridors. In respect of social issues: o Building a model of collaborative governance and consumption in which urban societies have more equitable access to products or services, rather than ownership and wealth being tied up in the hands of a few. o Building community consensus on safety, social inclusiveness and environmental objectives. o Developing a safe, healthy environment; educated, engaged and empowered citizens; and enabling frameworks conducive to knowledge and enterprise development.
448
In respect of environmental issues: o Delivering the environmental infrastructure, healthcare, education, water and power, and management systems to support innovators and investors. o Fostering low-carbon development. o Bolstering enterprise and community resilience in the face of climate-related and other types of disasters. In respect of governance issues: o Building transparent, accountable and collaborative urban governance systems that can span the spatial scope of the economic organization from cities to economic corridors between economies. o Undertaking planning, programme and project development, financing and implementation oversight for inclusive, resilient and climate-change responsive development. o Encouraging partnership programmes that support the sustainable development of cities in terms of both scope and scale.
The above principles provide the foundation for developing more sustainable, inclusive and equitable economies across the region. Not all cities in the APEC region will be able to apply these principles in the short term, but all cities in the APEC member economies have agreed to work toward achieving the UN Sustainable Development Goals, especially Goal 11, which is to ‘make cities and human settlements inclusive, safe, resilient and sustainable’.805
16.4 FIVE AGENDAS TO SHAPE PARTNERSHIPS FOR SUSTAINABLE CITIES The framework for sustainable city development used to analyse the economic, physical, social, environmental and governance systems of cities in each of the case studies can be used also to shape the agenda for creating partnerships for the sustainable development of cities in the region. Using a systems approach to shaping an urban agenda for APEC that supports partnerships for sustainable development of cities is entirely consistent with the approach being taken by international development agencies like the World Bank, regional development banks and the United Nations. The issues and challenges facing the development of cities in the region can be grouped under the elements of the framework for sustainable city development as five primary agenda areas: economic, physical, social, natural (environmental) and governance. These agenda areas are described below. All agenda areas are equally important to improving the sustainability of cities in the APEC region; none can be said to dominate, or be of lesser importance, when formulating strategies and actions for the sustainable development of cities in the region. While many agenda items will be common to national systems, priorities for implementing urban agendas will be city-specific. Many of the items listed for attention or action in each agenda system have been identified by the case studies. Others were identified from published research and reports. Most will require implementation in tandem with other
449
agenda items. Complementarity in implementing agenda items will be vital if more sustainable development outcomes are to be achieved. In practice, this means addressing problems in an integrated, cross-sectoral manner. 16.4.1 Economic Development Agenda The economies of cities are their existential backbone. Strong local economies are key to sustainable urban growth, and the ability of cities to innovate and transform. In the advanced cities studied in this report, such as Auckland, Vancouver, Seattle and Kitakyushu, all levels of government were very actively engaged in local economic development. Such multilevel engagement will be required on a range of issues. Reliance on one factor, e.g. real estate. The competitiveness of cities is being undermined by poor urban services and governance systems, a slowness in embracing economic reforms, and high business transaction costs. Many cities are not competitive and rely on real estate to boost economic development. Examples include Manila, Lima, Auckland and Brisbane, where significant amounts of domestic and foreign direct investment into land and property are driving the value of property markets up to unsustainable levels, leading to housing affordability problems and increasing wealth and income disparities. The trends are similar in other major cities in the region. Land speculation has become a significant problem for cities in the region because of the failure of governments to tax wealth. Over-investment in real estate has the disadvantage of directing investment away from less prosperous industry sectors and is costing the region millions of jobs and depriving governments of potential revenue to provide public infrastructure, goods and services. These are arguments developed by Piketty on the need for the redistribution of wealth.806 Wealth capture and ensuring that more funds are directed into productive, albeit lowerreturn, industry sectors are vital to enhancing competitiveness, ensuring economic diversity and expanding urban capital markets and jobs in the region’s cities. These are important economic agenda items that an APEC partnership for urbanization and sustainable cities must address. Trade barriers. National governments have a crucial role to play in removing barriers to trade, encouraging cities to become more competitive and addressing blockages in logistics systems. However, it is in the cities that barriers to trade are much more difficult to remove, especially in metropolitan cities, which have different tiers of government, some of which are on opposing sides politically. Efficient intermodal freight and passenger logistics systems are critical to enhancing opportunities for trade and investment. Brisbane’s, Vancouver’s and Singapore’s logistics systems are among the most efficient in the region, adding to the competitiveness of these cities. However, in many other cities, poor local regulations, slow issue of permits and licences, and inefficiency of land administration systems affect local business transaction costs. Investment. National government support for foreign direct investment in many of the leading APEC member economies is strong, but on balance, most cities do not benefit from this. In Asia and North America, the bulk of foreign direct investment flows into the major port cities.807 Secondary (and inland) cities, in particular, are struggling to establish the enabling conditions for investors, developers and visitors. Consequently, many of the
450
development indicators for these cities are falling behind the larger cities, creating an equity gap in the systems of cities. The sustainability of APEC cities could be improved by tapping into the resources generated by their economies and by focusing on initiatives that facilitate the creation of competitive advantages attractive to capital, skills, development and visitors. Innovation and business support. Innovation and support for business are critical to supporting sustainable city development. Without mechanisms and support services to grow, develop, diversify, manage and respond to risks and shocks, cities can easily enter a stage of decline, from which recovery is difficult. Some cities in the APEC region are finding it difficult to accommodate structural adjustments. Governments of many member economies provide incentives, grants and other support to business development through the development of export processing zones, business parks, eco-parks and innovation/research and development centres. However, there is a lack of a coordinated effort, and resources are spread too thin. More needs to be done to encourage greater coordination and collaboration, through the development of competitive industry clusters, collaborative research by public–private partnerships, reforms to intellectual capital regulation, targeted industry grant schemes and risk management. Collaborative networks and systems. There is a need also to support city-to-city learning in respect of innovation and collaborative business development. The lessons that could be drawn from regional experiences with projects that take advantage of improvements in communication, transport and logistics systems need to be synthesized and disseminated. The world is moving into the age of the shared economy. Developing network partnerships for trade and investment; open platforms for access to data, knowledge and information sharing; and co-investment in infrastructure, utilities and services are vital to the development of collaborative networks and systems. The sharing economy. This is a new paradigm of economic development, as business and governments seek ways to reduce transaction costs, and minimize energy consumption and use of non-renewable resources. ‘Access over ownership is the mantra of the sharing economy: a sector based on peer-to-peer lending, borrowing, exchange and collaboration. The idea is not new. But the technology which now facilitates and formalises these exchanges is.’ 808 It is no surprise therefore that ‘Uber, the world’s largest taxi company, owns no vehicles. Facebook, the world’s most popular media owner, creates no content. Alibaba, the most valuable retailer, has no inventory. And Airbnb, the world’s largest accommodation provider, owns no real estate’.809 Whole-of-government approach. Key agenda items needed to support the development of sustainable urban economies in the APEC region include: a whole-of-government approach to creating strong, dynamic and flexible business enabling environments; support for innovation, research and development; a focus on city-to-city partnerships; and the need to embrace the shift toward the shared economy. Intersections with other agendas. Education and health in particular cross-cut the economic agenda, largely determining the productivity of the labour force; but increasingly the environment plays a role in determining a city’s attractiveness to investment.
451
16.4.1.1 Action Agenda Items – Economic Development The city and corridor studies show that many reforms and changes in approach are needed to support a more sustainable economic development agenda for APEC cities. Major action items are described below. All will need to be actioned at both the city and regional or systems-of-cities levels.
Economic Development Corridors It is essential to understand the economy of corridors with a focus on: (i) major transit corridors within cities; (ii) city regions or urban areas; and (iii) emerging trade development corridors. More comprehensive spatially tagged statistics on the labour force, production and trade are needed as the basis for such analysis.
Industry Clusters The various stakeholders involved in cities must be identified. Ways of engaging these players in policy dialogue on economic development need to be designed and an analysis carried out of the driving factors and supply chain systems supporting each major cluster. In the absence of comprehensive data, stakeholders can provide significant and useful information as a basis for preliminary assessments.
Investment Enabling Actions Given the opportunities and constraints identified for the major clusters, the next step is to determine priority investments and enabling actions and to assign responsibility for implementing them. In this activity, all levels of government should be involved, as action will be required at all levels. A public–private body should be the focus for oversight of this implementation process. Such collaborations already occur in cities such as Seattle, Vancouver and Sydney.
Competitiveness of Cities Enhancing the competitiveness of cities will require an analysis of: o The changing nature of city competitiveness in APEC cities o Collaborative advantage, being the new agenda for sustainable cities.
Value Adding Urban economies will require greater support for: o A stronger focus on fostering endogenous growth and import substitution o The growth of innovative, creative and smart industries.
Property Markets Property markets require reforms to ensure: o Better security of tenure, especially for tenants
452
o Transparency and accountability in land administration and management o Fair market value applied to all land and property.
Financial Markets Financial markets need to be assessed on their ability to deliver: o o o o
Access to enterprise finance, particularly SME finance Access to more affordable microfinance Regulated bond markets Leveraging/sinking (future) funds, e.g. the Chicago Infrastructure Trust.
The Third Industrial Revolution Economy There is a need to plan for the major changes in technology that will fundamentally change the way of doing business in all member economies, especially relating to the introduction of 3D printing; advanced computer usage in manufacturing and design; artificial intelligence systems; robotics; distributed energy generation and storage; and new materials.
16.4.1.2 Partnerships – Economic Development Partnerships among APEC cities can foster a consistent and rigorous approach to the above processes and support the public–private collaborations central to implementing them. Such partnerships already exist; an example is the International Regions Benchmarking Consortium. These can be developed with the assistance of the governments of APEC member economies. 16.4.2 Physical Development Agenda Infrastructure deficits. Infrastructure is crucial to the development of cities. However, some types of infrastructure are more important to the development of urban economies than others. Strategic infrastructure consists of hard infrastructure, such as physical assets and equipment, that are necessary for cities to develop the export sector or rapidly growing sectors or clusters of the local economy. It also comprises the software to run the hard infrastructure. Soft infrastructure includes the technologies, institutions, utility services, knowledge capital, administrative quality assurance, research, and the operations and maintenance systems for hard infrastructure. Nearly all cities in the APEC region have a shortfall in strategic infrastructure. In Asian and Latin American member economies, the deficit in infrastructure runs into trillions of dollars. In developed member economies, logistics, enabling environments and integrated planning are priority areas for addressing issues such as ageing of infrastructure, congestion and capacity. In developing member economies, high priority concerns for sustainable city development include integrated planning and development, provision of strategic infrastructure, management of peri-urban areas, the protection of utility corridors and value capture. The alignment of soft infrastructure to support city-to-city trade and investment is generally poor across the region and needs improvement through shared standards, systems integration and removal of trade barriers.
453
Asset management and maintenance. Many cities have no record of the infrastructure they own, where it is located, and its age, condition, replacement value and real operational costs. Some parts of the urban infrastructure systems in the developed economies of the region are over 100 years old and in urgent need of retrofitting or replacement. The lack of attention to asset management and maintenance is leading to a rapid deterioration of urban infrastructure and the quality of the services they provide. It is costing cities in the region billions of dollars in lost production, and having a significant impact on quality of life and public health in many cities. Land development and taxation. The failure of urban governments to ensure a proper mechanism for the release of land for development and for extensions of infrastructure, and the lack of land-based taxation systems, is creating patterns of urban development that are not sustainable. The failure of cities to protect urban utility corridors from development, or to designate land for expansion of road corridors, is adding more than 50 percent to the cost of urban road and infrastructure projects to improve access or provide basic urban services. Falling urban density in both population and patterns of development could be expected to add to long-term operations and maintenance costs. The redevelopment of inner city areas and urban corridors calls for new partnership mechanisms in cities across the region. Intersections with other agendas. Economic development issues and governance, in particular, cross-cut the physical development agenda, largely determining the priority of, and the ability to pay for and implement, investments. Increasingly, environmental and resilience issues also play an important role in determining the priority, form and implementation strategy for investment. 16.4.2.1 Action Agenda Items – Physical Development
Integrated Capital Works Development Plans The preparation of integrated capital works development plans is vital to the longterm planning and sustainable development of cities in the region. Such plans need to address long, medium and short-term needs for infrastructure and other capital works. They must be linked to city departmental and corporation budgets. They should also be linked to capital financing plans that identify the levels of capital required by a city and how the capital will be raised through local revenue sources, taxes, user charges, loans and bonds. Capital works development plans should identify developer and value capture contributions. Capturing revenue from these sources is critical to the funding of works programmes. They should also indicate opportunities for privatization or public– private partnerships to support capital works programmes where these are considered feasible and acceptable to city governments and communities.
Asset Inventories and Registers It is necessary to understand the current state of the physical assets of urban areas, city regions or development corridors. Backlogs in the provision of infrastructure and
454
shortfalls in maintenance need to be rigorously and comprehensively assessed as the basis for analysis to determine priority investments. Registers that include information on ownership, description, location, age, value and condition of assets are vital in preparing and updating city balance sheets, city maintenance programmes, establishing credit ratings for cities, and in the case of postdisaster situations, for assessment of disaster impacts and recovery costs.
Investors and Stakeholders Related to the above, it is essential to identify the various stakeholders involved in key investment sectors and to assess: (i) potential synergies across sectors; and (ii) potential partners in the development of needed infrastructure. The issue of who owns what assets and capital reserves must be clarified and documented, in order that these can be leveraged through various partnerships arrangements to support public and public–private capital works projects to develop infrastructure, buildings and other structures needed to increase levels of privatesector investment in cities. Ways of engaging stakeholders in policy dialogue need to be designed.
Action Plans Given the opportunities and constraints identified across the major investment sectors, the next step is to determine priority investments and enabling actions, and assign responsibility for implementing them. In this activity, all levels of government should be involved, as it is inevitable that action will be required at all levels. The same public–private body discussed in the Economic Development Agenda section should be the focus for oversight of this implementation process as the economic and physical infrastructure investments are very closely linked.
16.4.2.2 Partnerships – Physical Development Partnerships among APEC cities can foster a consistent and rigorous approach to the above processes and support the public–private collaborations central to implementing them. Such partnerships already exist. An example is the APEC Urban Infrastructure Network established in 2011 with the support of the Australian Department of Foreign Affairs and Trade. These can be built on and expanded with the assistance of the governments of APEC member economies. 16.4.3
Social Development Agenda
Health, education, legal and emergency services play important roles in determining the sustainability of a city. Access to such services is important to the economy of a city – in that healthy, better educated and safer workers are more productive – and also to the social stability of a city. Exclusion breeds crime and violence. Social development is thus closely related to improvements in security, education and health – and in housing. Housing. Increasingly, housing is becoming a major issue for cities in the region. Housing affordability is declining in the region’s globalized cities (e.g. Sydney and
455
Vancouver) and access to any form of formal housing on the part of the poor in many APEC economies remains problematic. Adequate shelter enables low-income families to have a stable base and to develop their livelihood. More proactive policies for the development of housing are required to ensure that supply can meet demand for all levels of income. Such policies need to address the vested interests that benefit from high land prices. Equality and inclusion. Assisting the urban poor and disadvantaged in the APEC region requires policy responses and strategies by cities and member economies that focus on job creation. Urban poverty levels are reflected in the inability of people to find work in the formal or informal economy, increased crime and discrimination, and inadequate health and education services. Women are the most vulnerable among those affected by income equality in the region. They are often paid lower wages than men, at any age. Community development and social inclusion are important considerations in addressing the needs of the poor, women, the aged and physically challenged, and children. Intersections with other agendas. Economic and governance issues, in particular, cut across the social agenda, with inclusiveness and equity largely determining access to social services and employment. Environmental issues are also important to the poor as they are often the most vulnerable to pollution and climate-induced disasters. 16.4.3.1 Action Agenda Items – Social Development
Socioeconomic Profiles Of critical importance to improving the social wellbeing and development of cities is to develop baseline profiles of the socioeconomic characteristics of citizens living and working in development corridors, city regions or urban areas. The profiling should include comprehensive, spatially tagged, gender-disaggregated statistics and data on families, incomes, shelter circumstances, skills and livelihoods; the levels of housing, health, education and security services provided; and the levels of risk associated with crime, disease and exposure to disaster by socioeconomic group and geographic location. These are needed as the basis for analysis of the level and inclusiveness of service provision.
Social Services Audits and Inventories The various stakeholders involved in the provision of key social services, in particular, housing, health and education, for the region in question need to be identified. Ways of engaging them in policy dialogue need to be designed, and strengths, weaknesses, opportunities and threats (SWOT) analysis needs to be carried out for each major social service. In the absence of comprehensive data, stakeholders can provide significant and useful information as a basis for preliminary assessments.
Engagement and Inclusiveness Participation has become an important tool for engaging communities in planning, resources mobilization and social services delivery. The extent to which citizens participate in community decision-making depends on the nature of formal
456
governance systems, which need to be respected but also need to be responsive to the dynamics of change. Mechanisms for engaging communities in participatory planning, budgeting, service delivery and emergency management are important to reduce public-sector costs and outlays on social and community services, which are continuing to rise and are not always delivered efficiently. Inclusiveness should be incorporated into meeting the needs of the poor, disadvantaged and segregated. These groups are often overlooked in poorer economies, but their right to improve themselves should be recognized when supporting the development of sustainable social systems in cities.
Wealth and Income Disparity Almost all cities in the APEC region are experiencing increasing wealth and income disparities both within and between national systems of cities. This is linked to inequalities in access to social and community services, investment and development opportunities. Economies that have significant wealth and equity divides measured by Gini coefficients and other indicators need to look at ways to reduce these imbalances through national and local urban development policies. Redistribution of wealth is essential to reducing Gini coefficients. One way to do this is to re-inflate the extent of the middle-income group living in cities. This is crucial to expanding overall levels of consumption and job creation, which is vital to the sustainable development of cities and national economies.
Greater Equity for Women in Urban Development APEC could play a direct role in helping central and local governments to promote the right of women to play a more active and responsible role in the leadership and economic development of cities. Despite significant improvements in the participation rate of women in the workforce, especially in Latin American member economies, women still receive lower wages than men, face greater hurdles in gaining employment and are still not recognized for the many skills, competencies and ideas they bring to urban workforces across the region. APEC could encourage member economies to support equal opportunity for women in cities, especially in developing local and city business cluster networks and trade associations; improving banking and financial policies to support women entrepreneurs and micro business owners; and providing education and learning programmes to facilitate technology and knowledge transfer.
Housing Shelter policy and housing development need to take into account affordability to the full spectrum of income groups, and provide delivery systems that are able to match appropriate housing types and finance to all parts of the spectrum. Housing is a vital element in a citizen’s quality of life; distorted housing markets result in reduced quality of life for many.
457
Mechanisms to expand affordable housing and bring large numbers of vacant units of accommodation into the housing markets in larger Asian or Latin American cities are essential to addressing urban housing problems. For most cities, housing their citizens will only be feasible through the provision of mixed medium-density housing. Much of this could be achieved through the redevelopment of urban corridors and declining inner city industrial districts. Planning and facilitating urban resilience programmes that incorporate new forms of housing and modalities of construction is essential to developing sustainable housing models for the region’s cities.
Healthy Cities Ensuring the health of cities is vital to the wellbeing and productivity of workforces across the region. Creating healthy cities requires member-economy cities, collectively, to take action by applying multiple strategies to improve water, air and food quality, and ensure better urban living and working environments and better healthcare services. Healthcare has become an increasingly higher item of public expenditure in APEC member economies and city governments. Better planning and location of health services is necessary to create healthier cities. This particularly applies to health programmes for the poor and the large numbers of people living on the periphery of cities. Health programmes must not only provide better facilities and services; they must also include policy measures for preventative health as well as social and mental wellbeing as these are important to reducing health costs and demand for services. Many of these programmes can be delivered through non-government and community-based organizations and cadres.
Safer Cities Creating safer cities is essential to improving public and workplace safety, investment, and emergency and disaster prevention and management. Inadequate security and dangerous working environments, roads and utility services cost the cities of the region billions of dollars annually in lost productivity, premature deaths and disabilities, and damage to life and property through natural and man-made disasters. Creating safer cities requires multiple levels of planning, management and development coordination, improved laws and regulations, along with the enforcement of these.
Investment Priorities for Social Services Given the opportunities and constraints identified across the major service sectors, the next step is to determine priority investments and enabling actions, and to assign responsibility for implementing them. In this activity, all levels of government should be involved, as it is inevitable that action will be required at all levels. A public community body should be the focus for oversight of this implementation process. Collaborations on social services are rare. Thailand’s National Housing Authority is a good example of a partnership that supports community upgrading activity through non-governmental organizations and community-organized development organizations; however, this is fairly small-scale and focused on slum areas.
458
16.4.3.2 Partnerships – Social Development Partnerships among APEC cities can foster a collaborative and rigorous approach to the above processes and support the public community dialogue central to implementing them. Building such partnerships will be a challenge, but can be done with the assistance of the governments of APEC member economies. Such activities could be linked to proposed support to public–private bodies, but would require a dedicated support stream. 16.4.4
Environmental Agenda
While standards of living have risen as APEC economies urbanize, paradoxically, the quality of the environment has degraded. Economic development without attention to the environment has resulted in air and water pollution, land degradation, higher carbon dioxide emissions and increasing vulnerability to climate-related disasters. The total cost of air and water pollution in China is estimated at 5.8 percent of GDP, with cities being the primary contributor to such environmental problems. Almost all cities in the APEC region face environmental issues, to a greater or lesser extent. Climate change. APEC cities are particularly vulnerable to the potential impacts of climate change, which include an increase in extreme weather events; sea level rises; storm surges and flooding; and hotter temperatures – all with related public health concerns. Amelioration of environmental problems requires appropriate policies, improved skills and institutional arrangements, and adequate financial resources. It is difficult for governments of smaller cities to develop and mobilize these resources, particularly in areas facing relatively slow economic growth and rising populations. Pollution. Environmental conditions in many APEC member-economy cities are having a significant impact on public health, water and air quality, and the general wellbeing of people living in cities. The cost of addressing environmental issues is high. Solving them will take many years and involve a change in consumer and personal behaviour. Many cities in the APEC region are turning to low-carbon development approaches to deal with climate change impacts and the need to green their economies and environments. Living, housing and working conditions for more than 40 percent of the population of the region are poor. Solving these problems will require improvements in the productivity, liveability and health of cities. Intersections with other agendas. Increasingly the environment plays a role in determining the planning, design and implementation of investment related to, or by, enterprises, government and households. As environmental awareness spreads throughout member economies, this influence will grow. Further, the sustainable harvesting of natural resources will play an increasing role in economic development. 16.4.4.1 Action Agenda Items – Environmental Development
Restoration of Natural Capital Environmental pollution across APEC member economies’ cities represents a significant proportion of GDP as well as adding to greenhouse gas emissions. First, it is necessary to understand the state of the natural capital, its vulnerabilities and the
459
pollution sources within the corridor, city region or urban area. More comprehensive and spatially tagged statistics on water, forest and other natural resource stocks and usage are needed as the basis for such analysis. For this, cities need to develop measures of natural-capital stock, depletion and restoration rates. Restoring natural capital is fundamental to the sustainability of cities and to reducing ecological footprints.
Stakeholders It is necessary to identify the various stakeholders involved in using and preserving key resources for the region in question. Ways of engaging them in policy dialogue need to be designed and an analysis carried out to determine sustainable management practices for the resources in question. In the absence of comprehensive data, stakeholders can provide significant and useful information as a basis for preliminary assessments.
Priority Investments for Natural-Capital Restoration A key step in restoring natural capital depleted by the demands of cities is to determine priority investments and the enabling actions required to implement resource management plans, and assign responsibility for implementing them. In this activity, all levels of government should be involved, as it is inevitable that action will be required at all levels. A public–private body should be the focus for oversight of the implementation process. Collaborations of this nature already occur, but usually are focused on one resource in particular. A successful example is the Brisbane River Management Partnership discussed in Chapter 4.
Climate Change Resilience Climate change leading to rising sea levels and intensification of climatic events has the potential to damage the economies of many cities in the region. Several very large cities – Bangkok, Jakarta, Manila and Shanghai for example – are among the most vulnerable cities in the world to the impacts of climate change. The threat of climate change calls for the future-proofing of cities, something that will be difficult to achieve, but vital if the most at-risk cities are to defend and maintain their economies against this threat. Action plans for adaptation measures will have to be prepared for all cities in the region with average elevations of less than 10m. Cooperation is required at APEC member economy and city levels to reduce greenhouse gas emissions to below 1990 levels or lower if climate change threats to many of the region’s cities are to be reduced.
Social Capital and Economic Resilience While importance must be given to fostering economic resilience in the face of climate-change impacts, the pathways to achieving this may well come through fostering interest in cultural heritage, and through natural and social-capital rebuilding. Social-capital rebuilding could make significant use of multimedia and virtual learning. However, this will require investment in hard infrastructure to enable
460
the networks and systems in cities to build local human capacity to recover from economic shocks and downturns, or from skills and population losses in some declining cities throughout the region.
Circular Economies Cities must move to adopt circular economies where waste is treated, and energy and water captured and recycled or reused, as part of cleaner production processes. Cities in the region must begin applying industrial ecology as a common practice to reduce waste streams to the lowest levels possible. The development of circular economies in cities requires a collective approach to waste and energy recovery. In many cases, collaboration between cities will generate the critical mass and volume of waste products to create economies of scale for resources that are competitive with virgin materials. Cities in the region must begin to factor in waste costs, in the same way that greenhouse gas emissions trading will be used to reduce atmospheric pollution in cities.
Green Cities This concept embodies all the above concepts and adds a focus on the role of cities in mitigating the impact of people on the environment. The sustainability of cities in the region will, in particular, be very dependent on the creation of more energy-efficient, green cities. Green cities will involve cities moving to renewable energy sources and developing local energy grids and energy storage buildings. Cities such as Kitakyushu (see Chapter 7) and Singapore are leading the way on this. The transition to green cities offers many opportunities to support more sustainable and less fossil-fuel dependent cities. It calls for priority to be given to a set of investments in green energy, the green economy and resilience as part of the progressive renewal of cities around the region.810
16.4.4.2 Partnerships – Environmental Development Partnerships among APEC cities can foster a consistent and rigorous approach to the above processes and support the public–private collaborations central to implementing them. APEC has established a Low Carbon Model Towns Project and a network of interested cities through a series of activities. As with the social agenda, building real partnerships from these initial contacts will be a challenge, but can be done with the assistance of the governments of APEC member economies. Such activities could be linked to proposed support to public–private bodies, but would also require dedicated support services. 16.4.5 Governance Agenda The quality of city governance is one of the most important but difficult challenges to improving the sustainability of cities in the APEC region.
461
Challenges at different levels of government. At the central government level, urban strategies are often unclear, and decentralization policies are not well-aligned with the tax base of distinct levels of government. Issues of income inequality remain unaddressed by tax systems. At the city level, there can be confusion over responsibility for the urban fringe and the functional responsibilities for citywide delivery and maintenance of local services. Community and business involvement in city government are at an early stage of development. Major issues. Equity in access to land, housing and urban services is worsening. Policy failures include inadequate city management, ineffective planning for urban growth, infrastructure and service shortfalls, and an inability to address the complexity of resource demand, financing and capacity constraints. City governments are having difficulty moving from a regulatory to a developmental role. Without significant improvement in approaches to city governance in the APEC region, the problems and negative externalities of today’s cities will be magnified by the large scale of the projected urban population growth over the next 40 years. Intersections with other agendas. Governance determines outcomes in the planning, design and implementation of investments in all agendas, and should be the focus of partnerships. 16.4.5.1 Action Agenda Items – Governance
Governance Structure In order to formulate a governance agenda for APEC cities, it is necessary to understand the governance structure. The various elements of governance (e.g. participatory, collaborative, urban management, mode of services delivery, etc.) should be evaluated in terms of how they measure up to international best practice for the urban area, city region or development corridor in question.
Stakeholders The various stakeholders involved in each area need to be identified and their capacity to improve performance for the region assessed. Ways of engaging them in policy dialogue and appropriate incentives for improved performance need to be designed. In the absence of comprehensive analysis, surveys of user satisfaction can provide significant and useful information as a basis for preliminary assessments.
Priority Investments to Improve Governance Given the opportunities and incentive systems identified, it is important to determine priority investments and the enabling actions required to implement such governance improvements, and assign responsibility for implementing them. In this activity, all levels of government should be involved, as it is inevitable that action will be required at all levels. A public–private body should be established for oversight of this implementation process. These collaborations already occur, and are focused on the economic agenda.
462
The following items are considered important to supporting an action agenda for the governance of sustainable cities in the region:
Collaborative Governance There is a need to foster: o City-to-city trade partnerships o A collaborative governance culture (planning, budgeting, resource sharing) to replace current ‘siloed’ systems which are inefficient and stifle innovation. Metropolitan Management There is a need for effective: o Metropolitan governance arrangements o Integrated strategic planning o Integrated spatial multi-sectoral budgeting o Integrated services delivery based on multi-sectoral planning o Infrastructure investment prioritization processes. Public Revenue There is a need for improved efficiency and equity in: o Intergovernmental fiscal relations – to provide incentives for local revenue mobilization and leveraging o Property tax collection o Land value capture o Asset leveraging. Reform of Regulatory Systems There is a need for more: o Realistic and responsive development and planning regulations, and enforcement of those regulations o Effective environmental regulations, and enforcement of those regulations o Respect for the rights of citizens. Anti-Corruption Culture There is a need for more transparency in: o Political processes o Government o Business operations. E-Governance There is a need to introduce IT-based: o Management information systems o Public information systems. Monitoring and Evaluation There is a need for systems at regional and member-economy levels to monitor and evaluate: o Policy environments relevant to the agenda areas o Capital investment related to agenda areas o Operation and maintenance programmes o The performance of cities across the agenda areas and city competitiveness
463
o Longitudinal studies on the dynamics of and changes in urban economic, social and environmental systems. 16.4.5.2 Partnerships – Governance Partnerships among APEC cities can foster a consistent and rigorous approach to the above processes and support the public–private–community collaborations central to implementing them. As with the social agenda, building such partnerships will be a challenge, but can be achieved with the assistance of the governments of the APEC member economies. Again, such activities could be linked to proposed support to public– private bodies, but would also require a dedicated support stream. 16.4.6 Cross-Cutting Systems and Issues Urban systems in the region are integrated in different ways at local, national and international levels. Urban systems cross-cut all agendas, and need to be integrated for cities to function efficiently and effectively. For sustainable development to occur at all stages in the planning, design, development, operation and maintenance of cities, issues relating to these cross-cutting systems need to be considered carefully. The following list of cross-cutting systems is by no means complete, and the importance placed on each at a local, national and regional level will vary. Nevertheless, these are the key systems that need support through partnership arrangements:
Integrated planning – This needs to take into account all agenda priorities. Project development – This needs to integrate urban agenda priorities into the performance criteria used for appraisal of projects and procurement. Finance – This needs to be structured such that individuals, firms and governments of all types can access appropriate financing to pursue priority agenda investments. Learning, research and development – This needs to address the spectrum of data required for effective planning and implementation of the agenda investments.
16.4.6.1 Action Agenda Items – Cross-Cutting Issues Addressing cross-cutting issues is challenging and time-consuming, especially when political economy issues come into play in dealing with development and redevelopment projects. It is important, therefore, for cities to focus on solving the issues related to the most pressing development problems and challenges facing the respective cities or groups of cities. From the case studies, the major development challenges include:
Formation of economic corridors This would mean assessing the: o Potential for corridor development (urban and trade corridors) o Needs of implementing and financing institutions in fostering corridor development, inter-regional trade and economic development partnerships. Proactively managing the urban form and economy This would require:
464
o Collaborative metropolitan planning and governance o Integrated planning, financing, budgeting and urban systems o Disaggregated city trade data (industry classification by destination) o Local economic development support. Providing appropriate governance structures for strategic infrastructure Such structures will: o Have viable systems of urban finance (financial management, revenue collection, long-term capital programmes) o Focus on physical and environmental sustainability o Protect infrastructure corridors o Improve urban logistics systems o Proactively manage assets, including their appraisal, valuation, maintenance and replacement/upgrading. Developing collaborative partnerships This means: o Moving beyond sister city relationships – to city trading partnerships.
16.4.6.2 Developing and Managing Secondary Cities Many secondary and smaller cities find it more difficult to implement a sustainable development agenda compared to larger cities. The research shows that many of these cities are struggling to attract investment, create jobs and fund essential infrastructure to support local economic development.811 Governments in secondary and smaller cities do not take such an active interest or role in fostering local economic development. Often, local economic development is the responsibility of a level of government above the city. As a result, medium-sized and smaller cities feel less empowered, which makes it very hard for local governments to become more innovative, entrepreneurial and competitive. Local governments in smaller cities must become more engaged in local economic development and help create business-friendly environments for business and investment. All levels of government must work more collaboratively and cooperatively for the economies of cities to function efficiently and effectively. With more than 50 percent of the region’s urban population living in cities of less than 500,000, the management and development of secondary cities is an important agenda item for APEC economies.
16.5 VISION AND AGENDA FOR SUSTAINABLE CITY DEVELOPMENT Cities are of overwhelming importance to the economies of the APEC region; and it is vital to support them through collaborative, inclusive and sustainable urban development. This requires that those cities be proactively managed, and that the structural base for local economies be strengthened by providing them with the required strategic infrastructure and viable financing structures. This calls for a clear vision for managing urbanization and developing sustainable cities. Such a vision must be realistic, achievable and acceptable to the APEC member
465
economies and the cities they represent. It should also be capable of responding to the dynamics of change and be progressive and collective. The vision for a sustainable agenda for managing urbanization and sustainable cities focuses on collaborative partnership arrangements to improve the development and management of cities in the region. The vision supports the development of a sharing economy, recognizing that future economies, built urban environments and governance arrangements require greater cooperation and collaboration between economies if sustainable development of cities in the APEC region is to become a reality. 16.5.1 The Importance of Cities A collective effort is needed to address the challenges of climate change, which is primarily a city problem. Nearly all future jobs and investment underpinning the wealth and prosperity of the region’s economies will be created in the region’s cities. Cities will become increasingly reliant on better communications, and open platforms of data sharing and technology exchange, to function efficiently and remain competitive. Urban governance systems that are better integrated, responsive and transparent in supporting the development and efficiency of regional markets, supply chains and logistics systems are vital to the sustainability of cities. The formation of a range of urban partnerships that enable cities to work collaboratively on solving problems and fostering innovation and creative ideas is central to the realization of sustainable urban development across the region. This calls for more open, collaborative, inclusive, competitive and equitable systems in the region’s cities. Cities in the APEC region must be able to realize their development potential, and not be held back by barriers to trade and investment, inequities in the development of infrastructure, and economic and physical development policies that are biased towards larger cities. The failure of smaller cities (to function or perform as well as they could) impacts on the performance and the development of national economies. For primate and large cities to function more efficiently and sustainably, it is vital that inequities and inefficiencies in the national systems of cities are addressed across the region. 16.5.1 Innovation, Risks and Partnerships It would be very easy for APEC to focus on the simpler problems and issues of urbanization and sustainable city development. However, the hard problems will not go away. They will only become harder to solve as the region develops and becomes more urbanized. Fixing the infrastructure, governance and financial problems of cities; tackling the impacts of climate change; recognizing and dealing with disruptive technologies such as computer-aided manufacturing and their effects on jobs; and addressing the problems of urban poverty and housing require APEC member economies to come up with collective solutions. Complex problems require creative thinking and solutions, which means that innovation and experimentation are keys to the future development of the region’s cities. However,
466
innovation involves risks, and inevitably, the possibility of failure. Governments and communities will need, therefore, to decide what level of risks and failures is acceptable. The risks need not be borne by member economies or cities alone. By entering into partnerships and collaborations, the risks of testing innovative and creative ideas can be shared. This is important if breakthroughs in tackling the difficult problems faced by cities are to be achieved.
16.6 PRIORITY ACTIONS FOR AN APEC CITIES PARTNERSHIP INITIATIVE Formulating an agenda and activities to support the development of sustainable cities using partnerships is one thing. The challenge lies in setting priorities for implementation. Urban development issues and challenges are complex and notoriously difficult to resolve; ideologies, the political economy and public opinions seldom coalesce. Many actions are necessary to address key shortfalls and realize the opportunities identified by the report to improve the performance and sustainability of the cities of the APEC member economies. APEC’s mandate is limited to policy, but the organization can work with its members on a limited number of priority actions that could make a meaningful contribution to the sustainable development of their cities. It could do this by establishing an initiative focused on Building Better Partnerships for Inclusive and Sustainable Growth of Cities in the APEC Region. Five key areas have been identified from the research which APEC and its Secretariat could support as part of the initiative: (1)
Partnerships to Lift Economic Performance and Trade
While there appear to be many sensible theoretical reasons why city networks and partnerships could contribute to lifting regional and national economic outcomes, the city case studies and literature have found limited evidence of them doing so. The case studies present good and outstanding examples of sustainable development practices, but very few have been scaled up and implemented at the city or system of cities level. Scaling up the individual lessons drawn from the case studies through partnerships (e.g. city-to-city clusters; or trade, economic development and investment exchanges such as the Mexico City–Chicago partnership) is vital to enhancing the performance and sustainability of APEC member-economy cities. A critical element of development partnerships to enhance economic performance is the development of more specialised spatial clusters of industry and economic activities. Economic development strategies and government enabling support to the development of export-orientated industry clusters is important, but the focus on support endogenous growth is equally important. With the advancement in ITC and other technologies (especially 3 D printing), there are many opportunities for the globalization and localization of production of goods and services in the large, medium and smaller cities across the region.
467
The development of economic corridors and economic linkages across urban systems will be central to such partnerships. The dominance of one or two cities tends to multiply agglomeration diseconomies in the primate cities and to intensify under-utilization of enterprise and human capital in smaller cities. The lack of institutions to manage trade corridors, and facilitate access to national and international economic opportunities, is a major contributor to such problems. The development of trade corridors comprising networks of linked and interdependent cities is an emerging phenomenon, but the challenge lies in how to develop and manage these corridors. The Jing-Jin-Ji Circle, Pearl River Delta, Vancouver–Seattle, Ho Chi Minh City and Mercosur trade development corridors are vital to fostering commerce and development between cities in these regions; but the management, financing and development of these corridors will be a significant challenge, which is best addressed through partnership arrangements between cities and governments in each corridor region. (2)
Partnerships to Foster Sustainable Urban Forms
Many cities have evolved toward lower density, high carbon and dispersed forms of urban development which are environmentally unsustainable and economically inefficient. Metropolitan planning, in particular the integration of land-use and transport/logistics solutions, and governance shortfalls are the primary causes of such problems. The case studies on Mexico, Lima, Auckland and Manila show that urban sprawl adds to the costs and issues associated with congestion for business, government and communities. Increasing urban density and consolidation of development is vital to improving the sustainability of development across the region. (3)
Partnerships to Support Development of Strategic Infrastructure
The governance agenda should promote partnerships for strengthening programme development and implementation mechanisms for strategic infrastructure, and for addressing the systemic faults which occur at all levels in systems related to financing investments for sustainable development. Currently, in many cases, infrastructure investment tends to be opportunistic and ad hoc, and lacks the context of a ‘nested’ set of integrated metropolitan asset management and local development plans. Private sector and community inputs are not systematically and equitably canvassed in respect of such investments. In addition, and importantly, once a project has been implemented and throughout its life, investments are seldom subject to independent, transparent analysis that relates to performance criteria. (4)
Partnerships to Improve Systems Related to Financing Investments for Sustainable Development
Urban governments do not have revenue raising mandates in line with city infrastructure needs; local governments have no incentive to maximize tax yields nor to leverage private and community resources; funding requirements, in many cases, are unknown. Strategic and asset management plans seldom exist; where they do exist, they have not been adequately estimated. Enterprises in secondary cities often have less access to funding for investment; micro, small and medium enterprises suffer the same restricted access to funding no matter where they are located.
468
(5)
Supporting These Initiatives will be Partnerships to Enhance City Information, Trade Data and Asset Management Systems
APEC member economies are becoming more closely linked to expanding trade, investment, tourism and other types of exchange. For trade and investment to grow, information, trade, services and infrastructure need to be more closely integrated, and the nature, volume, capacity and spatial identity of assets and value-adding inputs to production and waste streams better known. Currently, most cities in the region have incomplete information about their economies, what they import and export, where and how value-adding occurs spatially and the changing dynamics of technology and skills requirements for expanding service sector economies. The development of integrated city information and management systems is vital to improving the logistics for supply chains and movement systems, streamlining administrative systems and developing higher levels of risk assessment and preparedness in cities. It is also crucial that these partnerships and ITC systems are made more open to micro business and the urban poor to enable them to gain equitable access to new knowledge, technology and markets in the transformation to more service sector driven economies. The economic planning ministries of the APEC member economies should develop dedicated units capable of analysing urban economic systems and fostering best practice in sustainable urban development. These units should focus on providing appropriate enabling frameworks for the acquisition, adaptation and implementation of best practices through supporting effective partnerships among cities, communities and the private sector. This should extend across systems of planning, development and assessment, project procurement and finance – improvement to only one area is unlikely to improve outcomes. APEC should support the development of such capacity. Responsible ministries should tap the substantial body of expertise in academic and policy institutions. The next section proposes a roadmap for how such support could be organized.
16.7 ROADMAP FOR APEC PARTNERSHIPS FOR INCLUSIVE AND SUSTAINABLE GROWTH In shaping a roadmap to move forward on an agenda for Building Better Partnerships for Inclusive and Sustainable Growth of Cities in the APEC Region, it is essential, given APEC’s pivotal position representing several of the largest and most influential economies in the world, that APEC identifies and agrees on how to develop the initiative, along with the scope and scale of the activities the organization engages in. Figure 16.1 is a roadmap showing the structure and scope of a possible urban partnerships agenda and programme for APEC. The scale of these activities initially might be limited to a few member economies and cities. It is essential that the activities be designed as part of a learning experiment to identify how APEC can best support sustainable urban development activities within and between a few member economies and cities before attempting to scale up some of these. APEC should select activities that member economies feel confident will generate results and positive learning outcomes that can be shared, adopted or adapted by other member economies and cities. Even when there are experimental failures, much can be learned from these. In urban development, the margins
469
between success and failure are often small; what is a successful in one city will not always be successful in another. It is envisaged that the APEC Secretariat would form a Sustainable Urban Development group to coordinate activities to implement an urban agenda. The representatives of this group would be drawn from the economic planning ministries of the member economies, or their nearest equivalent with a strategic overview of city infrastructure needs. The group would report directly to the Senior Officials Meeting (SOM) owing to its crosscutting nature and the potential involvement of several committees of APEC. These activities would fall into two main and related areas. The first would entail the formation of advisory groups for the five agenda areas shown in Figure 16.1. These groups would be voluntary, but specific studies could be undertaken with groups – depending on the availability of funds. They should meet at least yearly, and at these meetings, the focus should be on a particular topic – which can then be documented as a knowledge product. The second activity area would concentrate on the priority actions for partnership initiatives. Again, depending on the funding available, an Initiative Secretariat could be established. This secretariat would have two primary functions. The first would be to service the work of the initiatives and the second would be to act as the repository of data on APEC urban systems.
Figure 16.1 Roadmap for Building Better Partnerships for Inclusive and Sustainable Growth of Cities in the APEC Region
Source: Authors.
470
The initiatives map to the action items set out in Section 16.6 and give substance to the Partnership. The Urban Economic Corridor Initiative can action much of the agenda set out in 16.6(1). The Urban Development Initiative can action the agenda set out in 16.6(2) to 16.6(4). The Governance Initiative would focus on actions set out in all five agenda items. Funding can be sought for part or whole of the agenda, but it is suggested that current development assistance support may be available for important parts of the initiatives. Much interest has been shown by agencies involved in the sustainable development of corridors such as the Silk Road (China and the Asian Infrastructure Investment Bank) and the Greater Mekong Subregion (Asian Development Bank). The Australian Department of Foreign Affairs and Trade is funding the development of an APEC Urban Infrastructure Network, which is addressing many of the issues under the Urban Development Initiative. It is further suggested that the Secretariat seek to foster the formation of public–private urban groups in each member economy, linking interested persons into the Advisory Groups and the Initiatives.
16.8 IMPLEMENTING THE SUSTAINABLE CITIES AGENDA FOR THE APEC REGION To implement an agenda supporting APEC partnerships for urbanization and sustainable city development in the region, the Secretariat will need to work with member economies to develop an action plan that identifies focus areas and priorities the organization can support for a range of partnerships with cities in the APEC member economies. It is essential APEC economies and their cities engage in activities of mutual benefit to the development of a network, or subsystems, of sustainable cities in the region. There is considerable merit in APEC taking the lead role on this. No other peak organization acts as a bridge for the development of cities in the Pacific Rim economies and cities. While UN-Habitat is the peak international agency for cities and human settlements, it and the UN regional commissions do not have an integrating mechanism for cross-regional cooperation on urban development matters. APEC does, and can, play a very effective role in bringing together member economy governments on crossregional partnerships between cities to foster trade and economic development; collaborative governance arrangements; information, data and technology-sharing on cities and urban systems; the linking of infrastructure, services and transport logistics systems; technology and urban management and other skills development. There are many ways that APEC can action and build (or build on) the partnerships for the above. The Friends of the Chairs Meeting on Urbanization provides the administrative mechanism to begin the implementation of an APEC urban agenda. The establishment of thematic advisory groups is important in providing APEC with the technical and professional know-how to engage with key stakeholders on urban policy, planning, development and management. These can be broadened through the development of colleges of practice around urban themes. Colleges of practice are a very practical means of bringing together experts to work on and solve complex urban problems, or to foster
471
the development of creative ideas. Many colleges of practice are virtual and can easily be established as a mechanism to support APEC. Support for and linking of national urban research institutions and universities to work on common cross-border issues is a very effective way for APEC to leverage research and development resources and experts to action an APEC urban agenda. It would enable knowledge and technology transfer to occur between economies and cities. It would also enable better ground knowledge of local situations and data collection, which can be aggregated into a national and regional open platform for knowledge sharing. Face-to-face exchanges between mayors, city executives and urban development professionals and technical staff are valuable in sharing collective learning and for understanding urban development issues. They also facilitate the application of good practices and the adoption of technologies and policies to fit the local context of development. By leveraging on a range of seminars, workshops, high-level meetings and events, APEC could strengthen levels of collaboration and exchange between cities in the region. Major events, such as the annual meetings of APEC, the Asia-Pacific Mayors, ASEAN, or the Habitat III Conference in 2016, offer opportunities to enhance the level of exchange and engagement between cities, their public officials, senior management, professionals and business. It is vital that the APEC Secretariat and Friends of the Chairs Meeting on Urbanization work with the Secretariats of APEC member economies. Member-economy Secretariats need to be informed about urban issues and development opportunities for them to be more proactive in influencing the development of city-to-city trade agreements, and in providing support for development aid assistance to cities in the lesser developed economies of the region. Many member economies have ministries or departments with specific responsibility for developing sustainable cities, and there are opportunities for APEC to engage with them. Finally, non-governmental organizations, professional associations and unions are resources that can, and are willing to, work with APEC on implementing an urban agenda. Many local non-governmental organizations are linked internationally with sister organizations and regional networks. These organizations and their members have a key role in planning, designing and delivering services at the city level. They play a crucial role in policy formation and the sharing of knowledge and ideas. Through the Friends of the Chairs Meeting on Urbanization, APEC can engage with business and professional groups in the region. It is vital that these connections extend beyond trade and investment interest groups since the development of a sustainability agenda for cities in the region goes well beyond economic interests.
16.9 CONCLUDING REMARKS This report has highlighted many good examples of sustainable development practices and partnerships between cities across the region. The region’s cities, however, still have many challenges to overcome to become more sustainable. Addressing the challenges will require changes to the ways business, governance and trade function. There will have
472
to be a greater focus on sustainable use of resources; investment in people; and a more collaborative approach to developing innovative solutions. Cities will also have to move to green platforms of production. It will also require greater inclusiveness, involvement and transparency in public decision-making, and a higher level of consciousness in communities about providing for the needs of future generations. While the expansion and development of trade will be important to supporting the growth of economies and cities in the region, new models of economic development with a stronger focus on endogenous growth will be necessary to address the impact of changes in technology on jobs and investment opportunities. Technology offers a tool to improve the sustainable development of cities in the region, but it will not solve all of the current challenges. Cities in the APEC region must prepare for the age of disruptive technology812 – a term used to describe emerging technology that unexpectedly and often rapidly displaces an established one. Some examples of disruptive technologies are the automation of knowledge work and artificial intelligence, the Internet of Things, advanced robotics, autonomous or near-autonomous vehicles, next-generation storage, 3D printing, advanced materials and renewable electricity. These disruptive technologies will have a profound impact on the development and management of cities, and on trade, innovation and the way cities plan for the future. Businesses and governments must prepare to respond to these technologies and the challenges and opportunities they bring. Cities, businesses and communities will need to continually adopt and adapt to new technologies, by looking for business-model innovations that can capture some of that value. Policymakers will need to develop and implement advanced technologies to improve and address their operational challenges. Future development plans for cities, such as the one prepared for the Calais region of France,813 which embraces the Third Industrial Revolution, will need to become an integral part of planning for cities across the region. A key aspect of change in cities across the region will be the evolving nature of work as the result of changes in technology. Adapting to new technologies will require continuous retraining programmes and investment in education, new sets of competencies and shared knowledge-based systems. Many of these new learning approaches will be conducted using advanced Internet platforms. Governments will also have to develop a more harmonious and useful view of technology impacts. They will need to consider new metrics that capture not only GDP effects, but also the social and environmental benefits, as part of sustainable development accounting systems for cities. Reform of governance systems is vital to achieving sustainable development in the region’s cities. Governance systems have an enormous influence in shaping the economic, social and physical environments of cities. They are critical to the management and utilization of natural resources and ecosystems. Many of the current governance systems can no longer accommodate the dynamics of change, the management of urbanization and redevelopment, and the way that cities engage more openly in trade, investment and other forms of exchange. Collaborative governance is emerging as a new tool in the management of cities.
473
Economies and cities in the region must also move toward a more collaborative and sharing model of economic development. The model of collaborative competition, involving cities coming together to look for opportunities to leverage resources to create a win-win situation that will generate jobs and investment and create a better quality of life, is important to the sustainable development of cities in the region. Embracing the sharing economy requires a significant paradigm shift. Such a model is already applied in the business sector, but it must be scaled up to embrace cities and economies across the region. Finally, this volume has highlighted many promising initiatives by APEC member economies and cities to work with different levels of government, business and communities in developing better and more sustainable cities through a range of partnerships. Partnerships offer one way of using precious resources more wisely in developing and managing cities. It is important that partnerships are not just solely seen through a business lens; but also focus on developing social, governance and environmental capital; providing a more inclusive approach through improving gender equity; and engaging the disadvantaged so that they have a say in the way APEC cities are developed and managed. Partnerships are a useful way of supporting future sustainable city development. They can be expected to occur on many diverse levels across the region. APEC, as a forum representing the interests of governments, can play a very influential role in fostering the development of partnerships between economies and cities, particularly in facilitating the sharing of knowledge, innovation and ideas for improving the management, development and transitioning of cities. It is vital that APEC takes this up as part of an initiative for Building Better Partnerships for Inclusive and Sustainable Growth of Cities in the APEC Region.
474
17. Notes
1
2 3 4
5 6 7 8 9
10 11 12 13 14 15 16 17
18 19
20 21 22 23 24 25
B.H. Roberts, M. Lindfield and F. Steinberg, Shaping the Future through an Asia-Pacific Partnership for Urbanization and Sustainable City Development (Singapore: APEC Secretariat, 2014), 60. Ibid., 1. Ibid., 1. P.C. Annez and R.M. Buckley, Urbanization and Growth: Setting the Context in Urbanization and Growth, ed. M. Spence, P.C. Annez and R.M. Buckley (Washington, DC: World Bank, 2009), 1–44. United Nations, Department of Economic and Social Affairs, World Urbanization Prospects: The 2014 Revision (New York: United Nations, 2015). United Nations, Department of Economic and Social Affairs, World Urbanization Prospects: The 2012 Revision (New York: United Nations, 2013). United Nations, World Urbanization Prospects: The 2014 Revision. UN-Habitat, State of Latin American and Caribbean Cities Report 2012: Towards a New Urban Transition (Rio de Janeiro: UN-Habitat, 2012), 194. MGI (McKinsey Global Institute), Global Cities of the Future: An Interactive Map, accessed 30 October 2014, http://www.mckinsey.com/global-themes/urbanization/global-cities-ofthe-future-an-interactive-map UN-Habitat, State of Latin American and Caribbean Cities Report 2012, 194. UN-Habitat, Planning and Design for Sustainable Urban Mobility: Global Report on Human Settlements 2013 (Oxford: Routledge, 2013), 344. ‘China to create world’s largest mega city’, China Daily, 21 January 2011. E. Istrate and C.A. Nadeau, Global Metro Monitor 2012 (Washington, DC: Brookings, 2012). World Bank Database 2016. O. P. Mathur, Urban Poverty in Asia (Manila, Philippines: Asian Development Bank, 2013). Nathan Associates, Women’s Economic Participation in Peru: Achieving APEC Priorities for Gender Equality (APEC and USAID, 2016); Mathur, Urban Poverty. UNESCAP (United Nations Economic and Social Commission for Asia and the Pacific), Economic and Social Survey of Asia and the Pacific 2007: Surging Ahead in Uncertain Times (New York: United Nations, 2007). UN-Habitat, The New Urban Agenda, accessed 15 November 2016, https://habitat3.org/the-new-urban-agenda Sections 1.5 and 1.6 draws extensively on the work of the author in: B.H. Roberts, Managing Systems of Secondary Cities: Policy Responses in International Development (Brussels: Cities Alliance, 2014). S. Kuznets, ‘Economic growth and income inequality’, The American Economic Review 45(1) (1995): 1–30. M. Lindfield and F. Steinberg, Green Cities (Manila: ADB, 2012). OECD (Organisation for Economic Co-operation and Development), Cities and Green Growth: A Conceptual Framework (Paris: OECD Publishing, 2011), 138. A.M. Brandenburger and B.J. Nalebuff, Co-opertition (New York: Doubleday, 1996) World Bank, World Development Report 2009: Reshaping Economic Geography (Washington, DC: World Bank, 2009), 440. A. Kumar, ‘Agglomeration, economic interdependence and “IT”: A macro-economic perspective’ (dissertation, University of Minnesota, 2007).
475
26 G. Hamel, ‘Reinventing the basis for competition’, in R. Gibson, ed., Rethinking the Future: Rethinking Business, Principles, Competition, Control, Leadership, Markets and the World (London: Nicholas Brealey, 1996), 77–92. 27 G. Hamel and C. Prahalad, Competing for the Future: Breakthrough Strategies for Seizing Control of Your Industry and Creating the Markets of Tomorrow (New York: Harvard University Press, 1994). 28 Roberts, Managing Systems of Secondary Cities, 67. 29 Ibid., 68. 30 Ibid., 68. 31 ‘Home economics: Sky-high house prices in the most desirable cities are holding back growth and jobs’, The Economist, 4 October 2014. 32 A. Anas, ‘Vanishing cities: What does the new economic geography imply about the efficiency of urbanization?’ Journal of Economic Geography 4(2) (2004): 181–99. 33 Metropolis, Commission 2: Managing Urban Growth (Barcelona: Metropolis, 2011), 86. 34 P. Ni, P.K. Kresl and C.P. Vaughan, Global Urban Competitiveness Report (2009–2010) (Beijing: Social Sciences Academic Press, 2010), 525. 35 Y. Selfin, R. Snook and M. Božić, Economic Views: Future Industry Clusters (London: PricewaterhouseCoopers, 2010), 12. 36 Y. Huang and A.M. Bocchi, eds, Reshaping Economic Geography in East Asia – 2009 (Washington, DC: World Bank, 2009). 37 Annez and Buckley, Urbanization and Growth, 1–44. 38 S. Kuznets, ‘Toward a theory of economic growth’, in R. Lekachman, ed., National Policy for Economic Welfare at Home and Abroad (New York: Doubleday, 1955). 39 United Nations World Commission on Environment and Development (WCED), Our Common Future (Oxford: Oxford University Press, 1987). 40 ‘The decoupling debate’, The Economist, 6 March 2008. 41 P. James et al., Urban Sustainability in Theory and Practice: Circles of Sustainability (London: Routledge, 2015). 42 J. Day et al., America’s Most Sustainable Cities and Regions: Surviving the 21st Century Megatrends (New York: Springer, 2016). 43 M. Wackernagel et al., ‘The ecological footprint of cities and regions: Comparing resource availability with resource demand’, Environment and Urbanization 18(1) (2006): 103–12. 44 United Nations, Handbook of National Accounting Integrated Environmental and Economic Accounting: An Operational Manual (New York: United Nations, 2000). 45 R.L. Burritt et al., ‘Sustainability accounting in local government: Comparisons between Japan and Australia’, Journal of the Asia Pacific Centre for Environmental Accountability 15(3) (2009): 3–8. 46 S.P. Osborne and A. Ball, eds, Social Accounting and Public Management: Accountability for the Public Good (New York: Routledge, 2010), 396. 47 Roberts et al., Shaping the Future through an Asia-Pacific Partnership, 60. 48 A.M. Garland, M. Massoumi and B.A. Ruble, eds, Global Urban Poverty: Setting the Agenda (Washington, DC: Woodrow Wilson International Center for Scholars, 2007), 249. 49 J.L. Baker, Urban Poverty: A Global View (Washington, DC: World Bank: 2008), 37. 50 UNESCAP (United Nations Economic and Social Commission for Asia and the Pacific), ‘Poverty and inequality’, in Statistical Yearbook for Asia and the Pacific 2009 (Bangkok: UNESCAP, 2009), 121–6. 51 Hamel and Prahalad, Competing for the Future. 52 M. Hildebrand, T. Kanaley and B.H. Roberts, Sustainable and Inclusive Urbanization in Asia (Bangkok: UNESCAP, 2013), 83. 53 ADB (Asian Development Bank), Good Governance Practices:Lessons Learned from the Implementation of Projects with Governance Objectives (Manila: ADB, 2005); B. Dahiya, ‘Cities in Asia, 2012: Demographics, economics, poverty, environment and governance’, Cities 29 (2012): S44–61; Y. Harashima, ‘Environmental governance in selected Asian
476
54 55 56 57 58 59 60 61 62 63 64 65 66 67 68 69
70
71 72 73 74
75 76
developing countries’, International Review for Environmental Strategies 1(1) (2000): 15; H. Jusoh, J.A. Malek and A.A. Rashid, ‘The role of efficient urban governance in managing Kuala Lumpur city–region development’, Asian Social Science 5(8) (2009): 14–43; F. Tibor, A. Farcombe and F.E. Gentoral, Managing Rapid Urban Growth in the Philippines: The Metropolitan Iloilo Arrangement (INTA 28 World Urban Development Congress, Kuala Lumpur, Malaysia, 2003), 24; World Bank, China Governance, Investment Climate, and Harmonious Society: Competitiveness Enhancements for 120 Cities in China (Washington, DC: World Bank, 2006) 133. S. Lehmann, ed., Low Carbon Cities: Transforming Urban Systems (London: Earthscan, 2014). V. Nehru and A. Dhareshwar, ‘A new database on physical capital stock: Sources, methodology and results’, Revista de Analisis Economica 8(1) (1993): 37–59. C. Tacoli, The Earthscan Reader in Rural–Urban Linkages (London: Earthscan, 2006), 396. J. Allen and S. Eaqub, Core Cities Collaborating for Growth: International Experience (Wellington: New Zealand Institute of Economic Research, 2012), 33. Ibid. L. DePillis, ‘Everything you need to know about the Trans Pacific Partnership’, Washington Post, 11 December 2013. M.A. Villarreal, The Pacific Alliance: A Trade Integration Initiative in Latin America (Washington, DC: Congressional Research Service, 2016). J. Rivkin, The Third Industrial Revolution (Palgrave McMillan, New York, 2011), 281. B.H. Roberts, ‘The third industrial revolution: Implications for planning cities and regions’ (working paper, Brisbane, 2015), 22. CEDA (Committee for Economic Development of Australia), Australia’s Future Workforce? (Melbourne: CEDA, 2015), 258. United Nations, The Future We Want (Rio de Janeiro: United Nations, 2012). M. Fujita and P. Krugman, ‘The new economic geography: Past, present and the future’, Papers in Regional Science 83(1) (2004): 139–64. C.E. Lindblom, ‘The science of “muddling through”’, Public Administration Review 19 (1959): 79–88. UNDP (United Nations Development Programme), World Economic and Social Survey 2013: Sustainable Development Challenges (New York: UNDP, 2013), 160. Hildebrand et al., Sustainable and Inclusive Urbanization, 83. C.B. Costantinos, Theories of Governance and New Public Management: Links to Understanding Welfare Policy Implementation (2010), https://www.academia.edu/2115083/Theories_of_Governance_and_New_Public_Manage ment?auto=download K.J. Peak, Organization and Administration: Principles and Practices Justice Administration: Police, Courts and Corrections Management, 7th edn. (New York: Prentice Hall, 2012), 39. B. Roberts, Secondary Cities: Managing Urban Land Governance Systems (Washington, DC: World Bank, 2014), 10. D. Osborne and T. Gaebler, Reinventing Government (London: Addison-Wesley, 1992) N. Kwak et al., ‘Transformation of citizenship and governance in Asia: The challenges of social and mobile media’, Journal of Democracy and Open Government 5(1) (2013): i-iii. M. Castells, ‘The new public sphere: Global civil society, communication networks, and global governance’, The Annals of the American Academy of Political and Social Science 616(1) (2008): 78–93. K. Emerson, T. Nabatchi and S. Balogh, ‘An integrative framework for collaborative governance]’, Journal of Public Administration Research and Theory 22(1) (2012): 1–29. C. Ansell and A. Gash, ‘Collaborative governance in theory and practice’, Journal of Public Administration Research and Theory 18(4) (2008): 543–71.
477
77 A. Liu and R. Donahue, ‘Chicago and Mexico City cut new kind of trade deal’, blog, Brookings, 18 November 2013, http://www.brookings.edu/blogs/theavenue/posts/2013/11/18-chicago-mexico-city-liu-donahue 78 Ibid. 79 APEC (Asia-Pacific Economic Cooperation), The Concept of the Low Carbon Town in the APEC Region, 2nd edn. (Singapore: APEC Secretariat, 2012), 120. 80 Roberts et al., Shaping the Future through an Asia-Pacific Partnership. 81 Mercer, Quality Of Living Worldwide City Rankings – Mercer Survey 2016 (New York City, New York: Mercer, 2016). 82 Solidiance, The Most Innovative Cities in Singapore (Singapore: Solidiance, 2014), 58 83 R. Dobbs et al., Urban World: Mapping the Economic Power of Cities (San Francisco, McKinsey Global Institute, 2011). 84 OECD (Organisation for Economic Co-operation and Development), OECD Territorial Reviews: Competitive Cities in the Global Economy (Paris: OECD, 2006), 446. 85 G. McDonald et al., Understanding Auckland’s Role in New Zealand’s Global Engagement: Exports of Merchandise Trade and Services (Auckland: Auckland Council, 2010). 86 ATEED (Auckland Tourism, Events and Economic Development), Auckland’s Economic Development Strategy (Auckland: Auckland Regional Council, 2013). 87 McDonald et al., Understanding Auckland’s Role. 88 Market Economics Limited, ‘Economic impacts of the Ports of Auckland Limited 2010, 2021 and 2031’ (Auckland: Ports of Auckland, 2011). 89 ATEED, Auckland’s Economic Development Strategy. 90 MFAT (Ministry of Foreign Affairs and Trade, New Zealand) (2015). ‘Trade and economic relations – Trade relationships and agreements’, accessed 6 June 2016, https://www.mfat.govt.nz/en/trade/free-trade-agreements/free-trade-agreements-in-force/ 91 Observatory of Economic Complexity, ‘OEC: New Zealand (NZL) profile of exports, imports and trade partners’, accessed 6 June 2016, http://atlas.media.mit.edu/profile/country/nzl/ 92 Economist Intelligence Unit, Hot Spots 2025: Benchmarking the Future Competitiveness of Cities (London: Economist Intelligence Unit: 2013). 93 ATEED, Auckland’s Economic Development Strategy, 161. 94 Ibid. 95 NZAE (New Zealand Association of Economists), ‘Labour market 2011: How does Auckland compare with the rest of New Zealand?’, Statistics New Zealand, accessed 1 April, 2016, http://www.stats.govt.nz/browse_for_stats/income-andwork/employment_and_unemployment/auckland-labour-market.aspx 96 NZAE, ‘Labour market 2011’. 97 Ascari and Richard Paling Consulting, Economic Linkages within Auckland: Summary Report (Auckland: Ministry of Business, Innovation & Employment, 2013) 98 Ibid. 99 Ibid. 100 Auckland Council, ‘Climate change’, accessed 2 April, 2016, http://www.aucklandcouncil.govt.nz/en/environmentwaste/naturalhazardsemergencies/haza rds/pages/climatechangehazards.aspx. 101 Auckland Council, Section 2: Draft Auckland 30 Year Infrastructure Strategy – Long-Term Plan 2015–2015 (LTP) (Auckland: Auckland Council, 2014). 102 Auckland Council, ‘Long-term plan 2012–2022’ (Auckland: Auckland Council, 2011), accessed 22 April 2015, http://www.aucklandcouncil.govt.nz/Plans/LongTermPlan/VolumeTwo/index.html. 103 GoNZ (Government of New Zealand) National Infrastructure Plan (Wellington: GoNZ, 2011), 68.
478
104 Auckland Council, ‘Auckland’s physical and social infrastructure’, in The Auckland Plan (Auckland: Auckland Council, 2011). 105 Auckland Council, Section 2: Draft Auckland 30 Year Infrastructure Strategy. 106 Auckland Council, ‘Infrastructure failure’, accessed 7 May 2015, http://www.aucklandcouncil.govt.nz/EN/environmentwaste/naturalhazardsemergencies/haz ards/Pages/infrastructurefailure.aspx 107 G. Hart, Vulnerability and Adaptation to Sea-Level Rise in Auckland (Wellington: The New Zealand Climate Change Research Institute, Victoria University of Wellington, 2011), 73. 108 Auckland Council, The Auckland Plan: Our Auckland (Auckland: Auckland Council, 2012), Section 7. 109 Auckland Council, Section 2: Draft Auckland 30 Year Infrastructure Strategy. 110 C. Crothers, ‘Auckland Region population in 2048’ (working paper, Auckland: Auckland University of Technology, 2015), 6. 111 Statistics New Zealand, Census 2006 – Auckland City (Auckland: Statistics New Zealand, 2007). 112 Auckland Council, Section 2: Draft Auckland 30 Year Infrastructure Strategy. 113 ‘The Treaty in brief’, New Zealand History, accessed 6 June 2016, http://www.nzhistory.net.nz/politics/treaty/the-treaty-in-brief 114 Ibid. 115 J. Phillips, ‘The New Zealanders’, Te Ara – The Encyclopedia of New Zealand, updated 26 April 2013, http://www.TeAra.govt.nz/en/the-new-zealanders/page-13 116 P. Spoonley and C.L. Meares, ‘Laissez-faire multiculturalism and relational embeddedness: Ethnic precincts in Auckland. Cosmopolitan civil societies’, An Interdisciplinary Journal 3(1) (2011): 42–64. 117 P. Salmon, M. Bazley and D. Shand, Royal Commission on Auckland Governance: Report (Wellington, New Zealand Government, 2009). 118 Ibid., 117. 119 J. Minnery, ‘Bigger is best? Emulation in the formation of Greater Brisbane in 1924’, in Conference: European Association for Urban History (Lisbon: University of Queensland, 2014) 120 Ibid. 121 PCNZ (Property Council of New Zealand), Submission to the Proposed Auckland Unitary Plan (Auckland: PCNZ, 2014), 83. 122 S. Walker, ‘Understanding our responsibilities’ (2012), Audit New Zealand, accessed 6 June 2016, http://www.auditnz.govt.nz/publications-resources/information-updates/2014information-updates/presentation-stephen-walker 123 Auckland Council, ‘Long-term plan 2012–2022’. 124 ATEED, Auckland’s Economic Development Strategy. 125 Core Cities, ‘Core Cities Partnership’, accessed 6 June 2016, http://www.corecities.com/about-us/core-cities. 126 Allen and Eaqub, Core Cities Collaborating for Growth, 33. 127 The contribution of Professor Harvey Perkins, formerly Director of the University of Auckland Transforming Cities initiative, is acknowledged. 128 Landcare Research Manaaki Whenua, ‘Building urban landscapes and collaboration at Wynyard Quarter’ (2015), accessed 6 June 2016, http://www.landcareresearch.co.nz/about/news/video/building-urban-landscapes-andcollaboration-at-wynyard-quarter 129 Auckland Council, ‘North west transformation’, accessed 6 June 2016, http://www.aucklandcouncil.govt.nz/EN/planspoliciesprojects/CouncilProjects/northwesttr ansformation/Pages/home.aspx. 130 Tamaki Regeneration Company website, accessed 6 June 2016, http://www.tamakitrc.co.nz/.
479
131 Committee for Auckland, ‘News and publications: Tamaki Redevelopment Company Regeneration Programme’ (September 2011), accessed 6 June 2016, http://www.committeeforauckland.co.nz/newsandpublications/latest-news/8-news-andpublications/i?bsepidorts-aneconsubmissions 132 Tamaki Regeneration Company, ‘Ta-Maki Regeneration: Making it happen’ (Auckland: Tamaki Redevelopment Company, 2013). 133 F. Lavigne et al., ‘The 21 February 2005, catastrophic waste avalanche at Leuwigajah dumpsite, Bandung, Indonesia’, Geoenvironmental Disasters 1(1) (2014): 1–12. 134 G. Tanuwidjaja, ‘The city of Bandung and review of Bandung spatial planning strategies in 2005’ (Green Impact Indonesia, 2010). 135 A.K.M. Tarigan et al., ‘Bandung City, Indonesia’, Cities 50 (2016): 100–10. 136 Nandi, ‘Promoting sustainable development in spatial planning of Bandung City’ (paper presented at the The Future of Urban dan Peri Urban in Indonesia, Yogyakarta, Indonesia, 2011). 137 R. Sobandi, ‘The governance of innovation towards urban sustainability: A comparative analysis of Bandung and Surakarta challenges’ (paper presented at Innovation and Sustainability Transitions in Asia, University of Malaya, Kuala Lumpur, 2011). 138 United Nations, World Urbanization Prospects: The 2014 Revision. 139 G. Jones and W. Mulyana, Urbanization in Indonesia (Jakarta: United Nations Population Fund, 2015). 140 Besides the city of Bandung, there is also the regency (or Kabupaten) of Bandung adjacent to the city. Kabupaten is a government unit at the same level as a city but with a rural majority. However, a large part of Kabupaten Bandung has become urbanized as an overflow of the city of Bandung. This regency, along with the city of Bandung, the city of Cimahi, West Bandung regency and Sumedang regency, forms an urban agglomeration of more than 8 million people known as the Bandung Metropolitan Area or Greater Bandung (Bandung Raya). 141 V.S. Ardiwijaya et al., ‘Bandung urban sprawl and idle land: Spatial environmental perspectives’, APCBEE Procedia 10 (2014): 208–13. 142 Ibid. 143 T. Firman, ‘The continuity and change in mega-urbanization in Indonesia: A survey of Jakarta–Bandung Region (JBR) development’, Habitat International, 33(4) (2009): 327–39. 144 ASEAN (Association of Southeast Asian Nations), Framework Agreement on Comprehensive Economic Co-Operation between the Association of South East Asian Nations and the People's Republic of China (Jakarta: ASEAN, 2002.) 145 Economist Intelligence Unit, Hot Spots 2025. 146 T.L. Blair, Strengthening Urban Management: International Perspectives and Issues (New York: Springer, 2013). 147 P. Ellis, ‘Indonesia: The rise of metropolitan regions: Towards inclusive and sustainable regional development’ (working paper, Washington, DC: World Bank, 2011), xiii. 148 BPPT Kota Bandung, ‘Penyediaan layanan perizinan cepat dan mudah’ [The provision of quick and easy licensing services], accessed 6 June 2016, http://www.bppt.bandung.go.id 149 The Asia Foundation, Local Economic Governance (LEG): A Survey of Business Operators in 245 Districts/Municipalities in Indonesia, 2011 (San Francisco: The Asia Foundation, 2011). 150 A.F. Aritenang, ‘The city of Bandung: Unfolding the process of a Creative City’ (Jakarta: Agency for the Assessment and Application of Technology, 2012). 151 W.K. Soedarsono, ‘Creativity and city development – Creative communities and the making of place: Sharing Bandung experiences’ (paper presented at the 3rd China-ASEAN Cultural Industry Forum, Nanning, China, 2009). 152 S.R. Maryunani and I.R. Mirzanti, ‘The development of entrepreneurship in creative industries with reference to Bandung as a creative city’, Procedia – Social and Behavioral Sciences 169 (2015): 387–94.
480
153 BPS (Badab Pusat Statistik, or Central Board of Statistics) website, accessed 6 June 2016, http://www.bps.go.id/ 154 A. Yanuarsyah, ‘Analysis the role of creative economic sector in Bandung economy: Review of Input-Output’ (Master’s thesis, University of Indonesia, 2015). 155 BCCF (Bandung Creative City Forum) website, accessed 6 June 2016, https://kitabisa.com/partners/bccf 156 T. Durrani et al. ‘10th Triple Helix Conference 2012: Bandung as service city in Indonesia: Role of academician, business, and community’, Procedia - Social and Behavioral Sciences 52 (2012/01/01 2012): 317–24. 157 BIRMS (Bandung Integrated Resources Management System) website, accessed 6 June 2016, http://birms.bandung.go.id/ 158 D. Arifwidodo and R. Perera, ‘Quality of life and compact development policies in Bandung, Indonesia’, Applied Research Quality Life 6 (2011): 159–79. 159 F. Jabar, ‘Urban Mobility Project – Pilihan kenyamanan transportasi warga Kota Bandung [Transportation convenience and choice for the citizens of Bandung City]’, fokusjabar.com, 9 March 2015, http://fokusjabar.com/2015/03/09/urban-mobility-project-pilihankenyamanan-transportasi-warga-kota-bandung/ 160 ‘Teknopolis: Mimpi Ridwan Kamil membuat Bandung menjadi Silicon Valley-nya Indonesia [Technopolis: Ridwan Kamil’s dream of making Bandung Indonesia’s Silicon Valley]’, Harian Terbit, 24 March 2015, http://www.harianterbit.com/hanteriptek/read/2015/03/24/23247/34/22/Teknopolis-MimpiRidwan-Kamil-Membuat-Bandung-Menjadi-Silicon-Valley-nya-Indonesia 161 Grantham Research Institute, ‘National Medium Term Development Plan 2015–2019’ (London: Grantham Research Institute, London School of Economics, 2015). 162 Bappenas (Badan Perencanaan Pembangunan Nasional, or Indonesia National Development Planning Agency), ‘Public private partnerships: Infrastructure project plan in Indonesia’ (Jakarta: Bappenas, 2015), http://pkps.bappenas.go.id/attachments/article/1302/PPP%20Book%202015.pdf 163 E. Suharto, ‘Profiles and dynamics of the urban informal sector in Indonesia: A study of pedagang kakilima in Bandung’ (PhD thesis, Massey University, New Zealand, 2002). 164 ADB, The Informal Sector and Informal Employment in Indonesia: Country Report 2010 (Manila: ADB, 2010). 165 Lavigne et al., ‘The 21 February 2005, catastrophic waste avalanche’. 166 ADB, Greater Mekong Subregion Urban Development Strategic Framework 2015–2022 (Manila: ADB, 2015), 42. 167 ADB, Regional Implementation of the Greater Mekong Subregion Cross-Border Transport Agreement (Manila: ADB, 2016). 168 ADB, ‘Multisector development in the Greater Mekong Subregion’, accessed 15 April 2012, http://www.adb.org/countries/gms/sector-activities/multisector 169 M. Ishida and I. Isono, ‘Old, new and potential economic corridors in the Mekong region’, in Emerging Economic Corridors in the Mekong Region (research report, Bangkok: Bangkok Research Center, 2012). 170 ADB, ‘Projects’, accessed 15 April 2012, http://www.adb.org/projects/36064-012/main 171 A. Maulion and F. Steinberg, ‘Bangkok to Ho Chi Minh: Competitiveness of cities along corridors in South East Asia’, in F. Steinberg and J. Hakim, Urban Development in the Greater Mekong Subregion (Manila: ADB, 2016) 172 ADB, The Greater Mekong Subregion Economic Cooperation Program Strategic Framework, 2012– 2022 (Manila: ADB, 2011). 173 UNESCAP, ‘Are we building competitive and livable cities? Guidelines for developing eco-efficient and socially inclusive infrastructure’ (2011), accessed 18 April 2012, http://www.unescap.org/esd/environment/infra/documents/Guidelines.pdf?bcsi_scan_97e9 8328e2b67804=1
481
174 ‘Bangkok – economy’, accessed 27 May 2016, http://www.liquisearch.com/bangkok/economy 175 ‘Business & Industry’, referbangkok.com, accessed 27 May 2016, http://www.referbangkok.com/bangkok/business/index.php 176 Economist Intelligence Unit, Hot Spots – Benchmarking Global City Competitiveness (London: Economist Intelligence Unit, 2012). 177 K. Schwab, ed., The Global Competitiveness Report 2011–2012 (Geneva: World Economic Forum, 2012). 178 ‘Emerging champions highlight Asian dynamism, Thai promise’, Bangkok Post, 9 April 2012. 179 Suvarnabhumi Airport Thailand, ‘Suvarnabhami stands 6th in the 10 most on time airports – ForbesTraveler’, 20 July 2008, http://www.airportsuvarnabhumi.com/suvarnabhumistands-6th-in-the-10-most-on-time-airports-forbestraveler/ 180 ‘The world’s top 100 airports: Listed, ranked and mapped’, blog, The Guardian, accessed 20 April 2012, http://www.theguardian.com/news/datablog/2012/may/04/world-top-100airports 181 C. Krainara and J.K. Routray, ‘Cross-border trades and commerce between Thailand and neighboring countries: Policy implications for establishing special Border Economic Zones’, Journal of Borderlands Studies 30(3) (2015): 345–63. 182 ILO (International Labour Organization) Regional Office for Asia and the Pacific, Thailand – A Labour Market Profile (Bangkok: ILO, 2013). 183 UNESCO (United Nations Educational, Scientific and Cultural Organization), UNESCO National Education Support Strategy (UNESS) Thailand 2010–2015 (Bangkok: UNESCO, 2011). 184 UNESCO Bangkok, ‘Education system profiles: Technical and vocational education and training’ (2010), accessed 27 May 2016, http://www.unescobkk.org/education/resources/resources/education-systemprofiles/thailand/higher-tvet/ 185 World Bank, ‘Thailand ranks 17 in the world in ease of doing business as business regulations improve in East Asia and the Pacific’, press release, 19 October 2011, http://www.worldbank.org/en/news/press-release/2011/10/19/thailand-ranks-17-worldease-doing-business-business-regulations-improve-east-asia-pacific.print 186 M.G. Boarnet and S. Handy, ‘Technical background document on the impacts of residential density based on a review of the empirical literature’, accessed 20 April 2012, http://www.arb.ca.gov/cc/sb375/policies/density/residential_density_bkgd120313.pdf 187 Economist Intelligence Unit, Hot Spots 2025. 188 Bangkok Metropolitan Administration, ‘About BMA’, accessed 1 September 2016, http://www.bangkok.go.th/main/page.php?329 189 Cambodia National Institute of Statistics. ‘Income composition, average per month’ (2010), accessed 18 April 2012, http://www.nis.gov.kh/nis/CSES/Data/CSES9.html 190 UN-Habitat, State of the World’s Cities 2010/2011: Bridging the Urban Divide (London: Earthscan, 2008), 167. 191 ‘Economics in Cambodia’, factsanddetails.com, accessed 20 April 2012, http://factsanddetails.com/southeast-asia/Cambodia/sub5_2d/entry-2922.html 192 Tourism Cambodia, ‘Provinces’, accessed 20 April 2012, http://www.tourismcambodia.com/travelguides/provinces/phnom-penh/economy.htm 193 ‘Exports boost trade surplus in HCM City’, Viet Nam Development Gateway, 25 October 2011, http://Viet Namgateway.org.vn/index.php/news/article/view/81/6841/ 194 ‘Overhaul of commercial banks a vital step’, The Business Times, 6 March 2012, http://businesstimes.com.vn/overhaul-of-commercial-banks-a-vital-step/ 195 K.A.S. Murshid and T. Sokphally, ‘The cross border economy of Cambodia: An exploratory study’ (working paper, Phnom Penh: Cambodia Development Resource Institute, 2005).
482
196 ‘Public-private partnership woes’, Bao Viet Nam, 12 November 2008, https://baoViet Nam2.wordpress.com/2008/11/12/public-private-partnership-woes/ 197 Italian Institute for Foreign Trade, Viet Nam Infrastructure Development in Ho Chi Minh City (Phnom Penh: Italian Institute for Foreign Trade, 2009). 198 ‘Marching toward the East Sea’, Shipping Times, 20 March 2006, http://www.vpa.org.vn/detail_temp.jsp?page=36&id=750&cate_id=22 199 Tan Thuan Industrial Promotion Company Limited, ‘Nguyen Van Linh Parkway’, accessed 6 June 2016, http://www.ttipc.vn/en-US/nguyen-van-linh--parkway 200 ‘About Ho Chi Minh City’, Engineering Technology International Conference, accessed 6 June 2016, http://etic2016.unimap.edu.my/index.php/working-on-your-site; ‘Ho Chi Minh City’, DGI Travel, accessed 6 June 2016, http://www.dgitravel.vn/Placeses/VietNam/SOUTH/Ho-Chi-Minh-city/(tour)/show 201 L.C. Blancas and M.B. El-Hifnawi, Facilitating Trade through Competitive, Low-carbon Transport: The Case for Viet Nam’s Inland and Coastal Waterways (Washington, DC: World Bank. 2015). 202 ADB, Economic Corridor Development for Inclusive Asian Regional Integration (Manila: Asian Development Bank, 2013), 69. 203 Maulion and Steinberg, ‘Bangkok to Ho Chi Minh’. 204 ADB, Greater Mekong Subregion: Maturing and Moving Forward: Evaluation Study (Manila: ADB, 2008), 100. 205 Queensland Government, South East Queensland Regional Plan 2009–2031 (Brisbane: Department of Infrastructure and Planning, 2009), 164. 206 J. Abbott, Collaborative Governance and Metropolitan Planning in South East Queensland – 1990 to 2010: From a Voluntary to a Statutory Model (Sydney: Australian Centre of Excellence for Local Government, University of Technology Sydney, 2012). 207 B. Roberts and T. Kanaley, eds, Urbanization and Sustainability in Asia: Case Studies of Good Practice (Manila: ADB and Cities Alliance (World Bank), 2006). 208 DSDIP (Department of State Development, Infrastructure and Planning, Queensland Government), South East Queensland Regional Plan Review: A Snapshot of the South East Queensland region (Fact sheet No. 4, Brisbane: Department of State Development, Infrastructure and Planning, Queensland Government, 2014). 209 Ibid. 210 BCC (Brisbane City Council), Brisbane Economic Development Plan 2012–2031 (Brisbane: BCC, 2012), 3. 211 Ibid., 5. 212 QTT (Queensland Treasury and Trade), Experimental Estimates of Gross Regional Product 2000–01, 2006–07 and 2010–11 (Brisbane: Queensland Treasury and Trade, 2013), 77. 213 S. Allen, Urban Competitiveness Index of Australian Cities (Canberra: ANZSOG Institute for Governance, University of Canberra, 2013). 214 R. Hu, ‘Sustainability and competitiveness in Australian cities’, Sustainability 7 (2015): 1840–60. 215 CBRE, ‘Australian Industrial Market Review’ (Q1 2013) (Brisbane, Market Reports), accessed 22 May 2013, http://www.cbre.com.au/research/Pages/australia-reports.aspx 216 Brisbane Marketing, Brisbane Economic Series – Issue 10 (Brisbane: Brisbane Marketing, 2014). 217 T. Krimmer, Brisbane’s Innovation Ecosystem: A Snapshot (Brisbane: Innovative Regions Centre and Enterprise Connect Queensland, 2012). 218 Australian Taxation Office, ‘Pocket Guide to the Australian tax system: Part 1: Australia’s tax system compared with the OECD’, accessed 6 June 2016, http://www.treasury.gov.au/Policy-Topics/Taxation/Pocket-Guide-to-the-Australian-TaxSystem/Pocket-Guide-to-the-Australian-Tax-System/Part-1 219 ABS (Australian Bureau of Statistics) Regional Aspects of Australia’s R&D Activities, ABS 8112.0 (Canberra: ABS, 2003), 14.
483
220 221 222 223 224 225
BCC, Brisbane Economic Development Plan 2012–2031. BCC, Brisbane 2022: New World City Action Plan (Brisbane: BCC, 2015). Ibid., 9 Ibid., 20. DSDIP, South East Queensland Regional Plan Review. Synergies Economic Consulting, Skills Shortages in the Greater Brisbane Labour Market 2012–2021, 2013 Update (Brisbane: Synergies Economic Consulting, 2013). 226 BCC sources, based on National Institute of Economic and Industry Research (NIEIR) economic analysis. 227 J. Kelly and P. Donegan, Mapping Australia’s Economy: Cities as Engines of Prosperity (Melbourne: Grattan Institute, 2014). 228 DIP (Department of Infrastructure and Planning, Queensland Government), South East Queensland Regional Plan 2009–2031 (Brisbane: DIP, 2009) 229 Brisbane Marketing, Brisbane Economic Series – Issue 10. 230 BTRE (Bureau of Transport and Regional Economics, Commonwealth of Australia), ‘Estimating urban traffic and congestion cost trends for Australian cities’ (working paper, Canberra: BTRE, 2007). 231 DTMR (Department of Transport and Main Roads, Queensland Government), Connecting SEQ 2031: An Integrated Regional Transport Plan for South East Queensland (Brisbane: DTMR, 2011) 232 BCC, ‘Fact sheet: Brisbane City Council 12-month flood recovery report’ (Brisbane: BCC, 2012). 233 A. Bruns et al., ‘Sharing news, making sense, saying thanks: Patterns of talk on Twitter during the Queensland floods’, Australian Journal of Communication 40 (2012): 23–37. 234 R. Atkinson et al., Urban 45: New Ideas for Australia’s Cities (Melbourne: RMIT, 2007) 235 Brisbane Marketing, Brisbane Economic Series – Issue 4: The Economy (Brisbane: Brisbane Marketing, 2012). 236 BCC, Seniors’ Strategy 2012–2017 (Brisbane: BCC, 2012) 237 Economist Intelligence Unit, Global Liveability Ranking and Report 2014 (New York: Economist Intelligence Unit, 2014). 238 Brisbane Marketing, Brisbane Economic Series – Issue 4. 239 Demographia, 11th Annual Demographia International Housing Affordability Survey: 2015 (Belleville, IL: Demographia, 2015). 240 Global Property Guide, ‘House price rises accelerating in Australia’, 30 January 2016, http://www.globalpropertyguide.com/Pacific/Australia/Price-History 241 Queensland Government, The Queensland Plan Regional Snapshot: Brisbane (Brisbane: Queensland Government, 2013). 242 J. Dodson and N. Sipe, ‘Unsettling suburbia: The new landscape of oil and mortgage vulnerability in Australian cities’ (research paper, Brisbane: Griffith University, 2008). 243 D. Low Choy et al., Climate Change Vulnerability in South-East Queensland: A Spatial and Sectoral Assessment (Report for the South East Queensland Climate Adaptation Research Initiative, Brisbane: Griffith University, 2010). 244 Ibid., 74. 245 J. Abbott, ‘Regions of cities: Metropolitan governance and planning in Australia’, in J. Xu and A. Yeh, eds, Governance and Planning of Mega-City Regions: An International Comparative Perspective (New York: Routledge, 2010), Ch. 8. 246 BCC, Brisbane Vision 2031 (Brisbane: BCC, 2013). 247 S. Lawson, ‘The post justice city? Spatial targeting, social disadvantage and rescaling urban governance in Australia’ (Brisbane: Griffith University, 2008). 248 Ibid. 249 Ibid. 250 Ibid., 44. 251 DIP, South East Queensland Regional Plan 2009–2031.
484
252 Abbott, Collaborative Governance, 57. 253 B. Gleeson, J. Dodson and M. Spiller, Metropolitan Governance for the Australian City: The Case for Reform (Brisbane: Griffith University, 2010), 7–11. 254 Ibid., 68. 255 BCC, Brisbane 2022. 256 Ibid. 257 Abbott, Collaborative Governance, 81. 258 Ibid., 69. 259 ATC (Australia Trade Coast), ‘The region: Economic growth’, accessed 3 June 2016, http://www.australiatradecoast.com/the-region/economic-growth/ 260 Contribution by Tony Duncan, former Head of the Brisbane Urban Renewal Task Force. 261 BCC, Urban Renewal Brisbane: The Making of a New World City 1991–2012 (Brisbane: BCC, 2012). 262 Ibid. 263 Abbott, Collaborative Governance, 29. 264 Healthy Waterways, ‘The new report card and monitoring program’, accessed 6 June 2016, http://healthywaterways.org/report-card 265 Professor Leslie Chenoweth, Griffith University, Queensland, advisor to Logan Community Partnership, contributed to this section. 266 LCC (Logan City Council), ‘Logan Together’, accessed 6 June 2016, http://www.logan.qld.gov.au/community-support/city-of-choice/logan-together 267 Logan Together Working Group, ‘Logan Together Prospectus’, July 2014, 4, http://cocb.org.au/wp-content/uploads/Prospectus-Logan-Together-15-July-2014.pdf 268 Ibid. 269 Ibid. 270 2015 Asia Pacific Cities Summit website, accessed 6 June 2016, http://www.apcsummit.org 271 Ibid. 272 Jifengxiang, 京津冀与长、珠三角地区经济发展状况对比分析 [Comparative analysis of the three mega regions in China] (Beijing: China Investment Consultancy, 2014), vol. 4, 23–27. 273 Gaoyu, 年京津冀GDP首次突破6万亿元占全国1/9 [2013 Beijing, Tianjin and Hebei Region GDP topped 6 trillion yuan accounting for 1/9 of GDP in China], Beijing Daily, 3 March 2014, http://www.gov.cn/xinwen/2014-03/03/content_2626875.htm 274 Beijing Statistics Bureau, 北京市2013年国民经济和社会发展统计公报 [Beijng Economic and Social Development Statistic Bulletin of 2013], Beijing Daily, 13 February 2014, http://bjrb.bjd.com.cn/html/2014-02/13/content_150551.htm 275 Economist Intelligence Unit, Hot Spots – Benchmarking Global City Competitiveness. 276 Baidu Encyclopedia, 天津 (中华人民共和国直辖市)[Tianjin (People's Republic of China and municipalities), accessed 20 June 2016, http://baike.baidu.com/view/2828.htm?from_id=213824&type=syn&fromtitle=%E5%A4% A9%E6%B4%A5%E5%B8%82&fr=aladdin#5 277 Tianjin Municipal People’s Government Office, 2015年工业发展情况 [2015 Industrial Development], accessed 7 March 2016, http://www.tj.gov.cn/zjtj/tjjj/gyjj/ 278 Baidu Encyclopedia, 石家庄 (河北省省会) [Shijiazhuang (Capital of Hebei Province)], accessed 20 June 2016, http://baike.baidu.com/view/4187.htm?from_id=305692&type=syn&fromtitle=%E7%9F% B3%E5%AE%B6%E 279 Baidu Encyclopedia, 保定 (河北省地级市) [Baoding (Prefecture-level city in Hebei)], accessed 6 June 2016, http://baike.baidu.com/subview/2800/11182424.htm?fromtitle=%E4%BF%9D%E5%AE% 9A%E5%B8%82&
485
280 Baidu Encyclopedia, 廊坊 [Langfang], accessed 20 June 2016, http://baike.baidu.com/view/14861.htm?from_id=11156719&type=syn&fromtitle=%E5% B 281 Beijing Municipal Land Resources Bureau, 北京市土地利用现状及供需形势, [Beijing land use and the supply and demand situation], 19 January 2010, http://www.mlr.gov.cn/tdsc/tdly/201001/t20100119_133336.htm 282 Expert Alliance, ‘Overview of the Hebei province’, accessed 6 June 2016, http://www.allianceexperts.com/en/knowledge/countries/asia/economic-overview-of-thehebei-province/ 283 Xuhui, 城镇群的转型升级与协同治理 [Transformation to upgrade and coordinate governance of metropolitan areas in China] (Internal Report from China Academy of Urban Planning and Design, Beijing: China Academy of Urban Planning and Design, 2013). 284 National Bureau of Statistics of China, ‘Table 3-15 Per Capita Gross Regional Product and Indices’, Beijing: China Statistics Book 2014, Exchange Rate 1 USD=6.1024 RMB, as at 31 December 2013, accessed 20 June 2016, http://www.stats.gov.cn/tjsj/ndsj/2014/indexch.htm, 285 Yao Lu, China’s Provincial GDP Figures in 2012 (China Briefing Business Intelligence from Dezan Shira & Associates, Shanghai, 16 May 2013), accessed 26 June 2016, http://www.china-briefing.com/news/2013/05/16/chinas-provincial-gdp-figures-in2012.html 286 ‘Steel output dips 0.6 pct in China’s Hebei in 2014’, Reuters, 25 January 2015, http://www.reuters.com/article/china-steel-hebei-idUSL4N0V51DK20150126 287 ‘ZGC new alliance set up at Beijing fair’, China Daily, 2 June 2014, http://www.chinadaily.com.cn/beijing/2014-06/02/content_17573812.htm 288 PricewaterhouseCoopers, Cities of Opportunity 6 (London: PricewaterhouseCoopers, 2014), http://www.pwccn.com/home/eng/cities_of_opportunity_6.html. 289 Zhangzhi, ‘Regional economic structure characteristics and development prediction of JJJR during “the 12th Five Year” period’, in China Regional Economic Development Report (2011–2012) (Beijing: Social Science Academic Press, 2012), 110–21. 290 General Academy of Customs, 京津冀区域通关一体化全面启动 石家庄海关首票跨关 区货物放行(图) [Beijing, Tianjin and Shijiazhuang clearance customs integration started first ticket cross-customs clearance of goods (FIG)], accessed 20 June 2016, http://stock.sohu.com/20140925/n404645190.shtmlhttp://stock.sohu.com/20140925/ n404645190.shtml 291 See: ‘30 years on, China reviews development zone policies’, Xinhua, 22 September 2014, http://english.gov.cn/policies/policy_watch/2014/09/22/content_281474988564684.htm 292 Hong Kong Trade Development Council Research website, accessed 26 June, 2016, http://china-trade-research.hktdc.com/ [26 June, 2016], 293 China International Fair for Trade in Services website, accessed 26 June, 2016, http://www.ciftis.org/en/about/introduction/ 294 A.T. Kearney, 2014 Global Cities Index and Emerging Cities Outlook: Global Cities, Present and Future (Chicago, IL: A.T. Kearney, 2014). 295 See: ‘30 years on, China reviews development zone policies’, Xinhua, 22 September 2014, http://english.gov.cn/policies/policy_watch/2014/09/22/content_281474988564684.htmhttp ://www.022net.com/2014/8-11/495624212985079.html 296 Z. Anjum, Startup Capitals: Discovering the Global Hotspots of Innovation (India: Random House, 2014), 113 297 ‘Zhongguancun Science Park’, eBeijing.gov.cn, accessed 19 September 2016, http://www.ebeijing.gov.cn/feature_2/ZhongguancunSciencePark/AboutZhongguancunSci encePark/t1322672.htm
486
298 Quotation from Zhangguancun Science Park official website, ‘Profile’, accessed 26 June 2016, http://en.zgc.gov.cn/2013-12/04/content_17148863.htm 299 2013年京津冀GDP首次突破6万亿元占全国1/9 [GDP in the Jingjinji Region is over CNY 6 trillion, equal to 1/9 of China], gov.cn, 3 March 2014, http://www.gov.cn/xinwen/2014-03/03/content_2626875.htm 300 Fan Hengshan, the deputy secretary of the National Development and Reform Commission, 2014. 301 Zhao Yinyan, 京津冀货物快运列车首开成功 畅通绿色物流通道 [The fast logistic railway in JJJR starts with easy access], Yanzhao Evening News, 21 July 2014, http://news.enorth.com.cn/system/2014/07/21/012028578.shtml 302 ‘京津冀货物快运列车今起开通 [The fast logistic railway in JJJR starts today]’, Yanzhao Evening Post, 19 July 2014, http://news.sina.com.cn/o/2014-07-19/041930544899.shtml 303 南水北调:世界距离最长的调水工程 直接受益人口1.1亿人 [South-North water diversion project to benefit 110 million Chinese directly’, CCTV, Financial, 17 August 2014, http://finance.sina.com.cn/roll/20140817/211420035742.shtml 304 Y. Deng, ‘A trio bands together’, Beijing Review, 1 May 2014, http://www.bjreview.com.cn/pdf/2014/18.pdf 305 J. Xie, ‘PPP implementation requires careful planning’, Global Times, 8 February 2015, www.globaltimes.cn/content/906590.shtml 306 ‘Foreign workers in Beijing leaving their families at home to protect them from smog’, South China Morning Post, 21 Sep 2014. 307 E-House China R&D Institute, 楼市调控政策效应逐步释放, 房价继续稳步上升 [EHouse Comprehensive Monthly Market regulation policy effect gradually released, prices continue to rise steadily], 22 May 2015, http://www.yiju.org/news/2015522/n9245932.html 308 京津冀大气治理快马加鞭 [To Enhance the Air Quality Control in the Jing-Jin-Ji], Beijing: Weekly on Stocks, accessed 26 June 2016, http://money.163.com/15/0802/15/B019CRF000254IU4.html 309 Deng, ‘A trio’. 310 ‘Editorial: An opportunity’, Beijing Review, 1 May 2014, http://www.bjreview.com.cn/pdf/2014/18.pdf 311 Deng, ‘A trio’. 312 Ibid. 313 Ibid. 314 L.L. Wang, Green Media: Environmental Communication in China (Beijing: Tsinghua University Press, 2005). 315 W. Fu, ‘The Beijing–Tianjin–Hebei integration can only be realized through competition’, SIFL Institute, 9 April 2014, http://www.sifl.org.cn/en/show.asp?id=286 316 ‘Integration of Beijing, Tianjin and Hebei set to be signature project of Xi Jinping's administration’, South China Morning Post, 25 June 2014, http://www.scmp.com/news/china/article/1539886/integration-beijing-tianjin-and-hebeiset-be-signature-project-xi 317 Ibid. 318 ‘京津冀三地互动频繁 一体化方案下半年有望出台 [Frequent activities among Beijing, Tianjin and Hebei, the integration plan expected late this year]’, China Broadcasting Web, 23 July 2014, http://money.163.com/14/0723/11/A1RA6M9S00254TI5.html 319 R. Yu, B. Jin Bo and L. Yang, ‘Beijing–Tianjin–Hebei integration offers new engines of economic growth’, China Social Sciences Today, 21 May 2015, http://www.csstoday.com/Item/2101.aspx
487
320 ‘The importance of the Pearl River Delta in China’, ChineseConnects.com, 28 November 2013, http://translate.chineseconnects.com/importance-pearl-river-delta-china/ 321 Binhai Development Research Institute, accessed 6 June 2016, http://teda.nankai.edu.cn/en/4122/list.htm 322 City of Kitakyushu, 北九州市公害対策史:解析編 [The History of Kitakyushu’s Measures to Combat Pollution – Analysis] (Kitakyushu: City of Kitakyushu, 1999). 323 City of Kitakyushu, 北九州市新成長戦略 [New Growth Strategy] (Kitakyushu: City of Kitakyushu, 2013). 324 Ibid. 325 OECD, OECD Territorial Reviews, 446. 326 Kitakyushu Science and Research Park website, accessed 1 April 2015, http://www.ksrp.or.jp/english/index.html 327 City of Kitakyushu, 北九州市環境基本計画進捗評価報告 [Report of the Achievement of Kitakyushu Environmental Model] (Kitakyushu, Japan: City of Kitakyushu, 2014) 328 City of Kitakyushu, 北九州市物流拠点化戦略基本方針 [City of Kitakyushu Logistics Strategy], accessed 17 Jun 2015, http://www.city.kitakyushu.lg.jp/kou-ku/20400004.html 329 Ibid. 330 Yaskawa Electric Corporation, 3つの世界No.1 [Three number 1 technologies in the world], accessed 25 June 2015, https://www.yaskawa.co.jp/recruit/about/no1.html 331 Zenrin Co, Ltd. website, accessed 25 June 2015, http://www.zenrin.co.jp/english/ 332 TOTO Ltd., 世界のお客様へ向けて [For international customers], accessed 25 June 2015, http://www.toto.co.jp/company/profile/oversea/ 333 Fukuoka City website, accessed 4 April 2015, http://www.city.fukuoka.lg.jp/english/ 334 Kyushu Economic Research Center, ‘Current economic climate in Kyushu’, accessed 4 April 2015, http://www.fukuoka-reit.jp/beginner/potential/img/pdf/carrent_economic.pdf. 335 City of Kitakyushu, [New Growth Strategy]. 336 OECD, OECD Territorial Reviews, 446. 337 City of Kitakyushu, [New Growth Strategy]. 338 City of Kitakyushu, 北九州市経営プラン [Kitakyushu Management Plan] (Kitakyushu: City of Kitakyushu, 2007), http://www.city.kitakyushu.lg.jp/files/000018713.pdf 339 Kitakyushu Airport, 北九州空港のあゆみ [History of Kitakyushu Airport] (Kitakyushu: City of Kitakyushu, 2007). 340 City of Kitakyushu, [New Growth Strategy]. 341 Kitakyushu Seaport and Airport Bureau, ‘Port of Kitakyushu’, accessed 4 April 2015, http://www.kitaqport.or.jp/index_e.html 342 ibid. 343 Shinki International, 北九州港・太刀浦CT国内発のETC認証ゲートシステム試験導入 へ [The ETC Gate System Pilot Implementation], accessed 25 June 2015, http://www.shinki-japan.co.jp/contents/2015/02/ctetc.php 344 City of Kitakyushu, [New Growth Strategy]. 345 Ibid. 346 OECD, OECD Territorial Reviews, 446. 347 X. Bai and H. Imura, ‘A comparative study of urban environment in East Asia: Stage model of urban environmental evolution’, International Review for Global Environmental Strategies 1(1) (2000): 135–58. 348 Office for World Capital of Sustainable Development, Environment Bureau, City of Kitakyushu, ‘Commitment of the residents of Kitakyushu to all people, the earth and future Generations – Towards the creation of a “World Capital of Sustainable Development” – (Grand Design)’, 2006, http://www.city.kitakyushu.lg.jp/files/000025747.doc 349 Ibid. 350 City of Kitakyushu, [New Growth Strategy].
488
351 K. Kitahashi, ‘February 2015 inauguratory message’, accessed 4 May 2015, http://www.city.kitakyushu.lg.jp/english/e20100136.html 352 City of Kitakyushu, わかりやすい北九州市の財政 [Kitakyushu’s finance], accessed 4 May 2015, http://www.city.kitakyushu.lg.jp/zaisei/09000077.html 353 City of Kitakyushu, ‘Kitakyushu profile’, Kitakyushu Bridges 42 (2014), 3. 354 OECD, OECD Territorial Reviews, 446. 355 City of Kitakyushu, [New Growth Strategy]. 356 D. Guan et al., ‘Land use change of Kitakyushu based on landscape ecology and Markov model’, Journal of Geographical Sciences 18(4) (2008): 455–68. 357 City of Kitakyushu, [New Growth Strategy]. 358 Ibid. 359 R. Alter, E. Lau and S. Saya, ‘Towards a more agile public governance’, OECD Observer, 2014, http://www.oecdobserver.org/news/fullstory.php/aid/4360/Towards_a_more_agile_public_ governance.html 360 H. Nakamura, M. Elder and H. Mori, ‘The surprising role of local governments in international environmental cooperation: The case of Japanese collaboration with developing countries’, The Journal of Environment and Development 20(3) (2011): 219– 50. 361 Kitakyushu Asian Center for Low Carbon Society, ‘The good future in Asia from Kitakyushu’, accessed 22 June 2015, http://asiangreencamp.net/eng/index.php 362 City of Kitakyushu, 持続可能な社会の実現に向けて [Kitakyushu Environmental Model City Basic Plan] (Kitakyushu: City of Kitakyushu, 2013), http://www.city.kitakyushu.lg.jp/files/000138395.pdf 363 T.A. Kurniawan et al., ‘City-to-city level cooperation for generating urban co-benefits: The case of technological cooperation in the waste sector between Surabaya (Indonesia) and Kitakyushu (Japan)’, Journal of Cleaner Production 58 (2013): 43–50. 364 R. Alter, E. Lau and S. Saya, Towards a More Agile Public Governance (Paris: OECD Directorate for Public Governance and Territorial Development, 2014), 28. 365 D.G.J. Premakumara, H. Kazuyoshi and E. Tamura, ‘KitaQ system composting and its applicability in Asia: Lessons learned and future potential’, Journal of the Japan Society of Material Cycles and Waste Management 22 (2011): 161–2; Alter et al., Towards a More Agile Public Governance. 365 R.C. Ancog, N.D. Archival and C.M. Rebancos, ‘Institutional arrangements for solid waste management in Cebu City, Philippines’, Journal of Environmental Science and Management 15(2) (2012): 74–82. 366 Ibid. 367 H. Nakamura, M. Elder and H. Mori, ‘The surprising role of local governments in international environmental cooperation: The case of Japanese collaboration with developing countries’, The Journal of Environment & Development (2011). 368 Ibid. 369 UNDP (United Nations Development Programme), Human Development Reports (New York: UNDP, 2015.) 370 The World Bank, Data by country: Peru, retrieved 1 October 2015. 371 Acuerdos Comerciales del Perú website, accessed 12 November 2015, www.acuerdoscomerciales.gob.pe 372 Economist Intelligence Unit, Hot Spots – Benchmarking Global City Competitiveness, 28. 373 Economist Intelligence Unit, Hot Spots 2025, 16. 374 INEI (Instituto Nacional de Estadísticas e Informática, or National Institute for Statistics and Informatics), Día Nacional de la Población [National Population Day] (Lima: INEI, 2014),
489
http://www.inei.gob.pe/media/MenuRecursivo/publicaciones_digitales/Est/Lib1157/libro.p df 375 A. Segura, Perspectivas Económicas 2014 [Economic Perspectives] (Lima: Ministry of Economy and Finance, 2014), http://www.proinversion.gob.pe/repositorioaps/0/0/eve/foro_inversionprivada/1_asegura.pd f 376 ASBANC (Association of Banks of Peru), Colocaciones zonas y regiones [Loan placements in zones and regions], 2014, http://www.asbanc.pe/ContenidoFileServer/Colocaciones_Zonas_y_Regiones_2014012905 3157392.xls 377 L. Miranda Sara, G. Takano and C. Escalante, Metropolitan Lima and the Sustainability Challenge, Growing Cities in Growing Economies – City Report: Metropolitan Lima and Callao. (Bonn: European Association of Development Research and Training Institute and Chance2Sustain, 2014). 378 World Bank, ‘GINI index (World Bank estimate)’, accessed 7 April 2016, http://data.worldbank.org/indicator/SI.POV.GINI 379 INEI, [National Population Day]. 380 Based on data from the Peruvian Central Bank, accessed 6 November 2015, http://www.bcrp.gob.pe/estadisticas/cuadros-anuales-historicos.html 381 See: F. Ruiz, ‘MINCETUR: Desarrollando las exportaciones no tradicionales’ [MINCETUR: Developing non-traditional exports] (Lima: MINCETUR – Dirección de Facilitación de Comercio Exterior, 2012), http://www.wtclima.com/pdfs/Francisco_Ruiz.pdf 382 See: ADEX Data Trade, Boletín Regional, December 2014, http://www.adexdatatrade.com/Boletines.aspx?g=3 383 R. Benavides, ‘Nuevos paradigmas en competitividad’ tradicionales’ [New paradigms in competitiveness] (presented at the Seminario Internacional, The Westin Hotel, Lima, Peru, 19 March 2014), http://www.esan.edu.pe/eventos/especiales/seminario-competitividadkrugman/presentaciones/roquebenavides/roque-benavides.pdf 384 See: P. Herrera, ‘Aproximando el clima de negocios a nivel municipal’ [Business climate at the municipality level] (working paper, Lima: Pontificia Universidad Católica del Perú). 385 ADB and CAF (Corporacion Andina de Fomento) The Competitiveness of Cities in Asia and Latin America (Manila and Caracas: ADB and CAF, 2015). 386 INEI, ‘Compendio Estadístico Provincia de Lima 2014’ [Socio demographic information], accessed 20 April 2016, https://www.inei.gob.pe/media/MenuRecursivo/publicaciones_digitales/Est/Lib1248/index. html 387 Innóvate Perú, ‘Fincyt’, Ministerio de la Producción, accessed 6 June 2016, http://www.innovateperu.gob.pe/quienes-somos/nuestros-fondos/fincyt 388 Ernst and Young, Peru’s Business and Investment Guide 2011/12 (Lima: Ernst and Young, 2010). 389 PricewaterhouseCoopers, Doing Business in Peru (London: PricewaterhouseCoopers, 2008). 390 A. Romero, ‘La economía urbana de Lima Metropolitana: Los procesos y retos del desarrollo’ [Urban economy in Metropolitan Lima: Processes and challenges for development], Socialismo y Participación 97 (2004): 59–87. 391 See: E. Gonzales de Olarte and J. del Pozo Segura, ‘Lima, una ciudad policéntrica. Un análisis a partir de la localización de empleo’ [Lima, a polycentric city. An analysis from the location of employment], Investigaciones Regionales 23 (2012): 29–52. 392 This figure is based on a survey of 237,654 commercial establishments. See: IMP (Instituto Metropolitano de Planificación), Plan Regional de Desarrollo Concertado de Lima 2012–
490
393
394 395
396
397
398
399
400
401 402
403
404 405
406
407
2025 [Regional Consensual Development Plan Lima] (Lima: Municipalidad Metropolitana de Lima, 2012), 294. ‘Duplicarán líneas asignadas al Banco de la Nación para microempresas’ [Credit lines provided by the Nation Bank will be doubled], Semanaeconomica.com, 26 June 2014, http://semanaeconomica.com/article/finanzas/banca-y-finanzas/139305-duplicaran-lineasasignadas-al-banco-de-la-nacion-para-microempresas/ These implicit interest rates are calculated on the basis of the transactions executed in the previous 30 days. M. Choy, E. Costa and E. Churata, ‘Radiografía del costo de crédito en el Perú’[X-ray of the cost of credit in Peru] (working paper, Lima: Banco Central de Reserva del Perú, 2015), http://www.bcrp.gob.pe/docs/Publicaciones/Documentos-de-Trabajo/2015/documento-detrabajo-01-2015.pdf AFIN (Asociación para el Fomento de la Infraestructura Nacional), Por un Perú Integrado: Plan Nacional de Infraestructura 2012–2012 [Towards an Integrated Peru: National Infrastructure Plan 2012 - 2015] (Lima: AFIN, 2012). ‘Lima tiene una cartera de proyectos de inversión de USD 1,800 millones’ [Lima has an investment portfolio of USD 1.8 billion], El Comercio, 6 December 2013, http://elcomercio.pe/economia/peru/lima-tiene-cartera-proyectos-que-requiereninversiones-us1800-mlls-noticia-1669317 ‘Qué obras hacen falta para mejorar el acceso al puerto del Callao?’[What projects are required to improve the access to the Callao port?], El Comercio, 4 November 2013, http://elcomercio.pe/economia/peru/que-obras-hacen-falta-modernizacion-puerto-callaonoticia-1653996 WEF (World Economic Forum), The Global Information Technology Report 2013: Growth and Jobs in a Hyperconnected World (2013), http://reports.weforum.org/globalinformation-technology-report-2013/#section=countryeconomy-profiles-peru J. Marín, X. Barragán and A. Zaball, ‘Informe sobre la situación de conectividad de Internet y banda ancha en Perú’ [Status report on internet and broadband connectivity in Peru], (discussion paper, Washington, DC: Inter-American Development Bank, 2014), http://www2.congreso.gob.pe/sicr/cendocbib/con4_uibd.nsf/D68692EDA517B04C05257D 38007091B7/$FILE/Conectividad_per%C3%BA1.pdf Ibid., 399. IMP (Instituto Metropolitano de Planificación), Programa Urbanístico de Anexión de Suelo – Plan Metropolitano de Desarrollo Urbano 2035 [Urban Land Development Program – Metropolitan Plan for Urban Development 2035] (Lima: Municipalidad Metropolitana de Lima – IMP, 2014), http://img.plam2035.gob.pe.s3.amazonaws.com/wpcontent/uploads/plam2035/T2/4.SUELO-VOL1PAG.11-319-376.pdf M. Cendoya, ‘Evaluación de parques científicos y tecnológicos en el Perú – Tomo 2’ [Assessment of scientific and technological parks in Peru] (Lima: Consejo Nacional de Ciencia, Tecnología e Innovación Tecnológica (CONCYTEC), 2014), http://portal.concytec.gob.pe/index.php/publicaciones/informes/item/49-informe-n-2evaluacion-de-parques-y-tecnologicos-en-el-peru ADB and CAF, The Competitiveness of Cities. Apoyo Consultoría, Propuesta de Implementación del Plan de Chatarreo para Vehículos de Transporte Público [Proposal for the implementation of a replacement bonus of urban transportation vehicles] (Lima: Apoyo Consultoría, 2012), http://www.apoyoconsultoria.com/SiteAssets/Lists/JER_Jerarquia/EditForm/Ver%20estudi o%20AC.pdf INEI, Compendio Estadístico 2015 [Statistical Compendium], ‘Ch. 16 https://www.inei.gob.pe/media/MenuRecursivo/publicaciones_digitales/Est/Lib1253/cap16 /ind16.htm Ibid., Ch. 2.
491
408 INEI, Compendio estadístico Provincia de Lima 2014 [Statistical Compendium Province of Lima] (2015), https://www.inei.gob.pe/media/MenuRecursivo/publicaciones_digitales/Est/Lib1248/index. html 409 The construction sector contributed about 33 percent of the 6.3 percent growth rate of GDP in 2012. 410 Rex A. Hudson, ed., Peru: A Country Study. (Washington, DC: GPO for the Library of Congress, 1992.) 411 INEI, ‘Situación del mercado laboral en Lima Metropolitana, Noviembre–Diciembre 2014–Enero 2015’ [Status of the labour market in Metropolitan Lima, November– December 2014–January 2015] (Technical Report no. 2, Lima: INEI, 2015), http://www.inei.gob.pe/media/MenuRecursivo/boletines/informe-tecnico-n02_mercadolaboral_nov-dic14-ene2015.pdf 412 J. Flores, ‘La situación laboral en el Perú’[Labour status in Peru], http://www.monografias.com/trabajos6/sila/sila.shtml#ixzz3526IYIHY 413 ‘Mercer quality of life index ranks Lima 123rd’, Living in Peru, 24 February 2016, http://www.peruthisweek.com/news-mercer-lima-quality-of-life-108901 414 ‘Doing business in Peru’, export.gov, accessed 6 June 2016, http://export.gov/peru/doingbusinessinperu/index.asp 415 Lima Cómo Vamos, ‘Encuesta Lima Cómo Vamos – Quinto Informe de Percepción sobre Calidad de Vida’ [Survey Lima What’s Up] (Lima: Lima Cómo Vamos, 2014), http://www.limacomovamos.org/cm/wpcontent/uploads/2015/01/EncuestaLimaComoVamos2014.pdf 416 L. Alcázar and M. Jaramillo, ‘El impacto de la licencia municipal en el desempeño de las microempresas en el Cercado de Lima’ [Impact evaluation of business licence simplification in Peru: An independent assessment of an International Finance Corporation supported project] ( Lima: Grupo de Análisis para el Desarrollo, 2012). 417 Ministerio de Trabajo [Ministry of Employment], accessed 6 June 2016, http://www.jovenesproductivos.gob.pe/ 418 Trabaja Perú, ‘Peru Employment’, accessed 6 June, 2016, http://www.trabajaperu.gob.pe/index.php?option=com_content&view=article&id=85 419 A. Alfaro, ‘La huella ecológica de las ciudades en el Perú’[Carbon footprint of Peruvian cities], in L. Miranda, ed., Construyendo Ciudades para la Vida: Aportes a la Construcción Sostenible en el Perú. Foro Ciudades para la Vida. [Building Livable Cities: Contributions for a Sustainable Peru] (Lima: Foro Ciudades para la Vida, 2008). 420 WHO (World Health Organization), ‘Ambient (outdoor) air pollution in cities database 2014’, accessed 6 November 2015, http://www.who.int/phe/health_topics/outdoorair/databases/cities/en/ 421 IMP, [Regional Consensual Development Plan Lima 2012–2025]. 422 SEDAPAL, ‘Planta Taboada premiada en Cumbre Mundial del Agua’ [Taboada Treatment Plant awarded in the World Water Summit], press release, 8 April 2014, http://www.sedapal.com.pe/noticias1/-/asset_publisher/mRM0/content/planta-taboadapremiada-en-cumbre-mundial-delagua?redirect=http%3A%2F%2Fwww.sedapal.com.pe%2Fnoticias1%3Fp_p_id%3D101_I NSTANCE_mRM0%26p_p_lifecycle%3D0%26p_p_sta te%3Dnormal%26p_p_mode%3Dview%26p_p_col_id%3Dcolumn2%26p_p_col_count%3D1 423 SEDAPAL, Construcción de Planta y Emisario Submarino La Chira avanza al 80% [Building of La Chira Treatment Plant], press release, 9 March 2015, http://www.sedapal.com.pe/notas-de-prensa/-/asset_publisher/qCX7/content/construccionde-planta-y-emisario-submarino-la-chira-avanza-al80;jsessionid=D1E3FD82B15FA05388D77BD1414D1194?redirect=http%3A%2F%2Fww w.sedapal.com.pe%2Fnotas-de-
492
424
425 426
427 428 429
430 431
432
433 434 435 436 437 438 439 440 441 442 443 444 445 446 447 448 449
prensa%3Bjsessionid%3DD1E3FD82B15FA05388D77BD1414D1194%3Fp_p_id%3D10 1_INSTANCE_qCX7%26p_p_lifecycle%3D0%26p_p_state%3Dnormal%26p_p_mode%3 Dview%26p_p_col_id%3Dcolumn-2%26p_p_col_pos%3D1%26p_p_col_count%3D3 US Commercial Service, Doing Business in Peru: 2015 Country Commercial Guide for U.S. Companies (Washington, DC: US and Foreign Commercial Service, and US Department of State, 2015.), 99 ALLAS website, accessed November 2015, https://www.proyectoallas.net/about/en See: ‘Perú y Corea del Sur firmaron convenio para la recuperación del río Rimac’[Peru and Korea signed a cooperation agreement for the recovery of the Rimac River], El Comercio,16 October 2012, http://elcomercio.pe/lima/sucesos/peru-corea-sur-firmaronconvenio-recuperacion-rio-rimac-noticia-1483562 Department of Environment and Natural Resources, Environmental Management Bureau, ‘About us’, accessed 6 June 2016, http://emb.gov.ph/ Ibid. PSA (Philippine Statistics Authority), ‘Population of 11.9 million was recorded for National Capital Region (Results from the 2010 Census of Population and Housing)’, Statistical Bulletin (2013-149), 26 July 2013, https://psa.gov.ph/content/population-119million-was-recorded-national-capital-region-results-2010-census-population ADB, ‘RETA, Managing the Cities in Asia, Philippines final report’ (Manila: ADB, 2010). M.M. Ballesteros, ‘Linking poverty and the environment: Evidence from slums in Philippine cities’ (discussion paper, Manila: Philippine Institute for Development Studies, 2010), 32. KPMG, Infrastructure In-depth: Philippines – 2015 Investment Guide (Manila: R.G. Manabat & Co., 2015), http://www.kpmg.com/Global/en/IssuesAndInsights/ArticlesPublications/Documents/infras tructure-in-depth-philippines.pdf PSA, ‘Foreign trade statistics of the Philippines: First semester 2014’, 30 October 2014, https://psa.gov.ph/content/foreign-trade-statistics-philippines-first-semester-2014. Ibid. NEDA (National Economic and Development Authority), Philippine Development Plan 2011–2016 (Pasig City: NEDA, 2011). Economist Intelligence Unit, Hot Spots – Benchmarking Global City Competitiveness. NCC (National Competitiveness Council) 3rd Regional Competitiveness Summit (Manila: National Competitiveness Council, 2014). NEDA, Philippine Development Plan 2011–2016. Ibid. Ibid. Ibid. Philippine Economic Zone Authority, ‘List of economic zones, Philippines’, accessed 22 April 2016, http://www.peza.gov.ph/index.php/economic-zones World Bank, ‘Making growth work for the poor’, in Philippine Economic Update (Manila: World Bank, 2015), 78. NEDA, Medium Term Philippine Development Plan 2004–2010 (Pasig City: NEDA, 2004). ADB, ‘Project performance evaluation report of the North Luzon Expressway Rehabilitation and Expansion Project in the Philippines’ (Manila: ADB, 2011). Metro Manila Development Authority website, accessed 6 June 2016, http://www.mmda.gov.ph Public–Private Partnership Centre website, accessed 6 June 2015, http://ppp.gov.ph National Kidney and Transplant Institute website, accessed 6 June 2015, http://www.nkti.gov.ph ADB, ‘PPP Days 2010: PPP in the Philippines: Sharing and learning best practices in project implementation’ (Field trip material, Manila: ADB, 2010).
493
450 PSA, ‘e-Census’, accessed 6 June 2015, https://www.ecensus.com.ph/Default.aspx 451 ADB, ‘PPP Days 2010’. 452 ‘5 PPP projects completed 2016’, Manila Bulletin, 30 September 2014, http://www.mb.com.ph/5-ppp-projects-completed-2016/ 453 M.M. Manalo, ‘Government earmarks nearly P800 billion for PPP projects in Metro Manila’, Interaksyon, 17 March 2015. 454 E.M. Serote, Property, Patrimony & Territory: Foundations of Land Use Planning in the Philippines (Diliman: School of Urban and Regional Planning, University of the Philippines, 2004). 455 World Bank, East Asia’s Changing Urban Landscape: Measuring a Decade of Spatial Growth (Washington, DC: World Bank, 2015) 456 R.R. Romulo, ‘The economic footprint of BPO industry’, The Philippine Star, 21 August 2013. 457 Ibid. 458 NEDA, Philippine Development Plan 2011–2016. 459 UN-Habitat, State of the World’s Cities 2010/2011.. 460 World Bank, East Asia’s Changing Urban Landscape. 461 ADB, ‘Project performance evaluation report of the North Luzon Expressway Rehabilitation and Expansion Project’. 462 ADB, ‘Country Partnership Strategy 2011–2016 –Thematic assessment (summary): Water supply and other municipal infrastructure and services’ (Manila: ADB, 2011). 463 Metropolitan Waterworks and Sewerage Systems, Annual Report: 2012 (Manila: Waterworks and Sewerage Systems, 2012). 464 World Bank, Metro Manila Water Security Study: Final Report (Washington, DC: World Bank, 2012). 465 World Bank, Metro Manila Water Security Study: 466 World Bank, A Strategic Approach to Climate Change in the Philippines: An Assessment of Low-Carbon Interventions in the Transport and Power Sectors (Washington, DC: World Bank, 2010). 467 ADB, Managing Asian Cities: Sustainable and Inclusive Urban Solutions (Manila: ADB, 2008), 9, 34. 468 A.A. Laquian, ‘Metro Manila: People’s participation and social inclusion in a city of villages’, in B.A. Ruble et al., eds, Urban Governance Around the World (Washington, DC: Woodrow Wilson International Center for Scholars, 2001), 74–110. 469 Quezon City Government website, accessed 20 July 2015, http://www.quezoncity.gov.ph/index.php?option=com_content&view=article&id=411&Ite mid=374 470 ‘MMDA, LGUs, WB Launch “Metro Manila Greenprint 2030”’, Manila Bulletin, 12 March 2012, http://www.citiesalliance.org/node/2840 471 World Bank, GDP per capita (current USD)’, accessed 7 August 2015, http://data.worldbank.org/indicator/NY.GDP.PCAP.CD 472 Ibid. 473 Concejo Nacional de Población (2015) ‘Delimitación de las zonas metropolitanas de México 2010’ [‘Metropolitan Zones 2010’], accessed 3 August 2015, http://www.conapo.gob.mx/es/CONAPO/Zonas_metropolitanas_2010 474 World Bank, ‘GDP at market prices (current USD)’, accessed 4 August 2015. http://data.worldbank.org/indicator/NY.GDP.MKTP.CD?order=wbapi_data_value_2013+ wbapi_data_value+wbapi_data_value-last&sort=desc 475 Instituto Nacional de Estadística y Geografía (Mexican Bureau of Statistics), Banco de Información Económica [Bank of Economic Information] (2015); Banco de México (Mexican Central Bank, [Daily time series – Exchange rate USD-Peso 2015]. 476 World Bank, ‘GNI per capita ranking, Atlas method and PPP based’, accessed 5 August 2015, http://data.worldbank.org/data-catalog/GNI-per-capita-Atlas-and-PPP-table
494
477 Mexican Bureau of Statistics, [Bank of Economic Information 2015]; Mexican Central Bank, [Daily time series – Exchange rate USD-Peso 2015]; World Bank economic indicators. 478 Ibid. 479 World Bank, ‘GNI per capita ranking’. 480 Mexican Bureau of Statistics, [Bank of Economic Information 2015]; Mexican Central Bank, [Daily time series – Exchange rate USD-Peso 2015]; World Bank economic indicators. 481 World Bank, ‘GNI per capita ranking’. 482 ‘The world’s top 10 busiest metros’, Railway-technology.com, 13 November 2014, http://www.railway-technology.com/features/featurethe-worlds-top-10-busiest-metros4433827/ 483 El Metro del Ciudad de México, La red, accessed 16 July 2015 [The Network] http://www.metro.df.gob.mx/red/ 484 Local Government of Cuajimalpa, ‘Programa Parcial de Desarrollo Urbano de la Zona de Santa Fe’ [Parcial Urban Development Plan for the Urban Zone of Santa Fe], accessed 20 July 2015, http://www.seduvi.df.gob.mx/portal/docs/transparencia/articulo15/fraccionxi/PPDU/PPDU _AO_CJ/AO_CJ_SantaFe.pdf 485 Embassy of Mexico in Australia, Mexico Down Under 17 (July 2015), 7 486 J. Hawksworth and D. Chan, The World in 2050: Will the Shift in Global Economic Power Continue? (London: PricewaterhouseCoopers, 2015), 44. 487 OECD, OECD Economic Surveys: Mexico (Paris, OECD, 2015), http://www.oecd.org/eco/surveys/Mexico-Overview-2015.pdf 488 Embassy of Mexico in Australia, Mexico Down Under, 4 489 LQ is the share of local job growth. It describes the extent to which factors unique to the local area have caused growth or decline in regional employment of an industrial group. Mathematically, it is defined as follows: [Regional Shift %]= [ Share Shift %]-[National Growth %]-[Industry Mix %]. 490 Ministry of Economy, ‘Mexico’s position as a world class trader’, gob.mx, accessed 10 June 2015, http://www.economia.gob.mx/trade-and-investment/foreigntrade/international-trade-negotiations http://embamex.sre.gob.mx/singapur/index.php/economic-a-business-info/mexicos-ftas 491 Ibid. 492 Mexican Bureau of Statistics, [Bank of Economic Information 2015]. 493 E. Martin, ‘Mexico boosting China ties through trade, investment, Meade says’, 28 February 2014, http://www.bloomberg.com/news/articles/2014-02-28/mexico-boostingchina-ties-through-trade-investment-meade-says 494 Brookings Institution, ‘Global Cities Initiative: Mexico City, DF-ME-HG’ (Infographic, Washington, DC: Brookings, 2015), http://www.brookings.edu/~/media/Multimedia/Interactives/2013/MetroNorthAmerica/prof iles/CM20402.pdf 495 OECD , Mexico Policy Priorities to Upgrade the Skills and Knowledge of Mexicans for Greater Productivity and Innovation (Paris: OECD, 2015), http://www.oecd.org/mexico/mexico-policy-priorities-to-upgrade-skills-and-knowledge-ofmexicans.pdf 496 M. Nesvisky, ‘What happened to wages in Mexico since NAFTA?’, The NBER Digest, September 2003, http://www.nber.org/digest/sep03/w9563.html 497 ‘Informal economy makes up 26% of Mexico’s GDP’, telesur, 8 August 2014, http://www.telesurtv.net/english/news/Informal-Economy-Makes-Up-26-of-Mexicos-GDP20140808-0044.html 498 M. de los Dolores Figueroa Romero, ‘Immigrant indigenous women in Mexico City: The politics of representation’ (PhD dissertation, York University, Toronto, 2002),
495
http://www.academia.edu/6878287/Immigrant_Indigenous_Women_in_Mexico_City_The _Politics_of_Representation 499 OECD, Mexico Policy Priorities. 500 Ibid. 501 Mexican Bureau of Statistics, [Bank of Economic Information 2015]; Mexican Central Bank, ‘Revenues by workers’ remittances’, 17 July 2015, http://www.inegi.org.mx/sistemas/bie. 502 KPMG, Investment in Mexico (Mexico City: KPMG Cárdenas Dosal, S.C., 2012) 503 A. Musacchio, ‘Mexico’s financial crisis of 1994–1995’ (working paper, Boston, MA: Harvard Business School, 2012). 504 Ibid. 505 Economist Intelligence Unit, Hot Spots 2025. 506 ‘Rechaza la UNAM al 91% de aspirantes; son más de cien mil’ [National University rejects 91% of applicants, those are more than hundred thousand], Proceso, 9 April 2014, http://www.proceso.com.mx/?p=369304 507 World Bank, Doing Business in Mexico 2014 (Washington, DC: World Bank, 2014), http://doingbusiness.org/reports/subnational-reports/mexico 508 Martin Prosperity Institute, ‘Global cities: Mexico City’ (Fact sheet, Toronto: Martin Prosperity Institute, 2015), http://martinprosperity.org/global-cities/Global-Cities_MexicoCity.pdf 509 Ibid., 5. 510 Ibid., 5. 511 See for example: US Department of State, ‘2013 investment climate statement – Mexico’, February 2013, http://www.state.gov/e/eb/rls/othr/ics/2013/204693.htm 512 K.P. Gallagher, ‘Time for a new toolkit in Mexico’, Harvard Review of Latin America (2009), http://revista.drclas.harvard.edu/book/time-new-toolkit-mexico 513 Martin Prosperity Institute, ‘Global cities: Mexico City’, 15. 514 Mexican Government, National Infrastructure Programme 2014–18 (Mexico City: Ministry of Treasury, 2014), http://presidencia.gob.mx/pni/consulta.php?c=1 515 ‘The world’s top 10 busiest metros’, Railway-technology.com. 516 El Metro del Ciudad de México, Indicadores de Operación [Operating Indicators], accessed 25 July 2015 http://www.metrobus.df.gob.mx/docs/prontuario.pdf 517 Mexican Government, National Infrastructure Programme 2014–2018. 518 Ibid. 519 Ibid. 520 ‘Mexico City growth at the limit’, Urban Age, February 2006, http://lsecities.net/publications/conference-newspapers/mexico-city-growth-at-the-limit/ 521 ‘The infrastructure master plan’, Foreign Affairs (sponsored section, 2013), 1, http://files.foreignaffairs.com/legacy/attachments/NEW%20Report.pdf 522 R. Carriedo, ‘Mexico update: Infrastructure plans unveiled’, AS-COA, 9 October 2014, http://www.as-coa.org/articles/mexico-update-infrastructure-plans-unveiled 523 Ibid. 524 Ibid. 525 Ibid. 526 Mexican Government, National Infrastructure Programme 2014–2018. 527 Mexican Central Bank, ‘Workers remittances’, accessed 8 June 2016, http://www.banxico.org.mx 528 Ibid., accessed 20 July 2015. 529 Mexican Bureau of Statistics, [Bank of Economic Information 2015]; Mexican Central Bank, [Daily time series – Exchange rate USD-Peso 2015]. 530 IFAD (International Fund for Agricultural Development), ‘Investing in rural people in Mexico’ (Rome: IFAD, 2015), http://www.ifad.org/operations/projects/regions/pl/factsheet/mexico_e.pdf
496
531 Embassy of Mexico in Washington, ‘Labor reform in Mexico’ (Washington, DC: Embassy of Mexico, 2010), http://consulmex.sre.gob.mx/houston/images/Fact_Sheet_Labor_Reform_April_2010_Fina l.pdf 532 Ibid. 533 E. Godoy, ‘The waste mountain engulfing Mexico City’, Guardian Environment Network, 9 January 2012, http://www.theguardian.com/environment/2012/jan/09/waste-mountainmexico-city 534 Martin Prosperity Institute, ‘Global cities: Mexico City’. 535 ‘Aztec tiger begins to sharpen its claws’, Financial Times, 28 June 2013, http://im.ftstatic.com/content/images/d6470ff2-e3f4-11e2-b35b-00144feabdc0.pdf 536 PricewaterhouseCoopers, Gridlines, Winter 2013, http://www.pwc.com/gx/en/capitalprojects-infrastructure/assets/pwc-gridlines-new-mexican-mix-welcomes-infrastructureinvestors.pdf 537 Transparency International, ‘People say corruption in Mexico is getting worse’, press release, 11 May 2011, http://www.transparency.org/news/pressrelease/20110511_Mexico_worse 538 ‘Bribery in Mexico’, The Economist, 19 May 2011. 539 E. Zuniga, ‘10 ciudades Mexicanas y sus hermanas más extrañas’ [Ten Mexican cities and its more bizarre sisters], El Universal, accessed 7 August 2015, http://archivo.de10.com.mx/vivir-bien/2013/10-ciudades-mexicanas-y-sus-hermanas-masextranas-17762.html 540 Local Government of Bogota, ‘Bogotá busca negocios y cooperación para el desarrollo en México’ [Bogota looks for business and economic cooperation in Mexico], accessed 7 August 2015, http://www.bogota.gov.co/Internacional/bogota-busca-negocios-ycooperacion-para-el-desarrollo-en-mexico 541 El Espectador, ‘Bogotá busca en México inversores y fortalecer relaciones en sectores clave’ [Bogota looking for investors in Mexico and to strengthen relationships in key sectors], accessed 20 August 2015, http://www.elespectador.com/noticias/bogota/bogotabusca-mexico-inversores-y-fortalecer-relaciones-articulo-560426 542 N. Rolle, ‘Sister city relationships boost business in Chicago, Phoenix and S.F.’, Next City, 29 October 2014, http://nextcity.org/daily/entry/sister-city-partnership-cities-businesseconomic-development 543 ‘Mexico City suburban train to start operations in 2007’, Dominican Today, 14 August 2006, http://www.dominicantoday.com/dr/world/2006/8/14/16392/Mexico-City-suburbantrain-to-start-operations-in-2007 544 Ibid. 545 M. Lynch, ‘Infograph: The NYC subway versus subways around the world’, Time Out, 14 October 2013, http://www.timeout.com/newyork/travel/infograph-the-nyc-subway-versussubways-around-the-world 546 Ferrocarriles Suburbanos, La Empresa [The Firm], accessed 17 August 2015, http://www.fsuburbanos.com/secciones/la_empresa/proyecto.php 547 40 Cities, ‘Improving air quality in Mexico City, accessed 17 August 2015, http://cityclimateleadershipawards.com/improving-air-quality-in-mexico-city/ 548 Ibid. 549 Secretariat Ministry of Economy, ‘Inversion extranjera eirecta: Flujos por país de origen’, [FDI flows into Mexico by source country and industry], accessed 20 July ’ 2015, http://www.datos.economia.gob.mx 550 Ibid. 551 Embassy of Mexico in Australia, Mexico Down Under. 552 Ibid. 553 Ibid.
497
554 J. Vidal, ‘UN report: World’s biggest cities merging into “mega-regions”’, Guardian Poverty Matters Blog, 22 March 2010, http://www.theguardian.com/world/2010/mar/22/un-cities-mega-regions 555 C. Miu, ‘A stronger Pearl River Delta’ (Hong Kong: Department of Planning, 2011). 556 L. Yang, ‘Achievements, challenges in China’s Pearl River Delta plan’, China View, 8 January 2009, http://news.xinhuanet.com/english/2009-01/08/content_10624863.htm 557 H. Chen and O. Unteroberdoerster, ‘Hong Kong SAR economic integration with the Pearl River Delta’ (working paper, Washington, DC: International Monetary Fund, 2008), https://www.imf.org/external/pubs/ft/wp/2008/wp08273.pdf 558 ‘Statistics and facts about migrant workers in China’, Statista, accessed 1 March 2015, http://www.statista.com/topics/1540/migrant-workers-in-china/ 559 Department of Commerce of Guangdong Province, 广东省2014年12月分市贸易情况表 [Guangdong Province December 2014 Trading Statistics by City], accessed 10 April 2015, http://www.gdcom.gov.cn/wjmtj/201412.html 560 K. Oizumi, ‘The emergence of the Pearl River Delta economic zone – Challenges on the path to megaregion status and sustainable growth’, Pacific Business and Industries 11(41) (2011): 2–20, http://www.jri.co.jp/MediaLibrary/file/english/periodical/rim/2011/41.pdf 561 Economist Intelligence Unit, Hot Spots – Benchmarking Global City Competitiveness. 562 ‘China’s Special Economic Zones’, accessed 20 June, 2016, http://www.mmegi.bw/index.php?aid=56451 563 W. Xie, ‘Acquisition of technology capability through special economic zones (SEZs): The case of Shenzhen SEZ’, Industry and Innovation 7(2) (2000); 199–221. 564 Xie Wei, Acquisition of technology capability through special economic zones (SEZs): The case of Shenzhen SEZ, Industry and Innovation. Sydney: Dec 2000. Vol. 7, Iss. 2; pg. 199, 24 pg 565 P. Wong, ‘The next wave of Guangdong’s cooperation with HK’, Caixin Online, 4 November 2014, http://english.caixin.com/2014-04-11/100664079.html 566 Hong Kong Trade Development Council, ‘PRD economic profile’, 21 January 2016, http://china-trade-research.hktdc.com/business-news/article/Fast-Facts/PRD-EconomicProfile/ff/en/1/1X000000/1X06BW84.htm 567 Department of Commerce of Guangdong Province, ‘Guangdong speeds up to position itself as a major powerhouse for trade in services’, International Business Daily, 29 May 2013, http://www.gddoftec.gov.cn/en/news.asp?channalid=1602&contentid=15880 568 NDRC (National Development and Reform Commission), ‘Outline of the plan for the reform and development of the Pearl River Delta’, accessed 31 October 2016, http://www.china.org.cn/government/scio-press-conferences/200901/08/content_17075239_4.htm 569 S. Breslin, Foreign Direct Investment in China: What the Figures Don’t Tell Us (Warwick: University of Warwick, 2003), 47. 570 ‘The importance of the Pearl River Delta in China’, ChineseConnects.com. 571 J.D. Sachs, Common Wealth: Economics for a Crowded Planet (London: Penguin, 2008). 572 D. Fang, ‘Technical and operational development of Chinese logistics hubs’ (presented at the International CeMAT Forum, Hanover, Germany, 4 May 2011) 573 X. Geng and Y. Zheng, ‘The growth of Foshan: A tale of state and market’ (working paper, Hong Kong, China: Fung Global Institute, 2013). 574 ‘China announces $18.8 billion housing subsidy’, The Brics Post, 6 April 2014, http://thebricspost.com/china-announces-18-8bn-housing-subsidy/#.U57buI2SxYw 575 Greenpeace China, ‘Poisoning the Pearl: An investigation into industrial water pollution in the Pearl River Delta’ (Beijing: Greenpeace China, 2010), 68. 576 World Bank, CN-Second Guangdong Pearl River Delta Urban Environment Project (2007). 577 Greenpeace China, ‘Poisoning the Pearl’.
498
578 J. Xu, ‘Guangdong action plan set to clear the air’, China Daily, 3 January 2014, http://www.chinadaily.com.cn/china/2014-01/03/content_17215083.htm 579 C. He and L. Yang, ‘Urban development and climate change in China’s Pearl River Delta’, Land Lines, July 2011. 580 C. Miu, Pearl River Delta (Sydney: Australia-China Chamber of Commerce & Industry, 2005), 2. 581 Pan-Pearl River Delta Regional Co-operation, ‘The Pan-Pearl River Delta (Pan-PRD) and the Greater Pearl River Delta (Greater PRD)’, accessed 20 June 2016, http://www.cb.cityu.edu.hk/research/apec/PPRD/index.htm 582 ‘The importance of the Pearl River Delta in China’, ChineseConnects.com. 583 NDRC, ‘Outline of the plan for the reform and development of the Pearl River Delta’. 584 Planning Department of the Government of Hong Kong SAR, ‘Plans for cooperative development of transportation’, in Planning Study on the Co-ordinated Development of the Greater Pearl River Delta Townships (Hong Kong, China: Planning Department, 2009), Ch. 5, http://www.pland.gov.hk/pland_en/misc/great_prd/news/pdf_en/02_ch5.pdf 585 J. Xu and A.G.O. Yeh, ‘Interjurisdictional cooperation through bargaining: The case of Guangzhou–Zhuhai Railway in the Pearl River Delta, China’, The China Quarterly 213 (2013): 130–51. 586 Ibid. 587 UN-Habitat, State of Latin American and Caribbean Cities Report 2012. 588 CEPEC (Centro de Pensamiento en Estrategias Competitivas), ‘Indice de atractividad de inversions urbanas’ [Index of attractiveness for urban investments], Universidad del Rosario, accessed 14 May 2014, http://www.urosario.edu.co/sala-deprensa/noticias/Destacadas/Ciudades-latinoamericanas-mas-atractivas-para-la-i/ 589 Banco Central de Chile (Central Bank of Chile), ‘Cuentas nacionales – Evolución de la actividad económica en el año 2013’ [National accounts – Evolution of economic activity for 2013] (Santiago: Central Bank of Chile, 2014), 24. 590 Ibid. 591 Mercer, ‘Quality of living reports’, accessed 1 June 2015, http://www.imercer.com/products/2014/quality-of-living.aspx 592 Emol, ‘Santiago lidera el ranking de las ciudades inteligentes de Chile’[Santiago leads the ranking of the smarter cities in Chile], 3 September 2014, http://www.emol.com/noticias/tecnologia/2014/09/03/678369/la-ciudad-de-santiagolidera-el-ranking-de-smart-cities-en-america-latina-y-chile.html 593 The Economist Intelligence Unit, Green City Index (Munich: Siemens, 2010). 594 Ibid. 595 Valparaíso Regional Government, Estrategia Regional de Desarrollo 2020 [Regional Strategy for Development 2020] (Valparaíso: GORE, 2012). 596 Central Bank of Chile, [National accounts – Evolution of economic activity for 2013]. 597 MIT (Massachusetts Institute of Technology), Santiago Urban Planning Studies (MIT: Boston, 2003), 5. 598 World Bank, Doing Business in Chile (Washington, DC: World Bank, 2015), http://www.doingbusiness.org/data/exploreeconomies/chile 599 Transparency International, ‘Corruption by country / territory’, accessed 6 June 2016, https://www.transparency.org/country/#CHL 600 World Economic Forum, Global Competitiveness Report 2009–2010 (Geneva: World Economic Forum, 2009). 601 CIA (Central Intelligence Agency), ‘The world factbook, Chile’, accessed 1 June 2015, https://www.cia.gov/library/publications/the-world-factbook/geos/ci.html 602 Economist Intelligence Unit, Hot Spots 2025. 603 Economist Intelligence Unit, Hot Spots 2025, 14. 604 MDS (Ministerio de Desarrollo Social de Chile), Encuesta Casen: Inmigrantes Síntesis de Resultados [Summary of Immigration Survey] (Santiago: MDS, 2013), 41,
499
http://observatorio.ministeriodesarrollosocial.gob.cl/documentos/CASEN_2013_Inmigrant es_revisada.pdf 605 Ministerio de Relaciones Exteriores de Chile, ‘Acuerdos comerciales’ [Free trade agreements], accessed 1 June 2015, http://www.direcon.gob.cl/acuerdos-comerciales/ 606 CEPEC, [Index of attractiveness for urban investments]. 607 World Bank, ‘Ease of doing business index’, accessed 1 June 2015, http://data.worldbank.org/indicator/IC.BUS.EASE.XQ 608 A.F. Yazigi, ed., The Chilean Pension System, 4th edn. (Santiago: Superintendency of Pension Fund Administrators, 2003), http://www.spensiones.cl/portal/informes/581/w3article-3523.html 609 Foreign Investment Promotion Agency, ‘Statistics’, accessed 1 June 2015, http://www.ciechile.gob.cl/en/inversion-en-chile/estadisticas/ 610 Central Bank of Chile, [National accounts – Evolution of economic activity for 2013]. 611 United Nations, 2014 Global Investment General Report (Geneva and New York: UNCTAD, 2014). 612 The Heritage Foundation, 2013 Index of Economic Freedom (Washington, DC and New York: The Heritage Foundation and The Wall Street Journal, 2013). 613 INE (Instituto Nacional de Estadísticas), Compendio Estadístico 2012, 1.5 Estadísticas de educación, cultura y medios de comunicación. [Summary 2012: education, culture and media] (Santiago: INE, 2013) 614 The global competitiveness indicator consists of three sub-indexes or elements for competitiveness (Basic Requirements, Efficiency Enhancers and Innovation and Sophistication Factors) and 12 pillars that make up these sub-indexes. 615 World Economic Forum, The Global Competitiveness Report 2014–2015: Full Data Edition (Geneva: World Economic Forum, 2014). 616 R. Hidalgo, ‘Vivienda social y espacio urbano en Santiago de Chile. Una mirada retrospectiva a la acción del estado en las primeras décadas del Siglo XX’ [Public housing and public space in Santiago. A retrospective view of the government role in the first decades of the XX century], Revista Eure 28(83) (2002): 83–106. 617 MTT (Ministry of Transport and Telecommunications of Chile), ‘Presentamos resultados de la Encuesta Origen Destino de Santiago’ [Presenting the results of origin-to-destination survey of Santiago], 16 March 2015, http://www.mtt.gob.cl/archivos/10194 618 INE, Compendio Estadístico 2015 [Statistical Summary]. (Santiago: INE, 2016) 619 I. Poduje, ‘Long-term vision in infrastructure’ (presentation at the 2015 conference of the Chilean Council of Infrastructure Policies, Santiago, 2015) 620 Bioceanico Aconcagua, accessed 1 June 2015, http://www.bioceanicoaconcagua.com/en/home 621 AACh (Asociación de Aseguradores de Chile), 8,8° Richter: El Mayor Desafío de los Aseguradores Chilenos [Richter: The greatest challenge of Chilean insurance companies] (Santiago: AACh, 2015) 622 ‘Inequality: Chile’s real position’, Public Issues no. 1,106 (Libertad y Desarrollo, 2013) http://lyd.org/wp-content/themes/LYD/files_mf/pi110690.pdf 623 UNDP, Human Development Report 2014 (New York: UNDP, 2014). 624 L. Fuentes and A. Orellana, ‘Competividad y calidad de vida en Santiago de Chile: El lado oscuro de la ciudad exitosa’ [Competitiveness and quality of life in Santiago: The dark side of the successful city], Modulo Arquitectura CUC 11(1) (2012): 193–216, http://revistascientificas.cuc.edu.co/index.php/moduloarquitecturacuc/article/view/30 625 H. Romero et al., ‘Assessing urban environmental segregation (UES): The case of Santiago de Chile’, Ecological Indicators 23 (2012): 76–87; H. Romero et al., ‘Climas urbanos y contaminación atmosférica en Santiago de Chile’[Urban climates and atmospheric pollution in Santiago], eure 36(109) (2010): 35–62. 626 Economist Intelligence Unit, Hot Spots 2025, 13. 627 Economist Intelligence Unit, Green City Index.
500
628 MMA (Ministerio de Medio Ambiente de Chile), Estado del Medio Ambiente [State of the environment] (Santiago: MMA, 2011) 629 A. Valdez et al. ‘Elemental concentrations of ambient particles and cause specific mortality in Santiago, Chile: A time series study’, Environmental Health 11(1) (2012): 82. 630 Government of Chile, Plan de Prevención y Descontaminación Atmosférica de la Región Metropolitana [Metropolitan region atmospheric pollution plan] (Santiago: Ministerio Secretaría General de la Presidencia De la República, 2010), 113. 631 The Economist Intelligence Unit, Green City Index. 632 SISS (Superintendencia de servicios sanitarios), Informe Anual de Coberturas de Servicios Sanitarios [Annual Report of Sanitation Coverage] (Santiago: SISS, 2012). 633 Economist Intelligence Unit, Green City Index. 634 Ibid. 635 Ibid. 636 Ibid. 637 MMA (Ministerio de Medio Ambiente, or Ministry of the Environment), accessed 1 June 2015, http://siia.mma.gob.cl/mma-centralizadorpublico/indicador/vistaIndicador.jsf?id=03AF0421-954E-BFA3-9290-5F9C2CDAF305 638 A. Galetovic and P. Jordan, ‘Santiago: ¿Dónde estamos?, ¿Hacia dónde vamos?’ [Santiago, Where are we? Where are we going?], Centro de Estudios Publicos 101 (2006): 87–146, http://www.cepchile.cl/dms/archivo_3739_1932/r101_galetovic_santiago.pdf 639 F. Steinberg ‘Strategic urban planning in Latin America: Experiences of building and managing the future’, Habitat International 29(1) (2005): 60–93. 640 Minvu (Ministerio de Vivienda y Urbanismo), ‘Ministro Pérez informa plan de intervención por $44 mil millones en sector Bajos de Mena de Puente Alto’ [Minister launches an intervention plan of USD 80 million for Bajos de Mena, Puente Alto district], 7 June 2012, http://www.minvu.cl/opensite_det_20120607153314.aspx 641 ‘Corredores bioceánicos entre Argentina y Chile, ¿ventajas sobre el Canal de Panamá?’ [Bioceanic corridors between Argentina and Chile; advantages over Panama canal?], Marco Trade News, 8 December 2011, http://marcotradenews.com/noticias/corredoresbioceanicos-entre-argentina-y-chile-ventajas-sobre-el-canal-de-panama-20381 642 Consorcio Bioceanico Aconcagua, ‘Proyecto’ [Project], accessed 1 June 2015, http://www.bioceanicoaconcagua.com/home 643 Ibid. 644 The Seoul Research Data Service, ‘Population growth’, accessed 15 September 2016, http://data.si.re.kr/eng_p_population_growth 645 The Economist Intelligence Unit, Hot Spots 2025. 646 Seoul Metropolitan Government, Transport Statistics 2014 [dataset] 647 Ibid. 648 The Seoul Institute, ‘Infographics 42’, accessed 21 April 2015, http://www.si.re.kr/node/46302 649 The Seoul Institute, ‘Infographics 77’, accessed 21 April 2015, http://www.si.re.kr/node/48557 650 K.Y. Hwang, ‘The competitiveness of Seoul Metropolitan Region’, in ADB and CAF, The Competitiveness of Cities in Asia and Latin America. 651 Ibid. 652 Seoul Metropolitan Government, Seoul Statistics, accessed 23 April 2015, http://stat.seoul.go.kr/jsp3/index.jsp 653 Korea Transport Institute (KOTI), Lessons from Transition in Urban Transport Policy (Ilsan: Korea Transport Institute, 2012). 654 Ibid. 655 Korea Electric Power Corporation, Research Report 12-12 (Seoul: Korea Electric Power Corporation, 2012), http://home.kepco.co.kr/kepco/CO/ntcob/ntcobView.do?pageIndex=6&boardSeq=2100480
501
7&boardCd=BRD_000270&menuCd=FN05030602&parnScrpSeq=0&searchCondition=to tal&searchKeyword= 656 Hwang, ‘The competitiveness of Seoul Metropolitan Region’. 657 A.A. Laquian, Beyond Metropolis: the Planning and Governance of Asia’s Mega-Urban Regions (Washington, DC: Woodrow Wilson Center Press, 2005). 658 Seoul Metropolitan Government, ‘The city of Seoul is replacing decrepit water pipes’, 2011, accessed 23 April 2015, http://arisu.seoul.go.kr 659 The Seoul Institute, A Study on the Release of Motorway Designation with a Focus on Traffic Operations and Regulations (2013-PR-44, Seoul: The Seoul Institute, 2013). 660 PAI (Population Action International), Sustaining Water, Easing Scarcity: A Second Update (Washington, DC: PAI, 1997). 661 Hwang, ‘The competitiveness of Seoul Metropolitan Region’. 662 The Seoul Research Data Service, ‘Demographics’, accessed 15 September 2016, http://data.si.re.kr/eng_p_demographics 663 Ibid. 664 Ibid. 665 M. Byun and J.H. Lee, ‘Social innovation and civil society in urban governance: Case study of participatory governance and community rebuilding in Seoul Metropolitan City. (Urban Affairs Association 43rd Annual Conference, 2013), 71, http://www.urbanaffairsassociation.org/pdfs/2013_abstracts.pdf 666 J.A. Phills Jr, K. Deiglmeier and D.T. Miller, ‘Rediscovering social innovation’, Social Innovation Review (2008): 34–43. 667 Seoul Metropolitan Government, Master Plan for the Community and Neighborhood (Seoul: Seoul Metropolitan Government, 2012) 668 Seoul Metropolitan Government, Seoul, a Clean and Attractive Global City: Four-Year Plan of the Fourth Elected City Administration (2006–2010) (Seoul: Seoul Metropolitan Government, 2007). 669 Seoul Metropolitan Government, On the Open Data Project (Seoul: Seoul Metropolitan Government, 2012) 670 OECD Korea Policy Centre, Advancing Indonesian Local E-government: Challenges, Opportunities, and Strategic Roadmap (Seoul: OECD, 2012), Box 6, http://www.oecdkorea.org/Download/Governance/Manager/Public/File/201301/Advancing %20Indonesian%20Local%20E-government.pdf 671 Ibid. 672 Korea Institute of Public Finance, ‘조세수입’ [Internal Revenue (1949–2013)], accessed 29 April 2015, http://www.kipf.re.kr/TaxFiscalPubInfo/TaxFiscaltax/A01/1#not 673 R. Bristow, ed., Planning in Taiwan: Spatial Planning in the Twenty-First Century (London and New York: Routledge, 2010). 674 Wikiwand, ‘List of metropolitan areas in Taiwan’, accessed 30 September 2015, http://www.wikiwand.com/en/List_of_metropolitan_areas_in_Taiwan 675 Department of Budget, Accounting and Statistics, Taipei City Government website, accessed 16 September 2016, http://dbaseng.gov.taipei/np.asp?ctNode=11377&mp=120002 676 天下雜誌 [Common Wealth magazine], Taipei, 2005. 677 M. Tien, ‘A study of industries’ headquarters location in Taiwan (master’s thesis, National Chengchi University, 2005). 678 Economist Intelligence Unit, Asian Green City Index (Munich: Siemens, 2011). 679 Brookings, Global Metro Monitor Map: Combined Change in Employment and GDP Per Capita (Index of Both Rates), 2013–2014 (New York: Brookings Institution, 2014). 680 C. Sui, ‘Taiwan’s struggle to become an innovation leader’, BBC, 18 September 2013, http://www.bbc.com/future/story/20130918-taiwans-rocky-road-to-innovation
502
681 TCDC (Taiwan Cultural-Creative Development Co. Ltd.), ‘1914 Huashan Creative Park: What’s the Story’, accessed 31 October 2016, http://www.huashan1914.com/en/story.html. 682 L. Hsueh, A. Lin and C. Taylor, ‘Chapter 6: The development of the cultural and creative industries in Taiwan and its significance for SMEs’, in White Paper on Small and Medium Enterprises in Taiwan (Taipei: Small and Medium Enterprise Administration, Ministry of Economic Affairs, 2004), 161–88. 683 Taipei Rapid Transit Corporation, ‘Network and systems’, 5 July 2015, http://english.metro.taipei/ct.asp?xItem=1315555&ctNode=70214&mp=122036 684 C. Chen, ‘Study on the plan of Taipei Port’ (Third Chinese-German Joint Symposium on Coastal and Ocean Engineering, National Cheng Kung University, Tainan, 8–16 November 2006). 685 ‘Youbike Taipei City public bicycle rentals’, accessed 6 June 2016, https://guidetotaipei.com/article/youbike-taipei-city-public-bicycle-rentals-ubike%E5%BE%AE%E7%AC%91%E5%96%AE%E8%BB%8A 686 Taipei Feitsui Reservoir Administration. ‘Description of Feitsui Reservoir’, accessed 6 June 2016, http://english.fra.gov.taipei/ct.asp?xItem=187262&CtNode=18516&mp=122012 687 Sewerage Systems Office of the Public Works Department of Taipei City Government, ‘Bali Sewage Treatment Plant’ (2013), accessed 6 June 2016, http://tcgwww.taipei.gov.tw/ct.asp?xItem=153255&ctNode=16315&mp=106042 688 R. Kwok and J. Hsu, ‘Asian dragons, South China growth triangle, development governance, and globalising Taipei’, in R. Kwok, ed., Globalising Taipei: The Political Economy of Spatial Development (London: Routledge, 2005). 689 T.L. Chow, ‘Institutional evolution and the challenge of planning in post-industrial Taiwan’, in Bristow, Planning in Taiwan. 690 City Of Taipei, City of Taipei: The Urban Development Context (Taipei: Bureau of Urban Development, City of Taipei, 2005). 691 M. Raco, R.O.B. Imrie and W. Lin, ‘Community governance, critical cosmopolitanism and urban change: Observations from Taipei, Taiwan’, International Journal of Urban and Regional Research 35 (2011): 274–294. 692 L. Huang, ‘Urban politics and spatial development: The emergence of participation planning’, in Kwok, Globalising Taipei. 693 T.L. Chow, ‘Institutional evolution’. 694 Ibid. 695 C. Wang, ‘Planning Taipei’, in A.J. Jacobs, ed., The World’s Cities: Contrasting Regional, National, and Global Perspectives (London: Routledge, 2012). 696 H.F. Lin, ‘Interorganizational and organizational determinants of planning effectiveness for Internet-based interorganizational systems’, Information & Management 43 (2006): 423– 33. 697 Bristow, ‘Planning in Taiwan’. 698 D. Schwela et al., Urban Air Pollution in Asian Cities: Status, Challenges and Management (London: Earthscan, 2012) 699 C40 Cities, ‘Taipei – clean air – it’s your move’, accessed 6 June 2016, http://www.c40.org/profiles/2014-taipei 700 Ibid. 701 Ibid. 702 Ibid. 703 Acer Group, ‘Major initiatives and participation’ (Green Competitiveness Alliance), accessed 1 September 2015, http://www.acergroup.com/public/Sustainability/approach/engagement-2.htm 704 Environmental Protection Department, New Taipei City Government, ‘Mission and vision’, accessed 1 September 2015, http://www.epd.ntpc.gov.tw/en/ 705 Y. Chen, ‘Taiwan in dire need of real social housing’, Taipei Times, 20 February 2012.
503
706 ‘Quirky but efficient, Taiwan’s first carbon neutral building opens’, Free Sun News, 14 January 2011. 707 L. Chang, K.C. Seto and S. Huang, ‘Climate change, urban flood vulnerability, and responsibility in Taipei’, in C.G. Boone and M. Fragkias, eds, Urbanization and Sustainability: Linking Urban Ecology, Environmental Justice and Global Environmental Change (New York: Springer, 2012). 708 Y. Mo, ‘Taipei, New Taipei City launch Tamsui River clean-up body’, Taipei Times, 11 August 2011. 709 M. Hsu et al. ‘Flood damage assessment in Taipei City Taiwan’ (presented at the 9th International Joint IWA/IAHR Conference on Urban Drainage Modelling, Belgrade, Serbia, 3–6 September 2012). 710 Economist Intelligence Unit, Global Liveability Report 2015 (London: Economist Intelligence Unit, 2015). 711 US Census; State of Washington 2014 Population Trends by County; Statistics Canada; Population Research Center, Portland State University. 712 Y. Hedrick-Wong and D. Choong, MasterCard 2015 Global Destination Cities Index – Tracking Global Growth: 20092015 (New York: MasterCard, 2015). 713 J. Kotkin, ‘The best cities for tech jobs’, Forbes, 17 May 2012. 714 Washington State Office of Financial Management, ‘State of Washington 2014 population trends’ (Olympia, WA: Washington State Office of Financial Management, 2014). 715 G. Balk, ‘Seattle is fastest growing city in the US’, Seattle Times, 22 May 2014. 716 Base figures are projected by average growth rate, from the Washington State Office of Financial Management’s ‘State of Washington 2014 population trends’. 717 Brookings Institution, ‘Global Cities Initiative’, accessed 15 May 2015, http://www.brookings.edu/about/projects/global-cities/; A. Gauthier, British Columbia’s Merchandise Trade with the World (2014-29-E, Ottawa: Library of Parliament, 2014). 718 Conclusions of the Chicago Forum on Global Cities, Tracking Global Growth: 2009– 2015, accessed 9 June 2016, www.thechicagocouncil.org/publications/2015-Chicagoforum-global-cities-impact-report 719 Gauthier, British Columbia’s Merchandise Trade. 720 1962 Seattle World’s Fair’, Seattle Municipal Archives, accessed 15 June 2015, http://www.Seattle.gov/cityarchives 721 J. Mackie, ‘Expo86: The biggest single catalyst for dramatic change in Vancouver’, Vancouver Sun, 6 May 2011. 722 Ibid. 723 US Bureau of Labor statistics, accessed 10 June 2015, http://www.bls.gov 724 Pacific Northwest Economic Region, PNWER Border Charter, accessed 20 May 2015, http://www.gov.bc.ca/igrs/down/PNWER_border_charter.pdf 725 MasterCard, ‘MasterCard Global Destination Cities Index Report 2015’, 3 June 2015, http://www1.mastercard.com/content/intelligence/en/research/reports/2015/mastercardglobal-destination-cities-index-report-2015.html 726 L.D. Taylor, ‘NGO Transborder Organizations: San Diego–Tijuana and Vancouver–Seattle Regions’, Frontera-Norte 19(37) (2007): 35–57. 727 Whatcom Council of Governments, ‘Border Statistics 2015’, 2015 IMTC Resource Manual, accessed 10 June 2016, www.theimtc.com/wp/content/uploads/2015rm/onlinepdf 728 Boeing, ‘Our company’, accessed 10 May 2015, http://www.Boeing.com 729 Boeing, ‘Boeing history’, accessed 10 May 2015, http://www.Boeing.com/history 730 Times Higher Education World University Rankings 2014–2015. 731 University Washington, http://www.washington.edu/; University of British Columbia. https://www.ubc.ca/ accessed 6 June,2016. 732 Bill and Melinda Gates Foundation, ‘Fact sheet’, accessed 31 March 2015, http://www.Gatesfoundation.org/who-we-are/General-Information/Foundationfactsheet
504
733 J. Smallbridge, ‘BC’s film industry bounces back to blockbuster level’, Vancouver Sun, 23 March 2015. 734 Vancouver Economic Commission, ‘Submission to expert panel on business taxation’, May 2012. 735 Marchio, Ryan and McDeormon, ‘Export monitor 2015’, Brookings, accessed 10 June 2016,, http://www.Brookings.edu/blogs/the-avenue/rethinkingmetropolitanAmerica 736 Intel, ‘Intel in Oregon', accessed 15 May 2015, http://www.intel.com/content/www/us/en/corporate 737 Port of Seattle, ‘Port of Seattle Commission’, accessed 08 May 2015, http://www.portseattle.org 738 Ibid. 739 Whatcom Council of Governments, ‘The International Mobility and Trade Corridor Project Program’, accessed 10 May 2015, http://www.theimtc.com 740 Ibid. 741 ‘George Massey Tunnel Replacement Project’, accessed 1 May 2016, www.engage.gov.bc.ca/masseytunnel/ 742 Washington State Department of Transportation, ‘Amtrak Cascades passenger rail in Washington"’, accessed 12 June 2015, http://www.wsdot.wa.gov.. 743 Washington State Department of Transportation, ‘WSDOT rail projects’, accessed 12 June 2016, http://www.wsdot.wa.gov/projects/rail 744 Ibid. 745 Washington State Department of Transportation, ‘Amtrak Cascades passenger rail in Washington’. 746 BNSF Railway, 2014 Annual Review, accessed 15 May 2015, http://www.bnsf.com 747 Roberts Bank Rail Corridor Program, ‘Progress report press release’, 19 October 2012, http://www.robertsbankrailcorridor.ca/media 748 ‘Passengers boarded at top 50 US airports’, Bureau of Transport Statistics, Office of Aviation Analysis, United States Department of Transport, Table 1-44, Federal Aviation Administration figures for 2013, accessed 25 May 2015, http://www.faa.gov 749 Vancouver Airport Authority, ‘YVR: Your Airport 2027–20 Year Master Plan’ (2007) estimate of USD 6.8 billion and 2.3 percent of total employment in Metro Vancouver adjusted by author to 2015 estimate by using annual growth rates of 1.5 to 1.9 percent per annum. 750 Vancouver Airport Authority data, ‘Careers’, accessed 10 June 2016, http://www.yvr.ca/en/about/careers/aspx 751 Vancouver Airport Authority 2015 data, accessed 05 May 2015, http://www.yvr.ca 752 Port of Vancouver, ‘Current statistics overview 2014 cruise sector’, accessed 10 June 2016, http://ww.portmetrovancouver.com/wp-content/uploads/2016/02/2015-statisticsoverview.pdf 753 Ibid. 754 Port of Seattle Commission, ‘Sea-Tac airport history’, accessed 11 June 2016, https://www.portseattle.org/Newsroom/Fastfacts/Pages/Airport-Basics.aspx, http://www.portmetrovancouver.com 755 Port of Seattle, ‘About the Port’, accessed 18 May 2015, https://www.portseattle.org 756 Port of Seattle, Seattle-Tacoma International Airport, ‘Fast facts’, accessed 11 June 1016, https://www.portseattle.org/Newsroom/Fast-Facts/Pages/Airport-Basics,aspx]ibid ibid. 757 Ibid. 758 Ibid. 759 Union Pacific in Washington website, accessed 07 May 2015, http://www.unionpacific.com 760 Port of Seattle Commission, ‘Port of Seattle’, accessed 22 May 2016, http://www.portseattle.org
505
761 Port of Tacoma, ‘Draft clean air strategy’, accessed 22 May 2016, http://ww.portoftacoma.com 762 Port of Seattle, ‘About the port’, accessed 6 June 2016, https://www.portseattle.org 763 Port of Portland, ‘Gateway of choice’, accessed 16 May 2015, http://www2.portofportland.com/Inside/Commission Information 764 Port of Portland, ‘Commission’ accessed 6 June 2016, https://www2.portofportland.com/Inside/CommissionInformation ibid 765 CAPA, ‘Portland International airport enjoys steady growth despite its smaller market footprint’, accessed 6 June 2016, http://centreforaviation.com/analysis/portlandinternational-airport-enjoys-steady-growth-despite-its-smaller-market-footprint-255630 766 Elections BC, ‘2015 funding plebiscite Metro Vancouver’, accessed 10 June2016, www. Elections.bc.ca/index.php/news/nr-peb-2015mutt-9/ 767 W. Cox, ‘The evolving urban form: Portland’, New Geography, 8 March 2013, http://www.newgeography.com/content/003856-the-evolving-urban-form-portland 768 D. Todd, ‘Vancouver is the most “Asian” city outside Asia. What are the ramifications?’ Vancouver Sun, 28 March 2014, http://vancouversun.com/life/vancouver-is-most-asiancity-outside-asia-what-are-the-ramifications 769 Statistics Canada, ‘Visible minority population by census Metropolitan Area Vancouver’, accessed 20 May 2015, http://www.statcan.gc.ca 770 Todd, ‘, ‘Vancouver is the most “Asian” city’. 771 United States Department of Interior, ‘Pacific Northwest geologic mapping and urban hazards’, accessed 20 May 2015, http://geomaps.wr.usgs.gov/pacnw/index.html 772 Metro Vancouver, ‘Board members’, accessed 16 July 2015, http://www.metrovancouver.org/boards/membership/board-members/Pages/default.aspx 773 Metro Vancouver, ‘New name’, accessed 2 June 2016, http://www.metrovancouver.org/includes/timeline.html#page-2007 774 K. Cameron, M. Harcourt and S. Rossiter, City Making in Paradise: Nine Decisions that Saved Vancouver (Douglas and McIntyre (2013) Limited, 2009), 84. 775 Economist Intelligence Unit, Global Liveability Ranking and Report 2014. 776 Metro Vancouver, Metro Vancouver 2040: Shaping Our Future (Vancouver: Metro Vancouver, 2011). 777 Cameron et al., City Making in Paradise. 778 Puget Sound Regional Council, ‘Boards’, accessed 2 June 2016, http://www.psrc.org/about/boards/ 779 Puget Sound Regional Council, Vision 2040: The Growth Management, Environmental, Economic, and Transportation Strategy for the Central Puget Sound Region (Seattle: Puget Sound Regional Council, 2008). 780 Ibid., iv. 781 ‘What is Metro?’, accessed 2 June 2016, http://www.oregonmetro.gov 782 Ibid. 783 ‘Beyond the border’, press release, accessed 14 May 2015, http://www.whitehouse.gov/thepress-office/2011/02/04/declaration 784 ‘US and Canada announce border pre-clearance expansion’, press release,16 March 2016, accessed 2 June 2016, https://ca.usembassy.gov/category/border-issues/ 785 Ibid. 786 Washington State–British Columbia Memorandum Document, ‘Action on regional transportation and coordination’, 9 October 2009, signed by Paula Hammond, Secretary of Transportation, State of Washington and Shirley Bond, Minister of Transportation and Infrastructure, Province of British Columbia. BC Government, accessed 2 June 2016, http://www.gov.bc.ca/igrs/attachments/en/WA-BC-MOA-Transit.pdf 787 ‘Cascadian Mayors flirt with romance of high speed rail’, Business in Vancouver, 15 June 2010, http://www.discovery.org/a/15061
506
788 International Mobility and Trade Corridor Program, ‘About IMTC’, accessed 2 June 2016, http://www.theimtc.com/about 789 Washington Governor, ‘Taps strategic reserve account for economic aid to Skagit area communities’, accessed 2 June 2016, http://www.governor.wa.gov/ 790 Washington State Department of Transportation, ‘Skagit River Bridge Replacement’, accessed 2 June 2016, http://www.wsdot.wa.gov/projects/I5/skagitriverbridgereplacement/ 791 City of Vancouver, ‘Greenest City 2020: A bright green future’, updated 7 April 2014, http://www.vancouver.ca 792 City of Seattle, ‘Seattle’s 21 sister cities’, accessed 15 May 2015, http://www.seattle.gov/oir/sister-cities/seattles-21-sister-cities. 793 City of Portland, ‘Sister cities’, accessed 15 May 2015, http://www.portlandoregon.gov/sistercities/62934 794 Washington Technology Industry Association website, accessed 16 May 2015, http://www.washingtontechnology.org 795 Hedrick-Wong and Choong, MasterCard 2015 Global Destination Cities Index, 49. 796 Allen and Eaqub, Core Cities Collaborating for Growth. 797 Ibid., 1 798 Kuznets, ‘Economic growth and income inequality’; J.L. Gallup, ‘Is there a Kuznets curve?’ (Portland: Portland State University, 2012), https://www.pdx.edu/econ/sites/www.pdx.edu.econ/files/kuznets_complete.pdf 799 M. Chen et al., ‘The global pattern of urbanization and economic growth: Evidence from the last three decades’, PLoS ONE 9(8) (2014); C. Gallo, ‘Economic growth and income inequality: Theoretical background and empirical evidence’ (Working paper, London: Development Planning Unit, University of London, 2002), https://www.bartlett.ucl.ac.uk/dpu/publications/latest/publications/dpu-workingpapers/WP119.pdf 800 UNDP, Humanity Divided: Confronting Inequality in Developing Countries (New York: UNDP, 2013). 801 R.J. Nicholls et al., ‘Ranking port cities with high exposure and vulnerability to climate extremes exposure estimates’ (Paris: OECD Publishing, 2008). 802 G. Alpa, ‘General principles of law’, Annual Survey of International & Comparative Law 1(1) (2010): 1–38. 803 Urban Land Institute, Ten Principles for Sustainable Development of Metro Manila’s New Urban Core (Washington, DC: Urban Land Institute, 2013). 804 E. Moir, T. Moonen and G. Clark, The Future of Cities: What is the Global Agenda? (London: Foresight Future of Cities Project, 2014). 805 UNDP, ‘Sustainable Development Goals (SDGs)’, accessed 30 September 2015, http://www.undp.org/content/undp/en/home/mdgoverview/post-2015-developmentagenda.html 806 T. Piketty, Capital in the Twenty-First Century, transl. by A. Goldhammer (Cambridge, MA: Belknap Press, 2014). 807 C. Sussangkarn, Y.C. Park and S.J. Kang, eds, Foreign Direct Investments in Asia (Oxford: Taylor & Francis, 2011). 808 T. Goodwin, ‘The battle is for the customer interface’, Tech Crunch, 2015, http://techcrunch.com/2015/03/03/in-the-age-of-disintermediation-the-battle-is-all-for-thecustomer-interface/#.nxcrqb:I7dS 809 T. Goodwin, ‘The battle is for the customer interface’, Tech Crunch, 2015 http://techcrunch.com/2015/03/03/in-the-age-of-disintermediation-the-battle-is-all-for-thecustomer-interface/#.nxcrqb:I7dS 810 Lindfield and Steinberg, Green Cities. 811 Roberts, Managing Systems of Secondary Cities, 232. 812 M. Fonseca, ‘Guide to 12 disruptive technologies’, IntelligentHQ, 3 February 2014, http://www.intelligenthq.com/technology/12-disruptive-technologies/
507
813 TIR Consulting Group, Nord-Pas de Calais Third Industrial Revolution Master Plan – 2013 (Calais: Accenture, 2013), https://www.accenture.com/us-en/insight-third-industrialrevolution-master-plan.aspx
508