Assessing Customer Satisfaction in V-commerce Environment Shuchih Ernest Chang ∗ Institute of Electronic Commerce, National Chung Hsing University 250 Kuo Kuang Road, Taichung City 402, Taiwan, ROC
[email protected] Yu-Teng Jang Department of Business Administration, National Chung Hsing University 250 Kuo Kuang Road, Taichung City 402, Taiwan, ROC
[email protected] Abstract This paper describes the design and implementation of a non-intrusive method of assessing customer satisfaction in a voice-enabled electronic commerce environment. After recording a customer’s speech voice during his/her interaction with a voice-enabled web system (VWS), a subsequent questionnaire survey was immediately carried out to identify the satisfaction level of the customer. Afterwards, a collection of recorded customer voice files and the corresponding values of customer satisfaction were used to construct an artificial neural network based expert system, the satisfaction level assessment system (SLAS), which was thereafter integrated into VWS for automatically detecting the satisfaction level of VWS users. Experiments were performed to test the feasibility and applicability of the proposed method, and good preliminary results were derived. Instead of using the conventional questionnaire-based approach, SLAS is non-intrusive since it does not require users to fill out any questionnaire. The proposed method can be used by various voice based business applications, such as call center and customer relationship management, to achieve the business objective of improving customer satisfaction, enforcing customer loyalty, increasing re-purchase rate, and enhancing enterprise’s benefits. The proposed SLAS (including method and system) that was filed for patent application was recently approved by Taiwan Intellectual Property Office under Patent No. I268478. Keywords: electronic commerce, customer satisfaction, voice applications, back propagation networks, customization 1. INTRODUCTION Due to the pervasive nature of empowering people to use it anywhere and anytime, mobile phone is currently one of the most pervasive devices in the world, and mobile Internet application on ubiquitous mobile networks allows real-time, anywhere, and anytime connectivity services [1], [2]. However, a survey conducted in Taiwan shows that the utilization rate of accessing Internet from wireless devices is relatively low [3], mainly because the text-based interaction between mobile devices and websites is very limited. At the same time, another survey conducted in Taiwan indicates that voice channel is still the preferred choice by mobile phone users [4]. Voice interaction can escape the physical limitations on keypads and displays as mobile devices become ever smaller and it is much easier to say a few words than it is to thumb them in on a keypad where multiple key presses may be needed for each letter. With the rapid spread of ∗
Corresponding author. Tel.: +886 4 22859465; Fax: +886 4 22859497. 1
2
Assessing customer satisfaction in v-commerce
mobile phone devices and the convergence of the phone and the personal digital assistant (PDA), there is an increasing demand for a multimodal platform that combines the modalities of various interface devices to reach a greater population of users. Therefore, from the business point of view, providing common services available through both web browser interface and telephony interface is an attractive approach. A report from ZDNetAsia also mentions that more than half of 3G traffic would be voice and voice is still the platform on which our business is run [5]. In United States, a study reported by the Kelsey Group claims that expenditures for speech-related services worldwide are expected to reach $41 billion by 2005 [6]. This report also estimates a 60-65% average annual growth rate by 2005, for voice services globally, with the U.S. market expected to be 20-25% of this total. From the aforementioned facts and analyses, it is believed that the demand for mobile accessibility has created a market for voice-enabled applications accessible by mobile phone. Similar to the traditional electronic commerce (EC) applications, voice-enabled electronic commerce (also called v-commerce) applications are on the rise. Simply speaking, v-commerce uses computerized voice technologies to interact with web applications via telephone, computer, or any other audio-enabled device that communicates with a network [7]. Businesses adopting EC for catching the revolutionary opportunity and benefit of EC are facing serious competition mainly because the EC ecosystem has low entrance barriers for new players to join and intensify the competition. Thus, for the purpose of attracting and retaining customers and improving their competition edges in EC environment, some EC companies take advantage of differentiation and customization technologies to make their products and services unique, research on customers’ behaviors for developing appropriate marketing strategies, and tailor suitable products and services to the targeted customers accordingly. Wind and Rangaswamy [8] found that the opportunity and capability to offer consumers a flexible and customized relationship is probably one of the most important advantages among all possible benefits offered by EC to businesses. Customized segmentation can ultimately enhance customers’ satisfaction level and loyalty, and the increase in each customer’s visiting frequency can further create more transaction opportunities and benefit the Internet businesses [9]. Elevating customer satisfaction and stressing unique value for customers have become important business strategies [10]. Research and development on marketing strategies also have been affected by the concepts of target segmentation and customization derived from customer-oriented strategic theories [11]. Customization technology can give users a better, in terms of efficiency and effectiveness, EC experience since they do not have to browse through all the irrelevant noise [12]. Moreover, decision support system incorporated with customization also has been widely applied to many business domains, such as the pre-sale housing decision support system (DSS) [13], Internet marketing [12], and international trade [14] (e.g. electronic trade procedures), etc. Thus, the segmented marketing strategy is proposed to provide customized service in the EC environment [15]. Although all the above mentioned studies and methods share the same spirit of assisting enterprises in customizing products and services, none of them utilize a valuable factor – customer satisfaction. This research proposes to add this important factor into the customization process as a part of the overall EC strategy in v-commerce environment. Although a user’s satisfaction level on different products and services varies, the proposed method can detect it dynamically and directly in a non-intrusive way, without explicitly asking users to fill out questionnaires. Our method is based on the customers’ speech voices by analyzing their speech patterns through pre-trained artificial neural networks. Four experiments (including three
Assessing customer satisfaction in v-commerce
3
fundamental experiments and one extended experiment), designed for validating the proposed method, were conducted in our study to prove the concept, and good preliminary results were derived from the study. Afterwards, this approach was extended and incorporated into our integrated knowledge level assessment system (KLAS) and personalized promotion decision support system (PPDSS) [16], which used data mining techniques in accordance with marketing strategies to help the business prepare the highly potential and suitable promotion products for each individual customer. The subsequent sections of this article are organized as follows. Section 2 discusses related research backgrounds including: the description of what customer satisfaction is, the value of detecting satisfaction level on the spot and then taking the needed service recovery actions in a timely manner, how a voice-enabled web system (VWS) supports v-commerce applications, the voice signal processing techniques and application examples for justifying their use in our project, and the concept of back propagation networks used to construct our satisfaction level assessment system (SLAS). Section 3 covers the research methodology by describing our voice-enabled pervasive approach, VWS system architecture, sample application, process flow, and the integrated SLAS and VWS system. Section 4 details our experiments and test results. Section 5 provides the discussions of managerial implications and concepts of customization and personalization, and Section 6 concludes this paper and suggests some topics for future research. 2. RESEARCH BACKGROUND 2.1 Customer Satisfaction Customer satisfaction is a cognitive state perceived by the customer while the customer assesses whether the reward, obtained after paying some sacrifice, is enough or not. Kotler [17] stated that customer satisfaction is the degree of happiness perceived by customers, and the degree of this feeling is generated after the customer compares the perceived performance with their anticipation on the products. Ostrom and Iacobucci [18] argued that the customer satisfaction is the integrated judgment on the product/service that is offered by enterprises after the customer compares the quality and benefit he/she gets with the cost and effort he/she pays. It is believed that service quality positively affects customer satisfaction, which in turn influences not only a customer’s perception of a product/service but the customer’s attitude/willingness to re-patronize the vendors [19]. In general, customer satisfaction is the result generated after the customer compares his/her expectation to a certain service/product with the actual service/product performance offered by the providers. If the service/product performance “reaches” or “exceeds” the customer’s expectation, the customer will feel satisfied. 2.2 The Need of Timely Service Recovery When offering services to customers, enterprises may influence their customers in a positive or negative way. Negative influence, ranging from minor (e.g. a delay of product delivery) to serious (e.g. an incorrect balance on a bank account), can harm the enterprises because customers may turn to competitors after such negative experience [20]. According to Hart et al. [21], for enterprises the cost of recruiting a new customer is as much as 5 times higher than the cost of keeping current customer happy. If an enterprise can give their customers proper responses for dealing with service failure, its customer retention rate can be improved [22], [23]. Prior researches also found that maintaining customers’ satisfaction may benefit enterprises and service recovery can be used to keep customers satisfied [24], [25]. Different extent of service
4
Assessing customer satisfaction in v-commerce
recovery will affect customers’ attitudes and behaviors differently, and an effective service recovery will increase customers’ cognitive satisfaction, willingness of purchase, and positive word-of-mouth [26]. Jones and Sasser [22] suggested that when a service failure happens, the quicker the enterprises take action to compensate customers, the greater the chance the service recovery will work. Based on the aforementioned important findings, a satisfaction level assessment system (SLAS) was designed and implemented in our research to detect customer satisfaction in real time, and thus, make it possible for businesses to take actions for timely service recovery. 2.3 Voice-Enabled Web System A voice-enabled web system (VWS) is a system providing users a voice channel, such as telephone, to access web applications. With VWS, firms can provide desirable Internet services through both the conventional browser interface and the new voice interface. In addition to combining eXtensible Markup Language (XML) based mark-up languages, automatic speech recognition (ASR), text to speech (TTS), and web technologies, our voice-enabled web system uses the emerging standard markup language, VoiceXML, which defines a common format to allow people to access web content via any phone [27]. The VoiceXML uses XML tags to represent call flows and dialogs. The development of the VoiceXML standard by AT & T, IBM, Lucent Technologies and Motorola has led to a proliferation in recent years of VWS. By using this standard web-based language, data then can be easily exchanged in VWS. Voice-enabled web technology is being deployed in a broad range of industries such as banking and retailing. Other industries may also adopt it to develop suitable web system to serve their own business purposes. Internet portal companies including AOL, Yahoo, Tellme Networks, Hey Anita, and Internet Speech have been developing voice portals for providing several services. Recently, an emerging term called “v-commerce” has been used to describe the technology and its applications related to the users’ activities of navigating voice portals with voice commands [7]. V-commerce examples include the use of speech technology over the telephone in commercial applications such as buying cinema/airline tickets, banking, account transferring, stock trading, purchasing from mail-order companies, and others [28], [29]. 2.4 Voice Signal Processing Timbre refers to the content of the audio signal. Different timbre has different wave-shape of fundamental period and represents different audio content. In order to analyze it, domain transformation may be used in engineering applications to transform voice signals from time domain to frequency domain [30]. Fourier Transformation (FT) is used in many fields of science, such as image processing, bioinformatics, and signal processing [31], [32]. Discrete Fourier Transformation (DFT) [33] and Fast Fourier Transformation (FFT) [34] are the most common FT algorithms used in a wide range of applications. Using greatly reduced number of arithmetic operations as compared to DFT, FFT is commonly used in real-time applications [35], system reliability evaluation [36], and measurement systems [34]. Power Spectrum Density (PSD) is defined as the Periodogram which is the mean of the Fourier Amplitude of a long signal sample (N) and calculated by using FFT. PSD has been widely used in various applications. Li et al. [37] applied PSD to random vibration analysis of seismic responses of tall buildings. Destexhe and Rudolph [32] applied this technique to extract information from the Power Spectrum of voltage noise. Haruna et al. [30] used PSD to conduct the noise analysis for estimating corrosion rate of the steel. Kiymik et al. [38] utilized PSD to
Assessing customer satisfaction in v-commerce
5
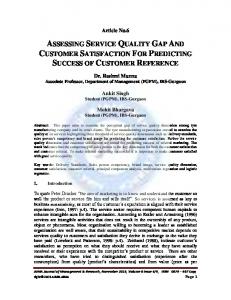
design a novel method for automatic recognition of alertness level. In our study, PSD is used for pre-processing the collected voice records and conducting spectrum analysis. 2.5 Back Propagation Networks Artificial neural network (ANN) models simulate the functions of nature’s neuron networks by connecting the artificial neurons [39]. ANN users do not need to write complicated programs for solving their problems, since ANN is able to learn by itself and generate the result only based on input data. ANNs have been widely used as a promising approach for various application areas such as: user identity verification [40], forecast of interest rate [41], forecast of inflation rate [42], segmentation of online customers [43], assessment of user’s product knowledge [16], etc. Back Propagation Network (BPN), one of the most well known and widely used ANN models, was used in our research. As shown in Figure 1, there are three layers in a BPN model: Input Layer, Hidden Layer, and Output Layer. Once the input information is entered into the Input Layer, Hidden Layer will start to compute and adjust the connection weights until the convergent results, as the outputs manifested in Output Layer, are obtained. The artificial neurons in Input Layer represent the variables without computing capability. The artificial neurons in Hidden Layer are hidden and responsible for processing the provided input data using transformation function. During training process, BPN keeps adjusting the connection weights based on the error between expected output and the actual value, and do not stop training until the network is convergent and becomes optimum. The basic mechanism in BPN is that the output values of all neurons will be multiplied by the corresponding weights to derive weighted values, which, will be summed up through the computing by using activation function, then generates the output signals. More details of BPN can be found in articles written by Werbos [44] and Roth [45].
Figure 1.
Back Propagation Networks.
In our research, speech conversations are recorded and processed through transformation process (namely, PSD). Then, the transformed voice data are used as BPN inputs and the corresponding satisfaction indexes are used as outputs to conduct BPN training and testing. Finally, the trained BPN computing system is integrated into our voice-enabled web system for proactively and non-intrusively detecting customer satisfaction level. 3. THE PROPOSED SYSTEM
6
Assessing customer satisfaction in v-commerce
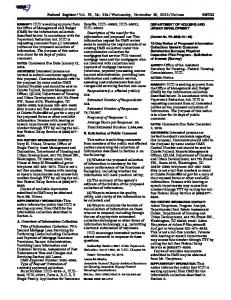
3.1 Voice-Enabled Pervasive Approach In our research, the proposed voice based SLAS was built and integrated into a VWS for assessing customers’ satisfaction levels in a v-commerce environment. VWS integrates multiple channels and provides users with multiple choices for accessing the information offered by Internet applications [27]. With VWS, firms can provide desirable voice-based Internet services, such as online customer service, on-line transaction service, and self-served service, through both the conventional browser interface and the new voice interface. Users could make the most suitable choice to meet their needs, to fit their preferences, or to overcome the environment constraints. Although mobile phones can access information offered by Internet applications using various technologies, the information typically in the textual form is difficult to create and consume using small mobile devices. Currently, the constraints of a typical mobile device, such as small screen size, slow speed, and inconvenient keyboard, make it cumbersome to access lengthy textual information [46]. However, voice interface does not have these limitations. Recent advances in speech recognition technology provide efficient voice capture and indexing mechanisms to make application systems with voice interfaces even more desirable. In addition, humans speak faster than they type, and they can perform voice authoring anytime, anywhere, through their favorite and familiar devices such as mobile phone. 3.2 VWS System Architecture A voice server is used as the platform that enables the creation of voice applications through industry standards, XML, VoiceXML, and Java. XML facilitates the concept of application integration and data sharing, and enables the exchange of self-describing information elements between computers. Our VWS combines XML based mark-up languages, automatic speech recognition (ASR), text to speech (TTS), and Web technologies. We use the emerging standard markup language, VoiceXML, which defines a common format to allow people to access Web content via any phone [27]. By using this standard web-based language, data can be easily exchanged in voice-enabled web systems.
Figure 2.
The system architecture of the voice-enabled Web system.
The system architecture of our VWS is illustrated in Figure 2. When a user places a call to a designated phone number, a computer on the voice site (i.e. the voice server) answers the call and retrieves the initial VoiceXML script from a VoiceXML content server, which can be a
Assessing customer satisfaction in v-commerce
7
Web server located anywhere on the Web. An interpreter on the voice site parses and executes the script by playing prompts, capturing responses, and passing the responses to a speech recognition engine on the voice system. Just as a Web browser renders HyperText Markup Language (HTML) documents visually, a VoiceXML interpreter on the voice site renders VoiceXML documents audibly and allows telephone users to access services that are typically available to Web users. Once the voice system gets all the necessary information from the caller, the interpreter translates them into a request to the VoiceXML content server, i.e. the web server. When the web server receives the request, it returns a VoiceXML page with either a canned response or dynamically generated VoiceXML scripts, containing the information requested by the caller. Responses are passed from the Web server to the voice site via HyperText Transfer Protocol (HTTP). Finally, the text to speech (TTS) engine, which is a key component of the voice server, converts VoiceXML scripts into speech and delivers the voice responses to the user via telephone channel. The process can continue, simulating a natural language conversation between the caller and the voice server. In VWS, XML based data will be created and transformed into two different types of information. The first type includes the information in various data formats supported by HTTP (Hypertext Transfer Protocol) servers, such as texts, pictures, audios, and etc. The other information type is in the form of VoiceXML speech. The voice server is set up between the phone and the web server to interpret the VoiceXML documents and act as a middleware processor. The VoiceXML interpreter, as a key component in the voice server, contains the voice recognition and the synthesis engines used to automate the conversation between the site and the caller. Any web site can be a VoiceXML content server. Services provided by this system can give subscribers access to contents offered by different sources of Internet applications and services through Public Switched Telephone Network (PSTN) telephones, wired or wireless. 3.3 Sample Application We illustrate how the proposed system with an application in B2C business of selling consumer products such as homemade cookies, cakes, snacks, etc. Other than the necessary components of a voice-enabled website supporting both the browser interface and the voice channel, a BPN based satisfaction level assessment system (SLAS) for detecting users’ satisfaction levels is a core component for facilitating the task of dynamic customization in v-commerce environment. Users were invited to interact with the sample application by using their own mobile phones. All users were treated equally in our experiments. For example, we did not intentionally offend any of them to induce dissatisfaction. In addition, we didn’t control users’ ex ante emotions, because the purpose of our experiments was assessing customer satisfaction instead of controlling it. After experiencing the sample application (i.e., interacting with VWS site, completing the orders, and providing opinions to VWS), users were asked to record their satisfaction levels. A collection of recorded voice files together with their corresponding satisfaction levels is used to train the BPN model of SLAS, which is integrated into VWS for automatically detecting the satisfaction level of VWS users. For the purpose of lowering down participants’ environmental noise while recording needed voice files to build our BPN model of SLAS, the whole process was mainly conducted in our EC lab. For those participants who could not come to our EC lab in person, they were instructed to access our sample application from a ‘workable’ place with a reasonable and acceptable noise level. One important design philosophy for the sample application is in its voice interface design. To collect more useful speech voice datasets for reflecting customers’ in-depth feeling
8
Assessing customer satisfaction in v-commerce
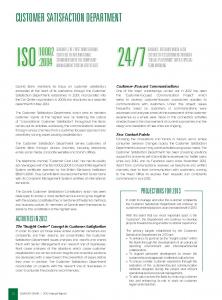
about their satisfaction level, the voice interface of the sample application was designed to incorporate an open-ended question for collecting relatively more verbose voice datasets. Such verbose information (in the form of opinions and/or comments) was considered relatively more useful than simple voice commands (in the form of simple words) for achieving the design goal of the sample application – supporting and facilitating our preliminary SLAS experiments in detecting customer satisfaction via his/her speech voice. 3.4 Process Flow Figure 3 shows the process flow of the integrated SLAS and VWS system for achieving the goal of satisfaction based dynamic customization. Via voice user interface, the customer interacts with the system by speaking out his/her choice, and the system can identify this customer’s choice directly. During the voice interactions, SLAS records the customer’s voice, conducts voice-frequency transformation, and uses the transformed data as the BPN input to evaluate the customer’s satisfaction level. Due to the innovative and exploratory nature of our research, an important decision we made was to reduce the potential complexity in the design and implementation of SLAS. For the purpose of simplifying the process flow and the complexity of our initial implementation of the integrated SLAS and VWS system, SLAS was configured to classify this customer into either satisfied or unsatisfied group after detecting the customer’s satisfaction level. As a matter of fact, SLAS may be implemented in our future research to classify customers into multiple satisfaction levels (for example - a five-level output ranging from very satisfied, satisfied, neutral, unsatisfied, to very unsatisfied). Based on the satisfaction level detected by SLAS, VWS may adopt proper actions for the purpose of timely service recovery based on a specific EC strategy. Begin The user enters the VWS website SLAS records the user’s voice and conducts voice-frequency transformation SLAS assesses the user’s satisfaction level by using the pre-trained BPN model VMS takes proper actions for timely service recovery End
Figure 3.
Process flow of the integrated SLAS and VWS system.
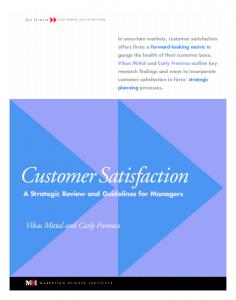
3.5 The Integrated SLAS and VWS System Figure 4 shows how the integrated SLAS and VWS system works. The customer interacts with the system via voice, the system records the customer’s voice and sends it to another back-end
Assessing customer satisfaction in v-commerce
9
server, the voice is stored in a voice record database, the voice-frequency transformation is invoked to transform the recorded voice into frequency domain, and the transformed voice file is used as BPN input for the task of evaluating satisfaction levels. Once the evaluation task is completed, the output value (i.e. the detected customer satisfaction level) is sent to VWS, which will then give the customer a timely feedback based on the company’s EC strategy.
Figure 4.
Architecture of the integrated SLAS and VWS system.
4. EXPERIMENT 4.1 Voice Data Collection and Transformation As mentioned earlier, users were invited to interact with the VWS based sample application hosted in our EC technology lab by using web browsers and their own mobile phones. After experiencing with the sample application specifically through the voice channel (i.e. by using their mobile phones), the users were asked to record their satisfaction levels. A collection of recorded voice files together with their corresponding satisfaction levels is used to train the BPN model of SLAS. We collected 250 representative voice records, with the 22K Hz (22,050 cycles per second) sampling rate, retrieved from participants’ conversations while they were interacting with the sample application via voice channel. Among those voice records, 125 were from male participants and the other 125 were from female. As for the age distributions, 30%, 40%, and 30% of the 250 voice files were recorded from participants in the age ranges of 21-30, 31-40, and 41-50 respectively. All participants in this research are Taiwanese. Each voice record was tagged with an index indicating a corresponding satisfaction level, entered by a participant, ranging from 1 (very unhappy), 2 (unhappy), 3 (neutral), 4 (happy), to 5 (very happy). As mentioned earlier, it is important to reduce the complexity of SLAS in the preliminary stage of our research, so we decided to exclude the neutral state and focused on the dichotomous assessment. Therefore, there was no ‘neutral’ voice records used in our experiments. In addition, more ‘very happy’ or ‘very unhappy’ records than ‘happy’ or ‘unhappy’ records were collected simply because more ‘very happy’ or ‘very unhappy’ records were available to us. Actually, in
10
Assessing customer satisfaction in v-commerce
the experiments, the proportions of voice records for various satisfaction levels of ‘very happy’, ‘very unhappy’, ‘happy’, ‘unhappy’, and ‘neutral’ were 35%, 35%, 15%, 15%, and 0%, respectively. All voice records were saved as WAV files (see Figure 5), and then transformed into frequency spectrum (see Figure 6).
Figure 5.
The WAV file derived from a voice record.
Figure 6.
PSD transformation.
For spectrum analysis, Fast Fourier Transformation (FFT) was adopted and Power Spectrum Density (PSD) was carried out to pre-process all voice records. Figure 6 demonstrates
Assessing customer satisfaction in v-commerce
11
the PSD transformation on the WAV file indicated in Figure 5. The transformed voice records, which were in the form of ‘power’ in frequency domain, were saved and randomly selected as the input used in the subsequent BPN training and testing. It is worth mentioning that the result derived from PSD transformation has been used in various neural network application researches [38]. 4.2 BPN Training The concept of N-fold cross-validation, which partitions a sample of data into N sub-samples such that one sub-sample is retained as testing data and the other N-1 sub-sample(s) are used as training data, is often adopted in prior BPN research. It is also noted that popular N-fold cross-validation approaches ranged from 2-fold cross validation (where 50% of the data is used as testing data) [47] to 10-fold cross validation (where 10% of the data is used as testing data) [48]. In our research, we decided to use an average approach of these two special cases, i.e., retaining 30% (the average value of 10% and 50%) for testing and the remaining 70% for training. After collecting and transforming the voice records, we then carried out 3 experiments (Experiment I, Experiment II, and Experiment III). While Experiment I was conducted with 125 voice files of male participants for training the BPN and subsequently testing the trained BPN, Experiment II was conducted with 125 voice records of female, and Experiment III was conducted on the entire 250 records from both male and female. In both Experiment I and Experiment II, 88 voice records and their corresponding satisfaction indexes were randomly selected and used, as BPN input and output respectively, for training the BPN, and the other 37 voice records were for testing the trained BPN. Similarly, in Experiment III, 175 voice records of the entire dataset were randomly selected and used for training BPN, and the other 75 voice records were for testing the trained BPN. In each training process, after voice records were selected and used as inputs to the BPN shown in Figure 4, the acceptable output error was set to 0.01 and the maximum number of training iterations was configured at 2500. In addition, various algorithms available in MATLAB 7.0 were adopted and ported into our SLAS, and these algorithms include: • PSD Transformation Algorithm: the “psd.m” algorithm • Window Algorithm: the Hann (Hanning) algorithm • BPN Training Tool: the “newff” algorithm, and the following functions: à the “tansig” transfer function for 1 Hidden Layer with 5 Nodes à the “purelin” transfer function for 1 Output Layer with 1 Node à the “trainlm” training function using Levenberg-Marquardt algorithm à the “learngdm” learning function By applying various training datasets to the training process, we derived several BPN models with various BPN weight-distributions and patterns that would be evaluated in the subsequent BPN testing process described in next section. 4.3 BPN Testing and Test Results For the purpose of finding the optimum weight-distribution and pattern of BPN, we repeated the BPN testing process in each experiment with randomly selected datasets, and each test was executed until it reached a satisfactory termination requirement, i.e., the error was under 0.01 or the iteration count of training process exceeded 2500. Altogether, we conducted 30 tests (10 tests for each experiment) and calculated the average accuracy rate for each experiment. The test
12
Assessing customer satisfaction in v-commerce
results are shown in Table 1. As an illustrating example, in ‘Test No.1’ of ‘Experiment I’ specifically, 88 voice records were randomly selected and used to train the BPN, and then the remaining 37 voice records were used to test the trained BPN. For this test, 28 out of the 37 detection results made by the trained BPN were correct, matching the recorded satisfaction indices. Therefore, the accuracy rate of ‘Test No.1’ in ‘Experiment I’ was 76 %, the value of dividing 28 by 37. Among the 10 tests in each experiment, the trained BPN with the best performance (i.e., the highest accuracy rate) was recorded and its corresponding weight-distribution and pattern was saved, so that the most accurate BPN identified in each experiment could be applied to SLAS for the purpose of assessing customer satisfaction in a v-commerce environment, timely and non-intrusively. Table 1 The Test Results Test No. 1 2 3 4 5 6 7 8 9 10 Average
The Number of Correct Detections in Each Test Exp. I Exp. II Exp. III 28 28 60 31 29 61 29 26 58 29 29 59 28 30 58 31 29 61 30 32 61 29 33 60 33 28 59 31 32 59 29.9 29.6 59.6
Exp. I 28/37=76% 31/37=84% 29/37=78% 29/37=78% 28/37=76% 31/37=84% 30/37=81% 29/37=78% 33/37=89% 31/37=84% 80.81%
Accuracy (%) Exp. II 28/37=76% 29/37=78% 26/37=70% 29/37=78% 30/37=81% 29/37=78% 32/37=86% 33/37=89% 28/37=76% 32/37=86% 80.00%
Exp. III 60/75=80% 61/75=81% 58/75=77% 59/75=79% 58/75=77% 61/75=81% 61/75=81% 60/75=80% 59/75=79% 59/75=79% 79.47%
4.4 Performance Comparison: SLAS vs. Live Persons The preliminary experiment results (see Table 1) of our study showed that SLAS achieved an accuracy rate at about 80% for assessing customers’ satisfaction in v-commerce environment. The proposed method together with the SLAS system provides an innovative approach for detecting customer satisfaction in v-commerce environment [49]. Actually, through a thorough literature survey and patent search, we were not able to find out other similar systems for a comparative study. Therefore, it is perhaps appropriate and valuable to conduct an extended experiment for comparing the performance between SLAS and live persons. An extended experiment was carried out in our research by inviting 20 new participants (ten males and ten females, with an overall average age of 24.15) to listen to 12 voice records, which were randomly selected from the 250 representative voice records used in Experiment III, and then assess the corresponding satisfaction levels of the voice records. As shown in Table 2, the average accuracy rate achieved by 20 live persons is 62.5%, and the average accuracy rate of SLAS (which uses the most accurate BPN identified and saved in Experiment III to evaluate the same 12 voice records listened by live persons) is 83%.
Assessing customer satisfaction in v-commerce
13
Table 2 The Results of Extended Experiment (Performance Comparison)
SLAS
Live Person
Test The Number of Successful Accuracy Participant The Number of Successful Accuracy No. Detections in Each Test (%) No. Detections in Each Test (%) 1 11 11/12=92% 1 9 9/12=75% 2 9 9/12=75% 2 8 8/12=67% 3 11 11/12=92% 3 9 9/12=75% 4 10 10/12=83% 4 9 9/12=75% 5 11 11/12=92% 5 7 7/12=58% 6 9 9/12=75% 6 8 8/12=67% 7 10 10/12=83% 7 5 5/12=42% 8 10 10/12=83% 8 8 8/12=67% 9 9 9/12=75% 9 7 7/12=58% 10 10 10/12=83% 10 9 9/12=75% 11 10 10/12=83% 11 6 6/12=50% 12 11 11/12=92% 12 5 5/12=42% 13 9 9/12=75% 13 8 8/12=67% 14 10 10/12=83% 14 8 8/12=67% 15 9 9/12=75% 15 9 9/12=75% 16 10 10/12=83% 16 7 7/12=58% 17 11 11/12=92% 17 6 6/12=50% 18 9 9/12=75% 18 9 9/12=75% 19 11 11/12=92% 19 5 5/12=42% 20 10 10/12=83% 20 8 8/12=67% Average accuracy rate = 83% Average accuracy rate = 62.5%
5. DISCUSSION 5.1 Managerial Implications and Applications While v-commerce continues to affect more and more people in the world, there will be inevitably plenty of opportunities and revolutionary benefits for everyone who participates. The future of v-commerce will be supplemented by applications used by a wider variety of users and by more horizontal applications. Eventually the access to the conventional desktop and Internet applications through voice channel will become very attractive. Our project researched on both theoretical concepts of the technologies and practical applications of the concepts, by proposing a new voice enabled web application architecture (see Figure 2) that enables one single application simultaneously interfacing with browser interface and voice interface. This architecture singularizes the business and application logic while supporting multiple interfaces via various devices such as desktop PC, landline phone, wireless phone, and pocket PC. Since common business and application logic is centralized, the maintenance and enhancement become easier. To serve as a “proof of concept” example of the new EC application paradigm, a voice-enabled web system, VWS, was designed and implemented based on the proposed architecture.
14
Assessing customer satisfaction in v-commerce
The objective of customer relationship management is to leverage and exploit interactions with the customer to maximize customer satisfaction, ensure business return, and ultimately enhance customer profitability [50], [51]. For the forefront attendants, sales representatives, marketing campaigns, and customer relationship management activities, the information about customer’s satisfaction is valuable, especially if the satisfaction level can be detected in a direct, proactive, real-time and non-intrusive way via the customer’s voice. The detected customer satisfaction level can be used as a criterion for customer segmentation which enabled the company to provide more customized and, therefore, more attractive product and service offerings to various customer groups. With a better understanding of the users’ expectations and needs, enterprises could make necessary changes early in the new product development process and improve the product development performance. A company’s user interaction management and user knowledge management are essential to its core competence. With the proposed method and system, enterprises will be able to re-consider the importance of their customer’s “voice” for the overall strategy of their electronic commerce design and implementation. For example, they can use the detected customer satisfaction level as a customer segmentation criterion to decide whether a customer should be included in their marketing target or not. For those relatively less satisfied customers, enterprises may give customers proper feedbacks or timely service recovery in order to enhance the relationships between customers and enterprises. Enterprises will be able to re-shape or modify their business strategies for expected benefits by adopting the proposed method. Indeed, the proposed system can be applied to many business sectors and various application domains for effectively promoting their products and improving their services by proactively and non-intrusively detecting customer satisfaction. 5.2 Customization or Personalization? Customization and personalization share the same spirit (i.e. the customer-centric concept) but they have different interpretations in terms of business applications. Customization pays more attention on segmenting and classifying customers based on some criteria in common while personalization focuses more on offering personalized products or services to individual customer. A lower degree of customization is characterized by a non-varying standardized process while a higher degree of customization is where product/service processes can be adapted to meet the needs of individual customers, namely, personalization [15]. The SLAS we present here is a method of segmentation and classification in the field of customization. However, if this approach (SLAS) is extended and incorporated into our integrated knowledge level assessment system (KLAS) and personalized promotion decision support system (PPDSS) [16], which used data mining techniques in accordance with marketing strategies to help the business prepare the highly potential and suitable promotion products for each individual customer, the SLAS then will be viewed as a part of entire personalization process. For example, the integrated PPDSS can store a customer’s satisfaction level (detected by SLAS) of a particular customer and use it as an important factor to decide which marketing strategy (i.e. the bundle of products, services, and promotions) is suitable in certain scenario. 6. CONCLUSION AND FUTURE RESEARCH Prior studies found that emotion can be inferred/extracted based on certain features of speech [52], and emotion also influences satisfaction [53], [54]. From an integrated viewpoint, our research finding is consistent with the findings from these studies suggesting that satisfaction is
Assessing customer satisfaction in v-commerce
15
associated with emotion and emotion is associated with speech, respectively. As a matter of fact, our research contributes to propose the relationship between speech and satisfaction, empirically tests such relationship, and suggests the potential values of applying the concept of detecting satisfaction from speech in various business contexts. In this research, based on the business application concepts about customer satisfaction and timely service recovery derived from literature review, we proposed and developed a voice-enabled web system integrated with a non-intrusive method to evaluate customer satisfaction. SLAS can either be integrated with a voice-enabled web system or work alone (such as in the form of Interactive Voice Response applications) to evaluate the customer satisfaction dynamically and directly via voice without understanding the meaning of his/her words, i.e. this method is semantics-independent. The preliminary experiment results showed that a reasonable accuracy rate was achieved by the proposed satisfaction level assessment system, SLAS. In our extended experiment (see Section 4.4), we found that SLAS performed better than live persons in terms of detecting customer satisfaction via speech voice. The proposed method could be adopted by businesses to either replace or complement manpower for detecting customer satisfaction. Most researches evaluate the customer satisfaction level by asking customers to fill out satisfaction questionnaires, but fewer and fewer people would like to truly answer questionnaires. Hence, the proposed SLAS may indeed become a feasible alternative for evaluating customer satisfaction. Furthermore, the satisfaction level evaluation method used by our system is non-intrusive, i.e. it is not necessary to ask users to fill out any questionnaire, so it can be applied to all users interacting with voice applications such as VWS applications. The proposed method and system can detect customer satisfaction on the spot, i.e. it detects customer satisfaction in real-time. Once we obtain the customer satisfaction level in a real-time v-commerce environment, timely feedbacks can be given to those relatively unhappy or unsatisfied customers for achieving the goal of timely service recovery. While the proposed method can be integrated with a voice-enabled web system (VWS) for automatically and non-intrusively evaluating customer satisfaction, how to fully utilize this information to increase the customer loyalty and re-purchase rate is an interesting topic deserving further investigations. Since this study is the first known research for detecting satisfaction level directly from the customer’s speech voice, empirical studies for a more comprehensive understanding of the proposed method and the integrated VWS application is highly desirable. Although it is quite possible that the proposed SLAS (as well as its corresponding method) can be generalized/applied to other cultures (or countries), a BPN trained by using the voice datasets recorded from people with different cultures (or countries) may have their unique voice characteristics and patterns implicitly stored in the trained BPN. Thus, our SLAS adopting a BPN trained with speech voice datasets collected in Taiwan may become not applicable to people in other countries/cultures without conducting similar studies in those countries/cultures. Indeed, it would be particularly interesting and valuable to conduct comparative studies by collecting voice datasets from people with different cultures and/or different native languages and then searching for the optimal BPN (or at least a reasonably good BPN) specific to each particular country/culture. This research designed and probed a novel method and its corresponding system for the evaluation of customer satisfaction in a preliminary way, which might result in some unavoidable limitations. Since we tried to adapt field method to real-life environment for generalization of the research, many variables which we could not control exist, such as the
16
Assessing customer satisfaction in v-commerce
surrounding noise which would influence the perceived quality of speech. The recognition rate of the system is beyond our research scope. Based on the experience and impression from accessing the sample application via the voice channel, most respondents went ahead to answer the questionnaire. The reason is this: if the system could not recognize a respondent’s speech very well, he/she would be frustrated and stop the conversation with VWS. There is another important limitation about sample selection in the experiments. Although the voice records used in our experiments were selected by discussing with linguistic/psychology experts, more comprehensive experiments designed to incorporate key demographic variations/variables are desirable and such experiments should also be conducted to achieve their statistical significance for generalizing the experiment results to various voice-based business applications. Another interesting topic of future research is to find out the effectiveness of timely and proper feedbacks by using the integrated VWS (PPDSS + KLAS + SLAS) for the objectives of increasing customer satisfaction and conceiving suitable marketing strategy. In terms of the accuracy of the proposed method in forecasting customer satisfaction, it is highly interesting to compare different ANN models with various design factors which include the selection of input variables, preparing data, and network architecture. Indeed, the results derived from this research are expected to seed more follow-up researches and practical applications. ACKNOWLEDGEMENT The editor and anonymous reviewers are highly appreciated for their invaluable comments and suggestions. This research was supported by a grant from the National Science Council, Taiwan, under contract numbers NSC-96-2221-E-005-088-MY2. REFERENCES [1] M. J. O’Grady and G. M. P. O’Hare, “Mobile devices and intelligent agents - towards a new generation of applications and services,” Information Sciences, vol. 171, pp. 335-353, 2005. [2] G. Roussos, A. J. Marsh and S. Maglavera, “Enabling pervasive computing with smart phones,” IEEE Pervasive Computing, vol. 4, no. 2, pp. 20-27, 2005. [3] Directorate General of Telecommunicate, Analysis of Mobile Phone Subscribers in 2003, 2003. Available at http://www.dgt.gov.tw/. [4] Institute for Information Industry, ACI-FIND, Focus on Internet News and Data, 2004. Available at http://www.find.org.tw/. [5] A. Tan, “Voice to dominate 3G traffic, says expert,” ZDFNetAsia, May 2005, available at http://www.zdnetasia.com/news/communications/0,39044192,39231956,00.htm [6] The Kelsey Group, “The global voice ecosystem,” Analyst Report, The Kelsey Group, March 2001. [7] H. Galanxhi-Janaqi and F. F.-H. Nah, “U-commerce: emerging trends and research issues,” Industrial Management & Data Systems, vol. 104, no. 9, pp. 744-755, 2004. [8] J. Wind and A. Rangaswamy, “Customization: The next revolution in mass communication,” Journal of Interactive Marketing, vol. 15, no. 1, pp. 13–32, 2001. [9] J. H. Lee and S. C. Park, “Intelligent profitable customers segmentation system based on business intelligence,” Expert Systems with Applications, vol. 29, no. 1, pp. 145-152, 2005.
Assessing customer satisfaction in v-commerce
17
[10] G. D. Silveira, D. Borenstein, and F. S. Fogliatto, “Mass customization: Literature review [11] [12] [13] [14] [15] [16] [17] [18] [19] [20] [21] [22] [23] [24] [25] [26] [27]
and research directions,” International Journal of Production Economics, vol. 72, no. 1, pp. 1–13, 2001. B. J. Jaworski and A. K. Kohli, “Market orientation: Antecedents and consequences,” Journal of Marketing, vol. 57, no. 3, pp. 53–70, 1993. R. Aron, A. Sundararajan, and S. Viswanathan, “Intelligent agents in electronic markets for information goods: customization, preference revelation and pricing,” Decision Support Systems, vol. 41, no. 4, pp. 764-786, 2006. Y.-K. Juan, S.-G. Shih, and Y.-H. Perng, “Decision support for housing customization: A hybrid approach using case-based reasoning and genetic algorithm,” Expert Systems with Applications, vol. 31, no. 1, pp. 83-93, 2006. R. M. Lee, “Automated generation of electronic procedures: procedure constraint grammars,” Decision Support Systems, vol. 33, no. 3, pp. 291-308, 2002. S.-E. Cho, “Factors affecting customer needs of geographical accessibility in electronic commerce,” Electronic Commerce Research and Applications, vol. 5, no. 2, pp. 131-139, 2006. S. E. Chang, S. W. Changchien, and R.-H. Huang, “Assessing users’ product-specific knowledge for personalization in electronic commerce,” Expert Systems with Applications, vol. 30, no. 4, pp. 682-693, 2006. P. Kotler (1999), Marketing management: analysis, planning, implementation and control, 9th edition. New Jersey: Prentice-Hall, 1999. A. Ostrom and D. Iacobucci, “Consumer trade-offs and the evaluation of services,” Journal of Marketing, vol. 59, no. 1, pp. 17-28, 1995. R. McMullan and A. Gilmore, “The conceptual development of customer loyalty measurement: a proposed scale,” Journal of Targeting, Measurement and Analysis for Marketing, vol. 11, no. 3, pp. 230-243, 2003. V. S. Folkes and B. Kotsos, “Buyers’ and sellers’ explanations for product failure: who done it?” Journal of Marketing, vol. 50, no. 2, pp. 74– 80, 1986. C. W. L. Hart, J. L. Heskett, and W. E. Sasser Jr., “The profitable art of service recovery,” Harvard Business Review, vol. 68, no. 4, pp. 148-156, 1990. T. O. Jones and W. E. Sasser Jr., “Why satisfied customers defect?” Harvard Business Review, vol. 73, no. 6, pp. 88-99, 1995. C. Webster and D. S. Sundaram, “Service consumption criticality in failure recovery,” Journal of Business Research, vol. 41, no. 2, pp. 153-159, 1998. S. S. Tax and S. W. Brown, “Recovering and learning from service failure,” Sloan Management Review, vol. 40, no. 1, pp. 75-88, 1998. T. A. Fisk, C. J. Brown, K. G. Cannizzaro, and B. Naftal, “Creating patient satisfaction and loyalty,” Journal of Health Care Marketing, vol. 10, no. 2, pp. 5-15, 1990. J. G. Maxham III, “Service recovery’s influence on consumer satisfaction, positive word-of-mouth, and purchase intentions,” Journal of Business Research, vol. 54, no. 1, pp. 11-24, 2001. S. E. Chang, and B. Minkin, "The implementation of a secure and pervasive multimodal Web system architecture," Information and Software Technology, vol. 48, no. 6, pp. 424-432, 2006.
18
Assessing customer satisfaction in v-commerce
[28] S. Goose, M. Newman, C. Schmidt, and L. Hue, “Enhancing Web accessibility via the [29] [30] [31] [32] [33] [34] [35] [36] [37] [38] [39] [40] [41] [42] [43] [44] [45] [46]
Vox portal and a Web-hosted dynamic HTML VoxML converter,” Computer Networks, vol. 33, No. 1-6, pp. 583-592, 2000. Y. Yamazaki, H. Iwamida, and K. Watanabe, “Technologies for voice portal platform,” Fujitsu Scientific and Technical Journal, vol. 40, no. 1, pp. 179-186, 2004. T. Haruna, Y. Morikawa, S. Fujimoto, and T. Shibata, “Electrochemical noise analysis for estimation of corrosion rate of carbon steel in bicarbonate solution,” Corrosion Science, vol. 45, no. 9, pp. 2093-2104, 2003. Q. Li, N. Wang, B. Shi, and C. Zheng, “Extendible look-up table of twiddle factors and radix-8 based fast Fourier transform,” Signal Processing, vol. 82, no. 4, pp. 643-648, 2002. A. Destexhe and M. Rudolph, “Extracting information from the power spectrum of voltage noise,” Neurocomputing, vol. 65-66, pp. 901-906, 2005. P. Kraniauskas, Transforms in signal and systems. Addison-Wesley Pub., 1992. P. Duhamel and M. Vetterli, “Fast Fourier transforms: a tutorial review and a state of the art,” Signal Processing, vol. 19, no. 4, pp. 259-299, 1990. A. E. Mahdi, “Generalised intermediate transforms: methods of computation and potential applications,” Signal Processing, vol. 83, no. 1, pp. 135-149, 2003. C. Singh and N. V. Gubbala, “Comparison of unit addition and fast Fourier transform methods for generation system reliability evaluation,” International Journal of Electrical Power & Energy Systems, vol. 18, no. 4, pp. 203-205, 1996. Q. S. Li, Y. H. Zhang, J. R. Wu, and J. H. Lin, “Seismic random vibration analysis of tall buildings,” Engineering Structures, vol. 26, no. 12, pp. 1767-1778, 2004. M. K. Kiymik, M. Akin, and A. Subasi, “Automatic recognition of alertness level by using wavelet transform and artificial neural network,” Journal of Neuroscience Methods, vol. 139, no. 2, pp. 231-240, 2004. M. T. Hagan, H. B. Demuth, and M. H. Beale, Neural network design. PWS Publishing, 1995. S. Cho, C. Han, D. H. Han, and H.-I. Kim, “Web-based keystroke dynamics identity verification using neural network,” Journal of Organizational Computing and Electronic Commerce, vol. 10, no. 4, pp. 295-307, 2000. S. H. Kim, “An architecture for advanced services in cyberspace through data mining: a framework with case studies in finance and engineering,” Journal of Organizational Computing and Electronic Commerce, vol. 10, no. 4, pp. 257-270, 2000. M. Aiken, “Using a neural network to forecast inflation,” Industrial Management & Data Systems, vol. 99, no. 7, pp. 296-301, 1999. K.-W. Wen and K.-F. Peng, “Market segmentation via structured click stream analysis,” Industrial Management & Data Systems, vol. 102, no. 9, pp. 493-502, 2002. P. J. Werbos, “Generalization of backpropagation with application to a recurrent gas market model,” Neural Networks, vol. 1, pp. 339-356, 1988. M. W. Roth, “Survey of neural-network technology for automatic target recognition,” IEEE Transaction on Neural Networks, vol. 1, no. 1, pp. 28-43, 1990. N. Anerousis and E. Panagos, “Making voice knowledge pervasive,” IEEE Pervasive Computing, vol. 1, no. 2, pp. 42-48, 2002.
Assessing customer satisfaction in v-commerce
19
[47] X. Wang, S. Li, H. Liu, M. Wood, W. R. Chen, and B. Zheng, “Automated identification [48] [49] [50] [51] [52] [53] [54]
of analyzable metaphase chromosomes depicted on microscopic digital images,” Journal of Biomedical Informatics, In Press. W. Wang and J. Paliwal, “Generalisation performance of artificial neural networks for near infrared spectral analysis,” Biosystems Engineering, vol. 94, no. 1, pp. 7-18, 2006. S. E. Chang and Y.-T. Jang, “A method and its system for detecting perceived performance and the extent of the performance,” R.O.C (Taiwan) Patent No. I268478, Taiwan Intellectual Property Office, December 11, 2006. O. Port, “Customers move into the driver’s seat - Personalized products become viable with the Net,” BusinessWeek, October 4, 1999. T. H. Roh, C. K. Ahn, and I. Han, “The priority factor model for customer relationship management system success,” Expert Systems with Applications, vol. 28, no. 4, pp. 641-654, 2005. I. R. Murray, and J. L. Arnott, "Toward the simulation of emotion in synthetic speech: A review of the literature on human vocal emotion," The Journal of the Acoustical Society of America, vol. 93, no. 2, pp. 1097-1108, 1993. V. Liljander and T. Strandvik, “Emotions in service satisfaction,” International Journal of Service Industry Management, vol. 8, no. 2, pp. 148 – 169, 1997 K. A. Machleit and S. P. Mantel, “Emotional response and shopping satisfaction Moderating effects of shopper attributions,” Journal of Business Research, vol. 54, no. 2, pp. 97-106, 2001.