REVIEW ARTICLE PUBLISHED ONLINE: 25 FEBRUARY 2015 | DOI: 10.1038/NCLIMATE2448
Assessing species vulnerability to climate change Michela Pacifici et al.† The effects of climate change on biodiversity are increasingly well documented, and many methods have been developed to assess species’ vulnerability to climatic changes, both ongoing and projected in the coming decades. To minimize global biodiversity losses, conservationists need to identify those species that are likely to be most vulnerable to the impacts of climate change. In this Review, we summarize different currencies used for assessing species’ climate change vulnerability. We describe three main approaches used to derive these currencies (correlative, mechanistic and trait-based), and their associated data requirements, spatial and temporal scales of application and modelling methods. We identify strengths and weaknesses of the approaches and highlight the sources of uncertainty inherent in each method that limit projection reliability. Finally, we provide guidance for conservation practitioners in selecting the most appropriate approach(es) for their planning needs and highlight priority areas for further assessments.
T
he Earth has warmed by about 0.74 °C in the last 100 years, and global mean temperatures are projected to increase further by 4.3 ± 0.7 °C by 21001. Agricultural expansion, overexploitation and introduction of invasive alien species have been the main drivers of biodiversity loss in the recent past, but several lines of research suggest that climate change could become a prominent, if not leading, cause of extinction over the coming century 2, both via direct impacts on species and through synergies with other extinction drivers1,3. Species have already responded to recent climatic shifts4–8, and various attempts have been made to assess the potential risks to biodiversity posed by climate change over coming decades9–11. To assess the threats to a species posed by climate change one must have information regarding its vulnerability, which is defined by the IPCC as ‘the predisposition to be adversely affected’12. Although there is currently no broad consensus in the scientific literature regarding the definition of ‘species’ vulnerability’, it is generally accepted that this is a function of both intrinsic and extrinsic factors13, and assessments often consider exposure, sensitivity and adaptability in combination13,14. Exposure is the magnitude of climatic variation in the areas occupied by the species15. Sensitivity, which is determined by traits that are intrinsic to species, is the ability to tolerate climatic variations, while adaptability is the inherent capacity of species to adjust to those changes14,15. Attempts at projecting the effects of climate change on species have used both different currencies (that is, the range of measures used to assess species’ climate change vulnerability) and divergent approaches for identifying the most vulnerable taxa. Because of this lack of consensus by the conservation community, a formal comparative evaluation is necessary to guide sensible choices of the most appropriate technique(s) for assessing species’ vulnerability. Here we provide the first comprehensive review of currencies and approaches that have been used to assess species’ vulnerability to climate change, based on a total of 97 studies published between 1996 and 2014 (with >70% of the studies published during the past five years). We describe the four dominant currencies of species’ climate change vulnerability assessments and provide examples of how these have been applied. Three broad categories of approaches plus three combinations thereof were identified, and we describe each, examining how they address uncertainties,
and discuss their key limitations. Finally, we provide guidance for practitioners. Through these analyses, we aim to help conservationists select appropriate approaches for assessing species’ vulnerability, such that climate change adaptation responses are as solidly based as possible.
Taxonomic and regional application of assessments
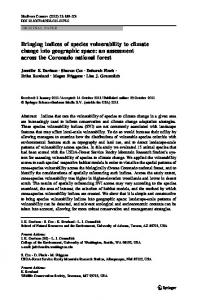
We conducted a systematic literature search using ISI Web of Knowledge. Keywords were selected to identify studies on climate change (climate change*, global warming*, sea-level rise*, elevated CO2*, drought*, cyclones*, CO2 concentration*) impacts (population reduction*, range changes*, range shift*, turnover*, extinction risk*, extinction probability*) that led to vulnerability assessments (vulnerability*, sensitivity*, adaptability*, exposure*) based on different types of approaches (mechanistic*, SDM*, correlative*, trait-based*, criteria*, niche models*). We then selected the most representative papers (in terms of both spatial and temporal scales, and taxa). Studies differed widely in taxonomic coverage, birds being the most frequently considered taxon, followed by mammals and plants, while non-insect invertebrates were seldom assessed (Fig. 1). Additionally, spatial scales of application and authors’ interpretations of the concept of vulnerability varied extensively. More than 60% of the studies were developed at local scale, while only 4% of the papers assessed species’ vulnerability globally (Fig. 1). As a result, numerous species have been assessed in only part of their range and their estimates of vulnerability may therefore be unrealistic. Many published studies have shown that life-history traits are more important than taxonomy and distribution in determining species vulnerability to climate change14. Traits that commonly make a species vulnerable to climate change include limited dispersal abilities14,16–18, slow reproductive rates11,19, specialised habitat and dietary requirements14,20,21, restricted distribution and rarity 14,22, and narrow physiological tolerances23–25, while potentially vulnerable habitats include intertidal areas, montane habitats, savannahs and grasslands25. Knowing what makes a species vulnerable and where vulnerable species are located can be very useful when practitioners need to assess the vulnerability of species for which only basic knowledge of their biology and ecology is available. Studies conducted at a broad scale (regional, continental and global, almost 70% of the total), were used to derive a map of
A full list of authors and affiliations appears at the end of the paper
†
NATURE CLIMATE CHANGE | VOL 5 | MARCH 2015 | www.nature.com/natureclimatechange
© 2015 Macmillan Publishers Limited. All rights reserved
215
REVIEW ARTICLE
NATURE CLIMATE CHANGE DOI: 10.1038/NCLIMATE2448 baobab Adansonia suarezensis is likely to go extinct before 2080 owing to an overall loss in suitable habitat. Changes in range size have usually been assessed by considering the climatic characteristics of current distributions and the projected distribution of these climatic conditions in future27,28. However, vulnerability might be exacerbated by other factors, including biotic interactions, reduced adaptive evolutionary response and dispersal ability. Several studies have incorporated dispersal ability into predictions of future range changes, by contrasting scenarios of no dispersal with unlimited dispersal29–31, by estimating average or maximum potential dispersal distances16,18,24, or by explicitly simulating metapopulation dynamics including dispersal events32,33. For example, Schloss et al.18 suggested that 87% of Western Hemisphere terrestrial mammals will probably experience a reduction in their climatically suitable area, with 20% of these species being particularly vulnerable due to their limited dispersal ability.
35 Local
Number of studies
30
Regional
25
Continental
20
Global
15 10
Plants
Mammals
Birds
Reptiles
Amphibians
Fishes
Other invertebrates
0
Insects
5
Figure 1 | Taxonomic focus of vulnerability assessments in the analysed papers. Birds are the most analysed taxon, followed by mammals and plants, while invertebrates other than insects have seldom been assessed. Colours represent the spatial scale of the assessments. Regional scale is defined as describing the range of 104–107 km2, while scales smaller than 104 km2 are referred to as local scales.
the areas with the greatest concentration of vulnerable species, according to an ecoregional classification (Fig. 2). For marine areas we performed a qualitative assessment (high, medium and low vulnerability, mostly based on Foden et al.14) because only a few marine taxa have been evaluated at broad scales and more than 80% of the species assessed are corals, while for terrestrial areas we were able to identify hotspots of vulnerable species as areas with high concentrations of vulnerable species (>100), belonging to different taxonomic classes. These vulnerable areas — the Caribbean, the Amazon basin, Mesoamerica, eastern Europe through central and eastern Asia, the Mediterranean basin, the Himalayas, Southeast Asia, North Africa, the Congo basin, tropical West Africa and Madagascar — should be a first priority for monitoring. However, over 70% of the studies we reviewed involved only three continents/subcontinents, with almost 33% of the studies in North America, 24% in Europe, and 14% in Australia (Fig. 3). By contrast, there is a paucity of studies in the most biodiverse tropical and subtropical regions of the world. As climate change will act in concert with other threats, and habitat loss is predicted to severely affect biodiversity in developing countries26, it is essential to conduct studies in these data-deficient areas.
Currencies used to assess vulnerability
There is no standard way to assess a species’ vulnerability to climate change, and the type of information needed (for example, range extent, population size) will determine which approaches are most appropriate.
Distributional changes. To assess the impacts of climate change on species, current and future distributions can be projected using either mechanistic or correlative niche models (both approaches are discussed below), which relate environmental conditions to species’ physiological responses or occurrence data, respectively. Several analyses have provided examples of species likely to suffer range reductions in the twenty-first century 16,18. For example, Vieilleident et al.27 predicted that the Malagasy 216
Population changes. A different set of modelling approaches uses predictions of population trends to inform risk assessments34. Quantified population changes can be based on direct observations, indices of abundance34–36, reporting rates used as proxies for abundance37, or they can be inferred from declines in extent of occupied or suitable habitat 34,38. Examples of population changes that have been observed over recent decades include declines in long-distance avian migrants to Dutch forests; these declines have likely been driven principally by temperature changes in spring35. Also, a decrease in ice coverage has led to a reduction in polar bear (Ursus maritimus) numbers in the southern Beaufort Sea39. Some approaches to projecting future population sizes incorporate past population trends into mechanistic models39–41, and consider the effects of changes in model parameters (for example, distribution patterns, life history, climatic conditions). This type of approach has also been applied to a population of American marten (Martes americana) in North America, where explicit population models simulated a 40% decline in the population due to climate change by 205542. Extinction probability. One synthesis estimated that between roughly 20 and 30% of species assessed are likely to be at increasingly high risk of extinction in the face of increasing global warming 12. Extinction probability has been calculated for populations of species with known life-history characteristics, such as the emperor penguin (Aptenodytes forsteri)41, Arizona cliffrose (Purshia subintegra)43, spring–summer chinook salmon (Oncorhynchus tshawytscha)44 and polar bear (Ursus maritimus)39, by using population viability analyses41,43, demographic models39,44,45, or evolutionary models46. These methodologies combine population fluctuations with changing environmental parameters in order to estimate extinction probability within a given time interval. For example, Fordham et al.45 modelled the predicted abundance of the Iberian lynx (Lynx pardinus) under three climate scenarios by integrating temperature and precipitation data, prey availability and management interventions, and predicted that climate change may drive this species to extinction within the next 50 years. This work relied upon a thorough understanding of the species’ biology and of demographic dynamics related to extinction risk. However, as most species lack such detailed data, extinction risk due to climate change tends to be quantified only for better-known species. Vulnerability indices and other relative scoring systems. Vulnerability indices are quantitative indicators of the relative vulnerability of species. The data derived from the currencies discussed above, and from trait-based vulnerability assessments (TVAs), can be used to obtain scores14, categories34 or indices47,
NATURE CLIMATE CHANGE | VOL 5 | MARCH 2015 | www.nature.com/natureclimatechange
© 2015 Macmillan Publishers Limited. All rights reserved
REVIEW ARTICLE
NATURE CLIMATE CHANGE DOI: 10.1038/NCLIMATE2448
Marine Low Medium High Terrestrial 0–3 50 species >100 species, 1 taxon >100 species, ≥2 taxa
Figure 2 | Ecoregional global concentrations of terrestrial and marine climate change vulnerable species. Studies conducted at regional, continental and global scales were used to derive a global map of vulnerability, according to an ecoregional classification. Terrestrial areas with high numbers of vulnerable species were identified on the basis of the number of species assessed and the taxonomic ranks higher than species considered.
which are often easier for scientists and practitioners to interpret and use to identify species at risk within their focal areas. Foden et al.14, for example, classified birds, amphibians and corals into two vulnerability categories (low or high). One limitation of indices and scores is that they do not provide any direct measures of the expected impact on species, that is, they are not expressed in terms of any of the currencies otherwise used to assess species’ vulnerability (for example, range reductions, extinction probability, population decline).
Approaches used to model vulnerability to climate change
Different approaches are used to assess species’ vulnerability to climate change. These approaches can be placed in four classes: correlative, mechanistic, trait-based, and combined approaches.
Correlative approaches. Distributional changes are typically estimated through the use of correlative models that aim to represent the realized niche of a species48,49. Correlative models relate observed geographic distribution of a species to current climate; resultant models are then applied to climate projections to infer potential climatically suitable areas for a given species in the future. Species’ distribution can be presence-only data17,22, presence/absence50 or abundance observations51, based either on fieldwork or specimen records22,52. Correlative models have been applied to species at scales ranging from local to global19,53 (Fig. 1), and have been widely used to explore the vulnerability of vertebrates (including birds36,52,54, mammals17,28,38, amphibians30,50 and fishes22,55), invertebrates14,56,57 and plants27,58. Correlative models have the advantage of being spatially explicit and they are applicable to a wide range of taxa at various spatial scales. However, there are a number of limitations and uncertainties associated with them (see Pearson et al.29 and Wiens et al.59 for detailed descriptions). Primary sources of uncertainty and potential errors can be divided into three broad classes: climatic, algorithmic, and biotic29,59. Climatic uncertainties — which apply to all types of approaches — may arise from general circulation models, as different parameters and model structures are used to simulate future climate systems, and so may produce different results irrespective of the assumed greenhouse-gas emissions59,60. Climate models project future climate conditions at a coarser scale of resolution than that of data (biological and environmental) used to calibrate the correlative models49,59, and their outputs are thus often not sufficiently fine-scaled for modelling rare species or species with small geographic distributions49,50.
Algorithmic uncertainties can arise from the differences in methods and models used to predict species’ distribution (for example, generalized additive models, maximum entropy models), and from the selection of model predictors (such as mean annual temperature, annual precipitation; see ref. 61), which have shown great variability in both results and model performance. This range of uncertainties has been addressed by some authors by applying a variety of different statistical methods and model structures, thereby summarizing predictions across all models to generate ensemble forecasts, for example, model-averaged probability of presence and confidence intervals (see refs 16,30,38,62 for examples). Biotic uncertainties may arise if the assumptions made about a species’ biology are inappropriate. First, species’ distributions are assumed to be in equilibrium with surrounding climates and these relationships are assumed to persist in the future56. Second, it is unknown how much of a species’ fundamental niche, exclusively determined by the species’ requirements and/or tolerances is represented by its currently realized niche, which is also determined by abiotic, biotic, geographic, historical and anthropogenic factors49. Moreover, correlative models for plants do not account for drivers such as changes in atmospheric CO2 concentration, which influence plant growth and water use and can alter demographic processes sufficiently to drive ecosystem structural and functional changes63. Correlative models can also be used to predict future geographic distribution of a group of species in a given area and the results combined to create assessments of new community structures64. However, these models ignore community-assembly rules, as well as differences in the constraints and adaptability of individual species, and thus the resulting predicted species assemblages may be unrealistic62. Correlative models have been criticized by some authors because they lack mechanism and causality (for example, see65), although there is increasing evidence that recent population trends have matched those expected from correlative model projections36,38. The relatively large number of reliable occurrence points required to fit correlative models often precludes their use for assessments of poorly known species66. They are also less appropriate for species with cosmopolitan or limited geographic distributions (for example, on small islands) since climate may not explain distributions or distributional changes. Despite these limitations, the majority of regional and global analyses so far are based on correlative approaches, since they can be relatively quick and cheap to apply 67 and occurrence data are available for a large number of taxa.
NATURE CLIMATE CHANGE | VOL 5 | MARCH 2015 | www.nature.com/natureclimatechange
© 2015 Macmillan Publishers Limited. All rights reserved
217
REVIEW ARTICLE
NATURE CLIMATE CHANGE DOI: 10.1038/NCLIMATE2448 14
10 8 6 4 2
6 4 2
Number of studies
Number of studies
12 10 8 6 4 2
TVA
Combined
Mechanistic
Correlative
6 4 2
12 10 8 6 4 2 0
0
14
14 12
Number of studies
Number of studies
12 10 8
14
14
10 8 6 4 2
12 10 8 6 4 2 0
0
14
14 Number of studies
12 10 8 6 4 2
12 10 8 6 4 2
0
0
14
14
12
Number of studies
Number of studies
2
0
0
Number of studies
6 4
14 Number of studies
10 8
Plants
Birds
Mammals
Reptiles
Amphibians
12
Fishes
14
12 10 8
0 Insects
0
Number of studies
Number of studies
12
Other invertebrates
Number of studies
14
10 8 6 4 2
12 10 8 6 4 2 0
0
Figure 3 | Trends and biases in taxonomic groups assessed and approaches used by continent. Birds and mammals have been the most frequently analysed taxa across all continents between 1997 and 2014, usually with similar proportions (with the exception of Asia). Correlative approaches are widely used for assessing species vulnerability in Africa, Asia and Europe, while mechanistic approaches prevail in North America. Trait-based approaches are used mostly in Australia and North America.
Mechanistic approaches. Mechanistic models require taxon-specific parameters that provide information on the behaviour of individuals and the mechanisms they develop to cope with changing climatic conditions. Mechanistic models are developed from laboratory 218
and field observations of demographic rates, physiological tolerances41,68,69, competition and dispersal70, diseases and predation71, as well as from energy balance equations72. Measures of vulnerability derived from these models are typically expressed in terms of
NATURE CLIMATE CHANGE | VOL 5 | MARCH 2015 | www.nature.com/natureclimatechange
© 2015 Macmillan Publishers Limited. All rights reserved
REVIEW ARTICLE
NATURE CLIMATE CHANGE DOI: 10.1038/NCLIMATE2448 probability of extinction, whether of discrete populations or entire species. Mechanistic approaches often focus on a single species of conservation interest (for example, rare or threatened species)39,41, because methods used to collect detailed data on species physiology, which are essential to parameterize such models, are costly and time-consuming. Some studies exist involving this type of modelling that do not involve a specific taxon but rather provide general theoretical frameworks to predict effects of climate change on plants10, terrestrial ectotherms68 and generic species9,10, highlighting major determinants of extinction risk in a changing environment and providing recommendations for future research needs. Some mechanistic models (for example, incidence function models, agestructured metapopulation models) may be used to explain metapopulation dynamics in the presence of climate change by estimating extinction and colonization rates as functions of habitat suitability73, prey availability or management actions45. Other mechanistic models consider the changes in vegetation distribution and dynamics using both bioclimatic and physiological parameters of groups of species (for example, plant functional types)74. Mechanistic niche models use species’ functional traits, physiological tolerances and energy and mass exchanges to represent the fundamental niche of a species75. Key functional traits (such as morphology, physiology, behaviour) and spatial habitat data (for example, climate, vegetation cover, topography, bathymetry) are used to assess individual fitness75,76. Such models are considered by some authors to be more robust and theoretically defensible than correlative models for predicting species’ responses to climate change75. Compared with the realized niche modelled via correlative approaches, the mechanistically modelled fundamental niche provides a better approximation of the climatic space in which an organism can exist, including areas that have, or may, become newly suitable75,76. In addition, these models permit explicit consideration of important biological factors such as evolutionary changes and physiological responses. Extensive application of mechanistic niche models is precluded by the fact that they require detailed data that are lacking for most species. The main sources of uncertainty in mechanistic models relate to model parameters (for example, population abundance, which may be underestimated depending on the method used to collect the data and the ability of the observer to detect the species), and to combining data collected at different spatial resolutions23. Moreover, these models usually do not account for non-climatic threats to dispersal or for biotic interactions48.
Trait-based vulnerability assessment approaches. TVAs use species’ biological characteristics as predictors of extinction risk due to climate change13,14, often in combination with estimates of exposure. Methods typically involve selecting traits related to sensitivity (for example, typically describing ecological specialization, interspecific interactions) and adaptability (that is, dispersal and phenotypic adaptability 14,77,78) and scoring each according to observations or expert judgment 79,80. For example, Gardali et al.78 quantified the vulnerability of Californian birds by scoring sensitivity and exposure for each taxon. They used information from published literature to assign a sensitivity score to four intrinsic species’ characteristics (dispersal ability, migratory status, habitat specialization and physiological tolerances), and then combined sensitivity and exposure scores to generate a climate vulnerability index. TVAs are being used increasingly by conservation organizations and management agencies because they permit a relatively rapid assessment for multiple species that can be used to prioritize conservation planning and implementation of adaptation schemes. Moreover, TVAs are sometimes considered easier to use by practitioners because they do not require extensive knowledge of modelling techniques, even if their applicability is limited to a
Box 1 | Data availability.
Once clear objectives have been established, and the potential approaches identified, another consideration for selecting the most appropriate method is to consider the type of data available. The financial resources, time, expertise and input data required for each method are likely to mean that just one or, at best, a few approaches are feasible. When fine-scale data on species occurrence are available (for example, point localities), correlative and mechanistic niche models may be applied. To build these types of models, adequate climate data covering different time periods are also needed. For example, paleoclimatic reconstructions for the Paleocene and Holocene, as well as current and future projections, are already available under different resolutions and time intervals123,124. Where relevant life-history data (for example, data on species’ biology, ecology, physiology, demography) are available (see ecology and trait databases for birds125, mammals81,126 and amphibians127); trait-based or mechanistic approaches could facilitate, for example, the identification of resilient and/or adaptable species, thus aiding in prioritization11. Moreover, these kinds of data are necessary to develop mechanistic niche models to refine species’ distribution based on the mechanisms that species themselves develop to cope with global warming 13. Often this type of empirical data will be lacking. Rather than abandon modelling and informing conservation decisions in these cases, structured expert elicitation approaches offer an interim way of estimating key species demographic and life-history parameters128,129. specific area and to cases where relevant data on species’ traits are available (see ref. 81). Drawbacks with TVAs are that precise vulnerability thresholds associated with each trait are often unknown, necessitating selection of arbitrary, relative thresholds for categories of higher or lower extinction risk. Traits are often weighted equally 20 even though some characteristics are likely to be more important than others in determining climate change vulnerability. Subject to the challenges of score-based systems, it is not possible to compare vulnerability between taxonomic groups for which different sets of traits may have been used in the TVA. Moreover, different TVAs applied to the same species do not always yield congruent results82. The most common sources of uncertainty in TVAs stem from the choice of traits included in assessments, parameterisation of thresholds of associated vulnerability, and from gaps in knowledge of individual species’ characteristics14,83. For example, dispersal distance is one of TVA’s most important and conservation-informative traits, yet estimates are currently available for few animal species. Some studies have attempted to provide dispersal estimates16,18,84, but inevitable uncertainties arise from models and parameters. Uncertainty is usually incorporated as a confidence score based on expert opinion. Such score can be provided for each trait 78, for each stage of the assessment 83, or for the overall assessment 78. Alternatively, some authors rank missing trait data under best- or worst-case scenarios14,80, by assuming optimistic and pessimistic extreme values.
Combined approaches. There is a growing consensus on the benefits of using approaches that combine different types of models and data32,38,40. Here we discuss the three most common combined approaches, criteria-based, mechanistic–correlative and correlative–TVA. Criteria-based approaches. These methods have been used to combine observed or projected demographic trends (for example,
NATURE CLIMATE CHANGE | VOL 5 | MARCH 2015 | www.nature.com/natureclimatechange
© 2015 Macmillan Publishers Limited. All rights reserved
219
REVIEW ARTICLE
NATURE CLIMATE CHANGE DOI: 10.1038/NCLIMATE2448
Table 1 | Examples of objectives in climate change vulnerability assessments, on the basis of the scale to be adopted. Temporal scale
Spatial scale
Taxonomic scale
Type of objective
Past
Recent past/ present
Present/ Future
Local/site
Regional
Global
Population and Single ranks below species species
Multi species
Correlative
Reconstructing species' past distribution101
Modelling current climatic suitable areas for species22
Predicting climateinduced future range shifts under different time intervals38,102
Quantifying the area that will remain climatically suitable for species living in areas important for conservation60
Assessing the ability of a network of protected areas to ensure the persistence of species103
Identifying the most important climatic variables in determining a species’ distribution globally19
Quantifying the latitudinal/ altitudinal shifts of the various populations of a species104
Assessing a species’ future threat status93
Predicting spatial patterns of species richness105
Identifying past climatic refugia106
Quantifying percentage range gains/ losses in the last decades to estimate extinction risk38
Projecting future range margin contractions/ expansions by 208092
Quantifying species' turnover within a protected area54
Identifying and designing potential areas to be protected within a region107
Identifying hotspots of species that are highly exposed19
Assessing which of the populations of a species will experience the greatest changes in distribution104
Predicting spatial overlap between the current and future ranges of a species108
Modelling possible future community assemblages
Quantifying population reductions in recent times due to changes in sea- ice extent41
Predicting survival under future climate change111
Determining climatic factors that affect reproductive success of a reintroduced species112
Exploring the range margin dynamics for species of conservation concern within a region40
Assessing species thermal tolerances across their range113
Assessing the extinction risk of a population at the margins of a species’ range40
Assessing the impacts of sea-level rise on a coastal species114
Modelling prey– predator dynamics under future climatic conditions45
Understanding the effects of changes in CO2 concentration on plants115
Determining population viability due to an increase in frequency of extreme climatic events during the past decades43
Assessing species’ probability of extinction by 210041
Predicting the probability of extinction of a keystone species within a site42
Exploring the extinction risk of a species in part of its range39
Predicting changes in fitness due to global warming globally68
Determining the extinction risk of a threatened subspecies34
Estimating species’ abundance in the future under climate change116
Predicting future expansions of invasive species117
Identifying trends of past extinctions related to life history traits118
Identifying taxonomic groups that currently retain high numbers of sensitive and unadaptable species78
Identifying sensitive species living in areas that are likely to become highly exposed in the future119
Prioritizing conservation actions at the local scale120
Making an assessment of species vulnerability within a country80
Identifying species with the greatest relative vulnerability to climate change78
Identifying potential adaptive characteristics of an isolated subspecies35
Identifying the traits that make a species most vulnerable to climate change120
Identifying the most vulnerable species to climate change within a taxon20
Predicting the response of species that share life-history traits with past extinct/ impacted species to future climatic changes121
Identifying the characteristics of species that played the most important role in determining reductions/ extinctions in recent years14
Identifying unadaptable species with the largest predicted range shifts in the coming decades83
Understanding which component of vulnerability is prevalent for a species within a site122
Understanding how traits relate to changes in occurrence of species within a freshwater basin subject to droughts11
Identifying areas with the greatest number of vulnerable species at the global scale14
Identifying potentially vulnerable subspecies/ populations/ varieties with relatively unknown distribution36
Assessing species’ adaptive capacity/ resilience14
Selecting different adaptation strategies according to the relative vulnerability of different species78
Mechanistic Representing postglacial expansions from glacial refugia110
TVA
population increases or decreases) with intrinsic characteristics of species (such as generation length), to classify species into threat categories based on the risks posed by climate change. Climate-attributed changes in species’ geographic ranges, often 220
109
derived from correlative models, are assessed against quantitative thresholds34,38,83,85. These assessments often use the IUCN Red List categories and criteria38,85 (http://www.iucnredlist.org) or draw inspiration from them83.
NATURE CLIMATE CHANGE | VOL 5 | MARCH 2015 | www.nature.com/natureclimatechange
© 2015 Macmillan Publishers Limited. All rights reserved
REVIEW ARTICLE
NATURE CLIMATE CHANGE DOI: 10.1038/NCLIMATE2448 One advantage of criteria-based approaches is that they can be applied to large numbers of species worldwide86. They are important for assessing the conservation status of species threatened by climate change since they simultaneously account for several factors known to affect the relative extinction risk (for example, declines in the extent of occurrence, reduction in population size). Furthermore, by using quantitative thresholds to predict relative extinction risk, it is possible to make comparisons between past, current and future conservation status of species38. Approaches based on the IUCN Red List require a consistent adoption of thresholds and criteria87; however, these are sometimes arbitrarily modified (for example, to temporal and spatial scales and spatial resolution), thereby reducing the comparability and interpretability of the results87. Pearson et al.88 identified factors that predispose a selection of North American herpetiles to high extinction risk due to climate change, and concluded that most important factors are already incorporated into extinction risk assessments for the IUCN Red List. Mechanistic–correlative and mechanistic–correlative–TVA approaches. In mechanistic–correlative approaches, outputs of correlative models are incorporated into demographic models to calculate spatial structure of populations45, whose dynamics are then modelled mechanistically. This combination is useful in predicting how distribution patterns influence the viability of populations under a changing climate, for example32,40. Furthermore, some studies have integrated life-history characteristics into models to produce more accurate projections of species’ responses to climate change. Keith et al.32 assessed extinction risk for plant species in South African fynbos, natural shrubland or heathland vegetation, under stable and changing climatic conditions. The authors linked the outputs of correlative models with a demographic metapopulation model, and considered their interactions with fire tolerances and dispersal abilities. In this way, they dealt with both habitat changes and population dynamics simultaneously in their assessments. Correlative–TVA approaches. Other combined approaches integrate species characteristics and species distribution models by incorporating species traits to refine distribution projections made using correlative models16,18,31,38,89, or by integrating correlative model outputs into trait-based assessments21,83. In the first approach, traits such as dispersal ability and generation length have been usefully applied to refine range dynamics16,90. For example, Barbet-Massin et al.16 used natal dispersal and generation length to predict the breeding distribution of European birds under climate and land-use changes. The authors predicted a 10% reduction in future species richness, assuming unlimited dispersal and a 25% reduction by using natal dispersal. In the second type of approach, the outputs of correlative models are used to estimate exposure to climate change and identify areas that might become suitable in the future, even if they fall outside a species’ current range. By linking exposure, estimated using correlative models, with sensitivity and adaptability assessed with TVAs, a vulnerability index can be calculated that accounts for both intrinsic and extrinsic factors (for example, ref. 83).
Guidance for selecting approaches
Ideally, practitioners should assess the vulnerability of populations or species to climate change using a variety of methods, with greatest predictive confidence conferred where models are in agreement. The choice of the approach is entirely dependent on conservation goals, which are often vague and not clearly defined, and on the data available (Box 1). Relying on these broad goals, practitioners need to identify definable and measurable objectives91, in terms of temporal, spatial and taxonomic scales. In Table 1 we identify different
examples of objectives against each approach and below provide two exemplary goals and identify the associated methodologies to reach them. Estimating extinction risk. When deriving estimates of extinction risk of species is the goal, both mechanistic and correlative models can provide appropriate results. The most effective way to predict extinction risk of species under climate change is to combine demographic data (such as population trends, survival, fertility) with changing environmental factors (for example, precipitation, sea-ice extent), and then project these changes into the future41,43. For instance, Jenouvrier et al.41 used a mechanistic model, which combined demographic and climatic data, to project a >35% probability of extinction for the emperor penguins (Aptenodytes forsteri) in Antarctica by 2100 in response to projected sea-ice changes. Another way of inferring the extinction risk of species is to use a decline in suitable area as a proxy for population decline38,92,93, providing the relationship between the two can be assumed to remain constant. Correlative models can be used to project range changes into the future; this would allow classifying the species into one of IUCN Red List categories. Levinsky et al.93, for example, demonstrated that the proportion of European mammals that are forecast to become extinct by 2100 can vary from 1 to 9%, depending on the magnitude of predicted climatic changes and the ability of species to migrate.
Prioritization of actions. Climate change adaptation strategies require creating a link between an explicitly stated expectation about the way global warming could affect species, habitats, or even people, to clear objectives and actions that would best address those climate impacts94. Conservation decision-making is about prioritizing actions to satisfy conservation objectives for a set of species and areas95. It is not possible to make conservation interventions for all species, and prioritization exercises are needed to determine which actions to focus on to protect species96. Given the high levels of uncertainty and complexity in modelling impacts, we highlight that reprioritizing or even abandoning actions which benefit some species over others should be done with great caution. Where site-scale conservation is the focus (for example, in a protected area), correlative models are able to identify species for which the area may be suitable in the future, thereby allowing managers to prepare for potentially new species assemblages and plan appropriate conservation actions (such as predator and invasive species control). For example, Hole et al.54 used correlative models to assess species turnover in a network of important bird areas in Africa, and provided generic guidance on the types of conservation actions (for example, translocation, habitat restoration, disturbance-regime management) that might be most appropriate for individual sites. For a regional-scale focus, identifying the bioclimatic space where species could persist and the areas of relatively unchanged climate within this space may facilitate species persistence during periods of climatic stress. Spatially explicit projections from correlative and mechanistic niche models allow identification of these sites. For example, Maschinski et al.43 used a mechanistic approach to identify potential climatic refugia for an endemic plant species (Purshia subintegra) in Arizona. This study showed that in situ manipulation and introductions at northern latitudes are priority actions necessary to prevent the extinction of this rare and endangered species. Where the focus is on particular species, trait-based and mechanistic approaches are likely to deliver insights into the specific mechanism(s) of impact (for example, increased competition, loss of mutualisms, disruption of cues, disease)14, allowing targeted interventions both to decrease species’ sensitivity
NATURE CLIMATE CHANGE | VOL 5 | MARCH 2015 | www.nature.com/natureclimatechange
© 2015 Macmillan Publishers Limited. All rights reserved
221
REVIEW ARTICLE
NATURE CLIMATE CHANGE DOI: 10.1038/NCLIMATE2448
(to factors such as disease treatment, predator control) and to increase their adaptive capacity (genetic management, improved landscape permeability, translocation)75. Indices calculated with trait-based approaches can facilitate grouping taxa by their relative risk to climatic changes, which helps identify adaptation strategies that could benefit multiple species77. Moyle et. al 80, who assessed Californian freshwater fishes according to their life-history characteristics, classified species that were heavily dependent on human intervention as highly vulnerable to climate change, and highlighted the need for conservation actions such as management of barriers, special flows and removal of alien species to allow population persistence.
A glaring oversight in almost all studies is that they only focused on the direct impacts of climate change. Indirect impacts within biological communities, as well as changes in human use of natural resources are going to have substantial, complex, and often multiplicative impacts on species36,100. Thus, many current assessments are blind to the fact that the interactions between current threats and climate change are likely to be profound3. Moreover, the growing human population will itself be increasingly affected by climate change, with human adaptation responses likely to result in substantial and negative impacts on biodiversity 100. Assessments of future impacts of climate change need to take these factors into account.
Conclusions
Received; 14 April 2014; accepted 27 October 2014; published online 25 February 2015
This Review of methodologies for climate change vulnerability assessments suggests that, in general, a correlative approach is appropriate when the only data available are those on species’ occurrence, in particular for reconstructing the paleoclimatic niche of fossil species or projecting their future climatic suitable area, from local to global scales. On the other hand, mechanistic models have the greatest power to assess extinction probability driven by climate change, identify conservation actions and evaluate the potential effectiveness of management interventions, but they are limited to few terrestrial species. Therefore, they are usually employed when the focus is on a well-studied species of particular conservation interest (for example, species threatened, keystone, flagship or umbrella species — that is, species that play a critical role in maintaining the structure of an ecological community, iconic organisms that provide a focus for raising awareness and stimulating funding for conservation actions, and species whose protection indirectly protects many other species, respectively), for which detailed physiologic and/or demographic data are available. Trait-based approaches are less resource-intensive and therefore more widely used. This method is ideal to help non-GIS experts develop regional assessments and to identify conservation priorities in the absence of specific data on species’ distribution. Validation of the accuracy and precision of vulnerability assessment approaches, through comparison of model projections with a globally coordinated observation effort, is essential for improving projections of the impacts of climate change on species. Use of paleoecological evidence of past species’ responses to climatic variation in conjunction with matching paleoclimatic data can provide an opportunity to test the assessments97,98. Observations of recent responses to climate change are another useful tool to test reliability of model predictions against current observations. However, quantifying the ability of models to provide reliable range shift projections or population changes is still challenging, since they are often difficult to validate across time and space97. One key issue is the debate on modelling the realized versus the fundamental niche48,49,79. Both the lack of equilibrium between species and climate, and the difficulty of isolating the effects of climatic changes on a species’ range from those of other threats97, can lead to changes in the realized niche of a species (usually modelled mechanistically). On the other hand, correlative approaches attempt to model the fundamental niche of a species, but they use data from the realized niche48. This can lead to spurious correlations between species’ occurrence and climate and thus hinder model validation as well as casting doubts on model accuracy 48. For example, a species may not respond to climate only because other factors (such as competitive exclusion, predation) are confounding the response99. Additionally, when comparing past and current distribution to validate models or TVAs, a big challenge is to find accurate information on species’ historic distribution and population trends. Addressing all of these issues should lead to better conservation decision-making. 222
References
1. IPCC Summary for Policymakers in Climate Change 2013: The Physical Science Basis (eds Stocker, T. F. et al.) (Cambridge Univ. Press, 2013). 2. Thomas, C. D. et al. Extinction risk from climate change. Nature 427, 145–148 (2004). 3. Mantyka-Pringle, C. S., Martin, T. G. & Rhodes, J. R. Interactions between climate and habitat loss effects on biodiversity: a systematic review and meta-analysis. Glob. Change Biol. 18, 1239–1252 (2012). 4. Sinervo, B. et al. Erosion of lizard diversity by climate change and altered thermal niches. Science 328, 894–849 (2010). 5. Sheridan, J. A. & Bickford, D. Shrinking body size as an ecological response to climate change. Nature Clim. Change. 1, 401–406 (2011). 6. Réale, D., McAdam, A. G., Boutin, S. & Berteaux, D. Genetic and plastic responses of a northern mammal to climate change. Proc. Biol. Sci. 270, 591–596 (2003). 7. Ockendon, N. et al. Mechanisms underpinning climatic impacts on natural populations: altered species interactions are more important than direct effects. Glob. Change Biol. 20, 2221–2229(2014). 8. Auer, S. K. & King, D. I. Ecological and life-history traits explain recent boundary shifts in elevation and latitude of western North American songbirds. Glob. Ecol. Biogeogr. 23, 867–875(2014). 9. Chevin, L-M., Lande, R. & Mace, G. M. Adaptation, plasticity, and extinction in a changing environment: towards a predictive theory. PLoS Biol. 8, e1000357 (2010). 10. Midgley, G. F. et al. BioMove — An integrated platform simulating the dynamic response of species to environmental change. Ecography. 33, 612–616 (2010). 11. Chessman, B. C. Identifying species at risk from climate change: Traits predict the drought vulnerability of freshwater fishes. Biol. Conserv. 160, 40–49 (2013). 12. Oppenheimer, M. et al. in Climate Change 2014: Impacts, Adaptation, and Vulnerability (eds Field, C. B. et al.) Ch. 19 (IPCC, Cambridge Univ. Press, 2014). 13. Williams, S. E., Shoo, L. P., Isaac, J. L., Hoffmann, A. A. & Langham, G. Towards an integrated framework for assessing the vulnerability of species to climate change. PLoS Biol. 6, 2621–6 (2008). 14. Foden, W. B. et al. Identifying the world’s most climate change vulnerable species: a systematic trait-based assessment of all birds, amphibians and corals. PLoS One 8, e65427 (2013). 15. Dawson, T. P., Jackson, S. T., House, J. I., Prentice, I. C. & Mace, G. M. Beyond predictions: biodiversity conservation in a changing climate. Science 332, 53–8 (2011). 16. Barbet-Massin, M., Thuiller, W. & Jiguet, F. The fate of European breeding birds under climate, land-use and dispersal scenarios. Glob. Change Biol. 18, 881–890 (2012). 17. Hughes, A. C., Satasook, C., Bates, P. J. J., Bumrungsri, S. & Jones, G. The projected effects of climatic and vegetation changes on the distribution and diversity of Southeast Asian bats. Glob. Change Biol. 18, 1854–1865 (2012). 18. Schloss, C. A., Nuñez, T. A. & Lawler, J. J. Dispersal will limit ability of mammals to track climate change in the Western Hemisphere. Proc. Natl Acad. Sci. USA 109, 8606–8611 (2012). 19. Ameca y Juárez, E. I., Mace, G. M., Cowlishaw, G., Cornforth, W. A. & Pettorelli, N. Assessing exposure to extreme climatic events for terrestrial mammals. Conserv. Lett. 6, 145–153 (2013). 20. Laidre, K. L. et al. Quantifying the sensitivity of Arctic marine mammals to climate-induced habitat change. Ecol. Appl. 18, S97–125 (2008). 21. Garnett, S. et al. Climate Change Adaptation Strategies for Australian Birds (National Climate Change Adaptation Research Facility, 2013).
NATURE CLIMATE CHANGE | VOL 5 | MARCH 2015 | www.nature.com/natureclimatechange
© 2015 Macmillan Publishers Limited. All rights reserved
REVIEW ARTICLE
NATURE CLIMATE CHANGE DOI: 10.1038/NCLIMATE2448 22. Yu, D. et al. Global climate change will severely decrease potential distribution of the East Asian coldwater fish Rhynchocypris oxycephalus (Actinopterygii, Cyprinidae). Hydrobiologia 700, 23–32 (2013). 23. Buckley, L. B. The range implications of lizard traits in changing environments. Glob. Ecol. Biogeogr. 19, 452–464 (2010). 24. Iverson, L. R., Prasad, A. M., Matthews, S. N. & Peters, M. P. Lessons learned while integrating habitat, dispersal, disturbance, and life-history traits into species habitat models under climate change. Ecosystems 14, 1005–1020 (2011). 25. Crossman, N. D., Bryan, B. A. & Summers, D. M. Identifying priority areas for reducing species vulnerability to climate change. Divers. Distrib. 18, 60–72 (2012). 26. Visconti, P. et al. Future hotspots of terrestrial mammal loss. Phil. Trans. R. Soc. London B 366, 2693–2702 (2011). 27. Vieilledent, G., Cornu, C., Cuní Sanchez, A., Leong Pock-Tsy, J‑M. & Danthu, P. Vulnerability of baobab species to climate change and effectiveness of the protected area network in Madagascar: Towards new conservation priorities. Biol. Conserv. 166, 11–22 (2013). 28. Songer, M., Delion, M., Biggs, A. & Huang, Q. Modeling impacts of climate change on giant panda habitat. Int. J. Ecol. 2012, 1–12 (2012). 29. Pearson, R. G. et al. Model-based uncertainty in species range prediction. J. Biogeogr. 33, 1704–1711 (2006). 30. Carvalho, S. B., Brito, J. C., Crespo, E. G., Watts, M. E. & Possingham, H. P. Conservation planning under climate change: Toward accounting for uncertainty in predicted species distributions to increase confidence in conservation investments in space and time. Biol. Conserv. 144, 2020–2030 (2011). 31. Tuanmu, M‑N. et al. Climate-change impacts on understorey bamboo species and giant pandas in China’s Qinling Mountains. Nature Clim. Change. 3, 249–253 (2012). 32. Keith, D. A. et al. Predicting extinction risks under climate change: coupling stochastic population models with dynamic bioclimatic habitat models. Biol. Lett. 4, 560–563 (2008). 33. Fordham, D. A., Akçakaya, H. R., Araújo, M. B., Keith, D. A. & Brook, B. W. Tools for integrating range change, extinction risk and climate change information into conservation management. Ecography 36, 956–964 (2013). 34. Guidelines for Using the IUCN Red List Categories and Criteria Version 10 (IUCN Standards and Petitions Subcommittee, 2013); http://www.iucnredlist.org/documents/RedListGuidelines.pdf. 35. Both, C. et al. Avian population consequences of climate change are most severe for long-distance migrants in seasonal habitats. Proc. Biol. Sci. 277, 1259–1266 (2010). 36. Gregory, R. D. et al. An indicator of the impact of climatic change on European bird populations. PLoS One 4, e4678 (2009). 37. Huntley, B., Altwegg, R., Barnard, P., Collingham, Y. C. & Hole, D. G. Modelling relationships between species spatial abundance patterns and climate. Glob. Ecol. Biogeogr. 21, 668–681 (2012). 38. Visconti, P. et al. Projecting global biodiversity indicators under future development scenarios. Conserv. Lett. http://dx.doi.org/10.1111/conl.12159 (2015). 39. Hunter, C. M. et al. Climate change threatens polar bear populations: a stochastic demographic analysis. Ecology 91, 2883–2897 (2010). 40. Anderson, B. J. et al. Dynamics of range margins for metapopulations under climate change. Proc. Biol. Sci. 276, 1415–1420 (2009). 41. Jenouvrier, S. et al. Demographic models and IPCC climate projections predict the decline of an emperor penguin population. Proc. Natl Acad. Sci. USA 106, 1844–1847 (2009). 42. Carroll, C. Interacting effects of climate change, landscape conversion, and harvest on carnivore populations at the range margin: marten and lynx in the northern Appalachians. Conserv. Biol. 21, 1092–1104 (2007). 43. Maschinski, J., Baggs, J. E., Quintana-Ascencio, P. F. & Menges, E. S. Using population viability analysis to predict the effects of climate change on the extinction risk of an endangered limestone endemic shrub, Arizona cliffrose. Conserv. Biol. 20, 218–228 (2006). 44. Thompson, L. C. et al. Water management adaptations to prevent loss of spring-run chinook salmon in california under climate change. J. Wat. Resour. Plan. Manag. 138, 465–478 (2012). 45. Fordham, D. A. et al. Adapted conservation measures are required to save the Iberian lynx in a changing climate. Nature Clim. Change 3, 899–903 (2013). 46. Vedder, O., Bouwhuis, S. & Sheldon, B. C. Quantitative assessment of the importance of phenotypic plasticity in adaptation to climate change in wild bird populations. PLoS Biol. 11, e1001605 (2013). 47. Young, B. E. et al. in Wildlife Conservation in a Changing Climate (eds. Brodie, J., Post, E. & Doak, D.) 129–150 (Univ. Chicago Press, 2012). 48. Pearson, R. G. & Dawson, T. P. Predicting the impacts of climate change on the distribution of species: are bioclimate envelope models useful? Glob. Ecol. Biogeogr. 12, 361–371 (2003). 49. Guisan, A. & Thuiller, W. Predicting species distribution: offering more than simple habitat models. Ecol. Lett. 8, 993–1009 (2005).
50. Lawler, J. J., Shafer, S. L., Bancroft, B. A. & Blaustein, A. R. Projected climate impacts for the amphibians of the Western hemisphere. Conserv. Biol. 24, 38–50 (2009). 51. Howard, C., Stephens, P. A., Pearce-Higgins, J. W., Gregory, R. D. & Willis, S. G. Improving species distribution models: the value of data on abundance. Methods Ecol. Evol. 5, 506–513 (2014). 52. Garcia, R. A., Burgess, N. D., Cabeza, M., Rahbek, C. & Araújo, M. B. Exploring consensus in 21st century projections of climatically suitable areas for African vertebrates. Glob. Change Biol. 18, 1253–1269 (2012). 53. Watson, J. E. M., Iwamura, T. & Butt, N. Mapping vulnerability and conservation adaptation strategies under climate change. Nature Clim. Change 3, 989–994 (2013). 54. Hole, D. G. et al. Toward a management framework for networks of protected areas in the face of climate change. Conserv. Biol. 25, 305–315 (2011). 55. Jeschke, J. M. & Strayer, D. L. Usefulness of bioclimatic models for studying climate change and invasive species. Ann. NY Acad. Sci. 1134, 1–24 (2008). 56. Harrison, P. A., Berry, P. M., Butt, N. & New, M. Modelling climate change impacts on species’ distributions at the European scale: implications for conservation policy. Environ. Sci. Policy 9, 116–128 (2006). 57. Sánchez-Fernández, D., Lobo, J. M. & Hernández-Manrique, O. L. Species distribution models that do not incorporate global data misrepresent potential distributions: a case study using Iberian diving beetles. Divers. Distrib. 17, 163–171 (2011). 58. Cole, K. L. et al. Past and ongoing shifts in Joshua tree distribution support future modeled range contraction. Ecol. Appl. 21, 137–49 (2011). 59. Wiens, J. A., Stralberg, D., Jongsomjit, D., Howell, C. A. & Snyder, M. A. Niches, models, and climate change: assessing the assumptions and uncertainties. Proc. Natl Acad. Sci. USA 106 (Suppl), 19729–19736 (2009). 60. Bagchi, R. et al. Evaluating the effectiveness of conservation site networks under climate change: accounting for uncertainty. Glob. Change Biol. 19, 1236–48 (2013). 61. Heikkinen, R. K. et al. Methods and uncertainties in bioclimatic envelope modelling under climate change. Prog. Phys. Geogr. 30, 751–777 (2006). 62. Guisan, A. & Rahbek, C. SESAM - a new framework integrating macroecological and species distribution models for predicting spatio-temporal patterns of species assemblages. J. Biogeogr. 38, 1433–1444 (2011). 63. Higgins, S. I. & Scheiter, S. Atmospheric CO2 forces abrupt vegetation shifts locally, but not globally. Nature 488, 209–212 (2012). 64. Dubuis, A. et al. Predicting spatial patterns of plant species richness: a comparison of direct macroecological and species stacking modelling approaches. Divers. Distrib. 17, 1122–1131 (2011). 65. Tyre, A. J., Possingham, H. P. & Lindenmayer, D. B. Inferring process from pattern: can territory occupancy provide information about life history parameters? Ecol. Appl. 11, 1722–1737 (2001). 66. Boitani, L. et al. What spatial data do we need to develop global mammal conservation strategies? Phil. Trans. R. Soc. Lond. B 366, 2623–2632 (2011). 67. Peterson, A. T. & Martínez-Meyer, E. Geographic evaluation of conservation status of African forest squirrels (Sciuridae) considering land use change and climate change: the importance of point data. Biodivers. Conserv. 16, 3939–3950 (2007). 68. Deutsch, C. A. et al. Impacts of climate warming on terrestrial ectotherms across latitude. Proc. Natl Acad. Sci. USA 105, 6668–6672 (2008). 69. Radchuk, V., Turlure, C. & Schtickzelle, N. Each life stage matters: the importance of assessing the response to climate change over the complete life cycle in butterflies. J. Anim. Ecol. 82, 275–285 (2013). 70. Best, A. S., Johst, K., Münkemüller, T. & Travis, M. J. Which species will succesfully track climate change? The influence of intraspecific competition and density dependent dispersal on range shifting dynamics. Oikos 116, 1531–1539 (2007). 71. Amstrup, S. C., Marcot, B. G. & Douglas, D. C. Forecasting the Range Wide Status of Polar Bears at Selected Times in the 21st Century (US Department of the Interior, US Geological Survey, 2007). 72. Huey, R. B. et al. Predicting organismal vulnerability to climate warming: roles of behaviour, physiology and adaptation. Phil. Trans. R. Soc. Lond. B 367, 1665–1679 (2012). 73. Wilson, R. J., Davies, Z. G. & Thomas, C. D. Modelling the effect of habitat fragmentation on range expansion in a butterfly. Proc. Biol. Sci. 276, 1421–1427 (2009). 74. Morin, X. & Thuiller, W. Comparing niche- and process-based models to reduce prediction uncertainty in species range shifts under climate change. Ecology 90, 1301–1313 (2009). 75. Kearney, M. & Porter, W. Mechanistic niche modelling: combining physiological and spatial data to predict species’ ranges. Ecol. Lett. 12, 334–350 (2009). 76. Monahan, W. B. A mechanistic niche model for measuring species’ distributional responses to seasonal temperature gradients. PLoS One 4, e7921 (2009). 77. Young, B., Byers, E., Gravuer, K., Hall, K., Hammerson, G. & Redder, A. Guidelines for Using the NatureServe Climate Change Vulnerability Index (NatureServe, 2010).
NATURE CLIMATE CHANGE | VOL 5 | MARCH 2015 | www.nature.com/natureclimatechange
© 2015 Macmillan Publishers Limited. All rights reserved
223
REVIEW ARTICLE
NATURE CLIMATE CHANGE DOI: 10.1038/NCLIMATE2448
78. Gardali, T., Seavy, N. E., DiGaudio, R. T. & Comrack, L. A. A climate change vulnerability assessment of California’s at-risk birds. PLoS One 7, e29507 (2012). 79. Rowland, E. L., Davison, J. E. & Graumlich, L. J. Approaches to evaluating climate change impacts on species: a guide to initiating the adaptation planning process. Environ. Manage. 47, 322–337 (2011). 80. Moyle, P. B., Kiernan, J. D., Crain, P. K. & Quiñones, R. M. Climate change vulnerability of native and alien freshwater fishes of California: a systematic assessment approach. PLoS One 8, e63883 (2013). 81. Pacifici, M. et al. Generation length for mammals. Nature Conserv. 5, 89–94 (2013). 82. Lankford, A. J., Svancara, L. K., Lawler, J. J. & Vierling, K. Comparison of climate change vulnerability assessments for wildlife. Wildlife Soc. Bull. 38, 386–394 (2014). 83. Thomas, C. D. et al. A framework for assessing threats and benefits to species responding to climate change. Methods Ecol. Evol. 2, 125–142 (2011). 84. Santini, L. et al. Ecological correlates of dispersal distance in terrestrial mammals. Hystrix 24, 1–6 (2013). 85. Maclean, I. M. D. & Wilson, R. J. Recent ecological responses to climate change support predictions of high extinction risk. Proc. Natl Acad. Sci. USA 108, 12337–12342 (2011). 86. Red List Categories and Criteria Version 3.1 (IUCN Species Survival Commission, 2001). 87. Akçakaya, H. R., Butchart, S. H. M., Mace, G. M., Stuart, S. N. & Hilton-Taylor, C. Use and misuse of the IUCN Red List Criteria in projecting climate change impacts on biodiversity. Glob. Change Biol. 12, 2037–2043 (2006). 88. Pearson, R. G. et al. Life history and spatial traits predict extinction risk due to climate change. Nature Clim. Change. 4, 217–221 (2014). 89. Summers, D. M., Bryan, B. A., Crossman, N. D. & Meyer, W. S. Species vulnerability to climate change: impacts on spatial conservation priorities and species representation. Glob. Change. Biol. 18, 2335–2348 (2012). 90. Rondinini, C. et al. Global habitat suitability models of terrestrial mammals. Phil. Trans. R. Soc. Lond. B 366, 2633–2641 (2011). 91. Wintle, B. A. et al. Ecological–economic optimization of biodiversity conservation under climate change. Nature Clim. Change. 1, 355–359 (2011). 92. Thuiller, W., Lavorel, S., Araújo, M. B., Sykes, M. T. & Prentice, I. C. Climate change threats to plant diversity in Europe. Proc. Natl Acad. Sci. USA 102, 8245–8250 (2005). 93. Levinsky, I., Skov, F., Svenning, J‑C. & Rahbek, C. Potential impacts of climate change on the distributions and diversity patterns of European mammals. Biodivers. Conserv. 16, 3803–3816 (2007). 94. Poiani, K. A., Goldman, R. L., Hobson, J., Hoekstra, J. M. & Nelson, K. S. Redesigning biodiversity conservation projects for climate change: examples from the field. Biodivers. Conserv. 20, 185–201 (2011). 95. Game, E. T., Kareiva, P. & Possingham, H. P. Six common mistakes in conservation priority setting. Conserv. Biol. 27, 480–485 (2013). 96. Bottrill, M. C. et al. Is conservation triage just smart decision making? Trends Ecol. Evol. 23, 649–654 (2008). 97. Araújo, M. B., Pearson, R. G., Thuiller, W. & Erhard, M. Validation of species–climate impact models under climate change. Glob. Change Biol. 11, 1–10 (2005). 98. Watling, J. I. et al. Validating predictions from climate envelope models. PLoS One 8, e63600 (2013). 99. Feeley, K. J. & Silman, M. R. Land-use and climate change effects on population size and extinction risk of Andean plants. Glob. Change Biol. 16, 3215–3222 (2010). 100. Watson, J. E. M. & Segan, D. B.Accommodating the human response for realistic adaptation planning: response to Gillson. et al. Trends Ecol. Evol. 28, 573–574 (2013). 101. Rodríguez-Sánchez, F. & Arroyo, J. Reconstructing the demise of Tethyan plants: climate-driven range dynamics of Laurus since the Pliocene. Glob. Ecol. Biogeogr. 17, 685–695 (2008). 102. Lawler, J. J., White, D., Neilson, R. P. & Blaustein, A. R. Predicting climateinduced range shifts: model differences and model reliability. Glob. Change Biol. 12, 1568–1584 (2006). 103. Hole, D. G. et al. Projected impacts of climate change on a continent-wide protected area network. Ecol. Lett. 12, 420–431 (2009). 104. Guralnick, R. Differential effects of past climate warming on mountain and flatland species distributions: a multispecies North American mammal assessment. Glob. Ecol. Biogeogr. 16, 14–23 (2007). 105. Midgley, G. F., Hannah, L., Millar, D., Rutherford, M. C. & Powrie, L. W. Assessing the vulnerability of species richness to anthropogenic climate change in a biodiversity hotspot. Glob. Ecol. Biogeogr. 11, 445–451 (2002). 106. Waltari, E. et al. Locating pleistocene refugia: comparing phylogeographic and ecological niche model predictions. PLoS One 2, e563 (2007). 107. Johnston, K. M. J., Reund, K. A. F. & Schmitz, O. J. S. Projected range shifting by montane mammals under climate change: implications for Cascadia’s National Parks. Ecosphere 3, 1–51 (2012). 224
108. Schwartz, M. W., Iverson, L. R., Prasad, A. M., Matthews, S. N. & O’Connor R. J. Predicting extinctions as a result of climate change. Ecology 87, 1611–1615 (2006). 109. Guisan, A. & Theurillat, J. Assessing alpine plant vulnerability to climate change: a modeling perspective. Integr. Assess. 1, 307–320 (2001). 110. Svenning, J., Normand, S. & Skov, F. Postglacial dispersal limitation of widespread forest plant species in nemoral Europe. Ecography 31, 316–326 (2008). 111. Molnár, P. K., Derocher, A. E., Thiemann, G. W. & Lewis, M. A. Predicting survival, reproduction and abundance of polar bears under climate change. Biol. Conserv. 143, 1612–1622 (2010). 112. Saltz, D., Rubenstein, D. I. & White, G. C. The impact of increased environmental stochasticity due to climate change on the dynamics of asiatic wild ass. Conserv. Biol. 20, 1402–1409 (2006). 113. Sunday, J. M., Bates, A. E. & Dulvy, N. K. Thermal tolerance and the global redistribution of animals. Nature Clim. Change 2, 686–690 (2012). 114. Aiello-Lammens, M. E. et al. The impact of sea-level rise on Snowy Plovers in Florida: integrating geomorphological, habitat, and metapopulation models. Glob. Change Biol. 17, 3644–3654 (2011). 115. Beerling, D. J. Ecophysiological responses of woody plants to past CO2 concentrations. Tree Physiol. 16, 389–396 (1996). 116. Huntley, B. et al. Beyond bioclimatic envelopes: dynamic species’ range and abundance modelling in the context of climatic change. Ecography 33, 621–626 (2010). 117. Kearney, M. et al. Modelling species distributions without using species distributions: the cane toad in Australia under current and future climates. Ecography (Cop.). 31, 423–434 (2008). 118. Blois, J. L. & Hadly, E. A. Mammalian response to Cenozoic cimatic change. Annu. Rev. Earth Planet. Sci. 37, 181–208 (2009). 119. Chin, A., Kyne, P. M., Walker, T. I. & McAuley, R. B. An integrated risk assessment for climate change: analysing the vulnerability of sharks and rays on Australia’s Great Barrier Reef. Glob. Change Biol. 16, 1936–1953 (2010). 120. Davison, J. E. et al. Bringing indices of species vulnerability to climate change into geographic space: an assessment across the Coronado national forest. Biodivers. Conserv. 21, 189–204 (2011). 121. Blois, J. L., McGuire, J. L. & Hadly, E. A. Small mammal diversity loss in response to late-Pleistocene climatic change. Nature 465, 771–774 (2010). 122. Finch, D. M., Friggens, M. M., Bagne, K. E., Coe, S. J. & Hawksworth, D. L. Vulnerability of Individual Species to Climate Change: Vertebrate Species of the Middle Rio Grande (US Department of Agriculture, 2010). 123. New, M., Lister, D., Hulme, M. & Makin, I. A high-resolution data set of surface climate over global land areas. Clim. Res. 21, 1–25 (2002). 124. Hijmans, R. J., Cameron, S. E., Parra, J. L., Jones, P. G. & Jarvis, A. Very high resolution interpolated climate surfaces for global land areas. Int. J. Climatol. 25, 1965–1978 (2005). 125. Sekercioğlu, C. H., Daily, G. C. & Ehrlich, P. R. Ecosystem consequences of bird declines. Proc. Natl Acad. Sci. USA 101, 18042–18047 (2004). 126. Jones, K. E. et al. PanTHERIA: a species-level database of life history, ecology, and geography of extant and recently extinct mammals. Ecology 90, 2648 (2009). 127. Sodhi, N. S. et al. Measuring the meltdown: drivers of global amphibian extinction and decline. PLoS One 3, e1636 (2008). 128. Martin, T. G. et al. Eliciting expert knowledge in conservation science. Conserv. Biol. 26, 29–38 (2012). 129. Flockhart, D. T. T., Pichancourt, J-B., Norris, D. R., Martin, T. G. Unravelling the annual cycle in a migratory animal: breeding-season habitat loss drives population declines of monarch butterflies. J. Anim. Ecol. 84, 155–165 (2014).
Acknowledgements
This review was partially supported by the National Science Foundation under Grant No. (1136586).
Author contributions
M.P., P.V., C.R., J.E.M.W. and W.B.F. designed the framework for the review. All authors contributed to the writing, discussed the results and commented on the manuscript.
Additional information
Supplementary information is available in the online version of the paper. Reprints and permissions information is available online at www.nature.com/reprints. Correspondence should be addressed to M.P.
Competing financial interests
The authors declare no competing financial interests. NATURE CLIMATE CHANGE | VOL 5 | MARCH 2015 | www.nature.com/natureclimatechange
© 2015 Macmillan Publishers Limited. All rights reserved
NATURE CLIMATE CHANGE DOI: 10.1038/NCLIMATE2448
REVIEW ARTICLE
Michela Pacifici1,2*, Wendy B. Foden2,3, Piero Visconti1,4, James E. M. Watson2,5,6, Stuart H.M. Butchart2,7, Kit M. Kovacs2,8, Brett R. Scheffers2,9, David G. Hole2,10, Tara G. Martin2,11,12, H. Resit Akçakaya2,13, Richard T. Corlett2,14, Brian Huntley2,15, David Bickford2,16, Jamie A. Carr2,17, Ary A. Hoffmann2,18, Guy F. Midgley2,19, Paul Pearce-Kelly2,20, Richard G. Pearson2,21, Stephen E. Williams2,9, Stephen G. Willis15, Bruce Young2,22 and Carlo Rondinini1,2 Global Mammal Assessment program, Department of Biology and Biotechnologies, Sapienza Università di Roma, Viale dell’Università 32, I-00185 Rome, Italy. 2Climate Change Specialist Group, Species Survival Commission, IUCN, 28 rue Mauverney, Gland CH-1196, Switzerland. 3School of Animal, Plant and Environmental Sciences, University of the Witwatersrand, Johannesburg, Wits 2050, South Africa. 4Microsoft Research Computational Science Laboratory, 21 Station Road, Cambridge CB1 FB, UK. 5School of Geography, Planning and Environmental Management, University of Queensland, Brisbane, Queensland 4072, Australia. 6Global Conservation Program, Wildlife Conservation Society, 2300 Southern Boulevard, Bronx, New York 10460, USA. 7 BirdLife International, Wellbrook Court, Girton Road, Cambridge CB3 0NA, UK. 8Norwegian Polar Institute, FRAM Centre, 9296 Tromsø, Norway. 9Centre for Tropical Biodiversity and Climate Change, School of Marine and Tropical Biology, James Cook University of North Queensland, Townsville, Queensland 4811, Australia. 10Science & Knowledge Division, Conservation International, 2011 Crystal Drive, Suite 500, Arlington, Virginia 22202, USA. 11ARC Centre of Excellence for Environmental Decisions, NERP Environmental Decisions Hub, Centre for Biodiversity and Conservation Science, University of Queensland, Brisbane, Queensland 4072, Australia. 12CSIRO Land and Water, Ecosciences Precinct, Dutton Park, Brisbane, Queensland 4102, Australia. 13Department of Ecology and Evolution, Stony Brook University, Stony Brook, New York 11794, USA. 14Center for Integrative Conservation, Xishuangbanna Tropical Botanical Gardens, Chinese Academy of Sciences, Yunnan 666303, China. 15School of Biological and Biomedical Sciences, Durham University, South Road, Durham DH1 3LE, UK. 16Department of Biological Sciences, National University of Singapore, 14 Science Drive 4, 117543, Singapore. 17Climate Change Unit, IUCN Global Species Programme, 189 Huntingdon Road, Cambridge CB3 0DL, UK. 18Department of Genetics, Bio21 Institute, University of Melbourne, Victoria 3010, Australia. 19Africa Department of Botany and Zoology, University of Stellenbosch, P/Bag X1, Matieland, 7602 Stellenbosch, South Africa. 20 Zoological Society of London, Regent’s Park, London NW1 4RY, UK. 21Centre for Biodiversity & Environment Research, Department of Genetics, Evolution & Environment, University College London, Gower Street, London WC1E 6BT, UK. 22NatureServe, 4600 N. Fairfax Drive, Arlington, Virginia 22203, USA. *e-mail
[email protected] 1
NATURE CLIMATE CHANGE | VOL 5 | MARCH 2015 | www.nature.com/natureclimatechange
© 2015 Macmillan Publishers Limited. All rights reserved
225