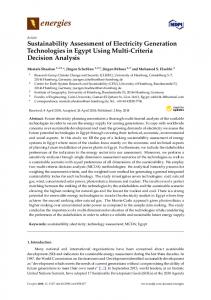
energies Article
Assessing the Environmental Sustainability of Electricity Generation in Turkey on a Life Cycle Basis Burcin Atilgan and Adisa Azapagic * Received: 23 October 2015; Accepted: 29 December 2015; Published: 7 January 2016 Academic Editor: Vasilis Fthenakis School of Chemical Engineering and Analytical Science, The University of Manchester, The Mill, Room C16, Sackville Street, Manchester M13 9PL, UK;
[email protected] * Correspondence:
[email protected]; Tel.: +44-0-161-306-4363
Abstract: Turkey’s electricity mix is dominated by fossil fuels, but the country has ambitious future targets for renewable and nuclear energy. At present, environmental impacts of electricity generation in Turkey are unknown so this paper represents a first attempt to fill this knowledge gap. Taking a life cycle approach, the study considers eleven impacts from electricity generation over the period 1990–2014. All 516 power plants currently operational in Turkey are assessed: lignite, hard coal, natural gas, hydro, onshore wind and geothermal. The results show that the annual impacts from electricity have been going up steadily over the period, increasing by 2–9 times, with the global warming potential being higher by a factor of five. This is due to a four-fold increase in electricity demand and a growing share of fossil fuels. The impact trends per unit of electricity generated differ from those for the annual impacts, with only four impacts being higher today than in 1990, including the global warming potential. Most other impacts are lower from 35% to two times. These findings demonstrate the need for diversifying the electricity mix by increasing the share of domestically-abundant renewable resources, such as geothermal, wind, and solar energy. Keywords: electricity generation; environmental impacts; life cycle assessment; Turkey
1. Introduction With its young population, fast growing economy and industrialisation, Turkey has become one of the fastest growing energy markets in the world. Its energy demand has been increasing rapidly over the past few decades, rising almost six-fold in the period between 1970 and 2010 [1,2]. The demand for electricity has also followed this trend. In 2010, the total installed capacity of 49,524 MW generated 211,208 GWh of electricity, four times more than in 1990 [3]. However, only 43% of the demand is met by domestic energy resources (lignite, hydropower, geothermal and wind) with the rest of electricity generated by imported fuels (hard coal and natural gas) [4]. As a result, Turkey has become dependent on other countries for the supplies of fuels, particularly natural gas, which provides 46.5% of electricity (see Figure 1). In 2010, around 98% of the country’s natural gas demand was met through imports, mainly from Russia [5]. At current production levels (730 million m3 in 2010), Turkey has the equivalent of only nine years of domestic gas reserves remaining [5]. There are currently 187 gas power plants with 18,213 MW of installed capacity, which, in 2010, generated 98,144 GWh [4]. The majority of the installations are combined cycle power plants [6]. The next most significant fuel is coal which supplies 26% of electricity [4]. Turkey has significant coal reserves with lignite being much more abundant than hard coal: 10.8 billion tonnes vs. 515 million tonnes of proven reserves, respectively [7]. However, most of Turkish lignite is of low quality with poor calorific value and high sulphur content. Hard coal is also of low grade, but of cokeable or semi-cokeable quality. In 2010, total coal production reached 73.4 Mt of which 69.7 Mt was lignite,
Energies 2016, 9, 31; doi:10.3390/en9010031
www.mdpi.com/journal/energies
Energies 2016, 9, 31
2 of 24
2.5 Mt hard coal and 1.2 Mt asphaltite [7]. By comparison, 24.3 Mt were imported, of which 60% from Russia and Colombia and 40% from the USA and South Africa [7]. There are 16 lignite and eight hard coal plants in Turkey, with the total installed capacity of 11,891 MW, which generated 55,046 GWh Energies 2016, 9, 31 of electricity in 2010 [4]; the majority (65%) of this was from the lignite plants. Around 85% of the capacity is based on pulverised coal and the rest on circulating fluidised bed installations. which 60% from Russia and Colombia and 40% from the USA and South Africa [7]. There are 16 lignite In to coal gas plants and coal, the contribution oil power hasMW, beenwhich declining over the andcontrast eight hard in Turkey, with the totalfrom installed capacityplants of 11,891 generated years,55,046 and today almost no oil power plants remain in Turkey, as most have been converted to natural GWh of electricity in 2010 [4]; the majority (65%) of this was from the lignite plants. Around gas combined power plants [6]. 85% of thecycle capacity is based on pulverised coal and the rest on circulating fluidised bed installations. In contrast to gas and coal, the is contribution from power plants has been adeclining the The contribution of hydropower close to that of oil coal, providing around quarter over of electricity years, and theoretically-viable today almost no oil power plants remain in Turkey, as is most have been converted to [8]. (Figure 1). The hydroelectric potential of Turkey estimated at 433 TWh/year natural gas combined cycle power plants [6]. Almost half of this is technically and nearly 30% economically exploitable [8]. Currently, there are The contribution of hydropower is close to that of coal, providing around a quarter of electricity 55 reservoir and 205 run-of-river plants with the total installed capacity of 15,831 MW, generating on (Figure 1). The theoretically-viable hydroelectric potential of Turkey is estimated at 433 TWh/year [8]. average 51,795 GWh per year. Almost half of this is technically and nearly 30% economically exploitable [8]. Currently, there are 55 The onlyand other of renewable the electricity mix in on Turkey reservoir 205sources run-of-river plants withenergy the totalavailable installed present capacity in of 15,831 MW, generating are wind and geothermal, providing 1.4% and 0.3% of the total, respectively. Turkey has a good average 51,795 GWh per year. wind potential, estimated at 48,000 MW with an annual capacity of 130 The only other sources of renewable energy availableproduction present in the electricity mix TWh/year in Turkey [9]. Thereare arewind currently 39 onshore providing wind power plants with an installed capacity of 1320 MWhas that produced and geothermal, 1.4% and 0.3% of the total, respectively. Turkey a good at 48,000 MWindividual with an annual production of 130 2916 wind GWhpotential, in 2010. estimated The capacity of the turbines varies capacity from 0.85 to 3TWh/year MW. At [9]. present, There are currently 39 onshore wind power plants with an installed capacity of 1320 MW that there are no offshore wind turbines in Turkey. producedon 2916 in 2010. The capacity the individual turbines from 0.85 to in 3 the MW.world Located the GWh Alpine–Himalayan tectonicofbelt, Turkey is one of thevaries richest countries At present, there are no offshore wind turbines in Turkey. in terms of geothermal energy resources, with an estimated capacity of 31,500 MW [9]. However, Located on the Alpine–Himalayan tectonic belt, Turkey is one of the richest countries in the the majority of this (88%) has the temperature below 200 ˝ C, which is less suitable for electricity world in terms of geothermal energy resources, with an estimated capacity of 31,500 MW [9]. generation (unless an organic Rankine system is used) below but is 200 still °C, useful forisdirect use as heat However, the majority of this (88%)cycle has the temperature which less suitable for [10]. Thus,electricity there aregeneration only six geothermal powerRankine plants cycle in Turkey the installed 94.2 MW (unless an organic systemwith is used) but is stillcapacity useful forofdirect whichuse generated 668 GWh 2010 [3]. as heat [10]. Thus, in there are only six geothermal power plants in Turkey with the installed As a result of MW the high of fossil fuels,inthe capacity of 94.2 whichshare generated 668 GWh 2010direct [3]. greenhouse gas (GHG) emissions from As a result of the high share of fossil fuels, the direct greenhouse gas2010, (GHG) emissionsoffrom electricity (largely from burning fossil fuels) reached 99 Mt CO2 -eq. in a quarter the total electricity (largely fossil fuels) reached Mt CO2-eq.tointhe 2010, a quarter of the(Annex total national emissions in from that burning year [11]. Since Turkey is 99 a signatory Kyoto Protocol I), national emissions in that year [11]. Since Turkey is a signatory to the Kyoto Protocol (Annex I), it is important that it identifies sustainable energy technologies suitable for the country to reduce the it is important that it identifies sustainable energy technologies suitable for the country to reduce the GHG emissions and other environmental impacts from the electricity sector. However, environmental GHG emissions and other environmental impacts from the electricity sector. However, impacts from the electricity sector in Turkey are currently unknown and there is no baseline to help environmental impacts from the electricity sector in Turkey are currently unknown and there is no the country thecountry best way forward. baselineidentify to help the identify the best way forward. Wind Imported Coal, 1.4% Hard Coal, Asphaltite 9.1%
Liquid Fuels 1.0%
Geothermal 0.3%
Other renewables and waste 0.2% Natural Gas 46.5%
Lignite 17.0%
Hydro 24.5%
Figure 1. Share of different fuels in electricity generation in Turkey in 2010 [4].
Figure 1. Share of different fuels in electricity generation in Turkey in 2010 [4].
Therefore, this paper sets out to estimate the environmental impacts of electricity in Turkey on a life cycle basis over the last 25 years (1990–2014). Although many life cycle assessment (LCA) 2
Energies 2016, 9, 31
3 of 24
Therefore, this paper sets out to estimate the environmental impacts of electricity in Turkey on a life cycle basis over the last 25 years (1990–2014). Although many life cycle assessment (LCA) studies of different electricity technologies have been carried out elsewhere, as far as the authors are aware, there are no such studies for Turkey. The only exception is the previous work by Atilgan and Azapagic [12,13], but that only considered electricity from individual technologies rather than the whole electricity supply mix which is the focus of this work. Therefore, this is the first study of its kind for Turkey and the findings will provide an insight into the past trends and current environmental impacts of electricity generation, helping to identify opportunities for improving the environmental sustainability of the sector. A further feature is that each of the 516 plants currently present in the Turkish electricity system have been considered individually. This has seldom been the case in other studies, which typically use average values for different technologies. Some of the existing LCA studies relevant to the technologies present in Turkey’s electricity mix are summarised in Table 1. The results from these studies are compared to the current study later in the paper (Section 3.1). As can be seen in the table, the scope varied across the studies, including the type of technologies and environmental impacts considered. All studies, however, considered GHG emissions and the related global warming potential. Most also considered eutrophication, acidification and photochemical smog, except Kannan, et al. [14] who considered the global warming potential and energy and Weisser [15] who focused on the global warming potential alone. Most studies used the Institute of Environmental Sciences (CML) 2001 method [16] to estimate the impacts. The same method has been applied in the current study, which considers 11 environmental categories, as discussed in the next sections. 2. Methods The study has been carried out according to the LCA methodological guidelines in the International Organization for Standardization (ISO) 14040 and 14044 standards [17,18]. The LCA modelling has been carried out in GaBi v.6 [19]. Table 1. Some life cycle assessment (LCA) studies of electricity generation. Aim and Scope of the Study
Technologies
Country
Environmental Impacts
Reference
Life cycle energy use, GWP and cost assessment of gas fired combined cycle plant
Natural gas
Singapore
Global warming, energy use
[14]
Life cycle greenhouse gas emissions from electric supply technologies
Lignite, hard coal, oil, natural gas, nuclear, CCS, hydro, wind, solar PV, biomass, energy storage
Not specified
Global warming
[15]
Setting up life cycle models for the environmental analysis of hydropower generation, considering technical and climatic boundary conditions
Run-of-river, storage and pumped storage hydro
Germany
Global warming, acidification, eutrophication, photochemical smog, energy demand
[20]
LCA of carbon dioxide capture and storage from lignite power plants
Pulverised coal (PC), PC with CO2 capture, Integrated gasification combined cycle (IGCC), IGCC with CO2 capture, oxyfuel plant with CO2 capture
Germany
Global warming, energy demand, photochemical smog, eutrophication, acidification
[21]
[22]
[23]
LCA of a 2 MW rated power wind turbine
Onshore wind
Spain
Global warming, resource depletion, ecotoxicity, ozone layer depletion, acidification, eutrophication, photochemical smog, human toxicity
LCA of mini-hydropower plants
Run-of-river hydro
Thailand
Global warming, resource depletion, acidification, human toxicity, photochemical smog, water ecotoxicity
Energies 2016, 9, 31
4 of 24
Table 1. Cont. Aim and Scope of the Study
LCA of electricity generation
LCA of the wind turbines
LCA of a hydroelectric power
Life cycle sustainability assessment of electricity generation
Technologies
Nuclear, coal, natural gas, oil, renewables
Onshore wind
Run-of-river hydro
Nuclear, coal, natural gas, offshore wind, solar PV
Country
Environmental Impacts
Reference
Mexico
Global warming, ecotoxicity, ozone layer depletion, acidification, eutrophication, photochemical smog, human toxicity, resource depletion
[24]
Spain
Global warming, ecotoxicity, ozone layer depletion, acidification, eutrophication, photochemical smog, human toxicity, resource depletion
[25]
Thailand
Global warming, ecotoxicity, ozone layer depletion, acidification, eutrophication, photochemical smog, resource depletion
[26]
UK
Global warming, ozone layer depletion, acidification, eutrophication, photochemical smog, land use, ecotoxicity, human toxicity, resource depletion
[27]
[28]
LCA of 1 kWh generated by a Gamesa onshore wind farm
Onshore wind
Europe
Cumulative energy demand, global warming, summer smog, ecotoxicity, eutrophication, acidification, human toxicity, land use
Life cycle data for hydroelectric generation at Embretsfoss 4 power station
Run-of-river hydro
Norway
Global warming, acidification, eutrophication, photochemical smog, ozone layer depletion, waste
[29]
Life cycle data for hydroelectricity from Trollheim power station
Reservoir hydro
Norway
Global warming, acidification, eutrophication, photochemical smog, ozone layer depletion, waste
[30]
Not specified
Global warming, ecotoxicity, ozone layer depletion, acidification, eutrophication, photochemical smog, human toxicity, resource depletion
[31]
[32]
[33]
Life cycle assessment of electricity from an onshore V90-3.0 MW wind plant
Onshore wind
Life cycle assessment of wind power
Onshore wind
Not specified
Global warming, ecotoxicity, ozone layer depletion, acidification, eutrophication, photochemical smog, human toxicity, resource depletion
LCA of a wind plant
Onshore wind
France
Resource depletion, acidification, eutrophication, global warming, photochemical smog
The CML 2001 method [16], November 2010 update, has been used to estimate the following impacts: abiotic depletion potential (ADP elements and fossil), acidification potential (AP), eutrophication potential (EP), fresh water aquatic ecotoxicity potential (FAETP), global warming potential (GWP), human toxicity potential (HTP), marine aquatic ecotoxicity potential (MAETP), ozone layer depletion potential (ODP), photochemical oxidants creation potential (POCP) and terrestrial ecotoxicity potential (TETP). The goal of the study, key assumptions and data sources are detailed in the following sections. 2.1. Goal and Scope Definition The goal of the study has been to estimate life cycle environmental impacts of electricity generation in Turkey and to identify improvement opportunities for the future. To enable that, the impacts of the
Energies 2016, 9, 31
2.1. Goal and Scope Definition
Energies 2016, 9, 31
5 of 24
The goal of the study has been to estimate life cycle environmental impacts of electricity generation in Turkey and to identify improvement opportunities for the future. To enable that, the individual plants had to be plants estimated these purposes, haspurposes, been chosen the been base impacts of power the individual power hadfirst. to beFor estimated first. For2010 these 2010ashas year because most complete data were available for the individual plants for that year. In addition to chosen as the base year because most complete data were available for the individual plants for that this, impacts have been for electricity generation over the generation past 25 years, year.the In addition to this, theestimated impacts have been estimated for electricity overcovering the pastthe 25 period from 1990 to 2014, to identify the impact trends and find out whether the electricity sector is years, covering the period from 1990 to 2014, to identify the impact trends and find out whether the becoming more or less environmentally sustainable. electricity sector is becoming more or less environmentally sustainable. The The first first is is defined defined as as “generation “generation of of 11 kWh kWh of of The study study is is based based on on two two functional functional units. units. The electricity” to enable comparisons of the impacts for individual electricity technologies as well as for electricity” to enable comparisons of the impacts for individual electricity technologies as well as for different The second second functional functional unit unit is is defined defined as annual different electricity electricity mixes mixes for for over over the the period. period. The as the the “total “total annual electricity generation” to estimate the total annual impacts from electricity over the last 25 years. electricity generation” to estimate the total annual impacts from electricity over the last 25 years. As considers allall thethe options present in the electricity mix: As indicated indicated in inFigure Figure2,2,the thestudy study considers options present in Turkish the Turkish electricity coal, hydro small-scale run-of-river), and geothermal. The scope is from mix: gas, coal, gas,(largehydroand (largeand reservoir, small-scale reservoir, wind run-of-river), wind and geothermal. “cradle to grave”, comprising the extraction, processing and transport of fuels (where relevant) and raw The scope is from “cradle to grave”, comprising the extraction, processing and transport of fuels materials as well as the construction, operation and decommissioning of power plants. Since the focus (where relevant) and raw materials as well as the construction, operation and decommissioning of of the work is on electricity generation, its transmission, distribution andits consumption aredistribution outside the power plants. Since the focus of the work is on electricity generation, transmission, system boundary. and consumption are outside the system boundary. Plant construction Coal supply
Coal
Mining and processing
Transport and storage
Coal power plant operation Plant decommissioning
Plant construction Natural gas supply
Natural gas
Extraction and processing
Transport and distribution
Natural gas power plant operation Plant decommissioning
Plant construction
Hydro
Hydropower plant operation
Hydro energy
ELECTRICITY
Plant decommissioning
Wind turbine construction
Wind
Wind turbine operation
Wind energy
Wind turbine decommissioning
Plant construction
Geothermal
Geothermal plant operation
Geothermal energy
Plant decommissioning
Figure 2. The power. The life life cycles cycles of of electricity from coal, natural gas, hydro, wind and geothermal power.
5
Energies 2016, 9, 31
6 of 24
2.2. Inventory Data In 2010, 211,208 GWh of electricity were generated by a total of 516 power plants, specifically, by 16 lignite, eight hard coal, 187 gas, 55 reservoir and 205 run-of-river hydropower, 39 wind and six geothermal installations. All of these plants are considered in this study (see Table 2 and Supplementary information). The key assumptions are summarised in Tables 3 and 4 with further details provided below. Table 2. Power plants in Turkey (2010). Type of Power Plant Lignite Hard coal a Natural gas Large-reservoir hydropower (capacity > 500 MW) Small-reservoir hydropower (capacity < 500 MW) Run-of-river hydropower Onshore wind Geothermal Total
Number of Plants
Installed Capacity (MW)
Annual Generation (GWh/yr)
16 8 187
8140 3751 18,213
35,942 19,104 98,144
8
8459
30,583
47
4608
13,885
205
2764
7327
39 6
1320 94
2916 668
516
47,349 (49,524) b
208,569 (211,208) c
a
Hard coal type power plant includes hard coal, imported coal and asphaltite power plants in Turkey. b The total installed capacity in 2010 was 49,524 MW. The difference from the installed capacity shown in the table is due to multi-fuel, liquid fuel and other renewable-waste plants not included in the table. c The total generation was 211,208 GWh. The difference from the generation shown in the table is due to liquid fuel and other renewable-waste plants not included in the table. However, the total actual electricity generation has been used to estimate the impacts from electricity mix.
Table 3. The amount of fuels used for electricity generation in 2010 [12]. Natural Gas (million m3 )
Hard Coal (million tonnes)
Lignite (million tonnes)
Transport Distances (km) Gas a Hard Coal b
Domestic fuel Imported fuel Russia Iran Azerbaijan Algeria Nigeria USA South Africa Other
-
0.20
55.89
-
-
9921 4383 2551 2205 671 1738
4.45 c 1.48 1.48 -
-
5750 2700 1150 4000 4500 1750
5000 10,500 13,000 -
Total
21,469
7.61
55.89
19,850
28,500
a
Transport by pipeline. Total weighted average distance of 4000 km used for LCA modelling, taking into account the amounts of gas imported from each country as listed in the table. b Russia: 4500 km by rail, 500 km by shipping; USA: 1000 km by rail, 9500 km by shipping; South Africa: 500 km by rail, 12,500 km by shipping. c This includes the amount of hard coal imported from Colombia but as there are no LCA data for the Colombian coal, the LCA impacts from the Russian coal have been used instead.
2.2.1. Electricity from Fossil Fuels Detailed data have been available for each lignite and hard coal power plants so that each has been modelled separately based on the data in Tables S1 and S2 in Supplementary information. For the
Energies 2016, 9, 31
7 of 24
natural gas plants, data availability has been more limited. Therefore, an average efficiency of 55% has been assumed for all the gas plants; this matches the average efficiency of the combined cycle gas turbine (CCGT) plants for which the data have been available but also the efficiency of the plants in Turkey reported by IEA and NEA [34] as well as some other sources [35]. Specific data have not been available for the auto-producer plants; as mentioned earlier, they are not connected to the grid but generate electricity for own consumption. However, the total generation from these plants has been considered. The data for the coal and natural gas power installations (Tables S1–S3 in Supplementary information) have been used together with the fuel composition data (Table 4) to estimate the emissions from each plant using GEMIS 4.8 software [36]. These have then been combined with the other inventory data in Tables 3 and 4 to estimate the life cycle impacts from the power plants in GaBi. The background life cycle inventory data have been sourced from Ecoinvent v2.2 [37] but have been adapted as far as possible to Turkey’s conditions. 2.2.2. Electricity from Renewables The data for the hydropower plants and onshore wind turbines are summarised in Tables 2 and 4; for details for the individual plants see Tables S4–S7 in Supplementary information. The background inventory data for hydropower have been sourced from the Ecoinvent v2.2 [37,38] and ESU [39] databases. Since the data for construction materials for reservoir plants in the databases correspond to a different size to the ones considered here, it has been necessary to apply some scaling of the impacts to reflect the difference in the size of the installations. Typically in LCA, this is carried out by assuming a linear relationship between the size of the plant and its impacts. However, in reality, the relationship is non-linear. To account for this, the “six-tenths” approach has been applied [40]. This method is typically used to estimate costs of different plant sizes accounting for the “economies of scale”, i.e., larger plants cost less to build per unit of capacity than smaller installations. The same analogy has been applied to the impacts, which would also be lower per unit of installed capacity for bigger than smaller plants. Thus, the impacts have been scaled according to the following relationship: ˆ E2 “ E1 ˆ
C2 C1
˙0.6 (1)
where: E1 : environmental impacts of the larger plant E2 : environmental impacts of the smaller plant C1 : capacity of the larger plant C2 : capacity of the smaller plant 0.6: the “six-tenths” scaling factor. The construction materials for the hydro plants are assumed to be transported for 200 km by rail and 100 km by lorry (see Table 4). At the end of its service life, the plants are dismantled and components are recycled using the assumed recycling rates given in Table 4. The inventory data for onshore wind turbines have been sourced from [41] based on the Vestas V80 2 MW turbine. The size of the turbine has been scaled down from 2 MW using Equation (1) to match the average turbine size in Turkey of 1.94 MW (see Table 4). The construction materials are assumed to be transported 100 km by lorry and 100 km by rail. The turbines are imported into Turkey from Europe, assuming an average distance of 2000 km by rail and a further 150 km by lorry to the installation locations in Turkey. At the end of life, the turbine construction materials are recycled as specified in Table 4. Detailed data for the geothermal plants have not been available so that the LCA data have been taken directly from the GaBi database [19]. The only dataset available is for a 30 MW flash-steam plant with an annual electricity generation of 250 GWh. The data are aggregated so that it has not
Energies 2016, 9, 31
8 of 24
been possible to adapt them to Turkey-specific conditions. However, as geothermal power contributes only 0.3% of the total electricity (see Figure 1), this limitation is not deemed significant. Moreover, the database model is representative of the standard, widely-used type of geothermal plant. The total annual environmental impacts for the base year have been calculated based on the impacts of all the options present in the Turkish electricity mix, their share in the electricity mix and the total electricity generation in 2010. The same approach has been applied across all the other years considered in this work. To model the electricity mix in Turkey over the period, the following assumptions have been made: ‚
‚
the contribution of the liquid-fuel power plants to the total generation of electricity is small and for simplicity has been substituted with the equivalent amount of electricity generated by the gas power plants; the data on the specific technologies for other renewables and waste have not been available. As their contribution to the total electricity generation is small, they have been substituted by small-reservoir hydropower.
It has also been assumed that there were no technology changes over the period considered, using the characteristics of technologies in 2010 to model the impacts for the previous years. This is arguably a reasonable assumption as fossil and hydro-technologies are well established and have long lifetimes so that no technological changes would be expected over the period. Wind and geothermal are less well established, but their contribution to the total generation in the earlier years was negligible ( 16 tonne: 100 km Turbine: Freight train: 2000 km; Lorry > 16 tonne: 150 km Maintenance: Passenger car: 100 p.km/year
Energies 2016, 9, 31
10 of 24
Table 4. Cont. Coal
Gas
Hydropower
Wind
Plant Construction Large reservoir: Lifetime: 30 years d
•
Lignite:
• •
Data from Ecoinvent e based on average size of the plant of 380 MW (a mix of 500 MW and 100 MW plants in a 70:30 ratio)
•
Lifetime: 25 years d Data from Ecoinvent assuming 400 MW plant
Life time: 150 years e,f Large reservoir Data based on Ecoinvent e,g with average size of 175.6 MW plant and scaled up to 1057 MW plant
Small reservoir: •
Hard coal: Data from Ecoinvent e based on average size of the plant of 460 MW (a mix of 500 MW and 100 MW plants at the 90:10 ratio)
•
• • •
• •
Lifetime: 40 years for fixed parts and 20 years for moving parts e Number of turbines: 682
Data based on the average size of 2 MW turbine h and scaled down to the average size of 1.94 MW
Data based on ESU f with average size of 95 MW plant and scaled up to 98 MW plant
Run-of-river: •
Life time: 80 years e,f Data based on ESU f for the average size of 8.6 MW plant and scaled up to 13.5 MW plant
Plant Operation Large reservoir: •
See Table 3 for details
Lignite: •
• •
All plants assumed to be CCGT with efficiency of 55% Average water use: 3.4 kg/kWh
Average water use: 37.3 kg/kWh
•
Lubricating oil: 7 mg/kWh
Lubricating oil: 43.1 mg/kWh
• • •
Metals: 50% recycled, 50% landfilled Concrete: 50% recycled, 50% landfilled Plastics: 20% recycled, 80% landfilled
Small reservoir: •
Lubricating oil: 0.03 mg/kWh
Hard coal:
Run-of-river:
•
•
Lubricating oil: 0.12 mg/kWh
• • •
Metals: 50% recycled, 50% landfilled Concrete: 50% recycled, 50% landfilled Plastics: 20% recycled, 80% landfilled
Average water use: 32.7 kg/kWh
•
Plant Decommissioning i • • •
Metals: 50% recycled, 50% landfilled Concrete: 50% recycled, 50% landfilled Plastics: 20% recycled, 80% landfilled a f
• • •
Metals: 50% recycled, 50% landfilled Concrete: 50% recycled, 50% landfilled Plastics: 20% recycled, 80% landfilled
Based on data from different mines and countries. b Estimated by using online mapping. c It is assumed that gravel is extracted at the construction site. Source: [39]. g Source: [38]. h Source: [41]. i The system has been credited for recycling. The recycling rates are assumed due to a lack of data.
d
Source: [42]. e Source: [37].
Energies 2016, 9, 31 Energies 2016, 9, 31
11 of 24
Large reservoir
Run-of-river
Geothermal
92
Wind
15.1
16
Smal reservoir
6,391 1,388
Gas
2,091 364
Hard coal
1,185 230
Lignite
13.5
13.9
15
12.5
14
10.8
12
10.0
11
10.6 11.3
11.6
13
8.8
8.8
10
7.6
8.1
9
6.7
6.9
8 6.0
7
4.8
5.0
6
3.9 1.9 0.3 0.1 0.1 0.2 0.7 0.001
0.02 0.01 0.02 0.04 0.01
0.1 0.1 0.2 0.5
1.8
1.9
3.3
3.5 0.5
0.7
0.1 0.02 0.05 0.1 0.2 0.01
0.1 0.04 0.04 0.1 0.6
1.7
2.1 1.1 0.4
1.5 0.1
0.1 0.3 0.6
0.8 0.003 0.007 0.02 0.03
0.01 0.02 0.04 0.1 0.02
0.002
2.4
2.1 0.5
1
1.2
2
0.3
3
2.0
4
3.0
3.5
5
0 ADP elements x ADP fossil [MJ] AP [g SO2-eq.] 0.01 [mg Sbeq.]
EP x 0.01 [g FAETP [g DCB- GWP x 0.1 [kg HTP x 0.1 [kg PO4-eq.] eq.] CO2-eq.] DCB-eq.]
MAETP [kg DCB-eq.]
ODP [μg R11- POCP x 0.1 [g TETP [g DCBC2H4-eq.] eq.] eq.]
Figure 3. Environmental impacts for different electricity options in Turkey. [All [All impacts expressed per kWh of electricity generated. The values shown on top each Figure 3. Environmental impacts for different electricity options in Turkey. impacts expressed per kWh of electricity generated. The values shown onoftop of bar represent the total impact after the recycling credits for the plant construction materials have been taken into account. Some values have been rounded off and may each bar represent the total impact after the recycling credits for the plant construction materials have been taken into account. Some values have been rounded off not correspond to those quoted text. ADP:inAbiotic depletion of elements; ADP Abiotic depletion of fossil; AP: Acidification potential; EP: Eutrophication and mayexactly not correspond exactly in to the those quoted the text. ADP: Abiotic depletion offossil: elements; ADP fossil: Abiotic depletion of fossil; AP: Acidification potential; potential; FAETP: Fresh water aquatic GWP: Global warming HTP: Human toxicity MAETP: MarineMAETP: aquatic Marine ecotoxicity EP: Eutrophication potential; FAETP: ecotoxicity Fresh waterpotential; aquatic ecotoxicity potential; GWP:potential; Global warming potential; HTP:potential; Human toxicity potential; potential; ODP: Ozone layer depletion potential; POCP: Photochemical oxidants creation potential; TETP: Terrestrial ecotoxicity potential.]. aquatic ecotoxicity potential; ODP: Ozone layer depletion potential; POCP: Photochemical oxidants creation potential; TETP: Terrestrial ecotoxicity potential.].
12
Energies 2016, 9, 31
12 of 24
Energies 2016, 9, 31
Lignite - current study
Hard coal - current study
Gas - current study
Lignite, hard coal and gas - literature
2.4 2.2 2.0 1.8 1.6 1.4 1.2 1.0
0.8 0.6 0.4 0.2 0.0 ADP ADP fossil AP x 0.1 elements x x 10 [MJ] [kg SO20.1 [mg Sbeq.] eq.]
EP x 0.1 FAETP x GWP [kg HTP [kg MAETP x ODP x 0.1 POCP [g TETP x 0.1 [kg PO410 [kg CO2-eq.] DCB-eq.] 10 [t DCB- [mg R11- C2H4-eq.] [kg DCBeq.] DCB-eq.] eq.] eq.] eq.]
Figure 4. Comparison of the results from current study with literature for coal and gas. [All impacts Figure 4. Comparison of the results from current study with literature for coal and gas. [All impacts expressed per kWh of electricity generated. Literature data for lignite from [15], [19], [21] and [43]; expressed per kWh of electricity generated. Literature data for lignite from [15,19,21,43]; for hard coal for hard coal from [19], [27] and [43]; for natural gas from [14], [15], [19], [24], [27] and [43]. All from [19,27,43]; for natural gas from [14,15,19,24,27,43]. All impacts estimated using the CML 2001 impacts estimated using the CML 2001 method. For impacts nomenclature, see Figure 3.]. method. For impacts nomenclature, see Figure 3.].
Nevertheless, all the impacts estimated in this study for lignite and hard coal power are well Nevertheless, all the impacts estimated(Figure in this 4). study lignitefor andlignite hard coal powerthe areGWP well within the ranges reported in the literature For for example, electricity, within the ranges (Figure 4). For example, for lignite electricity, the GWP falls falls between 866reported and 1700ingthe COliterature 2-eq./kWh, which compares well with the estimate in this study of between 866 and 1700 g CO -eq./kWh, which compares with the estimate in this872 study 1062 g 2 1062 g CO2-eq./kWh. For hard coal, the GWP in the well literature ranges between andof1628 g CO -eq./kWh. For hard coal, the GWP in the literature ranges between 872 and 1628 g CO -eq./kWh 2 CO22-eq./kWh so that the value of 1126 g CO2-eq./kWh obtained in the current study is around the so that the value of 1126 g COagreement obtained in the current study is around the middle of the 2 -eq./kWhof middle of the range. A good the results is also found for gas electricity. For instance, range. A good agreement of the results is also found for gas electricity. For instance, the GWP reported the GWP reported in the literature is between 383 and 996 g CO2-eq./kWh, and, in this work, it is in the literature between 383 and 996 g CO2 -eq./kWh, and, in this work, it is estimated at 499 g estimated at 499 is g CO 2-eq./kWh. CO2 -eq./kWh. There are only four LCA studies of reservoir hydropower plants so that comparison with the Thereisare only four LCA studies of reservoir hydropower plants soEP, thatODP, comparison with the literature limited. As shown in Figure 5, the results for the GWP, AP, POCP and TETP literature is limited. shown in Figure 5, the for the GWP, AP, EP, the ODP, POCP TETP are comparable to theAslower values reported in results the literature. For example, GWP fallsand between are comparable to the lower values reported in the literature. For example, the GWP falls between 2.7 and 11.6 g CO2-eq./kWh in the literature, which compares well to this study’s estimate of 6.9 g 2.7 11.6 g CO2 -eq./kWh in the literature, which compares well to this estimate of 6.9 g COand 2-eq./kWh for reservoir hydropower. On the other hand, the results forstudy’s the ADP elements and CO -eq./kWh for reservoir hydropower. On the other hand, the results for the ADP elements and 2 fossil, FAETP, HTP and MAETP are below the range of values in the literature. One of the reasons fossil, HTP below the and range of values in thewhich literature. One of the reasons for thisFAETP, could be theand veryMAETP differentare size of large small scale plants are not distinguished in for could be the very different size of large and small scale plants which are not distinguished in the this literature. the literature. All the impacts estimated in this study for run-of-river hydropower and wind electricity are the the impacts estimated study for run-of-river hydropower andGWP windfor electricity are well All within ranges reportedin bythis other authors (Figure 5). For example, the run-of-river well within the reported other authors (Figure 5). For example, the GWP for run-of-river hydropower is ranges between 0.3 andby5.2 g CO 2-eq./kWh, which compares well to the value of 4.1 g hydropower is between 0.3 and 5.2 g CO -eq./kWh, which compares well to the value 2 For onshore CO2-eq./kWh obtained in the current study. wind, the GWP ranges from 6.2 of to 4.1 31 g g CO -eq./kWh and obtained in the current study. work For onshore wind, the GWP ranges from 6.2 to 31 g CO22-eq./kWh, the estimate in the present is 7.3 g CO 2-eq./kWh. CO2 -eq./kWh, and the estimate in the present work is 7.3 g CO2 -eq./kWh.
13
Energies Energies 2016, 2016, 9, 9, 31 31
13 of 24
Reservoir - current study
Run-of-river - current study
Reservoir and run-of-river - literature
0.07
0.06
0.05
0.04
0.03
0.02
0.01
0 ADP ADP fossil AP x 0.01 EP [g FAETP GWP [kg HTP [kg MAETP [t ODP x 0.1 POCP [g TETP x elements [MJ] [kg SO2- PO4-eq.] [kg DCB- CO2-eq.] DCB-eq.] DCB-eq.] [mg R11- C2H4-eq.] 0.01 [kg [mg Sbeq.] eq.] eq.] DCB-eq.] eq.]
(a) Wind - current study
Wind - literature
0.5
0.4
0.3
0.2
0.1
0.0 ADP ADP fossil AP [g elements [MJ] SO2-eq] [mg Sbeq]
EP [g FAETP x GWP x HTP [kg MAETP [t ODP x POCP x TETP x PO4-eq] 0.1 [kg 0.1 [kg DCB-eq] DCB-eq] 0.01 [mg 0.1 [g 0.01 [kg DCB-eq] CO2-eq] R11-eq] C2H4-eq] DCB-eq]
(b) Figure 5. Comparison of the results from current study with literature for hydropower and wind Figure 5. Comparison of the results from current study with literature for hydropower and wind power. (a) Reservoir and run-of-river hydropower. (b) Onshore wind. [All impacts expressed per power. (a) Reservoir and run-of-river hydropower. (b) Onshore wind. [All impacts expressed per kWh kWh of electricity generated. The current study results for the reservoir hydropower present the of electricity generated. The current study results for the reservoir hydropower present the average average value for large and small reservoir. Literature data for reservoir from: [30], [43], [44]; for value for large and small reservoir. Literature data for reservoir from: [30,43,44]; for run-of-river run-of-river from: [20], [23], [26], [29], [43], [44], [45]; for onshore wind from [22], [25], [28], [31], [33] from: [20,23,26,29,43–45]; for onshore wind from [22,25,28,31,33,43]. All impacts estimated using the and [43]. All impacts estimated using the CML 2001 method. For impacts nomenclature, see Figure 3.]. CML 2001 method. For impacts nomenclature, see Figure 3.].
14
Energies 2016, 9, 31 Energies 2016, 9, 31
14 of 24
Environmental Impacts of Electricity Generated in the Base Year 3.2. Environmental basis for for the the estimates estimates of of impacts impacts in in the the other other years, years, these these results results Since the base year is used as a basis are discussed in more detail than for the rest of the period. Thus, the impacts for the base year are discussed in more detail than for the rest of the period. Thus, the impacts for the base year first are presented for the unit ofunit “1 kWh of electricity”, followed followed by the “total generation first presented forfunctional the functional of “1 kWh of electricity”, by annual the “total annual of electricity”. generation of electricity”. 3.2.1. Impacts Impacts per per kWh kWh 3.2.1. The impacts impacts per per kWh kWh of of electricity electricity generated generated in in 2010 2010 are are given given in in Figure Figure 6. 6. The The results results suggest suggest The that fossil fuels cause the majority of the impacts, with coal contributing 43%–54% to the depletion that fossil fuels cause the majority of the impacts, with coal contributing 43%–54% to the depletion of of elements fossil resources well theGWP; GWP;ititalso alsocauses causes84%–99% 84%–99%of of the the toxicity toxicity related related elements andand fossil resources as as well asasthe impacts. The The exception exception is is ozone ozone layer layer depletion, depletion, 98% 98% of of which which arises arises from from gas impacts. gas power. power. These results are discussed for each impact in more detail below. Note that that all all the the results results These results are discussed for each impact in more detail below. Note incorporate the the credits credits for for material material recycling recycling after incorporate after decommissioning decommissioning of of the the plants. plants. Lignite
Hard coal
Gas
Large reservoir
Small reservoir
Run-of-river
Wind
Geothermal
60 52.3 50
44.9 39.0
40
30
28.2
26.7
25.3 22.7
19.8 20 12.2
9.9
8.0
10
0.0
0 ADP [μg Sb-eq.]
ADP fossil AP x 0.1 [g EP x 0.1 [g FAETP x [MJ] SO2-eq.] PO4-eq.] 0.01 [kg DCB-eq.]
GWP x HTP x 0.01 MAETP x 0.01 [kg [kg DCB100 [kg CO2-eq.] eq.] DCB-eq.]
ODP [μg R11-eq.]
POCPx TETP x 0.1 0.01 [g [g DCB-eq.] C2H4-eq.]
Figure 6. Environmental impacts per kWh of electricity for the base year (2010). [For impacts Figure 6. Environmental impacts per kWh of electricity for the base year (2010). [For impacts nomenclature, see Figure 3.]. nomenclature, see Figure 3.].
Abiotic Depletion Potential Abiotic Depletion Potential The depletion of elements from electricity generation is estimated at 25.3 μg Sb-eq./kWh (Figure 6). The depletion of elements from electricity generation is estimated at 25.3 µg Sb-eq./kWh (Figure 6). Lignite, hard coal and natural gas power contribute 14%, 29% and 46% to the total, respectively. The Lignite, hard coal and natural gas power contribute 14%, 29% and 46% to the total, respectively. high contribution of hard coal, despite its small share in the electricity mix (9.1%) is due to its The high contribution of hard coal, despite its small share in the electricity mix (9.1%) is due to its long-range transport, which contributes 63% to the ADP of hard coal. By contrast, lignite is sourced long-range transport, which contributes 63% to the ADP of hard coal. By contrast, lignite is sourced domestically, so there are no impacts from transport. domestically, so there are no impacts from transport. The remaining contributions are from hydropower (8%) and wind power (4%); the impact from The remaining contributions are from hydropower (8%) and wind power (4%); the impact from geothermal power is negligible (0.1%). This impact is primarily due to the use of chromium, copper, geothermal power is negligible (0.1%). This impact is primarily due to the use of chromium, copper, molybdenum and nickel during the construction of the plants and fuel supply infrastructure. Coal molybdenum and nickel during the construction of the plants and fuel supply infrastructure. Coal and and gas also account for the majority (99.9%) of fossil resource depletion, equivalent to 8 MJ/kWh gas also account for the majority (99.9%) of fossil resource depletion, equivalent to 8 MJ/kWh (Figure 6). (Figure 6). Acidification and Eutrophication Potential Acidification and Eutrophication Potential The AP of 2.8 g SO2 -eq./kWh is mainly due to SO2 (82%) and N2 O (14%) emissions. The biggest The AP is of the 2.8 gelectricity SO2-eq./kWh mainly (66%) due tobecause SO2 (82%) 2O (14%) emissions. The biggest contributor fromis lignite of and the N high sulphur content and a lack contributor is the electricity lignite because of second the high sulphur content and a lackcoal of of desulphurisation systemsfrom at some of (66%) the plants. The biggest contributor is hard desulphurisation systems at some of the plants. The second biggest contributor is hard coal power power (20%). (20%).
15
Energies 2016, 9, 31
15 of 24
Lignite is also the main cause of the EP, estimated at 2.3 g PO4 -eq./kWh, with the majority (87%) related to the emissions of phosphates during mining. As for the AP, the next biggest contributor is hard coal (9%). Ecotoxicity Potential All ecotoxicity related impacts (freshwater, marine and terrestrial) are also caused mainly by lignite power. For the FAETP, equivalent to 0.39 kg DCB-eq./kWh, 91% is due to the emissions of nickel, beryllium, cobalt and vanadium during mining. In the case of the MAETP, estimated at 1.2 t DCB-eq./kWh, the emissions to water of beryllium (40%) and hydrogen fluoride to air (33%) are the main burdens contributing to this impact. Finally, lignite contributes 66% to the TETP of 0.1 g DCB-eq./kWh, mainly because of the emissions of mercury (~75%). Global Warming Potential The global warming potential for the electricity mix in Turkey is estimated at 523 g CO2 -eq./kWh. Emissions of CO2 account for 92% of the total, with CH4 contributing 7% and N2 O 1%. The main source of the GHG emissions is the combustion of coal and natural gas in power plants. The renewables contribute only 0.4% to the total GWP (Figure 6). Human Toxicity Potential Like ecotoxicity, this impact is also mainly due to lignite mining (88%). The main burdens contributing to the HTP of 267 g DCB-eq./kWh include emissions of selenium (36%) and hydrogen fluoride (11%). Ozone Layer Depletion Potential The ODP is estimated at 45 µg R11-eq./kWh. The single largest contributor (98%) is electricity from gas. As mentioned earlier, it is mainly due to leakages of halon 1211 and halon 1301 used as fire suppressants and coolants in the life cycle of gas. Photochemical Oxidants Creation Potential This impact is equal to 198 mg C2 H4 -eq./kWh with 41%, 15% and 43% arising from lignite, hard coal and gas power plants, respectively. The main contributing burdens include SO2 (47%), non-methane volatile organic compounds (32%) and N2 O (11%). 3.2.2. Total Annual Impacts As can be seen from Figure 7, lignite and hard coal power contribute together more than 40% to most of the impacts in the base year, despite providing only a quarter of the total electricity. The exception is ozone layer depletion which is almost entirely (98%) from gas power, which generates 46.5% of electricity. The renewables, which supply around 27% of the demand, add 0.04%–12% to the impacts, mainly related to hydropower because of its high share in the mix (24.5%). The total GWP is estimated at 111 Mt CO2 -eq., 54% of which is due to coal and 46% to gas power. The estimated direct CO2 emissions (emitted from the power plants as opposed to the life cycle emissions) are equal to 92 Mt CO2 -eq. This is in good agreement with the total direct emissions of 99 Mt CO2 -eq. from the whole Turkish electricity sector in 2010 [11]. The slight difference between the two estimates stems from different assumptions, including plant efficiencies and the amount of fuel used in different power plants.
Energies 2016, 9, 31
16 of 24
Energies 2016, 9, 31 120
Energies 2016, 9, 31
110.5
120 100
94.8
110.5 82.3
100 80
94.8 82.3
59.6
80 60
56.5
53.2 47.9 59.6
60 40
41.8
56.5
53.2 47.9
40 20
25.7
41.8
20.9
16.8 25.7 20.9
20 0
16.8 ADP x 100 ADP fossil AP x 10 [kt EP x 10 [kt FAETP [Mt GWP [Mt [kg Sb-eq.] x 100 [PJ] SO2-eq.] PO4-eq.] DCB-eq.] CO2-eq.]
HTP [Mt DCB-eq.]
MAETP x ODP x 100 POCP [kt TETP x 10 10 [Gt [kg R11- C2H4-eq.] [kt DCBDCB-eq.] eq.] eq.]
ADP x 100 ADP fossil AP x 10 [kt EP x 10 [kt FAETP [Mt GWP [Mt
HTP [Mt
MAETP x ODP x 100 POCP [kt TETP x 10
0
Figure 7.Sb-eq.] Totalx 100 annual the base year (2010). nomenclature, [PJ] environmental SO2-eq.] PO4-eq.] impacts DCB-eq.] for DCB-eq.] 10 [Gt [For [kgimpacts R11- C2H4-eq.] [kt DCBFigure 7. [kg Total annual environmental impacts forCO2-eq.] the base year DCB-eq.] (2010). [For impacts nomenclature, eq.] eq.] see Figure 3.].
see Figure 3.].
Figure 7. Total annual environmental impacts for the base year (2010). [For impacts nomenclature,
To put these results into context, they have been normalised to the annual impacts in the see Figure 3.]. European Union comprising 28 countries (EU28). Asnormalised indicated intoFigure 8, Turkish electricity To put these results into context, they have been the annual impacts in thesector European contributes almost 5% to the depletion of fossil fuels and 2% to the GWP relative to these impacts in To put these results into context, have been normalised to the annual impacts in the Union comprising 28 countries (EU28). Asthey indicated in Figure 8, Turkish electricity sector contributes the EU28 countries. The contribution to the AP, EPAs POCP isinalso significant, fromsector European Union comprising 28 countries (EU28). indicated Figure 8, electricity almost 5% to the depletion of fossil fuels and 2% toand the GWP relative toTurkish theseranging impacts in 3.5% the EU28 for the former to 2.4% for thedepletion latter. Theofcontribution of the ADP elements and ODP is small (0.1%). contributes almost 5% to the fossil fuels and 2% to the GWP relative to these impacts in the countries. The contribution to the AP, EP and POCP is also significant, ranging from 3.5% for However, these results should be interpreted with care for at least two reasons: first, the from base 3.5% year the EU28 countries. The contribution to the AP, EP and POCP is also significant, ranging former to 2.4% for the latter. The contribution of the ADP elements and ODP isthe small (0.1%). However, for impacts 2000 latest available in the of CML year (0.1%). here is for the the EU28 former to 2.4%isfor the(the latter. The contribution the 2001 ADPmethod) elementswhile and ODPbase is small these2010; results should be interpreted with for at least two reasons: first,uncertainty the base year for the secondly, impacts but the GWP care for the EU28 with high andyear are However, theseall results should be interpreted with careare forassociated at least two reasons: first, the base EU28likely impacts is 2000 (the latest available in the CML 2001 method) while the base year here is 2010; theavailable toxicity-related categories [46,47], while whichthe is base the reason why for theunderestimated, EU28 impacts is particularly 2000 (the latest in the CML 2001 method) year here is secondly, all impacts the GWP for the for EU28 associated withwith highhigh uncertainty and they not been considered the normalised results. 2010;have secondly, allbut impacts butin the GWP the are EU28 are associated uncertainty andare arelikely
underestimated, particularly the toxicity-related categories [46,47],[46,47], which which is the reason why they likely underestimated, particularly the toxicity-related categories is the reason why have 5.0 4.8 not been considered in the normalised results. they have not been considered in the normalised results. impacts (%) to EU28(%) Contribution to EU28 impacts Contribution
4.5 5.0 4.0
4.8 3.5
4.5 3.5 4.0 3.0
3.5
2.6
3.5 2.5
2.4 2.1
3.0 2.0
2.6
2.5 1.5
2.4 2.1
2.0 1.0 1.5 0.5
0.5
0.1
0.1
1.0 0.0
ADP elements 0.1
ADP fossil
AP
EP
GWP
ODP
POCP
0.1
0.0
ADP impacts ADPfrom fossilelectricity AP generationEP GWP ODP POCP to Figure 8. Annual in Turkey in the base year (2010) normalised elements the annual EU28 impacts. [EU28: the European Union with 28 countries. All data for the EU28 impacts are for the year 2000, the latest available data in the CML 2001 method. For impacts Figure 8. Annual impacts from electricity generation in Turkey in the base year (2010) normalised to Figure 8. Annual impacts from nomenclature, see Figure 3.]. electricity generation in Turkey in the base year (2010) normalised to the annual EU28 impacts. [EU28: the European Union with 28 countries. All data for the EU28 the annual EU28 impacts. [EU28: the European Union with 28 countries. All data for the EU28 impacts impacts are for the year 2000, the latest available data in the CML 2001 method. For impacts are for the year 2000, the latest available data in the CML 2001 method. For impacts nomenclature, nomenclature, see Figure 3.]. 17
see Figure 3.].
17
Energies 2016, 9, 31
17 of 24
3.3. Environmental Impacts from Electricity Generation from 1990–2014 The total annual environmental impacts from the electricity mix in Turkey over the period have been calculated based on the impacts of different technologies presented in Section 3.1, their contribution to electricity generation in a particular year and the total electricity generation in that year. The results are summarised in Figure 9; for brevity, they only show the impacts for selective years in five-year intervals: 1990, 1995, 2000, 2005, 2010 and 2014 (data for 2015 were not available at the time of writing). Figure 9 also shows the generation mix for each of the years considered. In 1990, total generation was 57 TWh and in 2014 it reached 250 TWh, representing a four-fold increase over the period. During this time, the electricity mix has also changed. In the past, it was mainly based on lignite, gas and reservoir hydropower but, over time, the contribution of other sources grew. For example, the share of hard coal (mainly imported) increased from 0.6 TWh in 1990 to 36.7 TWh in 2014. Since 2005, there has also been an increase in the share of renewables, mainly run-of-river hydropower (to 5% in 2014) and onshore wind (to 3%). The reservoir hydropower generation was reduced by almost a half in 2000 compared to 1995 and by another half in 2014 compared to 2010 because of severe drought; the shortfall in electricity generation was made up by gas power. It can be noticed from Figure 9 that the annual impacts have been going up steadily over the period, increasing from two times (EP, HTP, FAETP and MAETP) to nine-fold (ODP). The GWP increased by five-fold, from 28.7 Mt CO2 -eq. in 1990 to 143 Mt CO2 -eq. in 2014. This is largely due to a growing electricity demand, although for some impacts the rate of increase is higher than the demand growth, including the GWP, because of the higher rate of growth of fossil-fuel electricity. The only exception to the trend are the reductions in the EP, FAETP, HTP and MAETP in 2005 on the previous period as a result of a decrease in the share of lignite power. The latter, together with hard coal and gas dominate all the impacts because of their dominance in the generation mix, with coal providing 26%–35% and gas 18%–48% of electricity across the years. The impact trends per kWh are less uniform than for the total annual impacts because they depend on the electricity mix only. On the other hand, the annual impacts also depend on the amount of electricity generated and increase proportionally to the demand. Although, in general, most impacts are higher for the fossil fuel options, some impacts are also high for the renewables (e.g., ADP for wind power; see Figure 3) so that their contribution to the total impacts from the electricity mix may be disproportionate to their share in the mix. The upward trend is found for four impacts: ADP elements and ODP, which are two times higher in 2014 than in 1990, and ADP fossil and GWP, which increased by 13% in the same period. The increase in the depletion of elements is due to the growth in renewable electricity generation because wind and hydropower have high resource requirements per kWh of electricity generated. The other three impacts have increased because of the increasing share of fossil fuels; for example, the share of gas increased from 25% in 1990 to 50% in 2014, leading to the significant increase in the ODP. Some impacts were also affected by the low hydropower generation during the drought in 2000 and 2014, with the GWP, ADP fossil, ODP and POCP having the highest values per kWh in these two years. For example, the GWP in 2000 was 550 g CO2 -eq./kWh, 13% higher than in 1995. In 2014, it was 570 g CO2 -eq./kWh or 8% higher than in 2010, despite an overall 4% increase in the share of other renewables. However, the opposite trend is found for the remaining impacts, with the EP, FAETP, HTP and MAETP being two times lower, the TETP 40% and AP 34% smaller at the end of the period than in 1990. This is a result of the increase in natural gas and renewables in the mix. The only exception is the POCP, which remained more or less unchanged over the period. This is because of the cancelling effects of the change over time of the share of coal and gas in the mix and the difference in their respective POCP: lignite and hard coal have 1.8–2.7 times higher impact than gas but their contribution to power generation reduced by 20% from 1990 to 2014 while the contribution of gas doubled.
Energies 2016, 9, 31 Energies 2016, 9, 31
18 of 24
Lignite
Hard coal
Gas
Reservoir
Run-of-river
Wind
Geothermal
300 9
Lignite
Hard coal
Gas
Reservoir
Run-of-river
Wind
Geothermal
per kWh
8
7
200
0.03
t Sb-eq./year
6
150
100
5
0.02 4 3 0.01
2
50 1 0
0 2000
2005
2010
0.00
1990
2014
1995
2000
2005
(a)
(b) 2.5
Lignite
Hard coal
Gas
Reservoir
Run-of-river
Wind
Geothermal
per kWh
9 8
2
7 6
1.5 5 4 1 3 2
0.5
1 0
0 1990
1995
2000
2005
(c) Figure Figure 9. 9. Cont. Cont.
18
2010
2014
MJ/kWh
1995
EJ/year
1990
2010
2014
mg Sb-eq./kWh
250
TWh
0.04
Energies 2016, 9, 31 Energies 2016, 9, 31
19 of 24
800
Lignite
Hard coal
Gas
Reservoir
Lignite
Hard coal
Gas
Reservoir
Run-of-river
Wind
Geothermal
per kWh
Run-of-river
Wind
Geothermal
per kWh
600
5
5
700
500
4
4
2
300
3 300 2 200
200 1
1
100
100 0
0 1995
2000
2005
2010
0
2014
0 1990
1995
2000
(d)
2005
(e) 100
Lignite
Hard coal
Gas
Reservoir
Run-of-river
Wind
Geothermal
per kWh
90
800 700
80 600 70 500
60 50
400
40
300
30 200 20 100
10 0
0 1990
1995
2000
2005
(f) Figure 9. 9. Cont. Cont. Figure
19
2010
2014
g DCB-eq./kWh
1990
2010
2014
g PO4-eq./kWh
400
400 kt PO4-eq./year
3
g SO2-eq./kWh
500
Mt DCB-eq./year
kt SO2-eq./year
600
Energies 2016, 9, 31
20 of 24
Energies 2016, 9, 31 Lignite
Hard coal
Gas
Reservoir
Run-of-river
Wind
Geothermal
per kWh
70
600
140
Hard coal
Gas
Reservoir
Run-of-river
Wind
Geothermal
per kWh
60
500 120
600
500
50
80
300
400 Mt DCB-eq./year
100
g CO2-eq./kWh
400
60 200
40 300 30
200 20
40 100
0
0
0
1995
2000
2005
2010
0 1990
2014
1995
2000
(g)
2005
(h) Lignite Run-of-river
Hard coal Wind
Gas Geothermal
Reservoir per kWh
300
2.5
250
2.0
200 Gt DCB-eq./year
1990
100
10
20
1.5 150 1.0
100 0.5
50
0
0.0 1990
1995
2000
2005
(i) Figure 9. Cont. Figure 9. Cont.
20
2010
2014
t DCB-eq,/kWh
Mt CO2-eq./year
Lignite
2010
2014
g DCB-eq./kWh
160
Energies 2016, 9, 31 Energies 2016, 9, 31
21 of 24
14
Lignite
Hard coal
Gas
Reservoir
Lignite
Hard coal
Gas
Reservoir
Run-of-river
Wind
Geothermal
per kWh
Run-of-river
Wind
Geothermal
per kWh
0.05
60
12
0.3
50
0.04
6
0.02
0.2
30
20
g C2H4-eq./kWh
8
40 kt C2H4-eq./year
0.03
mg R11-eq./kWh
t R11-eq./year
10
0.1
4 0.01
10
2
0
0.00 1990
1995
2000
2005
2010
0
0.0 1990
2014
1995
2000
(j)
2005
2010
2014
(k) 300
Lignite
Hard coal
Gas
Reservoir
Run-of-river
Wind
Geothermal
per kWh
1.6 1.4
250
kt DCB-eq./year
1.0 150
0.8
g DCB-eq./kWh
1.2 200
0.6
100 0.4 50
0.2 0
0.0 1990
1995
2000
2005
2010
2014
(l) Figure 9. Environmental impacts of of electricity ininTurkey for total total annual annualgeneration generationand andper perkWh. kWh.(a)(a) Electricity generation mix in Turkey; Figure 9. Environmental impacts electricity Turkeyininthe the period period 1990–2014 1990–2014 for Electricity generation mix in Turkey; (b) (b) ADP elements; (c) ADP fossil; (d) (d) AP;AP; (e) EP; (f) FAETP; (g) (g) GWP; (h)(h) HTP; (i) MAETP; (j) ODP; (k)(k) POCP; (l) (l) TETP. [For impacts nomenclature, seesee Figure 3.].3.]. ADP elements; (c) ADP fossil; (e) EP; (f) FAETP; GWP; HTP; (i) MAETP; (j) ODP; POCP; TETP. [For impacts nomenclature, Figure
21
Energies 2016, 9, 31
22 of 24
4. Conclusions This study has estimated for the first time the life cycle environmental impacts of electricity generation in Turkey for the period 1990–2014. Eleven impacts have been considered for 516 power plants using lignite, hard coal, natural gas, hydro (large and small scale reservoir hydro and run-of-river), onshore wind and geothermal energy. The impacts have been estimated per kWh and for the total amount of electricity generated annually over the period. The results suggest that, in comparison to the other options, lignite power has the highest impacts for eight out of eleven categories. Gas power is the worst option for ozone layer depletion. Geothermal electricity scores the best for six impacts (eutrophication, ozone layer depletion and all the toxicity categories). Large-reservoir hydropower has the lowest depletion of elements and fossil resources as well as acidification. Run-of-river is the best option for the global warming potential. The annual impacts have been going up steadily over the period, increasing from two times (EP, HTP, FAETP and MAETP) to nine-fold (ODP); the GWP increased by a factor of five. This is due to meeting the growing demand by fossil fuels. The trends per unit of electricity generated are less uniform than for the annual impacts. The upward trend is found for four impacts only: ADP elements and ODP, which are two times higher in 2014 than in 1990, and ADP fossil and GWP, which increased by 13% in the same period. However, the opposite trend is found for the other impacts, with the EP, FAETP, HTP and MAETP being two times lower, the TETP 40% and AP 34% smaller at the end of the period than in 1990. The only exception is the POCP, which remained more or less unchanged. As a signatory to the Kyoto Protocol, it is important that Turkey identified more sustainable pathways for future electricity supply. Being a developing country, it is likely that the demand will continue to grow. Therefore, the key question is how to decouple the expected demand growth with the environmental impacts. The results of this work show that reducing the share of coal in the electricity mix would lead to significant reductions in GHG emissions as well as the other impacts such as acidification, eutrophication and all the toxicity categories. This could be achieved in the short term by expanding the natural gas capacity; however, both ozone layer depletion and energy dependency on other countries would increase. Given the great potential of renewable energies in Turkey, the expansion of renewables should be pursued more aggressively in the medium to long term. Among the renewable energy sources, hydro, onshore wind and geothermal power are well established in Turkey and have a large potential for development. However, increasing the proportion of onshore wind power in the electricity mix would increase depletion of elements while increasing the share of geothermal power would increase acidification. As the results show, hydropower options would lead to a reduction in the environmental impacts; however, that would be at the expense of some other impacts not included in this study, such as biodiversity and land use. Other renewables such as solar power could play a role in the future given that solar energy is abundant in Turkey. The country is also trying to introduce nuclear power, which would help to reduce GHG emissions, but it raises various other concerns, such as human health impacts from radiation, risk of accidents and long-term storage of nuclear waste. The findings from this work have provided an insight into the previously unknown environmental impacts of electricity generation in Turkey, helping to identify opportunities for future improvements. However, in addition to the environmental sustainability evaluated here, it is also important to understand various economic and social aspects to help the industry and policy makers in Turkey identify and implement most sustainable electricity options for the future. This is the subject of a forthcoming paper by the authors. Supplementary Materials: The following are available online at www.mdpi.com/1996-1073/9/1/31/s1. Acknowledgments: This work was funded by the Republic of Turkey Ministry of National Education and the UK Engineering and Physical Sciences Research Council, EPSRC (Grant no. EP/K011820/1). This funding is gratefully acknowledged. Author Contributions: Adisa Azapagic conceived and supervised the research. Burcin Atilgan collected the data and carried out the LCA study. Adisa Azapagic and Burcin Atilgan co-wrote the paper.
Energies 2016, 9, 31
23 of 24
Conflicts of Interest: The authors declare no conflict of interest.
References 1. 2. 3. 4. 5. 6. 7. 8. 9. 10. 11. 12. 13. 14. 15. 16.
17. 18. 19. 20. 21. 22. 23. 24. 25. 26.
MENR. Mavi Kitap (Blue Book); Ministry of Energy and Natural Resources: Ankara, Turkey, 2012; pp. 20–69. WEC. Turkey Energy Balance Table (1970–2004). Available online: http://www.dektmk.org.tr/incele. php?id=MTQ3 (accessed on 13 April 2014). TEIAS. Electricity Generation & Transmission Statistics of Turkey. Available online: http://www.teias.gov.tr/ TurkiyeElektrikIstatistikleri.aspx (accessed on 2 June 2014). EUAS. Annual Report; Turkish Electricity Generation Company (EUAS): Ankara, Turkey, 2011. TPAO. The Oil and Gas Sector Report of Turkey; Turkish Petroleum Corporation (TPAO): Ankara, Turkey, 2011; pp. 1–26. MMO. Turkiye'de Termik Santraller; Makina Muhendisleri Odasi: Ankara, Turkey, 2010; pp. 1–81. TKI. Lignite Sector Report of Turkey; General Directorate of Turkish Coal Enterprises (TKI): Ankara, Turkey, 2012; pp. 1–61. DSI, Turkey Water Report 2009. Available online: http://www2.dsi.gov.tr/english/pdf_files/TurkeyWater Report.pdf (accessed on 20 March 2012). EMRA. Data on Energy Potential of Turkey; Personel communication, 15.06.2014; Republic of Turkey Energy Market Regulatory Authority: Ankara, Turkey, 2014. Komurcu, M.I.; Akpinar, A. Importance of geothermal energy and its environmental effects in Turkey. Renew. Energy 2009, 34, 1611–1615. [CrossRef] FutureCamp. Baseline Emission Calculations, Verified Carbon Standard (VCS); Version 3; FutureCamp: Ankara, Turkey, 2011. Atilgan, B.; Azapagic, A. Life cycle environmental impacts of electricity from fossil fuels in Turkey. J. Clean. Prod. 2015, 106, 555–564. [CrossRef] Atilgan, B.; Azapagic, A. Renewable electricity in Turkey: Life cycle environmental impacts. Renew. Energy 2015. in press. [CrossRef] Kannan, R.; Leong, K.C.; Osman, R.; Ho, H.K.; Tso, C.P. Gas fired combined cycle plant in Singapore: Energy use, GWP and cost and Life cycle approach. Energy Convers. Manag. 2005, 46, 2145–2157. [CrossRef] Weisser, D. A guide to life-cycle greenhouse gas (GHG) emissions from electric supply technologies. Energy 2007, 32, 1543–1559. [CrossRef] Guinée, J.B.; Gorrée, M.; Heijungs, R.; Huppes, G.; Kleijn, R.; Koning, A. Life Cycle Assessment: An Operational Guide to the ISO Standards: Part 2a; Ministry of Housing, Spatial Planning and Environment (VROM) and Centre of Environmental Science (CML): Den Haag and Leiden, The Netherlands, 2001. International Standard Organization (ISO). Life Cycle Assessment—Requirements and Guidelines; ISO: Geneva, Switzerland, 2006. International Standard Organization (ISO). Life Cycle Assessment—Principles and Framework; ISO: Geneva, Switzerland, 2006. PE International. GaBi version 6; PE International: Stuttgart, Echterdingen, Germany, 2013. Schuller, O.; Albrecht, S. Setting up Life Cycle Models for the Environmental Analysis of Hydropower Generation, Considering Technical and Climatic Boundary Conditions; Life Cycle Assessment VIII: Seattle, WA, USA, 2008. Pehnt, M.; Henkel, J. Life cycle assessment of carbondioxide capture and storage from lignite power plants. Int. J. Greenh. Gas Control 2009, 3, 49–66. [CrossRef] Martínez, E.; Sanz, F.; Pellegrini, S.; Jiménez, E.; Blanco, J. Life-cycle assessment of a 2 MW rated power wind turbine: CML method. Int. J. Life Cycle Assess. 2009, 14, 52–63. [CrossRef] Suwanit, W.; Gheewala, S. Life cycle assessment of mini-hydropower plants in Thailand. Int. J. Life Cycle Assess. 2011, 16, 849–858. [CrossRef] Santoyo-Castelazo, E.; Gujba, H.; Azapagic, A. Life cycle assessment of electricity generation in Mexico. Energy 2011, 36, 1488–1499. [CrossRef] Lahuerta, F.; Saenz, E. Life cycle assessment of the wind turbines installed in Spain until 2008. In Proceedings of the Europe’s Premier Wind Energy Conference and Exhibition, Brussels, Belgium, 14–17 March 2011. Pascale, A.; Urmee, T.; Moore, A. Life cycle assessment of a community hydroelectric power system in rural Thailand. Renew. Energy 2011, 36, 2799–2808. [CrossRef]
Energies 2016, 9, 31
27. 28. 29.
30. 31. 32. 33. 34. 35. 36. 37.
38. 39. 40. 41.
42. 43. 44. 45. 46.
47.
24 of 24
Stamford, L.; Azapagic, A. Life cycle sustainability assessment of electricity options for the UK. Int. J. Energy Res. 2012, 36, 1263–1290. [CrossRef] Pereg, J.R.M.; Hoz, J.F. Life Cycle Assessment of 1 kWh Generated by a Gamesa Onshore Windfarm G90 2.0 MW; Gamesa: Zamudio (Vizcaya), Spain, 2013. Arnøy, S.; Modahl, I.S. Life Cycle data for Hydroelectric Generation at Embretsfoss 4 (E4) Power Station: Background Data for Life Cycle Assessment (LCA) and Environmental Product Declaration (EPD); Ostfold Research: Kråkerøy, Norway, 2013. Arnøy, S. Hydroelectricity from Trollheim Power Station; Østfoldforskning AS: Oslo, Norway, 2013. Garrett, P.; Rønde, K. Life Cycle Assessment of Electricity Production from an Onshore V90–3.0 MW Wind Plant; Vestas Wind Systems A/S: Aarhus, Denmark, 2013. Garrett, P.; Rønde, K. Life cycle assessment of wind power: Comprehensive results from a state-of-the-art approach. Int. J. Life Cycle Assess. 2013, 18, 37–48. [CrossRef] Palomo, B.; Gaillardon, B. Life Cycle Assessment of a French Wind Plant; Europe’s Premier Wind Energy Event: Barcelona, Spain, 2014. IEA/NEA. Projected Costs of Generating Electricity, 2005 Update; International Energy Agency and Nuclear Energy Agency: Paris, France, 2005. Aslanoglu, S.Y.; Koksal, M.A. Elektrik uretimine bagli karbondioksit emisyonunun bolgesel olarak belirlenmesi ve uzun donem tahmini. Hava Kirliligi Arastirma Derg. (HKAD) 2012, 1, 19–29. Öko Institute Global Emission Model for Integrated Systems (GEMIS) v.4.8. Available online: http://www.oeko.de/service/gemis/en/index.htm (accessed on 10 September 2012). Dones, R.; Bauer, C.; Bolliger, R.; Burger, B.; Faist Emmenegger, M.; Frischknecht, R.; Heck, T.; Jungbluth, N.; Röder, A.; Tuchschmid, M.; et al. Ecoinvent Report: Life Cycle Inventories of Energy Systems: Results for Current Systems in Switzerland and Other UCTE Countries; Swiss Centre for Life Cycle Inventories: Dübendorf, Switzerland, 2007. Bauer, C.; Bolliger, R. Ecoinvent Report: Wasserkraft; Swiss Centre for Life Cycle Inventories: Dübendorf, Switzerland, 2007. Flury, K.; Frischknecht, R. Life Cycle Inventories of Hydroelectric Power Generation, ESU Database; Öko-Institute e.V.: Uster, Switzerland, 2012. Coulson, J.M.; Sinnott, R.K.; Richardson, J.F. Coulson & Richardson's Chemical Engineering; Butterworth Heinemann Ltd.: Oxford, UK; Boston, MA, USA, 1993. Kouloumpis, V.; Stamford, L.; Azapagic, A. Decarbonising electricity supply: Is climate change mitigation going to be carried out at the expense of other environmental impacts? Sustain. Prod. Consum. 2015, 1, 1–21. [CrossRef] TEIAS. Turkiye Elektrik Enerjisi Uretim Planlama Calismasi (2012–2030); Turkish Electricity Transmission Corporation (TEIAS), Research Planning and Coordination Department: Ankara, Turkey, 2013. Swiss Centre for Life Cycle Inventories. Ecoinvent, Ecoinvent Database v2.2; Swiss Centre for Life Cycle Inventories: St. Gallen, Switzerland, 2010. ESU. ESU Database; Öko-Institute e.V., ESU-services Ltd.: Uster, Switzerland, 2012. Raadal, H.L.; Gagnon, L.; Modahl, I.S.; Hanssen, O.J. Life cycle greenhouse gas (GHG) emissions from the generation of wind and hydro power. Renew. Sustain. Energy Rev. 2011, 15, 3417–3422. [CrossRef] Benini, L.; Mancini, L.; Sala, S.; Manfredi, S.; Schau, E.M.; Pant, R. Normalisation Method and Data for Environmental Footprints; European Commission, Joint Research Centre, Institute for Environment and Sustainability: Ispra, Italy, 2014. Heijungs, R.; de Koning, A.; Lightart, T.; Korenromp, R. Improvement of LCA Characterisation Factors and LCA Practice for Metals; TNO Environment, Energy and Process Innovation, Netherlands Organisation for Applied Scientific Research: Apeldoorn, The Nertherland, 2004. © 2016 by the authors; licensee MDPI, Basel, Switzerland. This article is an open access article distributed under the terms and conditions of the Creative Commons by Attribution (CC-BY) license (http://creativecommons.org/licenses/by/4.0/).