Let Ii be the set of items rated by user Ui and Uj the set of users that rated item Ij. Let R be the sparse rating matrix, where rij is user Ui's rating of item Ij if present ...
Assessing the Value of Unrated Items in Collaborative Filtering J´erˆome Kunegis, Andreas Lommatzsch, Martin Mehlitz, S¸ahin Albayrak Technische Universit¨at Berlin DAI-Labor Ernst-Reuter-Platz 7, 10587 Berlin, Germany {kunegis,andreas.lommatzsch,martin.mehlitz,sahin.albayrak}@dai-labor.de
Abstract In collaborative filtering systems, a common technique is default voting. Unknown ratings are filled with a default value to alleviate the sparsity of rating databases. We show that the choice of that default value represents an assumption about the underlying prediction algorithm and dataset. In this paper, we empirically analyze the effect of a varying default value of unrated items on various memory-based collaborative rating prediction algorithms on different rating corpora, in order to understand the assumptions these algorithms make about the rating database and to recommend default values for them.
1. Introduction In collaborative filtering systems, users rate items they encounter. These items can be documents, movies, songs, etc. Ratings can be given by users explicitly such as with the five star scale [7] used by some websites or can be collected implicitly by monitoring the user’s actions such as recording the number of times a user has listened to a song [16]. The task of a collaborative filtering system usually consists of recommending unseen items that are potentially interesting to users. To implement a recommendation systemm unknown ratings have to be predicted for user-item pairs. Depending on the collaborative filtering system, ratings can have different meanings. Sometimes, ratings represent a grade of the regarded item on a scale, and there is a neutral rating value somewhere in the middle of that scale. In other cases, ratings are just counts, for instance the number of times a web document was viewed. In these cases, a missing rating has various meanings: In the first case, a missing rating cannot be interpreted with confidence as any specific value, because the rating is simply not known. In the second case, a missing rating is equivalent to a rating of zero.
Usually, rating databases are just sparsily filled. For this reason, many rating prediction algorithms use default voting: They fill missing ratings with a default value. This default value represents an assumption about the rating database: The assumption that missing ratings are best modeled by this specific value [6, 7]. The type of collaborative prediction algorithms analyzed in this paper are memory-based algorithms. They either work directly on the rating database, or on a preprocessed rating database: the normalized ratings. We analyze the impact of the default value on the accuracy of the resulting prediction algorithm. The empirical results of the analysis are then interpreted according to the underlying algorithm and corpus in order to verify the validate the assumption made in the default voting algorithms. The reminder of this paper is organized as follows. Section 2 introduces related background and an example case of a rating database. Section 3 gives an overview on common approaches to collaborative rating prediction. The algorithms used in the evaluation of this paper are presented in detail in Section 4. Section 5 presents the results of our evaluation, and a summary and an outlook on future work concludes this contribution in Section 6.
2. Definitions Let U = {U1 , U2 , . . . , Um } be the set of users and I = {I1 , I2 , . . . , In } the set of items. Let Ii be the set of items rated by user Ui and Uj the set of users that rated item Ij . Let R be the sparse rating matrix, where rij is user Ui ’s rating of item Ij if present or is undefined otherwise. r¯i is the mean of user Ui ’s ratings. If the mean applies to a subset of a user’s ratings, this will be mentioned separately. A rating is always calculated for a specific user and a specific item. These will be called the active user and the active item. Without loss of generality we will assume the active user is U1 and the active item is I1 Thus r11 is undefined and must be predicted. We will call the prediction
r˜11 . The range of possible ratings varies from dataset to dataset. In this paper all ratings will be scaled to continuous values in the range [−1, +1], in order for the accuracy of predictions to be comparable across the datasets. This scaling is necessary to compare relative errors of prediction algorithms on different rating datasets, assuming that the minimum and maximum possible ratings in each dataset are equivalent.
regression for this purpose. Other approaches that have been used in collaborative filtering include simple variations on the methods cited above [3, 5, 12], clustering and building neighborhoods [19], graph-theoretic approaches [1, 15, 10, 11], linear algebraic approaches [2, 8, 9], and probabilistic methods [20, 18, 17].
Table 1. A small example rating database. The rating (U1 , I1 ) is undefined and must be predicted. This example has only rating values of +1 and −1 but in general, ratings can take on any value in [−1, +1].
This section describes the collaborative prediction algorithms implemented for this paper’s evaluation, and gives a very brief overview of other collaborative filtering approaches. The simplest approach to predicting ratings is to take existing ratings of the active item by other users, and average them. The average is weighted by the similarity between users. The standard algorithm for predicting ratings is the memory-based prediction using the Pearson correlation. [3, 5] It consists of searching other users that have rated the active item, and calculating the weighted mean of their ratings of the active item. Let w(a, b) be a weighting function depending on users Ua and Ub ’s ratings, then we predict r11 by:
U1 U2 U3
I1 ? −1 +1
I2 +1 +1 −1
I3 +1 +1
I4 +1 −1
I5 −1 −1 −1
Table 1 shows an example of a rating database. Ratings not given are indicated by an empty cell. The rating to predict is indicated by a question mark.
4. Collaborative Prediction Algorithms
3. Related Work r˜11 This section gives an overview on collaborative prediction algorithms. The algorithms used in this paper will be described in detail in the next section. The most popular collaborative filtering algorithms predict ratings by averaging over other related ratings [5]. These memory-based algorithms keep part of the rating database itself in memory to calculate predictions. In contrast, model-based algorithms first preprocess the rating database to a condensed form [9, 14]. Memory-based algorithms can furthermore be classified into user-based and item-based algorithms. User-based algorithms take the user as the primary entity and regard items as relations between users. Item-based algorithms work analoguous using items. A variant of memory-based collaborative filtering consists of preprocessing the rating database according to a specific system. One possible methodology, which is used in this paper, consists of normalizing the ratings: Adapting them linearly such that values like the mean and variance take on the same values for all users or all items. The third approach analyzed in this paper is defined in [13] and is an alternative to normalization: Instead of adapting all ratings to normal values, we adapt them only pairwise when comparing two users (or two items in itembased filtering). The approach described in [13] uses linear
=
X
!−1
w(i, 1)
i
X
w(i, 1)ri1
(1)
i
The sums are over all users that have rated item I1 and have also rated items in common with user U1 . The weight w(i, 1) must be high if users Ui and U1 are similar and low of they are different. A function fulfilling this is the Pearson correlation between the two users’ ratings [5]: It is 1 when the ratings of both users correlate perfectly, zero when they don’t correlate and negative when they correlate negatively. The correlation between both users’ ratings is calculated by considering the ratings of items they have both rated: P ¯a )(rbj − r¯b ) j (raj − r (2) w(a, b) = qP P ¯a )2 j (rbj − r¯b )2 j (raj − r The sums are taken over Iab = Ia ∩ Ib , the set of items rated by both users. r¯a and r¯b are the mean ratings for users Ua and Ub taken over Iab .
4.1. Default Value Rating databases are usually sparse, therefore the correlation between two users may only be based on a small number of items rated in common. To overcome this problem, a variant of the weighted mean algorithm bases the
correlation on any item that has been rated by at least one of the two users, filling missing ratings. Given the default rating value ρ, we define the correlation as:
ρ
w (a, b)
=
P
qP
ρ j (raj
ρ j (raj
ρ − r¯a )(rbj − r¯b ) (3) P ρ − r¯b )2 − r¯a )2 j (rbj
With the sum going over all items at least one of both users ρ has rated. rab is defined as � rab when rab is defined ρ rab = ρ otherwise
all cases, we can construct an analogous item-based prediction algorithm by taking the average of other items’ ratings by the active user.
5. Evaluation We evaluate the variation of the default rating value on six memory-based collaborative filtering algorithms. For each algorithm, we implement both the user-based and the item-based variant. Using the two rating corpora MovieLens1 and Jester2 , we calculate two error measures: the mean average error and root mean squared error.
This method to overcome the sparsity problem of rating databases is sometimes called default voting.
5.1. Methodology
4.2. Normalization
The evaluation is done as follows: A user-item pair for which a rating is known is chosen at random from the corpus. This rating is removed from the corpus. We then run all algorithms on the remaining corpus, letting each predict the value of the rating removed. This procedure is repeated a certain number of times for each corpus. The number of tests was chosen to depend on the dataset, with a minimum of 1,500 runs. The error measures are those common in evaluating collaborative rating prediction algorithms [3, 14]. Let (Ua(i) , Ib(i) ) be the user-item pair in test run i for i ∈ {1, . . . , n}. The error measures are the mean average error (MAE) and the root mean squared error (RMSE):
A common addition to the weighted mean rating prediction is to normalize the rating database before making prediction. For each user, the ratings are scaled linearly to a mean of zero and unit variance. The predicted values are then scaled back to match the user’s original ratings. This approach is justified by observing that different users have different rating habits. On a scale from 1 to 5 for instance, one user may give the value 5 in half of his ratings, while another may reserve that value to a very few selected items [5]. Let r¯a be the mean and σa the standard deviation of all ratings of the form rai . We define the normalized rating ′ value rab : r¯ai
=
rai − r¯a σa
(4)
r¯ab is then used instead of rab in Equation (2). Since normalization makes the original rating scale invisible to the prediction algorithm, it is suitable as an evaluation method that gives insight into the rating database independently of the behaviour of specific users.
MAE RMSE
1 X ra(i)b(i) − r˜a(i)b(i) n i s �2 1X ra(i)b(i) − r˜a(i)b(i) = n i
=
(5) (6)
The six algorithms used are: • Pu, Pi: The plain Pearson correlation-weighted average of other users’ or items’ ratings. We use both the user-based and the item-based variant of Equation (1).
4.3. Pair Regression The pair regression-based variant of the weighted mean algorithm [13, 4] consist of adapting the ratings of other users’ ratings to the rating scale of the active. It makes normalization unneccessary, and can be thought of as a special form of user-specific normalization.
4.4. User-based vs Item-based All of the algorithms described above are user-based in that they take the point of view of the active user and compare the ratings of other users to the active user’s ratings. In
• Nu, Ni: The same algorithm as Pu and Pi, but with normalized ratings as defined in Equation (4). In the userbased case, the ratings are scaled linearly to zero mean and unit variance. The item-based algorithm works analogously using items. • Ru, Ri: The Pearson correlation-weighted mean of other user’s or item’s ratings, where ratings are adapted to the active user’s rating scale using multiple linear regression as defined in [13]. 1 http://movielens.umn.edu/ 2 http://www.ieor.berkeley.edu/∼goldberg/jester-data/
The parameter ρ which is used as the default value for ratings in all of the algorithms is varied in the interval [−1, +1] at a granularity depending on the rating corpus. The corpora we considered in our tests are MovieLens and Jester: • MovieLens contains 75, 700 ratings of 1, 543 movies by 943 users. MovieLens ratings are integers between 1 and 5. The rating matrix is filled to about 5%. • Jester contains 617, 000 ratings of 100 jokes by 24, 900 users. Jester ratings range from −10 to +10 with a granularity of 0.01. The rating matrix is filled to about 25%. In order to compare the test results on both datasets, we ignored any of the additional movie information provided by MovieLens such as movie genres.
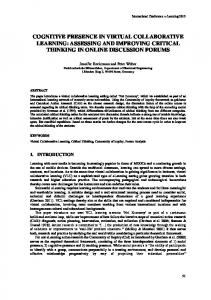
5.2. Evaluation Results The test results are shown in Figure 1. with one figure per algorithm-corpus combination. Table 2. summarizes the best values for ρ in function of the error measure used. There are several interesting observations: • The simple algorithms Pu/i give the best result for ρ ≈ 0 with good accuracy. The performance is however not convex, and gets better with values farther from 0 in some cases. In the case of the MovieLens corpus, we observe a peak in the error values at a default value of about −0.2. This peak can also be observed in the Ri-MovieLens case, although it is less marked. • Some combinations do not show a dependence on ρ: Nu/i (except Nu-MovieLens). This result suggests that the performance of this algorithm is independent of the particular optimization involving a default value. We explain this result by the fact that the normalization step will partly overcome the bias induced into the user’s ratings by using default values far from zero. • Ru/i shows mostly convex errors in function of ρ. The optimal value for ρ is zero or slightly positive. This result goes against the suggestion in [5] to use slightly negative values for ρ. Comparing the results of the Pu/i and Nu/i algorithms shows that normalizing the rating values is not always a gain. In all cases the performance with an optimal ρ is higher than in the non-normalized case.
6. Conclusion We evaluated three common collaborative rating prediction algorithms that use default voting under the variation
of the default rating parameter which represents an assumption about missing rating values. This rating value is a parameter of all algorithms, and is used to fill missing data in rating databases at different points in the rating prediction algorithm, depending on the algorithm. We showed that depending on the choice of this parameter, the algorithms tested vary highly in their accuracy. In contradiction to previous results, we found out that two out of three algorithms tested performed better when this value is slightly positive, whereas previous implementations [5] and publications recommended zero or a negative value. As future work, we suggest the following tasks: • Use more prediction algorithms. Any prediction algorithms that makes an assumption about default values can potentially be used. • Determine the influence of the default value on other error measures, especially those that can be applied to recommendation algorithms and not just rating prediction algorithm.
References [1] C. C. Aggarwal, J. L. Wolf, K.-L. Wu, and P. S. Yu. Horting hatches an egg: a new graph-theoretic approach to collaborative filtering. In Proc. Int. Conf. on Knowledge Discovery and Data Mining, pages 201–212, 1999. [2] J. Basilico and T. Hofmann. Unifying collaborative and content-based filtering. In Proc. Int. Conf. on Machine learning, page 9. ACM Press, 2004. [3] J. S. Breese, D. Heckerman, and C. Kadie. Empirical analysis of predictive algorithms for collaborative filtering. In Proc. Conf. Uncertainty in Artificial Intelligence, pages 43– 52, 1998. [4] Y. Chuan, X. Jieping, and D. Xiaoyong. Recommendation algorithm combining the user-based classified regression and the item-based filtering. In Proc. Int. Conf. on Electronic Commerce, pages 574–578, 2006. [5] J. L. Herlocker, J. A. Konstan, A. Borchers, and J. Riedl. An algorithmic framework for performing collaborative filtering. In Proc. Int. ACM SIGIR Conf. on Research and Development in Information Retrieval, pages 230–237, 1999. [6] J. L. Herlocker, J. A. Konstan, and J. Riedl. Explaining collaborative filtering recommendations. In Computer Supported Cooperative Work, pages 241–250, 2000. [7] J. L. Herlocker, J. A. Konstan, L. G. Terveen, and J. T. Riedl. Evaluating collaborative filtering recommender systems. ACM Trans. Inf. Syst., 22(1):5–53, 2004. [8] T. Hofmann. Collaborative filtering via gaussian probabilistic latent semantic analysis. In Proc. Int. Conf. on Research and Development in Informaion Retrieval, pages 259–266, 2003. [9] T. Hofmann. Latent semantic models for collaborative filtering. ACM Trans. Inf. Syst., 22(1):89–115, 2004. [10] Z. Huang, W. Chung, T.-H. Ong, and H. Chen. A graphbased recommender system for digital library. In Proc. Int. Conf. on Digital Libraries, pages 65–73, 2002.
1
1
MovieLens Pu: RMSE MAE
1
MovieLens Nu: RMSE MAE
0.9
0.9
0.9
0.8
0.8
0.8
0.7
0.7
0.7
0.6
0.6
0.6
0.5
0.5
0.5
0.4
0.4 -1
-0.5
1
0
0.5
1
0.4 -1
-0.5
1
MovieLens Pi: RMSE MAE
0
0.5
1
-1
MovieLens Ni: RMSE MAE
0.9
0.9
0.8
0.8
0.8
0.7
0.7
0.7
0.6
0.6
0.6
0.5
0.5
0.5
0.4
0.4
0.4
-1
-0.5
0
0.5
1
-1
-0.5
1
Jester Pu: RMSE MAE
0
0.5
1
Jester Nu: RMSE MAE
0.9
0.8
0.8
0.8
0.7
0.7
0.7
0.6
0.6
0.6
0.5
0.5
0.5
0.4
0.4
0.4
-0.5
0
0.5
1
-1
-0.5
1
Jester Pi: RMSE MAE
0
0.5
1
Jester Ni: RMSE MAE
0.9
0.8
0.8
0.8
0.7
0.7
0.7
0.6
0.6
0.6
0.5
0.5
0.5
0.4 -1
-0.5
0
0.5
1
1
0
0.5
1
Jester Ru: RMSE MAE
-1
0.9
0.4
-0.5
-0.5
1
0.9
0.5
MovieLens Ri: RMSE MAE
-1
0.9
-1
0
1
0.9
1
-0.5
1
0.9
1
MovieLens Ru: RMSE MAE
0
0.5
1
Jester Ri: RMSE MAE
0.4 -1
-0.5
0
0.5
1
-1
-0.5
0
Figure 1. The results of all tests, displayed in function of the algorithm and of the corpus.
Table 2. The optimal ρ in function of corpus, algorithm and error measure. Corpus Error measure Pu Nu Ru Pi Ni Ri MovieLens RMSE +0,02 -0,46 +0,24 +0,02 +0,08 +0,20 MAE +0,02 -0,46 +0,48 +0,02 +0,08 +0,44 Jester RMSE +0.10 +0.30 -0.10 +0.00 +0.50 +0.00 MAE +0.10 +0.00 -0.10 +0.00 -0.10 +0.00
0.5
1
[11] Z. Huang and D. D. Zeng. Why does collaborative filtering work? – recommendation model validation and selection by analyzing bipartite random graphs. In Proc. Workshop of Information Technologies and Systems, 2005. [12] R. Jin, L. Si, C. Zhai, and J. Callan. Collaborative filtering with decoupled models for preferences and ratings. In Proc. Int. Conf. on Information and Knowledge Management, pages 309–316, 2003. [13] J. Kunegis and S. Albayrak. Adapting ratings in memorybased collaborative filtering using linear regression. In Proc. Int. Conf. on Information Reuse and Integration, 2007. [14] M. R. McLaughlin and J. L. Herlocker. A collaborative filtering algorithm and evaluation metric that accurately model the user experience. In Proc. Int. Conf. on Research and Development in Information Retrieval, pages 329–336, 2004. [15] B. J. Mirza, B. J. Keller, and N. Ramakrishnan. Studying recommendation algorithms by graph analysis. J. of Intelligent Information Systems, 20(2):131–160, 2001. [16] D. Nichols. Implicit rating and filtering. In Proc. DELOS Workshop on Filtering and Collaborative Filtering, pages 31–36, 1998. [17] D. Pennock, E. Horvitz, S. Lawrence, and C. L. Giles. Collaborative filtering by personality diagnosis: A hybrid memory- and model-based approach. In Proc. Conf. on Uncertainty in Artificial Intelligence, pages 473–480, 2000. [18] L. Ungar and D. Foster. A formal statistical approach to collaborative filtering. In Proc. Conf. on Automated Learning and Discovery, 1998. [19] G.-R. Xue, C. Lin, Q. Yang, W. Xi, H.-J. Zeng, Y. Yu, and Z. Chen. Scalable collaborative filtering using cluster-based smoothing. In Proc. Int. Conf. on Research and Development in Information Retrieval, pages 114–121, 2005. [20] K. Yu, A. Schwaighofer, V. Tresp, X. Xu, and H.-P. Kriegel. Probabilistic memory-based collaborative filtering. IEEE Transactions on Knowledge and Data Engineering, 16(1):56–69, 2004.