www.erpublication.org. [2] AEMC Instruements, Understanding Ground Resistance Testing,. Workbook edition 7.pp.1-39. Accessed online from: www.aemc.com.
International Journal of Engineering and Technical Research (IJETR) ISSN: 2321-0869 (O) 2454-4698 (P) Volume-8, Issue-6, June 2018
Assessment and Evaluation of Soil Effect on Electrical Earth Resistance: A Case Study of Woji Area, Port-Harcourt, Nigeria Dikio C. Idoniboyeobu, Tekena K. Bala, Emmanuel Okekem
and power users, equipment, etc., from the effect of natural phenomena such as lightning strikes or fault currents in the power system. With good earthing systems there is the tendency of high reliability operation of devices thereby reducing damages to power systems components. During installation of electric power systems without installation errors and proper concern for grounding; apparatus are connected to the general mass of the earth (soil) by means of ground-embedded electrodes and grid copper bars for a number of benefits which includes: (i) to ensure correct operation of electrical devices; (ii) to provide safety during normal or abnormal (fault) conditions; (iii) to stabilize the voltage during transient conditions and to minimize the probability of a flashover during transient voltage; (iv) to dissipate lightning strokes, etc., in the electric power systems to ground [1],[2],[ 4]. The main aim of earthing electrical systems as described earlier is to establish a common reference (zero potential) for all steelwork of power supply system, building structure, plant, protective devices, electrical conduits, cable trays, instrumentation system, humans, etc., for safety and protection; and to achieve these, a suitable earthing system is desirable using low resistance (earth rods, ground grid, bonding earth leads, and soil) for proper connection to earth. However, in often time, it is challenging to achieve the aim for protection which depends upon numbers of factors such as soil resistivity, stratification (soil layering), size and type of electrode used, depth to which the electrode is buried, moisture and chemical content of the soil, temperature, texture, etc. These important factors which affect the earth resistance are soil constituents of the earth crust [3], [7], [8].
Abstract— The properties of different soil types that affect the resistance of a buried electrical earthing material were studied, with the objectives of achieving a lowest possible earthing resistance by enhancing the soil at the grounding site Soil conduction mechanism, general practical earthing electrodes were analysed using known techniques for electrical earth resistance measurement. In the area under test, there is indication of previous grounding installation and how good is the aim. Based on literature review, the soil samples obtained from the sites under enhanced conditions and unenhanced condition were analysed. It was observed that each soil sample had varying characteristics under different conditions at the installation site. In view of all the factors analysed, temperature had little effect on the electrical earth resistance, whereas soil structure, chemical constituent, and electrode depth are the major contributing factors that affect electrical earth resistance of a grounding system as seen from the general assessment. Specifically, soil sample A (very moist loam soil) showed a very low earth resistance of 75Ω with electrode depth of 0.38m (1.3ft), 62Ω at 0.76m (2.6ft), and at 1.14m (3.9ft) recorded resistance was 53.7Ω. Soil sample F (dry sandy soil) has the highest earth resistance, 2483Ω. In the area of optimization (when other compounds are mixed with natural soils combination) the optimized soil sample BCH (Loamy, clay + hydrogen peroxide mix) has the lowest resistance of 241Ω at depth of 1.14m (3.9ft). Sample BFH (Clay, dry sandy soil + hydrogen Peroxide) had a reading of 318Ω at a depth of 1.14m (3.9ft), whereas the biochar optimized sample BFW (Clay, dry sandy soil + wood char) showed a resistance of 366Ω at the same depth of 1.14m (3.9ft). The optimized samples showed that electrical conduction capacity of the soil was enhanced by hydrogen peroxide compared to that of biochar as seen from the result presented in Table 2, using fall of potential, etc., method conducted in the early morning hours of the day, when temperature is 26˚C.
A. Problem Statement Due to the variations in the soil texture and other factors, its resistance in regards to grounding system for effective passage of undesirable current to earth is a concern; how the soil affect the grounding resistance and system; the optimal location of a grounding system poses some problem in installation to some extent. However, based on the case study area, the problem of earth depth, location, types of the electrode for grounding is a problem to be addressed.
Index Terms— Conduction Mechanism, Earth soil, Earth Electrode, Fall of Potential, Intersecting, Resistance, Slope Method, Soil Resistivity.
I. INTRODUCTION The quality and performance of grounding systems are a major concern in modern power system design. To increase the reliability of electric power supply; grounding is a very important aspect when utilizing the worldwide benefit of electric power generation, transmission and distribution. This helps to prevent excessive voltage rise during disturbances and also provides protection for operation personnel, devices
B. The aim of this Research Work The aim of this research work is to assess and evaluate the effect of soil on electrical earth resistance under natural conditions such as (texture, temperature, depth, and type of soil) and enhanced soil conditions for better performance.
Dikio C Idoniboyeobu, Electrical Engineering Department, Rivers State University, Port-Harcourt, Nigeria,+2348037120018 Tekena K. Bala, Electrical Engineering Department, Rivers State University, Port-Harcourt, Nigeria,+2348037320077 Emmanuel Okekem, Electrical Engineering Department, Rivers State University,Port-Harcourt,Nigeria,+2348056141652
C. Objectives of this Research Work The objectives of this research work in regards to the aim are as follows:
84
www.erpublication.org
Assessment and Evaluation of Soil Effect on Electrical Earth Resistance: A Case Study of Woji Area, Port-Harcourt, Nigeria i) Investigate different locations for data collection. ii) Identify the properties of the soil (the major types in Nigeria) that affect the electrical earth resistance using analytical and experimental methods. iii) Is to determine an enhancement mechanism to the soil properties if required, to give the lowest possible earth resistance over a prolong time applying the available standard of grounding electrode and earthing practice, etc.
As seen in [7], earthing electrodes in different shapes and sizes are in most cases installed beneath the layer of soil close to the apparatus/facility in which such system is intended to protect for effective fault clearing. But properties of soil and the earthing systems configuration will indicate the performance and usefulness of the purpose. These three main constituents (soil resistivity, soil stability and environmental factors) impact on the performance of the electrical earthing when installed [7]. However, electrical systems do not rely on the earth to carry load current (this is done by the system conductors). The earth provides the return path for fault current. Therefore, all electrical equipment frames must be connected to ground, since the earth mass is so much and enough to discharge lightning stroke and fault current to ground. In general, the lower the ground resistance, the safer the system is considered to be; meaning in an event of a fault, the fault current path is not restricted. There shall be enough faults current to flow through the path to ground. In BS EN 62305-3:2011 (code of practice for protection of structures against lightening), under earth-termination system, the ground resistance recommended for practice shall not be greater than 10 ohms [9]. In BS 7430: 2011 (Code of practice for protective earthing of electrical installations), there are a few grounding techniques that are proposed for electrical installation in order to protect electrical equipment whether power or electronic part. From the stipulation, considerable effort should be made in decreasing the grounding resistance between the soil and the electrode(s) of the grounding system. As this, is very important for the wellbeing and efficiency of power generating stations and other electrical related equipment and installations [10]. In [3], two samples of soil consisting of top soil and sandy soil were examined when thoroughly dried. The samples showed a very good insulating property having resistivity in excess of 107 Ω-m at 0% moisture content. The resistivity of the soil samples were observed to change quite rapidly until approximately 20% when the texture was altered from being dry. In the same experiment, further observations were made. It was revealed further that the resistivity of the soil was influenced by four major determinants: temperature, soil texture, minerals and dissolved salts. The wide variation of resistivity of sandy loam soil which contained 15.2% moisture, when the temperature changed from 20˚C to -15˚C varied from 72 to 3300Ω-m. The resistivity of the soil is not consistent throughout the world and can change according to time of year; and it has to be analyzed for improvement in consistency for electrical earthing by soil maximization of the electrical installation’s site [3]. As seen in [5], an earthing system refers to the metallic wire(s) of various geometrical shapes and sizes acting as electrodes and buried in the soil. The commonly used earthing electrodes are the vertical rod, horizontal electrode, ring electrode and earthing grid. For large electrical installations, the horizontal earth electrode is mainly used and is normally buried at a moderate depth where there is no significant effect of the depth on the earth resistance if the electrode length is about 10m to 50m in the case of transient and steady state conditions respectively. The ring electrode is a type of horizontal earthing grid and is sometimes used as surrounding earth conductors around large equipment earthing. To obtain even lower earth resistance, the horizontal earth grid can be
D. Significant of this Research Work This research work will provide useful standard data for soil preparation of electrical earthing sites prior to electrical grounding installation that gives an optimized lowest earth resistance for reference points. E. The scope of this Research Work This research shall focus on the variable soil structures and resistance at different location, and how it affects the earth resistance with its optimal constituents to provide the lowest minimum earth resistance and possibly employ a way of optimizing the soil for effective low resistance within the case study area. II. LITERATURE ASSESSMENT Grounding of a system involves deliberate bonding of all the metallic part of equipment to the general mass of the earth through a conductor which basically possesses its own resistance. The resistance should not be greater than the design value and should be capable of carrying the expected maximum fault current. It is, therefore, necessary to consider the various factors which affect the resistance to ground and the fault current capacity of the buried conductor, designated as the ground electrode. These include the size and shape of the ground electrode and soil in which the electrode is buried, nature of soil, what to be protected, geographical location to ascertain the dominant weather condition, etc. before deciding on the suitable technique to employ. It is also necessary to consider to current density at the surface of the ground electrode and the ground potentials at the installation site. Poor considerations and design failure have often time led to many electrical shock incidents and damaged equipment as seen in [3]. Ideally, the potential of a neutral point of an electrical system whether three phase or single phase should be the same as that of the ground. In this case, human beings and animals are safe whenever they touch metallic structures connected to the system neutral. Unfortunately, the impedance (Z) of the grounding system to the ground is always a finite number. Thus, the potential of a grounded system may become different from the potential at other points on the ground during abnormal conditions [1], [2], [3]. According to [5], during a lightning strike, the electrical power system is subjected to a very large charging current with a peak rise in millisecond. Lightning strikes to high raised structures such as transmission towers, high-rise buildings, etc., can induce undesirable charges resulting into a very high voltage which in-turn cause insulation failure leading to electrical equipment damage and sometimes loss of lives. Thus, high voltage transmission and distribution systems require lightning protection and insulation co-ordination schemes to protect human and electrical equipment from danger and damage [5]. [
85
www.erpublication.org
International Journal of Engineering and Technical Research (IJETR) ISSN: 2321-0869 (O) 2454-4698 (P) Volume-8, Issue-6, June 2018 reinforced with vertical rods which are normally inserted at the edge of the earthing grid [5]. According to [6], a well-designed grounding system should moderate and conserve high reliability of device operation to shunt- out damages caused by discharge from lightning stroke or fault currents in the event of disturbances. In some literature 3 ohms or less is accepted for earth resistance whereas in some literature due to soil texture 25 ohms or less is accepted. In the case of earth fault conditions, very low earth resistance enables fast protection system to isolate the power source and makes the earth potential rise (EPR) less dangerous to human’s habitation [6]. The soil breakdown mechanisms assist in the conductivity of electricity and this centered on two principles: thermal operation and soil ionization. These are two major descriptions that explain the initiation of the conduction process. As current flows into the soil, there is a successive heating effect, the temperature of the soil water at the surrounding and soil conductivity expands, with a parallel decrease in the soil. Soil’s thermal conductivity can be enhanced by ionic conduction which is a function of the volume of solvent, types of solutes, and composites present [5]. Also in [2],[7] wet soil mainly of clay-loam containing dissolved salts has low resistivity, which enables the free flow of earth current whereas dry soil has high resistivity since it often contains no soluble salts. Table 1 shows estimated soil resistivity range.
treated soil is subjected to a considerable variation in resistivity. Thus, if salt is used for the soil conditioning, it is proper to use ground rods which will resist chemical corrosion [4]. In a way to improve the soil perform for earthing system, substances such as Dead Sea water, coal and iron filling were applied around earthing electrode to reduce the earth resistance thereby enhancing the efficiency of the earthing system as in seen in [1]. The substances are soil conditioning substances and were added to a hole around the electrode with a distance not exceeding 10 cm to avoid the corrosion layer on the electrode [1]. Soil Resistivity Analysis As presented in [3], there is need for actual resistivity measurement to fully ascertain the resistivity of a soil and its effects in relation to power systems grounding. In literature, several methods have been employed for soil resistivity measurement. However, the most commonly used technique for soil resistivity measurement was put forward by F. Wenner, the 4-point method having four ground rods equally spaced and in-line using equations (1) or (2) as presented here. This equation constitutes the apparent soil resistivity required to find, analytically as in [3],[4]. So the apparent soil resistivity is given by: ---
(1)
Table 1: Estimated Soil Resistivity Range Glacial Sediment Clays Tilts Gravel and sand
Resistivity (Ω m) 5-100 18-2000 800-10,000
Sedimentary rocks Shales Sandstone Conglomerate
Resistivity (Ω m)
The analytical equation is further simplified to: ---
6-14 18-1000 1000-10,0000
(2)
Where: ρE = the apparent soil resistivity measured in the location under consideration in (Ω-m) a = electrode spacing distance in (m) b = depth of the electrodes in ground in (m) RW = Wenner resistance measured as "V/I" [3], [4].
(Source: Siow, et. al, 2013) In [2] 2-point and 4-point method of measuring soil resistivity were presented. Resistance between two points, the 2-point method is used and to achieve more accurate measurement the 4-point method is preferable using ground tester meters. In the 4-point method, four electrodes are used (designated as U, Uv, W, V); they are equally spaced in distance and in-line at the test site. Now, a constant current generator (perhaps using a ground tester) with known current value is passed through the outer electrodes (U and V) and the potential drop due to soil resistance is measured across the inner electrodes (Uv and W). Utilizing this resistance in analytical equation yields the resistivity of the soil under test otherwise the ground tester digitally presents the value. Some earth meters are constructed and calibrated in ohms [2].
III.
MATERIALS AND METHODS
A. The Materials Employed For high accuracy, reliability and compatibility, the following materials will be used for carrying out the experimental measurements under soil-unconditioned (without enhancement) and soil-conditioned (with enhancement) scenarios: A1. Electrical Meter Earth The digital earth meter – UT522 will be used in all the experiments. It has a resolution of 0.01 and can read to a maximum of 4000Ω. A product of UNI-T; it is a four-terminal digital earth meter.
[
Soil Conditioning Again in [4], it was pointed out that, different location have different soil resistivity; however, it can be high or low in some cases. To obtain a low-resistance grounding value in an area with high soil resistivity, one could have an elaborate ground system at the expense for low-resistivity. Economically, it will be wise to use ground rod system, moderate size to reduce the ground resistivity in addition with soluble chemical content into the soil occasionally. Also, note that in often time due to temperature changes, this chemically
A2. Earthing Electrode Standard commercial straight type copper earthing electrode of 1.22m length is proposed. A3. Soil Resistivity Enhancing Substances Hydrogen peroxide and wood char are required for the enhancement of soil.
86
www.erpublication.org
Assessment and Evaluation of Soil Effect on Electrical Earth Resistance: A Case Study of Woji Area, Port-Harcourt, Nigeria A.4 Soil Samples and Test Sites
---
Soil samples were collected at Woji Area, Port-Harcourt, Rivers State, Nigeria; From the topsoil 30cm depth, thereafter samples were taken to Civil Engineering Laboratory, Rivers State University, Port Harcourt, for particle size distribution analysis.
(3)
Where: R= Resistance in (Ω) of the ground rod to the soil = soil resistivity (Ωm) L = Length of the rod (m) a= radius of the rod (m) ln= natural log
A5. Analytical Tool MATLAB R2013a software will be used for analyzing the mathematical equations in this work.
Equation (3) does not take into account multi-layered soils. It will only be used for obtaining the electrode resistance for each of the different experiments analytically.
B. The Technical Approach
Proposing analytical method to calculate the resistance of a multilayered soil (when the resistivity of the individual soil is found by any known approach) from the basic technique, thus: When current I, is injected into the soil through an electrode, the current density J around the electrode through the soil’s surface area A, in contact with the electrode is given by:
B1. Soil Textural Determination and Classification (Preliminary Analysis) The soil sieves were weighed and arranged beginning with (topsoil), one which has the biggest aperture and ending with the pan or receiver via 2.00mm, 1.00mm, 350µm, 106µm, 53µm, and pan. Now, about 500g of the soil was measured and put in the top sieve. Stack sieves were shaken for about 5 to 10 minutes, and then each set of sieve was weighed again. Mass retained, percentage passing and percentage retained were calculated. The percentage passing versus sieve diameter was also plotted, and percentages of sand, silt and clay contained in the soil were determined. The texture of the soil was then classified following the USDA soil classification method, using the soil textural triangle [11]. The experiments were conducted at different period of the day - morning, afternoon, and evening for three different experimental methods used for measuring of the electrical earth resistance. However, from the experiments conducted these alphabetical keys denoted here are as follows: A - for very moist loam soil, B - for loam soil, C - for clay soil, D - for moist sandy soil (moist sharp sand), E - for concrete 1:5 mix, F - for dry sandy soil (sharp sand), H - for Hydrogen peroxide, and W - for Wood char
---
(4)
If the resistivity of the ground is , the electric field surrounding the electrode becomes the product of the current density and the soil’s resistivity. Since the field intensity is responsible for the soil ionization, then conduction will only be possible at the break down ionization voltage. By denoting the break down conduction field intensity as in (V/cm) or (in kV/cm), we have: ---
(5)
Consider the use of the straight single electrode, the surface area of the soil surrounding the electrode is of cylindrical form and at the tip of the electrode it is hemispherical, thus, ---
(6)
---
(7)
Therefore,
Assuming zero tolerance exists between the soil’s cylindrical surface and the cylindrical straight single electrode for effective contact (including the hemispherical tip), then in equations (6) and (7), r and h are equivalent to the radius (r) and depth (h) of the electrode in the soil. An inverse proportionality exists between soil’s electrical earth resistance and the depth to which the electrode is in contact with the soil. However, the conductivity by ionization is dependent upon the soil’s surface area exposure. Thus, the soil’s electrical earth resistance, Rs, is given as:
All readings in this experiment greater than 4000Ω are indicated by >4k. Note: in all the Tables of result, we shall use tick marks to indicate the soil sample and combination being tested. All the optimized soil sample combinations are of equal mix proportions. B2. Methods Utilized Since our aim is to assess and evaluate the soil effect on electrical earth resistance: a case study at Woji area, Port-Harcourt, Nigeria was taken. We shall use three methods: Fall of Potential method, Slope method, and Intersecting curve method for evaluation. In furtherance of the evaluation, (MATLAB R2013a) software will be used for analyzing the mathematical relationship in this work.
---
(8)
From Ohms law and equation (6), differentiating the soil’s resistivity with respect to the surface area in contact with the electrode at y radius from the electrode,
B3. Analytical Steps The simplified equation for predicting the electrical earth resistance with a given length of earthing rod as seen in [2] is given by
87
---
(9)
---
(10)
www.erpublication.org
International Journal of Engineering and Technical Research (IJETR) ISSN: 2321-0869 (O) 2454-4698 (P) Volume-8, Issue-6, June 2018 Therefore,
Dm : ---
(11) This maximum spacing range is due to the limited length of the lead wire.
With respect to the soil’s cylindrical area diameter, D, ---
Applying fall of Potential Method (3-point measurement) (Using small electrodes), we have Let Dmax = 10m (30ft), Dmin = 5m and d = 5m
(12)
Taking into account the cross-sectional area of the electrode under test as , the resistance of the straight electrode is given by: ---
Applying the Slope Method Let Dmax = 10m, for R: d = 20% of Dmax = 2m; for R1: d = 40% of Dmax = 4m; for R2: d = 60% of Dmax = 6m
(13)
Where is the resistivity of the electrode material used, L is the full length of the electrode, and is the diameter of the electrode. The parameter , in the derived equations is the soil’s resistivity of the soil being analyzed. If we take account of all the other factors that contribute to the general soil resistance effect such as the electrode resistance which is dependent on its material constituents, temperature, moisture, texture, soil chemical composition etc, most of which are not dimensionally compactible with resistance. However, the soil’s resistance and that of the electrode, we can attribute this contribution to the soil’s resistivity effect on the overall soil resistance. Hence, the overall total electrical earth resistance becomes, ---
(14)
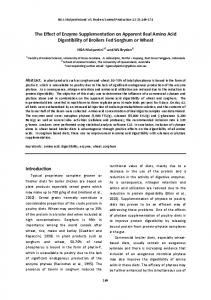
Substituting equations (12) and (13) into equation (14), we have Figure 1: Experimental Setup with Electrodes Placement ---
(15)
Applying the Intersecting Curve Method Let X = 0.25m, Dmax = 10m, Then, D = X + Dmax = 0.25m + 10m = 10.25m d = 0. 618 (X + Dmax) – X = 0.618(0.25 + 10) – 0.25 = 6.08m Therefore, D = 10.25m and d = 6.08m With the details of the calculations, the values of D and d were used for carrying out the experiments for each of the methods respectively.
For variable soil mixtures, the soil’s resistivity , for such soil will be required using a pretested standard soil resistance method, perhaps equation (2), in that case, equation (15) can be effectively employed in the analytical determination of any soil type so long as the soil’s resistivity , and the electrode parameters are available. Equation (15) was utilized after the experimental assessment of the different factors that affect the electrical earth resistance. The parameters and assumptions made in the use of equation (15) are that the electrode is made of pure copper having standard resistivity value of 1.678 x 10⁻⁸Ωm; diameter is 15mm and length is 4feet (1.22m). In addition, zero tolerance between the soil surface area in contact with the electrode and uniform distribution of the soil particles were assumed in the analytical approach.
IV. RESULTS AND DISCUSSION A.
The various equations and methods were applied experimentally, and a computational program was written in MATLAB to further calculate the necessary parameters required. The electrical earth resistance was evaluated adopting the three methods: Fall of Potential, Intersecting Curve, and Slope method at a temperature of (26oC in the Morning); (40oC in the Afternoon), and (30oC in the Evening) with the different soil samples.
B4. Experimental Setup Figure 1 show the experimental setup in this research work at the site under consideration. The placement/spacing of the electrodes was carried out using the three consecutive methods in measuring electrical earth resistance as mentioned earlier. The spacing distances adopted are presented here in sub-section B5. B5.
Experimental Results
Tables 2, Table 3 and Table 4 are results of the fall of potential method showing variation in the earth resistance as temperature and electrodes’ penetration depth changes. As the depth increases, each sample indicates a decrease in electrical
Electrode Distance Calculation
Specifications for electrode spacing range for the UT522 Meter:
88
www.erpublication.org
Assessment and Evaluation of Soil Effect on Electrical Earth Resistance: A Case Study of Woji Area, Port-Harcourt, Nigeria earth resistance. However, at 40oC the electrical earth resistance for the various soil types is lower than those obtained at 26oC and 30oC. Soil sample A at the different temperatures showed the lowest earth resistance compared to other samples. Sample F showed consistently high earth resistance. This is as a result of the fact that dry sandy soil has low moisture content with high pore spaces between the soil grains which invariably reduces the packing efficiency, thus reducing the surface area of the soil to which the electrode is exposed for effective current conduction. Hence, the soil texture for this sample poses a critical factor to its earth resistance value. For concrete 1:5 mix – sample E, at all temperatures and at 1.3ft, the earth resistances obtained were constant >4000 Ω. As the depth increases, the resistance
dropped considerable due to the compactness of the concrete, increased surface area, and moisture content. From Table 5, Table 6, and Table 7 are intersecting curve method also showed variation in resistance with change in temperature and depth. A decrease in electrical earth resistance can be observed as the depth increased for each sample investigated. At 40oC, the electrical earth resistances for the various soils are lower than those obtained at 26 oC and 30oC. The same trend was observed in the Fall of Potential method. Table 8, Table 9 and Table 10 are results for the slope method experiment. The result obtained, exhibited the same trend as seen in the above methods, as increase in temperature and depth is inversely proportional to resistance.
Table 2: Earth Resistance Measurement using Fall-of-Potential Method at Temperature of 26oC Test Electrode Resistance: 1.1Ω Length of Rod: 4ft Electrode Type: Straight Single copper rod Soil Temperature: 26oC , Soil Resistance: 113.19 Ω , Site Location: Woji, Rivers State, Nigeria Period of Day: Morning (6:00AM) Electrode Resistance at Depth (ft) Soil Types Chemical Biochar Spacing (m) D d 1.3 ft 2.6 ft 3.9 ft Site Soil A B C D E F H Wood R(Ω) R(Ω) R(Ω) 10 5 246.1 135.2 98.6 10 5 608 510 325.4 10 5 >4k >4k 2483 10 5 394 386 254 10 5 611 380 396 10 5 385 302 290 10 5 1498 1006 781 10 5 410 289 241 10 5 872 498 318 10 5 1470 680 362 10 5 690 384 366 10 5 >4k 1265 324 10 5 75 62 53.7
Table 3: Earth Resistance Measurement using Fall-of-Potential Method at Temperature of 40oC Test Electrode Resistance:1.1Ω Length of Rod: 4ft Electrode Type: Straight Single copper rod Soil Temperature: 40oC , Soil Resistance: 116.58 Ω , Site Location: Woji, Rivers State, Nigeria Period of Day: Afternoon (1:00PM) Resistance (Ω) at Depth Electrode Soil Types Chemical Biochar Spacing (m) (ft) D d 1.3 ft 2.6 ft 3.9 ft Site Soil A B C D E F H Wood R(Ω) R(Ω) R(Ω) 10 5 216.1 115.2 83.6 10 5 578 460 215.4 10 5 >4k >4k 2183 10 5 324 306 194 10 5 538 319 316 10 5 305 220 210 10 5 1267 926 701 10 5 330 229 211 10 5 822 438 258 10 5 1320 620 302 10 5 620 314 320 10 5 >4k 1145 224 10 5 52 42 33.7
89
www.erpublication.org
International Journal of Engineering and Technical Research (IJETR) ISSN: 2321-0869 (O) 2454-4698 (P) Volume-8, Issue-6, June 2018 Table 4: Earth Resistance Measurement using Fall-of-Potential Method at Temperature of 30oC Test Electrode Resistance:1.1Ω Length of Rod: 4ft Electrode Type: Straight Single copper rod Soil Temperature: 30oC Soil Resistance: 115.10 Ω Site Location: Woji, Rivers State, Nigeria Period of Day: Evening (6:00PM) Electrode Resistance at Depth (ft) Soil Types Chemical Biochar Spacing (m) D d 1.3 ft 2.6 ft 3.9 ft Site Soil A B C D E F H Wood R(Ω) R(Ω) R(Ω) 10 5 226.1 125.2 93.6 10 5 598 480 315.4 10 5 >4k >4k 2383 10 5 364 316 204 10 5 578 339 366 10 5 325 280 250 10 5 1467 996 731 10 5 380 259 231 10 5 842 468 298 10 5 1420 630 312 10 5 640 324 326 10 5 >4k 1245 254 10 5 66 52 43.7
Table 5: Earth Resistance Measurement using Intersecting Curve Method at Temperature of 26 oC Test Electrode Resistance:1.1Ω Length of Rod: 4ft Electrode Type: Straight Single copper rod Soil Temperature: 26oC ; Soil Resistance: 113.19 Ω ; Site Location: Woji, Rivers State, Nigeria Period of Day: Morning (6:00AM) Electrode Resistance at Depth (ft) Soil Types Chemical Biochar Spacing (m) D D 1.3 ft 2.6 ft 3.9 ft Site Soil A B C D E F H Wood R(Ω) R(Ω) R(Ω) 10 5 304 190.7 162.2 10 5 685 448 376 10 5 >4k >4k >4k 10 5 630 361 316 10 5 489 423 269 10 5 389 511 282 10 5 1328 1281 807 10 5 386 367 398 10 5 1065 880 377 10 5 1134 892 298 10 5 415 274 329 10 5 >4k 935 142 10 5 73.6 89.8 58.7
Table 6: Earth Resistance Measurement using Intersecting Curve Method at Temperature of 40 oC Test Electrode Resistance:1.1Ω Length of Rod: 4ft Electrode Type: Straight Single copper rod Soil Temperature: 40oC; Soil Resistance: 116. 58Ω ; Site Location: Woji, Rivers State, Nigeria Period of Day: Afternoon (1:00PM) Electrode Resistance (Ω) at Depth Soil Types Chemical Biochar Spacing (m) (ft) D D 1.3 ft 2.6 ft 3.9 ft Site Soil A B C D E F H Wood R(Ω) R(Ω) R(Ω) 10 5 294 170.7 132.2 10 5 625 418 326 10 5 >4k >4k >4k 10 5 619 321 306 10 5 459 403 229 10 5 349 491 262 10 5 1308 1251 779 10 5 346 307 381 10 5 1045 850 347 10 5 1104 872 288 10 5 405 264 319 10 5 >4k 925 132 10 5 69.3 85.6 52.7
90
www.erpublication.org
Assessment and Evaluation of Soil Effect on Electrical Earth Resistance: A Case Study of Woji Area, Port-Harcourt, Nigeria Table 7: Earth Resistance Measurement using Intersecting Curve Method at Temperature of 30 oC Test Electrode Resistance:1.1Ω Length of Rod: Electrode Type: Straight Single copper rod Soil Temperature: 30oC ; Soil Resistance: 115.10 Ω ; Site Location: Woji, Rivers State, Nigeria Period of Day: Evening (6:00PM) Electrode Spacing (m) D D 10 10 10 10 10 10 10 10 10 10 10 10 10
Resistance at Depth (ft) 1.3 ft R(Ω) 234 615 >4k 609 429 329 1258 336 1035 1004 385 >4k 59.3
5 5 5 5 5 5 5 5 5 5 5 5 5
2.6 ft R(Ω) 120.7 408 >4k 311 385 431 1201 287 820 842 234 905 75.6
Soil Types
3.9 ft R(Ω) 112.2 312 >4k 301 219 232 729 331 317 238 289 112 42.7
Site Soil
A
B
C
D
E
4ft
Chemical
Biochar
H
Wood
F
Table 8: Earth Resistance Measurement using Slope Method at Temperature of 26oC Test Electrode Resistance: 1.1Ω Length of Rod: Electrode Type: Straight Single cooper rod Soil Temperature: 26oC ; Soil Resistance: 113.19 Ω ; Site Location: Woji, Rivers State, Nigeria
4ft
Period of Day: Morning (6:00AM) Electrode Spacing (m) D d Q S
Resistance(Ω) at Depth (ft) 1.3ft
Soil Types
2.6 ft
Site Soil
3.9 ft
A
B
R
R1
R2
R
R1
R2
R
R1
R2
10
5
4
6
238
249.1
293
203.7
212.2
205
120
136
135.5
10
5
4
6
627
632
645
341
348
356
324
329
336
10
5
4
6
>4k
>4k
>4k
>4k
>4k
>4k
>4k
>4k
>4k
10
5
4
6
398
405
473
297
307
320
337
319
316
10
5
4
6
569
573
582
342
350
356
229
234
239
10
5
4
6
314
330
335
383
390
398
262
268
275
10
5
4
6
1466
1485
1489
1125
1148
1166
793
790
788
10
5
4
6
400
425
415
271
280
303
395
397
403
10
5
4
6
1040
1048
1053
618
632
633
430
587
590
10
5
4
6
1356
1393
1406
676
653
638
288
295
309
10
5
4
6
627
638
641
447
447
451
320
328
329
10
5
4
6
1970
1889
1840
680
690
708
130
136
142
10
5
4
6
63
68.2
74.3
50.6
58
63
45.1
51.4
57.7
C
D
E
F
Chemical
Biochar
H
Wood
Table 9: Earth Resistance Measurement using Slope Method at Temperature of 40oC Test Electrode Resistance:1.1Ω Length of Rod: Electrode Type: Straight Single copper rod Soil Temperature: 40oC ; Soil Resistance: 116.58 Ω ; Site Location: Woji, Rivers State, Nigeria Period of Day: Afternoon (1:00PM) Electrode Spacing (m) D d Q S 10 10 10 10 10 10 10 10 10 10 10 10 10
5 5 5 5 5 5 5 5 5 5 5 5 5
4 4 4 4 4 4 4 4 4 4 4 4 4
6 6 6 6 6 6 6 6 6 6 6 6 6
Resistance(Ω) at Depth (ft) R 218 607 >4k 378 559 314 1446 390 1030 1356 617 1960 57
1.3 ft R1 229.1 618 >4k 395 563 320 1460 400 1036 1383 628 1878 63.2
R2 253 625 >4k 453 565 325 1468 409 1045 1396 631 1830 69.3
R 183.7 331 >4k 277 332 373 1105 261 608 657 437 660 45.6
2.6 ft R1 192.2 338 >4k 295 340 380 1138 270 616 633 437 680 53
R2 197.5 346 >4k 310 346 389 1156 283 623 622 441 690 58
Soil Types R 117.8 314 >4k 327 219 250 783 375 415 278 310 120 40.1
3.9 ft R1 126 319 >4k 309 224 256 778 377 567 285 318 126 46.4
91
Site Soil R2 131.3 326 >4k 306 229 262 779 381 570 297 319 132 52.7
A
B
C
D
E
F
4ft
Chemical
Biochar
H
Wood
www.erpublication.org
International Journal of Engineering and Technical Research (IJETR) ISSN: 2321-0869 (O) 2454-4698 (P) Volume-8, Issue-6, June 2018 Table 10: Earth Resistance Measurement using Slope Method at Temperature of 30oC
d
q
S 1.3 ft
10 10 10 10 10 10 10
5 5 5 5 5 5 5
4 4 4 4 4 4 4
6 6 6 6 6 6 6
10 10
5 5
4 4
6 6
10
5
4
6
10 10
5 5
4 4
6 6
10
5
4
6
R 208 600 >4k 378 548 304 143 5 382 102 1 134 6 608 195 1 46
2.6 ft
3.9 ft
A
B
C
R1 219.2 610 >4k 385 552 310 1452
R2 243 615 >4k 443 558 315 1458
R 173.5 321 >4k 267 322 363 1101
R1 182.2 328 >4k 285 330 370 1121
R2 187.7 336 >4k 302 336 378 1146
R 107.8 304 >4k 319 209 241 772
R1 116 309 >4k 301 214 248 769
R2 121 316 >4k 295 219 253 768
395 1026
400 1036
251 600
260 609
274 613
364 405
367 557
379 560
1373
1386
646
623
612
268
276
288
619 1865
622 1820
428 652
426 671
431 682
302 111
310 115
307 122
54.3
58.5
36
46
49
32
36.6
44.8
D
E
F H
Biochar
Soil Types
Site Soil
D
Resistance(Ω) at Depth (ft)
Chemical
Electrode Spacing (m)
4ft
Wood
Test Electrode Resistance:1.1Ω Length of Rod: Electrode Type: Straight Single copper rod Soil Temperature: 30oC ; Soil Resistance: 115.10 Ω ; Site Location: Woji, Rivers State, Nigeria Period of Day: Evening (6:00PM)
Table 11: Measured Soil Resistivity at Temperature of 25oC Resistivity (Ωm)
Soil Types Site Soil
A
B
C
D
E
Chemical
Biochar
H
WOOD
F
141.26 370.64 2452.8 289.09 375.91 248.98 998.65 239.84 493.55 811.12 403.3 1240.4 54.4
Table 12: Analytical Earth Resistance (using Equation 15) Resistance at Depth (ft) 1.3 2.6 3.9 R(Ω) R(Ω) R(Ω) 246.9758 143.1495 103.1006 648.0186 375.5978 270.5168 4288.4 2485.6 1790.2 505.4384 292.9570 210.9964 657.2326 380.9383 274.3632 435.3110 252.3104 181.7215 1746.0 1012.0 728.8787 419.3308 243.0482 175.0506 862.9117 500.1519 360.2244 1418.1 821.9699 592.0073 705.1206 408.6947 294.3541 2168.7 1257.0 905.3234 95.1117 55.1276 39.7046
Site Soil
A
Soil Types B C
D
E
F
Chemical H
Biochar Wood
92
www.erpublication.org
Assessment and Evaluation of Soil Effect on Electrical Earth Resistance: A Case Study of Woji Area, Port-Harcourt, Nigeria B.
Table 11 which invariably has effect on the calculations using analytical equation number 15. Consequently, the variations between the experimental and analytical earth resistance values showed wide deviations for soil sample E (concrete mix). For natural site soil, the variation is minimal at a depth of 1.14m (3.9ft). In all, there is either a minimal difference, or a wide range in value between the analytical and experimental results. Note that due to the number of pages required for publication, the percentage error calculation and comparison of results between fall of potential method, intersecting curve method and slope method will not be attached herein.
Discussion
From results obtained from Fall-of-Potential method experiment Tables 2, 3 and 4. In Table 2, the effect of Temperature change is clearly seen when the test was carried out in the early morning hour (6am) and afternoon hour (1pm), the resistance at a depth and length of earth rod of 1.3ft (0.38m) is seen to be 246.1Ω (6am), and 216.1Ω (1pm) respectively, observing the natural site soil. Hence, increase in temperature leads to decrease in resistance. This is due to increase in ionization of the soil which occurred when the heat from sunlight became higher. Similarly, observing the site soil in Table 2, when the depth of earth rod into the soil was 0.38m (1.3ft), 0.76m (2.6ft) and 1.14m (3.9ft) respectively, it was discovered that the corresponding resistance was 241.6, 135.2 and 98.6(Ω) respectively. This shows that, increase in depth of earth rod leads to decrease in electrical earth resistance, because the surface area of electrode in contact with the soil increases with depth, thus increasing conductivity. Comparing the result of the soil samples in Table 2, Specimen A, B, C, D, E, and F at a constant depth of 3.9ft (1.14m), the soil samples yielded results like: A-(very moist soil) gave 53.7Ω reading, B-(loamy soil) 396Ω, C-(clay soil) 325.4Ω, D-(moist sandy soil) 254Ω, E-(concrete mix) 324Ω, F-(dry sandy soil) 2,483Ω. The above soil samples result at a constant depth (1.14m) indicates that moist soil is the best for electrical earthing. This is because of the decomposed organic materials and different types of salts dissolved in it, and a very high amount of water it contains. In the absence of a moist soil, a clay soil becomes an option. Hence, from the result obtained, Dry Sandy Soil should not be a considerable option. In a sandy area, it is recommended that a back fill using loamy and clay soil should be employed, perhaps, an addition of a biochar. From the soil optimization sample mixtures, still in Table 2, sample BC (loam + clay) gave 290Ω, BF (loam + dry sandy) 781Ω, BCH (loam + clay + hydrogen peroxide) 241Ω, BFH (loam + dry sandy + hydrogen peroxide) 318Ω, BCW (loam + clay + wood char) 362Ω, BFW (loam + dry sandy + wood char) 366Ω. Samples BCH are (loam + clay + hydrogen peroxide). Loam, clay and hydrogen peroxide mix yielded a low resistance of 241Ω, followed by specimen BC 290Ω, BFH 318Ω and BCW 362Ω respectively at a constant temperature and depth of 26˚C, 3.9ft respectively. The above varied samples showed that, soil enhancement yielded better result in which the combination of hydrogen peroxide gave the lowest resistance followed by samples BC. Hence, the experiment showed clearly that soil mix is a very good option in electrical earthing, as loam soil and clay soil yielded a low resistance which will further be enhanced when the depth is increased. It is evident that the soil samples mixed with hydrogen peroxide (H) gave a much lower resistance when compared with sample BCW 362Ω (loam + clay + wood char). But the optimization samples involving wood char (W) is preferred, since it is most economical and does not degrade so easily with time. It maintains the resistivity of the earth within the acceptable range as long as the standard precautions are maintained. In all the experiment, it is evident that soil enhancement gives the lowest possible resistance when compared to the results of the un-optimized soil samples (ie. unenhanced samples). The same pattern was observed in intersection and slope method experiments as shown in Tables 5 to 10. Comparing the results obtained for both experimental and analytical methods, (Table 2 and Table 12) Table 12 showed that the results from analytical equation (number 15) were close to that of the experimental results. However, based on the soil optimization, the different soil samples exhibited variable resistivity values as shown in
V.
CONCLUSION
A. Conclusion Based on the experimental results from Table 2 to Table 10 generated from the MATLAB software (R2013a) using equation 3, the following conclusions were drawn: 1) The results obtained in the course of this work proved that soil resistivity which is a measure of the soils resistance to the free flow of electricity, is the key factor that determines what the resistance of a ground electrode will be, and to what depth it must be driven to obtain low ground resistance. 2) The number of dissolved electrolytes (moisture, minerals and dissolved salts) in the ground determines the hardness of the soil. When the test soil was hard, the reading was excessively high. When the test soil was moisture-like, the reading was very low. 3) To achieve a very low earth resistance, backfilling the earth pit employing the soil mix method like, loamy and clay soil mix whose porosity is high, yields the desired result. 4) A prediction to calculate the resistance of a multilayered soil was advanced, given as: R= In view of the above conclusion, the decisive measures outlined in this research work have to be followed uncompromisingly. This will ensure that avoidable system breakdown will be minimized. Continuity of power supply will be maintained. Death incidents as a result of electrocution will be reduced to the very minimum.
B. Recommendation To achieve a good resistance during earthing, it is very necessary to test the soil compatibility. If earth tester is not available, bury more earth rods and endeavor to go deeper if possible. It is necessary to periodically test the resistance of the earth electrode with respect to the ground. The danger of poor earthing or/and negligence of earthing (grounding) will cause more than good. As lives and expensive equipment will be lost in the event of fault or during lightning strike on buildings/installations that are not earthed or well earthed. REFERENCES [1] El-Tous, Y. & Alkhawaldeh, S.A (2014). An Efficient Method for Earth Resistance Reduction using the Dead Sea Water. Energy and Power Engineering.6,47-53. http://dx.doi.org/10.4236/epe.2014.64006
93
www.erpublication.org
International Journal of Engineering and Technical Research (IJETR) ISSN: 2321-0869 (O) 2454-4698 (P) Volume-8, Issue-6, June 2018 [2] AEMC Instruements, Understanding Ground Resistance Testing, Workbook edition 7.pp.1-39. Accessed online from: www.aemc.com [3] Dwarka, P. & Sharma, H. C. (2012). Soil Resistivity and Earthing System. International Journal of Management, IT and Enginering, http://www.ijmra.us [4] AEMC Instruments (2018).Understanding ground resistance testing. Accessed online from: www.aemc.com [5] Mohammad, A. (2012). Earthing Performance of Transmission Line Towers. Doctoral thesis. School of Engineering, Cardiff University. [6] Lukong, P. N., Noel, D., Lendzemo, W. V. & Fagbenro, J. A. An Efficient Method for Electrical Earth Resistance Reduction Using Biochar. International Journal of Energy and Power Engineering. Vol. 4, No. 2, 2015, pp. 65-70. [7] Siow, C. L., Chandima, G. & Mohd Zainal Abidin Ab Kadir (2013).Electrical Earthing in Troubled Environment. International Journal of Electrical Power & Energy Systems. 47,117-128. Accessed online from: https//www.researchgate.net/publication/270895623. [8] Earthing Fundamentals Handbook. https://www.scribd.com/document/356443353/Earthing-Fundamentals -Handbook-pdf [9] The British Standards Institution (2011). BSI Standard Publication: BS EN 62305-3:2011 ‘Protection against lightening part 3: Physical damage to structures and life hazards’ European Committee for Electrotechnical Standardization (CENELEC). Accessed online from: http://www.zinoglobal.com/wp-content/uploads/2016/12/BSI-BS-EN62305-3.pdf [10] The British Standards Institution (2012). BSI Standard Publication: BS 7430: 2011 Code of practice for protective earthing of electrical installations. Accessed online from: http://www.iso-iran.ir/standards/bs/BS_7430_2011_,_Code_of_Practi ce.pdf [11] United States Department of Agriculture (USDA) Soil Textural Classification Scheme, using the soil textural triangle.
ABOUT THE AUTHORS Emmanuel Okekem holds a B.Tech and M. Tech degree in Electrical Engineering (power option), in the Department of Electrical Engineering, Rivers State University, Port Harcourt, Nigeria. Tekena Kashmony Bala holds B.Tech degree in Electrical Engineering (Power Option), Rivers State University, Port-Harcourt and M.Eng degree in Electrical/Electronic Engineering (Power System and Machines Option), University of Port-Harcourt, Nigeria. His research areas are Electrical Power Systems and Design, Power Systems Operation and Networks, Power Generation, Transmission and Distribution, Renewable Energy Technology and Utilisation, etc. He is a member, Institute of Electrical and Electronics Engineers (MIEEE); The Nigerian Institution of Electrical and Electronics Engineers (MNIEEE); The Nigerian Society of Engineers (MNSE) and also, a registered Engineer with (COREN). He is currently a lecturer in the Department of Electrical Engineering, Rivers State University, Port-Harcourt. Dikio Clifford Idoniboyeobu is a Professor in the Department of Electrical Engineering, Rivers State University, Port-Harcourt. He holds B.Eng degree in Electrical Engineering, Ahmadu Bello University, Zaria; M.Sc and PhD degrees in Electrical Engineering, University of Manchester, UK. He is COREN registered and a member of several Professional Organisations. He has published several articles in reputable journals.
94
www.erpublication.org