With the help of these assessment information systems, feedback .... while the results for mathematics and science were lower than expected. ... The ranking of schools or students is not possible. ... Gorry, G. A., & Scott Morton, M. S. (1971).
Assessment Information Systems for Decision Support in Schools A Case Study from Hungary Andreas Breiter & Emese Stauke Institute for Information Management University ofBremen, Germany
Abstract:
Schools as places for institutionalized learning could be a perfectly suitable domain for knowledge management systems. Making knowledge about teaching and learning as well as school performance available to the relevant stakeholders seems to be a promising approach. The crucial question is how to identify information needs, select the relevant data and how to organize feedback. In this paper, the computer-based support of classroom decisions and school management on the basis of standardized test results will be presented. With the help of these assessment information systems, feedback on different levels for different target groups in the school system can be organized. Reflecting on the rich body of empirical research on management information systems, we will present an example for an assessment information system from Hungary, which has just started with computersupport for data-driven decision-making. This case study illustrates the potential added value for the key stakeholders in the school systems.
Keywords:
Assessment information system, decision support.
1.
INTRODUCTION
During the last decade, knowledge management has also floated from the worid of business into the education sector. Regardless of its exaggerated promises, schools as places for institutionalized learning could be a perfectly suitable domain for knowledge management systems. Making knowledge about teaching and learning as well as school performance available to the relevant stakeholders seems to be a promising approach. The crucial question is how to identify information needs, select the relevant data and how to organize feedback. One important sub-group for knowledge management is data-driven decision-making on the basis of data from internal and external evaluations. The shift in educational policy towards accountability has prompted many districts and school administrators to
Please use the following format when citing this chapter: Breiter, A. and Stauke, E., 2007, in IFIP International Federation for Information Processing, Volume 230, Knowledge Management for Educational Innovation, eds. Tatnall, A., Okamoto, T., Visscher, A., (Boston: Springer), pp. 9-17.
10
Andreas Breiter & Emese Stauke
think differently about the potential that assessment data and information systems may have to inform instruction and decision-making aimed at raising student achievement. With international studies like TIMSS or PISA, as well as with national test systems and self-evaluation, data becomes widely available. Increasingly the exploration of how data can inform instructional decisions for school improvement is a major topic of educational policy and building Management Information Systems (MIS) is a central concern for many administrators. The assumption is that these systems can support the decision-making process and play an important role for technological support of knowledge management in schools. We will focus on information systems to feed back results, what we call "assessment information systems", introducing an example from Hungary. We will draw on organizational research on MIS as well as on studies on school information systems (SIS) to explore the question of how schools use information systems and how the information needs of end users can be mapped across different levels of the system. The case study examines the implementation of an information system for results from the national test in Hungary. Finally, the paper concludes with a discussion about critical factors for the implementation of information systems for schools and the meaning the data can have for data-driven decision-making and knowledge management in schools. School information systems constitute a sub-group of management information systems that are used in educational organizations. In schools, different information systems support different types of decisions: strategic, tactical and operational (for this distinction see Gorry & Scott Morton, 1971). In principle we must distinguish between systems that are focused directly on the support of the teaching and learning process and systems that serve for managerial, administrative and instructional decisions. The systematic analysis of assessment information systems for school development will be a determining topic for schools and their management in the next few years. Similarly, Visscher (2002) describes these information systems as school performance feedback systems. In his theoretical framework, they serve two different goals - accountability or school improvement (Visscher, 2002, p. 44). With this typology in mind, we will focus primarily on assessment information systems for school improvement and its relevance for knowledge management in schools.
2.
DATA-DRIVEN DECISION-MAKING AND KNOWLEDGE MANAGEMENT IN SCHOOLS
The terms 'information' and 'knowledge' are often used as though they were interchangeable, when in practice their management requires very different processes. At the core of knowledge management is the idea of systematizing the variety of data and to provide the resulting product in an
Assessment Information Systems for Decision Support in Schools
11
appropriate form concerning time and place using information technology (e.g. Alavi & Leidner, 2001; Earl, 2001). Thereby it should become possible that users can gain relevant knowledge from internal and external sources. In our case, we will have a closer look at available data in the school context. In most theories of knowledge management, knowledge is regarded as being embedded in people, and its creation occurs in the process of social interaction about information (e.g. Brown & Duguid, 2000): "Information is a flow of messages, while knowledge is created by that very flow of information anchored in the beHefs and commitment of its holder. This [...] emphasizes that knowledge is essentially related to human action" (Nonaka & Takeuchi, 1995). Likewise, Drucker (1989) claims that "[...] knowledge is information that changes something or somebody - either by becoming grounds for actions, or by making an individual (or an institution) capable of different or more effective action" (Drucker, 1989). Therefore, data, prior to becoming information, doesn't speak for itself and is not connected in a meaningful way to a context or situation. Borrowing from Ackoff s (1989) work, we adapted a simplified version of his conceptual framework (see also Breiter & Light, 2004). Within the framework, there are three "phases" of the continuum: •
Data exist in a raw state. They do not have meaning and therefore, can exist in any form, usable or not. Whether or not data become information depends on the understandmg of the person looking at the data. • Information is data that is given meaning when connected to a context. It is data used to comprehend and organize our environment, unveiling an understanding of relations between data and context. Alone, however, it does not carry any implications for ftiture action. • Knowledge is the collection of information deemed useful, and eventually used to guide action. Knowledge is created through a sequential process. In relation to test information, the teacher's ability to see connections between students' scores on different item-skills analysis and classroom instruction, and then act on them, represents knowledge. We identified six broad steps through which a person goes in order to transform data into knowledge. The process entails collecting and organizing data, along with summarizing, analysing, and synthesizing information prior to acting. This is the process through which raw data are made meaningful, by being related to the context or situation that produced it; consequently, human action underlies all decision-making. This sequential process underlies our understanding of how teachers interact with data. In the context of the use of assessment data the described process is also depending on the organizational context. According to Weiss (1998), use of evaluation results is relatively simple when the expected changes are closely related to teachers' prevalent practices and congruent to existing organizational processes and stakeholders' values and beliefs (Weiss, 1998). If the expected changes go beyond these expectations, any use of data for school improvement can be problematic.
12
Andreas Breiter & Emese Stauke
3.
TECHNOLOGICAL SUPPORT FOR DECISIONMAKING IN SCHOOLS
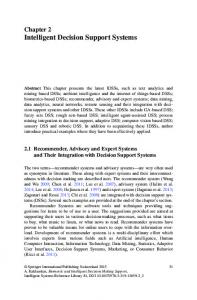
Research about using test data to support classroom-level decisions or building-level planning to improve learning is just beginning to emerge. In the U.S., research from different design sites that are piloting educational data-systems are seen in: the Quality School Portfolio (QSP) developed at CRESST (Mitchell & Lee, 1998), the Texas Education Agency, and the South Carolina Department of Education (Spielvogel & Pasnik, 1999). Research on the role of data systems and applications in practice is being done in Minneapolis (Heistad & Spicuzza, 2003), Boston (Sharkey & Mumane, 2003), and on feedback systems in Louisiana (Teddlie, Kochan, & Taylor, 2002). In the UK and the Netherlands, school performance feedback systems are widely spread, although research on their use is just starting (for an overview see Visscher & Coe, 2002). So far, there is no evidence, that feedback for stakeholders in school make a significant difference. "Feedback can be harmful to performance as often as it improves it. In designing and implementing feedback systems, we should be conscious that they cannot be guaranteed automatically to do good. However, the evidence is also clear that, under the right conditions, feedback can have a substantial effect on improving task performance" (Coe, 2002, p. 22f). Except for the work done by Thorn in Milwaukee (Thorn, 2001, 2003), Visscher in the Netherlands and Coe in the UK (see Visscher & Coe, 2002), there is only little empirical evidence. In a recent study of a web-based assessment information system in New York City (Breiter & Light, 2004; Light et al., 2005), the authors identify four success factors: alignment to information needs of all stakeholders, ownership of data in schools, thoughtful visualization and additional instructional material. Although research is just beginning in the education field, MIS have been in focus since the early 70s in management research. We can find today in schools a similar situation concerning the implementation and adoption of MIS as in business 20 or more years ago. We can learn from the empirical research in MIS that decision-makers at different levels of the school system have different information needs, which first have to be identified and analysed. In the school system five levels can be distinguished (see table 1). Level Classroom
Stakeholders Teachers Students
School
Principal Administrators
Information needs • Disaggregated student data • Grades and test scores / portfolios • Tracking of attendance / suspensions • Aggregated longitudinal student data (i.e. by class, by subject) • Grades and test scores • Tracking ofattendance/suspensions • Aggregated longitudinal administrative data • Coordination of class scheduling
Assessment Information Systems for Decision Support in Schools Level
Stakeholders
District
Superintendent Administrators
School Environment
Parents Local community
13
Information needs Special education and special programs scheduling Allocation of human resources Professional development Finance and budgeting • Aggregated longitudinal student data (i.e. by building, by grade) • Aggregated longitudinal administrative data (i.e. by building, by grade) • External data reporting requirements Disaggregated student data Aggregated administrative data
Table 1: Model of levels of information needs in schools (Breiter & Light 2004)
As extensively discussed in empirical studies of MIS (e.g. Ackoff, 1967; Feldman & March, 1981; Gorry & Scott Morton, 1971; Orlikowski, 1992), key aspects can be extracted that help an understanding of influential factors for decision-support in schools: (1) Decision-making is a highly complex individual cognitive process influenced by various environmental factors. The classroom may be the example par excellence of an inter-subjective decision-making environment. Teachers constantly make decision affecting 20 or more individuals. (2) Decision-makers often are not fiilly cognizant of the specific data they rely on for each decision. Identifying the information needs of the decision maker is a crucial step in designing an effective information system, although identifying the appropriate information to put into the system is a complex and time-consuming process. (3) An effective information system needs to incorporate the logistical elements of time, quantity, quality and access. Schools are challenging organizations to work with. There is a lack of administrative staff for data processing and distribution. If the access to data is managed centrally, teachers are often unable to leave the classroom to retrieve information. Hence, the necessary infrastructure in every classroom has to be in place.
CASE STUDY FROM IN HUNGARY 4.1 The Hungarian context Hungary is a central European country and has just joined the EU. According to the Hungarian Central Statistical Office, there are more than 10,000 schools with two million students and 190,000 teachers (HCSO, 2005). The Ertekelesi Kozpont (Hungarian Centre for Evaluation Studies, HCES) carries out national and international comparative studies in order to evaluate the school system and to assess student literacy (reading and
14
Andreas Breiter & Emese Stauke
understanding, mathematics and science). The Uteracy concept as well as the psychometric model is very closely related to the methodology used in PISA. Since 1986, Hungarian students participate in assessment tests and longitudinal bi-annual studies, which serve for monitoring the performance of a student population. The new test series were started in 2002, directly after the first PISA results for the Hungarian education system were published. The results especially in reading literacy were below average, while the results for mathematics and science were lower than expected. This was the trigger to establish a new quality management system for schools. The tests are carried out for different age groups every year. Their aim is not only the measurement of learning status, but also to find out if students are able to use their school knowledge in authentic contexts. Another aim is the establishment of a local "testing culture" in schools. It is assumed that schools, which gain experience with testing methods and tools and learn how to access the data to make their own assessments, will consequently accept nation-wide testing. In 2002 the skills of students in grades 5 and 9 were tested in reading, understanding and mathematics at the beginning of the school period. After election in 2003, the system has slightly changed. All Hungarian students in grade 6 (120,000 students) and grade 9 (110,175 students) were tested in reading, understanding and mathematics. As a weighted sample, 20 test booklets from each age group of all schools are sent to HCES. For the first time in history, the competence level of each student was measured and socio-economic variables were included in the evaluation. In 2004, the tests were extended to grades 6, 8 and. The tests took place nationwide at the same day and were complemented by questionnaires on context variables (with a special index for the socio-economic status). The central sample is coded and analysed centrally by experts. Multiplechoice questions are analysed automatically, while open questions are evaluated in groups in order to reach inter-subjective concurrence. Context data (e.g. socio-economic status and environmental factors in the specific school) are collected with school and student questionnaires. The data of the school questionnaires are not analysed centrally, but provided to schools for self-evaluation. The student questionnaires are assigned to the respective school, and a SES index for the school is developed. With this index, the observed results could be compared with the expected results with regard to the socio-economic background of the student population (Balazs & Zempleni, 2004). Teachers and administrators in each school can analyse the data from the central sample with special software that was sent to schools. They receive their files by using a school-specific code.
4.2 Assessment Information System The feedback on results is carried out in two different ways. After evaluation, a paper-based individualized report for each school is sent to all participating schools. This report includes details on the following subjects:
Assessment Information Systems for Decision Support in Schools • • • • • • •
15
Average results of the school compared to all Hungarian schools, to all urban/rural schools, to cities/villages/schools of similar size Distribution of pupil performance in cities/villages/schools of similar size Distribution of the points for each item reached by students Distribution of results by competence levels Result distribution with box plots Trend analysis Comparison of observed with expected values
All diagrams are explained in detail and substantiated by examples. After having received the software, the schools can either manipulate this data or add manually the remaining test data to have a complete set. The results entered are immediately displayed in various forms of visualization. The entry page provides an overview over the most important information of the evaluation data. Here the user can select between different booklet alternatives, the subject (mathematics or reading) and the grade (6, 8 or 10). The results are presented in three types of diagrams: 1. Average values by bar charts (country average, average by cities/villages, average by cities/villages/schools of similar size) 2. Percentile values compared to rural region, cities/villages or to cities/villages/schools of similar size; the data can be evaluated for the whole test or for individual tasks. 3. Box plots by the presentation of minimum and maximum, the lowest and highest percentile, the lowest and highest quartile and the median. The ranking of schools or students is not possible. The available data is grouped by test items and not by individuals. During the last testing phase, approximately 20 per cent of schools have used the software for their own evaluation process. An evaluation study on the actual use of the results within the school is currently planned. As schools are the owner of their data, they have the option to evaluate their work without direct external pressure. Additionally, the CD-ROM version of the software provides schools with a "sensed" security, i.e. the data is only available to schools and not via the Internet (or the district).
5.
CONCLUSIONS
Drawing on the brief example from Hungary, the potential of computerbased feedback systems to provide assessment data is obvious. Reflecting on other empirical studies, it cannot be taken for granted that use of information systems will lead automatically to school improvement. Organizational change, as well as teacher training and trust building to avoid the unintended consequences have to be taken into account. The Hungarian case shows how thoughtftil implementation procedures can help to slowly adapt to the requirements of teachers and administrators. The findings from Hungary offer an illuminating example for other countries that are starting to use test
16
Andreas Breiter & Emese Stauke
data for accountability and policy making. From a school management perspective, the software can be regarded as a useftil data-tool as the school still holds ownership of the data. There is more research necessary on the design principles of assessment information system, drawing on a large body of research on participatory design to involve all stakeholders an the development process. In addition, there is only little evidence on the actual use of such systems and how they have to be embedded into the organizational context. Answers to these questions can lead to a deeper understanding of knowledge management in schools.
6.
REFERENCES
Ackoff, R. L. (1967). Management Misinformation Systems. Management Science, J 4(4), 147-156. Alavi, M., & Leidner, D. E. (2001). Knowledge Management and Knowledge Management Systems: Conceptual Foundations and Research issues. Management Information Systems Quarterly, 25{\l\07-\36. Balazs, I., & Zempleni, A. (2004). A hozottertek-index es a hozzaadott pedagogiai ertek szamitasa a 2003-as kompetenciameresben, Uj Pedagogiai Szemle, December, 36-50. Breiter, A., & Light, D. (2004). Decision Support Systems in Schools -from Data Collection to Decision Making. Paper presented at the America's Conference on Information Systems (AMCIS), New York, NY. Brown, J. S., & Duguid, P. (2000). The Social Life of Information. Boston, MA: Harvard Business School Press. Coe, R. (2002). Evidence on the Role and Impact of Performance Feedback in Schools. In A. J. Visscher & R. Coe (Eds.), School Improvement Through Performance Feedback (pp. 326). Lisse: Swets & Zeitlinger. Drucker, P. F. (1989). The New Realities: In Government and Politics. In Economics and Business. In Society and World View. New York, NY: Harper & Row. Earl, M. J. (2001). Knowledge Management Strategies: Towards a Taxonomy. Journal of Management Information Systems, 7^( 1), 215-233. Feldman, M. S., & March, J. G. (1981). Information in Organizations as Signal and Symbol. Administrative Science Quarterly, 26, 171-186. Gorry, G. A., & Scott Morton, M. S. (1971). A Framework for Management Information Systems. Sloan Management Review, 13{\), 55-70. HCSO. (2005). Data of Education (Preliminary data). Retrieved Sep 30th, 2005, from http://portal.ksh.hu/portal/page?_pageid=38,248221&_dad=portal&_schema=PORTAL Heistad, D., & Spicuzza, R. (2003, April). Beyond Zip code analyses: What good measurement has to offer and how it can enhance the instructional delivery to all students. Paper presented at the AERA Conference, Chicago. Light, D., Honey, M., Heinze, J., Brunner, C , Wexlar, D., Mandinach, E., et al. (2005). Linking Data and Learning - The Grow Network Study. Summary Report. New York: EDC's Center for Children and Technology. Light, D., Wexler, D., & Heinze, J. (2004). How Practitioners Interpret and Link Data to Instruction: Research Findings on New York City Schools' Implementation of the Grow Network. Paper presented at the Conference of the American Educational Research Association (AERA), San Diego, CA. Mitchell, D., & Lee, J. (1998). Quality school portfolio: Reporting on school goals and student achievement. Paper presented at the CRESST Conference, Los Angeles, CA.
Assessment Information Systems for Decision Support in Schools
17
Nonaka, I., & Takeuchi, H. (1995). The Knowledge Creating Company. Oxford: Oxford University Press. Orlikowski, W. J. (1992). The duality of technology: Rethinking the concept of technology in organizations. Organization Science, 5(3), 398-427. Sharkey, N., & Mumane, R. (2003). Helping K-12 Educators Learn from Student Assessment Data. Paper presented at the AERA, Chicago. Spielvogel, B., & Pasnik, S. (1999). From the School Room to the State House: Data Warehouse Solutions for Informed Decision-Making in Education. New York: EDC/Center for Children and Technology. Teddlie, C, Kochan, S., & Taylor, D. (2002). The ABC+Model for School Diagnosis, Feedback, and Improvement. In A. J. Visscher & R. Coe (Eds.), School Improvement Through Performance Feedback (pp. 75-114). Lisse: Swets & Zeitlinger. Thorn, C. A. (2001). Knowledge Management for Educational Information Systems: What is the State in the Field? Education Policy Analysis Archives, 9(47). Thorn, C. A. (2003). Making Decision Support Systems Useful in the Classroom: Designing a Needs Assessment Process. In I. Selwood, A. C. W. Fung & T. Paturi (Eds.), Information Technology in Educational Management. Dordrecht: Kluwer Academic Publishers. Visscher, A. J. (2002). A Framework for Studying School Performance Feedback Systems. In A. J. Visscher & R. Coe (Eds.), School Improvement Through Performance Feedback (pp. 41-72). Lisse: Swets & Zeitlinger. Visscher, A. J., & Coe, R. (Eds.). (2002). School Improvement Through Performance Feedback. Lisse: Swets & Zeitlinger. Weiss, C. H. (1998). Improving the use of evaluations: whose job is it anyway? In A. J. Reynolds & H. J. Walberg (Eds.), Advances in educational productivity. Volume 7 (pp. 263-276). Greenwich: JAI Press.