Downloaded from qualitysafety.bmj.com on October 3, 2013 - Published by group.bmj.com
Documenting organisational development in general practice using a group-based assessment method: the Maturity Matrix Tina Eriksson, Volkert Dirk Siersma, Louise Løgstrup, et al. Qual Saf Health Care 2010 19: e37 originally published online July 1, 2010
doi: 10.1136/qshc.2009.033787
Updated information and services can be found at: http://qualitysafety.bmj.com/content/19/5/e37.full.html
These include:
References
This article cites 20 articles, 10 of which can be accessed free at: http://qualitysafety.bmj.com/content/19/5/e37.full.html#ref-list-1
Email alerting service
Receive free email alerts when new articles cite this article. Sign up in the box at the top right corner of the online article.
Notes
To request permissions go to: http://group.bmj.com/group/rights-licensing/permissions
To order reprints go to: http://journals.bmj.com/cgi/reprintform
To subscribe to BMJ go to: http://group.bmj.com/subscribe/
Downloaded from qualitysafety.bmj.com on October 3, 2013 - Published by group.bmj.com
Original research
Documenting organisational development in general practice using a group-based assessment method: the Maturity Matrix Tina Eriksson,1 Volkert Dirk Siersma,2 Louise Løgstrup,1 Martin Sandberg Buch,3 Glyn Elwyn,4 Adrian Edwards4 1
Department of General Practice, Centre of Health and Society, University of Copenhagen, Copenhagen, Denmark 2 Research Unit and Department of General Practice, Institute of Public Health, University of Copenhagen, Copenhagen, Denmark 3 Danish Institute for Health Services Research, Copenhagen, Denmark 4 Department of Primary Care and Public Health, School of Medicine, Cardiff University, Neuadd Meirionnydd, Heath Park, Cardiff, UK Correspondence to Dr Tina Eriksson, Research Unit and Department of General Practice, Institute of Public Health, University of Copenhagen, Munkega˚rdsvej 41b, 3490 Kvistga˚rd, Denmark;
[email protected] Accepted 24 January 2010 Published Online First 1 July 2010
ABSTRACT Objective The Maturity Matrix (MM) comprises a formative evaluation instrument for primary care practices to self-assess their degree of organisational development in a group setting, guided by an external facilitator. The practice teams discuss organisational development, score their own performance and set improvement goals for the following year. The objective of this project was to introduce a translated and culturally adapted version of the MM in Denmark, to test its feasibility, to promote and document organisational change in general practices and to analyse associations between the recorded change(s) and structural factors in practices and the factors associated with the MM process. Setting MM was used by general practices in three counties in Denmark, in two assessment sessions 1 year apart. First rounds of MM visits were carried out in 2006e2007 in 60 practice teams (320 participants (163 GPs, 157 staff)) and the second round in 2007e2008. A total of 48 practice teams (228 participants (117 GPs; 111 staff) participated in both sessions. Method The MM sessions were the primary intervention. Moreover, in about half of the practices, the facilitator reminded practice teams of their goals by sending them the written report of the initial session and contacted the practices regularly by telephone reminding them of the goals they had set. Those practice teams had passwordprotected access to their own and benchmark data. Results Where the minimum possible is 0 and maximum possible is 8, the mean overall MM score increased from 4.4 to 5.3 (difference¼0.9, 95%, CI 0.76 to 1.06) from first to second sessions, indicating that development had taken place as measured by this group-based selfevaluation method. There was some evidence that lowerscoring dimensions were prioritised and more limited evidence that the prioritisation and interventions between meetings were helpful to achieve changes. Conclusions This study provides evidence that MM worked well in general practices in Denmark. Practice teams appeared to be learning about the process, directing their efforts more efficiently after a year’s experience of the project. This experience also informs the further improvement of the facilitation and follow-up components of the intervention.
INTRODUCTION Formative organisational assessment has been proposed as a means for quality improvement (QI) in primary care, but there is little evidence about whether such approaches successfully promote or Qual Saf Health Care 2010;19:e37. doi:10.1136/qshc.2009.033787
achieve improvement. Family practices are multidisciplinary organisations where teamwork is essential for optimal care.1 There is some evidence that including staff in decision-making is positively correlated with a higher quality of care,2 because influence and shared knowledge bring encouragement and work satisfaction.3 4 The Maturity Matrix (MM) is a formative evaluation instrument designed for primary care practices to self-assess their degree of organisational development in a group setting, guided by an external facilitator.5 The aspects covered by MM include a wide range of organisational issues (table 1). At the facilitated MM session, the whole practice team should be present. Without prior exposure to MM, each participant is given a blank profile and instructed to assess the level of organisational development for each dimension in their practice. After this, the facilitator conducts a discussion, taking every dimension in turn, achieving an agreement score based on the lowest level at which consensus occurs. Finally, the practice team may choose goals for future organisational development. In the Danish setting, practice teams were encouraged to appoint an anchor person responsible for each goal set. Apart from the Danish version reported here, adjusted versions have been made and tested in other parts of Europe, including UK, Germany, Holland, Switzerland and Slovenia, and recently the MM has been adapted for use in the international setting.5 6 The objective of this project was first to introduce a translated and culturally adapted version of MM in Denmark, to test its feasibility to promote and document organisational change in general practices. A secondary objective was to analyse associations between the recorded change(s) and structural factors within practices and factors associated with the MM process itself.
METHOD Setting MM was introduced in Denmark in 2004, and adapted in the years 2004e2006 through a pilot in four practices. Adjustments were made and a final version tested on a larger scale in 2007e2008 in three counties: Aarhus and Copenhagen, where facilitating units were already established, and Frederiksborg, where facilitators were recruited for this specific project. First rounds of MM sessions were carried out in the period from September 2006 to December 2007 with 60 practice teams (163 GPs, 157 staff) and the 1 of 7
2 of 7
No system for storage and locating clinical information is available The practice team Textbooks and peer-reviewed adapts clinical guidelines for use journals and guidelines at in the practice limited locations
Qual Saf Health Care 2010;19:e37. doi:10.1136/qshc.2009.033787
Use of guidelines on a wide range of chronic conditions performed regularly
Internet based information available at the clinical desktop
Practice team discuss the learning subjects most valuable for the team members personally and the practice as an organisation As above and linked to the practice development plan
GPs spend their annual allowance and staff make use of their four annual days for CME
As above, plus arrangements that ensures that action points are fulfilled are in place
Clinical information systems capable of providing a range of patient information
As above, and analysis is discussed at staff meetings
Significant events are reviewed at team meetings regularly
As above for all major drug types
Practice staff has annual appraisals
7
6
Patient feedback 8 systems are integrated into the performance of the organisation
Patient-led organisational changes are evaluated
The practice involves patients in planning services
5
4 Feedback from patients is reviewed at practice meetings
Patient information in waiting areas on general health topics
Feedback from patients results in organisational changes
3 Formal arrangements exists to collect feedback from patients
Practice team Budgets are allocated for CME meetings occur for GPs and staff regularly
Significant events are reviewed at team meetings occasionally
Resuscitation equipment (oxygen) and an acute box with relevant medications is easily available Patient information Significant events A practice team Practice team member takes on in waiting areas on generate meetings occur responsibility for organisational regularly and are various clinical changes from time maintenance of conditions well organised the resuscitation to time equipment and relevant medications Regular, agenda Patient information Significant events All practice team members are quality assurance are analysed led practice familiar with the clinically and is conducted meetings with written organisationally agreed minutes resuscitation and action points formulary
1
2
Patient information available, but unsystematic and random
A practice team member takes on responsibility for induction training of resuscitation to new team members As above and data All clinicians use Prescribing The practice team As above and Electronic Staff appraisals Arrangements that As above plus specialists internet based reviewed by an analysis generate perform training information involvement of are formalised ensures that information during provides practice external agency exercises in organisational extended team of resources knowledge consultations resuscitation at changes achieved by GPs community-based available for specific advice on least annually patients in waiting and staff through healthcare staff practice areas CME is shared prescribing data with practice team Resuscitation The impact of Individually All team members As above plus Practice Systematic audits As above and data All clinicians are Prescribing a significant event procedures are collaboration with tailored development plan receive external skilled at using the specialists are shared with are shared with quality-assured analysis is information provides practice is discussed with support in order to social care internet to find the public the public evaluated provided to services plan their CME practice staff information during specific casepatients about based advice on consultations harms and benefits specific ordinations
Regular complete audit for a wide range of chronic conditions performed regularly As above and data send to an external database
CME, Continuing Medical Education.
8 Results of all investigations, including x-rays available on computer
7 As above and external material is always ICPC coded
6 As above and all consultations ICPC coded on all diagnoses
Practice staff receives induction training
Practice staff Prescribing has job patterns is regularly reviewed descriptions by practice team and result in changes to policies
As above and internet based information available at limited locations
Regular complete audit for a wide range of chronic conditions performed regularly
5 As above and external material ICPC coded but only on chosen diagnoses or incompletely
Use of guidelines on a few chronic conditions are reviewed by clinical audit
Clinical guidelines As above and used A local formulary guides prescribing are integrated into during and renewals consultations daily clinical practice
Learning from patients
Informal arrangements exists to collect feedback from patients
CME arrangements Practice team for GPs and staff meetings occur infrequently and are in place at irregularly
Practice staff has written contracts
An analysis of prescribing is available
Handling of emergencies
No system for No written patient Significant events No resuscitation are recorded equipment or acute collecting information feedback from box is available available patients
Sharing information with Significant patients events
A written formulary guides practice teams’ handling of medical disasters
No CME arrangements exists for GPs and staff
Not relevant (single-handed practice with no staff)
Practice team meetings are not arranged
Practice meetings
No audit data on prescribing is available
Human resource management CME
Prescribing data Wages are in The practice team As above and renewed regularly are discussed by accordance with takes steps to the practice team labour marked implement the use contracts of guidelines in the practice
No policy for following guidelines
Prescribing
Regular audit cycles completed, but only for a few chronic conditions
Occasional audit cycles
Data collection exercises conducted but incomplete audit cycles
No clinical audit
Access to clinical information
4 As above and all consultations are ICPC-coded but only on chosen diagnoses or incompletely
1 All notes and external data (discharge letters, etc) are registered on computer 2 As above and non-digitalised correspondences are scanned or registered on computer 3 Lab data registered on computer
Audit
Use of guidelines
Danish version of the Maturity Matrix used
Clinical data
Table 1
Original research
Original research second round from November 2007 to November 2008 with 48 of these practice teams (228 participants (117 GPs; 111 staff)).
(six practices), lack of expectations of benefit of a second session (four practices) and change in GPs and/or staff since last session (three practices).
Participants An invitation to the MM project was sent to all general practices in the three participating counties, and the first to come forward were included. Participation was free of charge, and practices were reimbursed for the time spent on the sessions by county funds for QI.
MM instrument and MM sessions The MM instrument comprised 11 out of 12 described dimensions of general practice organisation (table 1). Each dimension has eight consecutive levels, from lower to higher attainment of organisational maturity. (The practices from Frederiksborg County were randomised to one of two different versions of the MM, because of a whish to test the influence of exposure to the dimension significant events on later reporting of events. That led to eight practices using a MM version where significant events were exchanged with learning from patients.) Facilitators were GPs with prior experience from outreach visits and QI in general practice. All facilitators were trained for the specific purpose of MM. In all cases but one, the facilitators were the same in the first and second visit.
Interventions between meetings In two of the counties involved (Aarhus and Frederiksborg) interventions in the 1-year period between first and second MM sessions was also performed. Interventions included passwordprotected access to the practice’s own data, including benchmarking to the whole project distribution of scores, on the project website. Facilitators reminded the practice team’s contact person of the results and goals recorded at the first MM session by telephone and email. In the third county (Copenhagen), there were no interventions between meetings. The decisions to perform interventions between meetings or not were in the hand of the local county authorities.
Non-participants in second round Among the 12 practices that did not participate in the second MM session, two had their first MM sessions so late that it was not possible to schedule a second session within the project period. The following reasons (sometimes multiple) for not participating in second sessions were: lack of time and resources Table 2
Measures Basic features of practices, such as number of GPs, staff composition and list size, etc were recorded. At the first and second MM sessions, facilitators recorded the consensus score of each MM dimension (11 per practice each time). They also noted whether the dimension was prioritised by the practice team, if an anchor person was appointed and what the developmental goals were for each prioritised dimension.
Analytical methods Data were coded twice in Access and linked together so corrections could be made by consulting original data. Differences in scores between the MM sessions and average number of prioritised dimensions (with and without anchor person) were tested by paired t tests. The change in prioritisation for each dimension was tested by Pearson c2 tests. The influences of the various practice and process characteristics on the MM development are inter-related. Therefore, consideration has to be given to the associations that are to be tested. To unravel the various hypotheses of interest (table 2), we postulated an influence diagram7 (figure 1), a graph structure where the various factors are depicted by nodes and causal influences by arrows. To test the influence postulated by a particular arrow, for example, between ‘interventions between meetings’ and ‘change,’ we have to adjust for influences from factors that may confound and mediate this influence; these are read from the graph as the nodes that lie on a path from ‘interventions between meetings’ to ‘change’ (mediating factors, eg, prioritisation) and the nodes that have arrows or edges into both follow-up and change (confounding factors, eg, practice size).7 Using the influence diagram (figure 1), we test the hypotheses described in table 2 using partial g coefficients.8 Note that by investigating the influence of a process factor on the score at the second meeting adjusted for the score at the first meeting, we effectively test for the effect of this factor on the change between these scores.
RESULTS The data set comprised the 48 practices that participated in both MM sessions. At both the first and second session, 11
Associations tested through graphical modelling Abbreviation
Association
Adjusted for
1
First score/prioritising
Between the first MM score and prioritising
2
Prioritising/second score
Between prioritising the dimension at first session and change in score
3
Interventions between meetings/second score*
4
5
Planned interventions between meetings/prioritising Size/prioritising
6
Size/second score*
Between (anticipation of) interventions between meetings (in Aarhus and Frederiksborg counties, but not in Copenhagen county) and the change in score (beyond the differential effect that interventions between meetings may have on prioritising the dimension at first sessions) Between (anticipation of) interventions between meetings on prioritising the dimension at first sessions (beyond the differential effect that interventions between meetings may have on the level of the first MM score) Between practice size on prioritising the dimension at first sessions (beyond the differential effect that practice size may have on the level of the first MM score) Between practice size on change in score (beyond the differential effect that practice size may have on prioritising the dimension at first sessions)
Interventions between meetings, practice size Interventions between meetings, practice size and first MM score Practice size, first MM score and prioritising
Practice size, first MM score
Interventions between meetings, first MM score Interventions between meetings, first MM score and prioritising
*By investigating the influence of a process factor on the score at the second MM session adjusted for the score at the first MM session, we effectively test for the effect of this factor on the change between these scores. MM, Maturity Matrix.
Qual Saf Health Care 2010;19:e37. doi:10.1136/qshc.2009.033787
3 of 7
Original research
D im e n s io n p r io r itiz e d at 1st MM s e s s io n s
P la n n e d in te r v e n tio n s between 1st and 2nd MM s e s s io n
4
5
2 3
S c o re a t 2nd MM s e s s io n
1
6
P r a c tic e s iz e
S c o re a t 1st MM m e e tin g
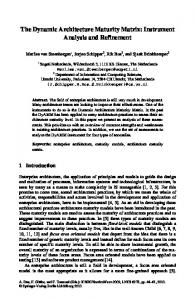
Figure 1 Influence diagram. The associations tested through graphical modelling are pictured here. The influences of the various practice and process characteristics on the (MM) development are inter-related. To unravel the various hypotheses of interest (table 2), we postulated this influence diagram,7 a graph structure where the various factors are depicted by nodes and causal influences by arrows. To test the influence postulated by a particular arrow, we have adjusted for influences from factors that may confound and mediate this influence.Using the influence diagram, we test the hypotheses described in table 2 using partial g coefficients.8 Note that by investigating the influence of a process factor on the score at the second meeting adjusted for the score at the first meeting, we effectively test for the effect of this factor on the change between these scores. The questions and interpretation of the results of the graphical modelling are displayed in table 5.
dimensions were processed, making a total of 528 processed dimensions per session (table 3). At the second MM sessions, practices scored themselves higher than on the first MM sessions. The mean MM score across dimensions increased from 4.4 to 5.3 (difference¼0.9; 95% CI 0.76 to 1.06; variation from 0.2 learning from patients to 1.8 emergencies) from first to second sessions (table 3). The largest changes were in emergencies, significant events, human resource management, practice meetings and continuing medical education. At the first MM sessions, practices prioritised 260 out of 548 (49%) dimensions for their next year’s development, and at the second MM sessions 212 (40%) of dimensions were prioritised (table 3). The number of prioritised dimensions where practice teams appointed an anchor person increased from 128 out 260 (49%) at the first to 142 out of 212 (67%) at the second MM sessions (table 3). The results of the graphical modelling are displayed in table 4. Interpretations are based on a combination of whether the results show patterns of positive or negative scores, and the statistical significance (table 5).
DISCUSSION Principal findings At the second MM sessions, practices scored themselves higher than on first MM sessions, showing a change in global score and across all dimensions. The number of dimensions that were prioritised by practices for their next year’s development plan dropped considerably from first to second sessions, whereas the number of prioritised dimensions where practice teams appointed an anchor person increased. The results of the graphical modelling provided some evidence that lower scoring dimensions were prioritised and more limited evidence that the 4 of 7
prioritisation and interventions between meetings was helpful to achieve changes, but that such changes were independent of practice size.
Strengths and weaknesses These are the first data that indicate a correlation between a formative QI intervention in general practice and reported development of the organisation. Perhaps the reasoning behind this correlation is circular, as the tool was both the basis of the intervention and the tool for evaluation. However, the findings are consistent with the results of a survey, distributed to all participating staff members and GPs in the project just before the second visit round, and carried out independently from the project itself:9 15% of practices stated that they planned changes, 22% of participants reported taking on responsibilities to be an anchor person, and free text comments indicated that MM may have contributed to new working routines in 55% of participating practices. A qualitative interview study, carried out among participants in this study, concluded that successful change was associated with: a clearly identified anchor person within the practice, a shared and regular meeting structure and an external facilitator who provides support and counselling during the implementation process. Failure to implement change was associated with: a high patient-related workload, staff or GP turnover (that seemed to affect small practices more), anchor persons who were either not clearly identified or ineffective, unsustained support from an external facilitator and no formal commitment to working with agreed changes.10 The study group comprised practices from a range of urban and rural settings, but self selection of practices sharing a common interest in organisational development cannot be ruled out. The study provides longitudinal data on progress in the project, with the project functioning both as evaluation and as an agent of the change. However, the MM scores are based on self-report and may reflect more favourable assessments than would be made by external assessors.11 The improved MM scores at second visit may represent a positive (social) response bias for the facilitators. Moreover, the changes reported were perceptions of influences on the organisation, not actual or observed changes, so until further data are available, caution is required in interpreting the findings. In the absence of a control group, the higher score at second sessions may be due to a general trend in practices. It is difficult to construct a valid control group in this type of intervention, partly due to selection bias of participation by practices already interested in this topic area. The change vectors tested through the graphical modelling were chosen so that there would be a good chance that the results would provide an insight into the details of the interrelated influences of the factors. Both factors that were structural (practice size), practice process related (prioritising) and external process related (anticipation of interventions between meetings) were tested. The negative resultsdthat prioritising was not associated with change, and that the size of practices covaries with neither prioritising nor changedwere surprising and not fully in line with the results of the qualitative data from the interview study. These results may be false-negative.
Interpretation of results in context of current literature The relationship between effective organisation and good quality in patient care is widely accepted, resulting in a growing interest for organisational QI tools.11e13 There is some evidence that Qual Saf Health Care 2010;19:e37. doi:10.1136/qshc.2009.033787
Qual Saf Health Care 2010;19:e37. doi:10.1136/qshc.2009.033787
6.3
5.3 5.1
4.5
4.1
5.6
3.8
3.1 3.3
4.4
48
48 48
48
48
48
43
45 8
528
5.3
4.9 3.5
5.2
6.0
5.1
5.5
5.9 6.2
7.1
4.7 3.1 4.4
Second
0.9
1.8 0.2
1.4
0.4
1.0
1.0
0.6 1.1
0.8
0.6 0.5 0.8
Mean
0.000 0.351
0.000
0.001
0.000
0.000
0.002 0.000
0.000
0.003 0.018 0.000
p Value
Mean Change and p value
28
0 0
3
1
4
2
3 1
1
5 6 2
N
0
>0[score at second higher than at first
0[score at second same as at first
Percentage
48%
58% 13%
53%
29%
50%
54%
35% 52%
58%
50% 40% 52%
260
21 2
34
11
32
25
24 30
16
25 11 29
N
Percentage
49%
47% 25%
79%
23%
67%
52%
50% 63%
33%
52% 23% 60%
212
19 1
22
12
21
21
27 23
9
20 10 27
N
Percentage
40%
42% 13%
51%
25%
44%
44%
56% 48%
19%
42% 21% 56%
p Value
0.671 0.715
0.010
0.766
0.040
0.470
0.540 0.151
0.104
0.307 0.805 0.679
128
12 1
19
4
15
12
13 14
6
15 5 12
N
Percentage
49%
57% 50%
56%
36%
47%
48%
54% 47%
38%
60% 45% 41%
142
13 1
16
6
14
13
15 16
4
19 9 16
N
67%
68% 100%
73%
50%
67%
62%
56% 70%
44%
95% 90% 59%
Percentage
Second MM sessions
First MM sessions
First MM sessions
Second MM sessions
Dimensions and p value difference in prioritisation plus anchor person
0.814 0.522
1000
0.336
0.665
0.186
0.378 0.404
0.217
0.206 0.160 0.660
p Value
No of practices (N) naming an anchor person for prioritised
No of practices (N) that prioritised the dimensions and p value of difference in prioritisation
*The practices from Frederiksborg County were randomised to one of two different versions of the MM, because of a whish to test the influence of exposure to the dimension significant events on later reporting of events. That led to eight practices using a MM version where significant events were exchanged with learning from patients.
4.1 2.6 3.6
First
Mean score at MM sessions
48 48 48
No of practices to assess the dimension twice N