Psychological Assessment 2010, Vol. 22, No. 1, 180 –198
© 2010 American Psychological Association 1040-3590/10/$12.00 DOI: 10.1037/a0018260
Assessment of Obsessive-Compulsive Symptom Dimensions: Development and Evaluation of the Dimensional Obsessive-Compulsive Scale Jonathan S. Abramowitz
Brett J. Deacon
University of North Carolina at Chapel Hill
University of Wyoming
Bunmi O. Olatunji
Michael G. Wheaton, Noah C. Berman, and Diane Losardo
Vanderbilt University
University of North Carolina at Chapel Hill
Kiara R. Timpano
Patrick B. McGrath
Florida State University
Alexian Brothers Behavioral Health Hospital
Bradley C. Riemann and Thomas Adams
Thro¨stur Bjo¨rgvinsson
Rogers Memorial Hospital
Menninger Clinic
Eric A. Storch
Lisa R. Hale
University of South Florida
University of Kansas Medical Center
Although several measures of obsessive-compulsive (OC) symptoms exist, most are limited in that they are not consistent with the most recent empirical findings on the nature and dimensional structure of obsessions and compulsions. In the present research, the authors developed and evaluated a measure called the Dimensional Obsessive-Compulsive Scale (DOCS) to address limitations of existing OC symptom measures. The DOCS is a 20-item measure that assesses the four dimensions of OC symptoms most reliably replicated in previous structural research. Factorial validity of the DOCS was supported by exploratory and confirmatory factor analyses of 3 samples, including individuals with OC disorder, those with other anxiety disorders, and nonclinical individuals. Scores on the DOCS displayed good performance on indices of reliability and validity, as well as sensitivity to treatment and diagnostic sensitivity, and hold promise as a measure of OC symptoms in clinical and research settings. Keywords: obsessive-compulsive disorder, dimensional obsessive-compulsive scale, symptom dimensions, Obsessive-Compulsive Inventory, assessment
Persistent unwanted intrusive thoughts, ideas, or images that provoke anxiety or distress (i.e., obsessions) and urges to perform behavioral or mental rituals (i.e., compulsions) are experienced by nearly everyone (e.g., Muris, Merckelbach, & Clavan, 1997; Rachman & de Silva, 1978). When these phenomena occupy at least 1 hr per day, are associated with high levels of distress, and interfere with functioning, the person may meet diagnostic criteria for obsessive-compulsive disorder (OCD; American Psychiatric Association [APA], 2000). Obsessions, whether clinical or nonclinical, generally concern the possibility of some unfortunate, harmful (to self or others), immoral (perhaps punishable), or otherwise feared outcome. Compulsions are functionally linked to obsessions in that they are deliberately performed to neutralize the obsessional thought, prevent or remove the feared outcome, or reduce obsessional anxiety (APA, 2000). Avoidance behavior may also be used to reduce obsessional fear; for example, someone with obsessions
Jonathan S. Abramowitz, Michael G. Wheaton, Noah C. Berman, and Diane Losardo, Department of Psychology, University of North Carolina at Chapel Hill; Brett J. Deacon, Department of Psychology, University of Wyoming; Bunmi O. Olatunji, Department of Psychology, Vanderbilt University; Kiara R. Timpano, Department of Psychology, Florida State University; Patrick B. McGrath, Alexian Brothers Behavioral Health Hospital, Hoffman Estates, Illinois; Bradley C. Riemann and Thomas Adams, Rogers Memorial Hospital, Oconomowoc, Wisconsin; Thro¨stur Bjo¨rgvinsson, Menninger Clinic, Houston, Texas; Eric A. Storch, Departments of Pediatrics and Psychiatry, University of South Florida; Lisa R. Hale, Department of Psychology, University of Kansas Medical Center. Kiara R. Timpano and Thro¨stur Bjo¨rgvinsson are now at the Department of Psychiatry, Harvard Medical School; Thomas Adams is now at the Department of Psychology, University of Arkansas. Correspondence concerning this article should be addressed to Jonathan S. Abramowitz, Department of Psychology, C.B. # 3270 (Davie Hall), University of North Carolina at Chapel Hill, Chapel Hill, NC 27599. E-mail:
[email protected] 180
DIMENSIONAL OBSESSIVE-COMPULSIVE SCALE
about contamination from “floor germs” might try to avoid contact with floors, but compulsively wash her or his hands if avoidance is not possible.
Heterogeneity and Dimensional Structure of Obsessive-Compulsive Symptoms Obsessions, compulsions, and avoidance strategies are thematically heterogeneous and tend to reflect the individual’s highly idiosyncratic concerns. Whereas one person may have obsessional doubts that he or she unknowingly struck a pedestrian while driving and therefore feels compelled to check the roadside, another might have obsessional thoughts of a sexual nature (e.g., incestuous images) leading to avoidance of certain situations (e.g., being alone with certain family members) and the use of mental rituals (e.g., prayer, thought suppression) to neutralize such “sinful” thoughts and reduce the fear of punishment from God. Still another individual might show all of these symptoms at once. Structural analyses indicate that obsessive-compulsive (OC) symptoms are dimensional and that particular sorts of obsessions and compulsions tend to co-occur (e.g., Mataix-Cols, RosarioCampos, & Leckman, 2005; McKay et al., 2004). The most consistently replicated OC symptom dimensions include (a) contamination obsessions and washing/cleaning compulsions; (b) obsessions about responsibility for causing harm or making mistakes and checking compulsions; (c) obsessions about order and symmetry and ordering/arranging compulsions; and (d) repugnant obsessional thoughts concerning sex, religion, and violence along with mental compulsive rituals and other covert neutralizing strategies (e.g., thought replacement). These dimensions are associated with distinct patterns of comorbidity, genetic transmission, neural substrates, and treatment response (e.g. Mataix-Cols et al., 2005). Although some have considered hoarding as an OC symptom dimension, research suggests that relative to the aforementioned dimensions, hoarding (a) is more strongly related with other sorts of psychopathology (e.g., personality disorders; e.g., Frost, Steketee, Williams, & Warren, 2000), (b) is associated with earlier age of onset, (c) tends to have distinct neural activity patterns and genetic susceptibility loci (Wheaton, Timpano, Lasalle-Ricci, & Murphy, 2008), and (d) has a weaker response to drug and psychological treatments with demonstrated efficacy for OCD (Abramowitz, Franklin, Schwartz, & Furr, 2003; Mataix-Cols, Rauch, Manzo, Jenike, & Baer, 1999). Thus, many authors now consider hoarding as a distinct syndrome from OCD (e.g., Abramowitz, Wheaton, & Storch, 2008; Frost & Steketee, 2008; Rachman, Elliott, Shafran, & Radomsky, 2009; Saxena, 2007; Wu & Watson, 2005).
Approaches to the Assessment of Obsessions and Compulsions The heterogeneity and idiosyncratic nature of OC symptoms present unique challenges to the development of content valid assessment instruments. Specifically, such instruments must assess the wide range of possible obsessions and compulsions without becoming too lengthy or unwieldy. Authors of OC symptom measures have dealt with this challenge in two ways. The most widely used approach has been to develop instruments containing items assessing specific and quintessential types of obsessions and
181
compulsions (e.g., “I feel that there are good and bad numbers”; Foa et al., 2002), which the respondent rates on a Likert-type scale of agreement, personal relevance, or associated distress. Recent examples include the Obsessive Compulsive Inventory (OCI; Foa, Kozak, Salkovskis, Coles, & Amir, 1998) and its revision (OCI-R; Foa et al., 2002), the Padua Inventory (PI; Sanavio, 1988) and its revision (PI-R; Burns, Keortge, Formea, & Sternberger, 1996), the Vancouver Obsessive Compulsive Inventory (VOCI; Thordarson et al., 2004), and the Schedule of Obsessions, Compulsions, and Pathological Impulses (SCOPI; Waton & Wu, 2005). The second approach to assessing OC symptom severity involves first identifying the respondent’s most salient or “principal” obsessions and compulsions and then rating these symptoms on multiple parameters of severity. The best example of this type of rating scale is the Yale-Brown Obsessive Compulsive Scale (YBOCS; Goodman, Price, Rasmussen, Mazure, Delgado, 1989; Goodman, Price, Rasmussen, Mazure, Fleischmann, et al., 1989) and its recent revision, the Dimensional Y-BOCS (DY-BOCS; Rosario-Campos et al., 2006), which can be administered in a self-report or an interview format. The Y-BOCS includes a checklist of over 60 specific types of obsessions and compulsions (over 100 items appear on the DY-BOCS checklist) that the respondent indicates as present or absent. Next, the principal obsessions and compulsions are collectively rated using 10 items that assess five parameters of obsessions (Items 1–5) and compulsions (Items 6 –10). The parameters are (a) time occupied/frequency, (b) interference in functioning, (c) associated distress, (d) degree of resistance, and (e) perceived control.
Limitations of Existing Measures Although an array of self-report and interview measures have been developed to assess OC symptoms, these measures have a number of important drawbacks that detract from their ability to provide a time efficient, empirically consistent, and conceptually clear assessment of OC symptom severity. One inherent limitation of measures using the first approach described above is that relative to respondents with fewer (or more circumscribed) types of obsessions and compulsions, those with multiple types of symptoms will endorse a greater number of scale items and therefore (all else being equal) obtain more severe scores. Thus, many existing OC symptom measures confound severity with the range of symptoms present. Actual OC severity, however, is independent of the number of different types of symptoms reported (e.g., McKay et al., 2004). For example, one patient might be singly obsessed with contamination yet be severely impaired by fear, avoidance, and compulsive washing rituals, whereas another patient might have sexual, religious, and violent obsessions, as well as mental rituals, yet experience only mild fear, avoidance, and impairment. Second, the vast heterogeneity and idiosyncratic nature of obsessions and compulsions forbids any given self-report measure from including an exhaustive list of these symptoms. Scale authors must therefore pick and choose which symptoms to include in scale items. Yet as a result, respondents whose obsessions and compulsions happen to match those assessed by items on the measure will appear more severe than those whose symptoms do not match. For example, the PI-R contains an abundance of items related to obsessions about harm; thus, individuals with more
182
ABRAMOWITZ ET AL.
harming obsessions (as opposed to symmetry obsessions, which are not assessed on the PI-R at all) will have higher scores than those with fewer harming obsessions. Often, obsessions that are uncommon (e.g., obsessional fear of developing schizophrenia) and rituals that are covert (e.g., mental rituals) are underrepresented on self-report measures. Thus, such scales also confound severity with the level of obscurity of the respondent’s obsessions and compulsions. Another limitation that applies to many measures using the first approach discussed above is that they contain a one-dimensional assessment of severity. For example on the VOCI, respondents indicate how much each symptom-based item is “true of you” (e.g., “not at all” to “very much”). Similarly, on the OCI-R, respondents rate their level of “distress” associated with 18 different types of obsessions and compulsions. Research, however, has found that OC symptom severity is multidimensional, consisting of parameters such as distress, functional interference, and the frequency or duration of obsessions and compulsions (Deacon & Abramowitz, 2005; Kim, Dysken, Pheley, & Hoover, 1994; McKay, Neziroglu, Stevens, & Yaryura-Tobias, 1998). The use of a single rating of item relevance, severity, or distress might account for the fact that some existing self-report measures of OC symptoms show strong correlations with measures of general anxiety and depression (i.e., lack discriminant evidence; Grabill et al., 2008). A fourth weakness of existing OC symptom measures is that these instruments assess obsessions separately from compulsions, thus treating these symptoms as disconnected clinical phenomena. As indicated above, however, structural analyses indicate that OC psychopathology does not distill neatly into obsessions and compulsions, but rather into dimensions characterized by both obsessions and compulsions (e.g., Amir, Foa, & Coles, 1997; Deacon & Abramowitz, 2005; McKay et al., 1998). Thus, the empirically established link between obsessions and compulsive rituals is not adequately captured by existing symptom measures. As a result, clinicians working to reduce these symptoms, and researchers looking to study them, do not have measures grounded in the proper conceptual framework for best understanding OC symptoms. A related conceptual difficulty, and fifth limitation of existing OC measures, is that avoidance behavior is not adequately captured. Most measures (e.g., OCI-R, Y-BOCS) contain no items assessing avoidance, whereas a few (e.g., the PI and PI-R) include only one or two items pertaining to avoidance of only very specific stimuli (e.g., public toilets). The general failure to account for avoidance, however, leads to underestimating OC symptom severity because avoidance is often used in place of compulsive rituals to reduce obsessional anxiety (e.g., avoiding public bathrooms in place of lengthy compulsive washing rituals). Thus, individuals with OCD who do not endorse many compulsions might have severe avoidance strategies that, although an important (and functionally debilitating) element of their OCD symptom picture, are not captured on existing rating scales. Finally, a sixth shortcoming of most OC symptom measures (the PI and its revision being exceptions) is that they include items assessing hoarding, which appears to be distinct from OCD (e.g., Rachman et al., 2009). As a result, these measures are inconsistent with the most up-to-date empirically derived structural framework of OC symptoms. Moreover, such measures are likely to overes-
timate OC symptom severity among individuals with hoarding behaviors.
The Need for a New OC Symptom Measure When the limitations of existing measures are considered collectively, one recognizes the need for a novel scale for assessing OC symptoms. Such a measure should (a) assess the severity of empirically established OC symptom dimensions (excluding hoarding) in a conceptually consistent manner; (b) measure symptom severity as a function of multiple empirically supported parameters; (c) include an assessment of avoidance behavior; (d) assess symptom severity independent of the number, range, or types of different obsessions and compulsions; and (e) remain fairly brief and easy to administer in clinical and research settings with clinical and nonclinical individuals. Such an instrument would provide the field with a brief self-report index that yields reliable, valid, and responsive scores and can be used in a variety of clinical and research settings with minimal burden. Accordingly, in the present article, we report on the development and evaluation of a new self-report scale—the Dimensional Obsessive-Compulsive Scale (DOCS)—which aims to address the aforementioned needs. Items on the DOCS were derived on the basis of present research on the structure of OC symptoms as well as on the parameters of OC symptom severity. The DOCS contains general descriptions and inclusive examples of obsessions and compulsions within each of the four empirically supported OC symptom dimensions, but does not contain items assessing specific obsessions or rituals. Rather, it assesses the severity of each symptom dimension in general and contains a multidimensional approach to severity ratings that includes the assessment of avoidance behavior. Thus, the instrument aims to capture the links between obsessions, compulsions, and avoidance within each symptom dimension, and assess OC symptom severity independently of number and type of obsessions and compulsions present. We hypothesized that the DOCS would evidence a stable fourfactor structure with each factor relating to a different OC symptom dimension. We further predicted that scores on the scale would show good evidence of reliability and validity. We also examined the DOCS as a diagnostic tool and compared its diagnostic accuracy with that of the OCI-R, which is the only other existing OC symptom measure whose diagnostic accuracy is empirically established. Because the OCI-R contains a Hoarding subscale, has difficulties with its Neutralizing subscale, and fails to assess avoidance behavior, we predicted that relative to the OCI-R, DOCS scores would better discriminate individuals with OCD from nonclinical individuals and those with other anxiety disorders. Finally, we evaluated the DOCS’ sensitivity to treatment effects and hypothesized that patients with OCD treated with cognitive behavioral therapy (i.e., exposure and response prevention; ERP) would show large pre–post treatment effect sizes as measured by this new instrument.
Method Item Development and Description Items for the DOCS were initially written collaboratively by Jonathan S. Abramowitz and Brett J. Deacon after considering
DIMENSIONAL OBSESSIVE-COMPULSIVE SCALE
research and clinical observations of the phenomenology and structure of OC symptoms (e.g., Amir et al., 1997; Antony, Purdon, & Summerfeldt, 2007; Clark, 2004; Deacon & Abramowitz, 2005; McKay et al., 1998), as well as based on extensive experience with OCD in clinical settings. The aim was to develop items that assessed the most consistently identified dimensions of OC symptoms as indicated by structural analyses of these symptoms (e.g., Mataix-Cols et al., 2005; McKay et al., 2004). These initial items were then sent to a larger group of experts on OCD and psychometricians, who were asked to provide suggestions for improvement from the standpoint of face validity and readability. Feedback regarding the clarity, reading level, and relevance of the items was also obtained from numerous individuals with OCD presenting to different clinics. Following the incorporation of this input, the final product was a self-report instrument consisting of 20 items; five items for each of the four most consistently identified dimensions in previous structural analyses of OC symptoms: (a) “contamination” (contamination obsessions and decontamination [washing and cleaning] compulsions), (b) “responsibility for harm, injury, or bad luck” (obsessions about causing harm by various means, and checking, reassurance seeking, and related compulsions), (c) “unacceptable obsessional thoughts” (violent, sexual, and religious obsessions with mental rituals and other forms of neutralizing), and (d) “symmetry, completeness, and exactness” (obsessions regarding something not being “just right” and compulsions involving ordering and repeating) (e.g., MataixCols et al., 2005). Hoarding was excluded for the reasons mentioned previously. Within each symptom dimension, five items assess the following parameters of severity (over the past month): (a) time occupied by obsessions and compulsions, (b) avoidance behavior, (c) associated distress, (d) functional interference, and (e) difficulty disregarding the obsessions and refraining from the compulsions. Items representing these five parameters of severity were chosen on the basis of structural analyses of OC symptom severity (e.g., Deacon & Abramowitz, 2005; Moritz et al., 2002), suggesting that these parameters are correlated with OC symptom severity. The past month was chosen as the time frame for rating severity on the basis of the use of this time frame in many other measures of OC symptoms (e.g., OCI and OCI-R; Foa et al., 2002, 1998). The items for each symptom dimension were worded specifically for the types of symptoms being assessed. For example, the item assessing avoidance related to contamination was worded, “To what extent have you avoided situations in order to prevent concerns with contamination or the need to excessively wash or clean?” whereas the item assessing avoidance related to responsibility for harm was worded, “To what extent have you avoided situations so that you did not have to check for danger or worry about causing harm or disasters?” This was done with the aim of increasing the specificity of the items assessing each symptom dimension. Each item is rated on a scale ranging from 0 (no symptom) to 4 (extreme symptoms). To further accommodate the vast heterogeneity of OC symptoms and the presence of obsessions and compulsions within each symptom dimension, the instructions for each set of five dimension-specific items include a brief description and several broad examples of the types of obsessions and compulsions observed in that dimension. The examples, which are meant to cover the range of symptoms observed within each dimension, clarify for
183
the respondent the form and function of each dimension’s fundamental obsessional fears, compulsive rituals, and avoidance behaviors. Thus, an advantage of the DOCS over existing self-report measures of OC symptoms is that rather than the respondent being forced to endorse a specific set of obsessions and compulsions, respondents rate the presence and severity of their own symptoms within different OC symptom dimensions. This response set also accommodates the clinical observation that some obsessions and compulsions can be present in more than one symptom dimension. For example, checking rituals often occurs within the responsibility for harm dimension, but might also be present in other dimensions such as checking for contaminated items. The symptom dimension descriptions and all 20 DOCS items appear in the Appendix. Finally, the DOCS items were constructed to be consistent with evidence that obsessions and compulsions are universal experiences, occurring in clinical and nonclinical individuals on a continuum of severity (Haslam, Williams, Kyrios, McKay, & Taylor, 2005; Olatunji, Williams, Haslam, Abramowitz, & Tolin, 2008). As the item wording reflects, an effort was made not to pathologize these phenomena and instead presuppose that respondents are somewhat familiar with them. This allows the DOCS to be viable in both clinical and nonclinical populations. An analysis of the reading level of the DOCS was conducted using Microsoft Word and revealed that the Flesch-Kincaid grade-level score was 9.6 and the Flesch reading ease score was 60.9. Taken together, these indices suggest that the DOCS is easily understandable for people aged 13–15 years and above or who read at about a 9th-grade level.
Participants The total study sample consisted of 1,557 adults, including 315 with OCD, 198 with other anxiety disorders (OADs), and 1,044 unselected undergraduate students. Members of the OCD group had presented for evaluation and treatment at the following sites: Anxiety and Stress Disorders Clinic at the University of North Carolina (Chapel Hill, NC; n ⫽ 38), OCD Treatment Program at Rogers Memorial Hospital (Oconomowoc, WI; n ⫽ 90), OCD and Related Disorders Program at Alexian Brothers Behavioral Health Hospital (Hoffman Estates, IL; n ⫽ 125), OCD Program at the Menninger Clinic (Houston, TX; n ⫽ 24), OCD Program at the University of Florida (Gainsville, FL; n ⫽ 26), and the Kansas City Center for Anxiety Treatment (Overland Park, KS; n ⫽ 12). All of these individuals met DSM–IV–TR (APA, 2000) criteria for OCD as the primary diagnosis as assessed by a structured or semistructured interview such as the Anxiety Disorders Interview Schedule (ADIS; DiNardo, Brown, & Barlow, 1994). Most (58%) had one or more additional diagnoses primarily consisting of depression or OADs. This group was 52.4% female, 93% Caucasian, and had a mean age of 28.53 (SD ⫽ 12.32). The proportion of this group who completed high school was 88.4%. A 2- or 4-year college degree was completed by 52.0%, and 13.8% had completed a graduate degree. The mean number of years of education for the OCD group was 13.60 (SD ⫽ 4.65). Patients with OADs presented at the following sites: the Anxiety and Stress Disorders Clinic at the University of North Carolina (Chapel Hill, NC; n ⫽ 37), the OCD Treatment Program at Rogers Memorial Hospital (Oconomowoc, WI; n ⫽ 7), the OCD and Related Disorders Program at Alexian Brothers Behavioral Health
184
ABRAMOWITZ ET AL.
Hospital (Hoffman Estates, IL; n ⫽ 137), and the Kansas City Center for Anxiety Treatment (Overland Park, KS; n ⫽ 17). Within this group, 69 patients (35%) had a diagnosis of panic disorder, 54 (27%) had a diagnosis of social phobia, 36 (16%) had a diagnosis of generalized anxiety disorder, 25 (13%) had a diagnosis of specific phobia, and 14 (7%) had a diagnosis of posttraumatic stress disorder. These diagnoses were established using a structured clinical interview such as the ADIS. Most participants (60%) in this group had one or more additional diagnoses, including anxiety and mood disorders. Those with a secondary or tertiary diagnosis of OCD were excluded from the present study. The OAD group was 49% female, 92% Caucasian, and had a mean age of 31.60 (SD ⫽ 14.20). The proportion of this group who completed high school was 83.4%. A 2- or 4-year college degree was completed by 59.0%, and 13.8% had completed a graduate degree. The mean number of years of education for the OAD group was 12.96 (SD ⫽ 4.98). The student sample was recruited from unscreened college populations at Vanderbilt University (Nashville, TN; n ⫽ 368), Florida State University (Tallahassee, FL; n ⫽ 238), and the University of Arkansas (Fayetteville, AR; n ⫽ 438). These participants, who were awarded course credit for participation in the present study, were 68% female, 77% Caucasian, and had a mean age of 20.17 (SD ⫽ 1.89).
Measures In addition to the 20-item DOCS (as described above), the following measures were used in this study: The OCI (Foa et al., 2002). The OCI-R is an 18-item selfreport questionnaire on which respondents rate the degree to which they have been bothered or distressed by 18 common symptoms of OCD in the past month on a scale ranging from 0 (not at all) to 4 (very much). Widely used in research with clinical and nonclinical samples, the OCI-R assesses six symptom domains: washing, checking, obsessing, neutralizing, ordering, and hoarding. Subscale scores range from 0 to 12. Research suggests that scores on the OCI-R and most of its subscales are valid indicators of OC symptoms, an exception being the Neutralizing subscale (Abramowitz & Deacon, 2006; Foa et al., 2002). The OCI-R is also sensitive to treatment effects (Abramowitz, Tolin, & Diefenbach, 2005). A limitation, however, is that each subscale contains only three items. Thus, given the extreme heterogeneity of OCD symptoms, OC symptom severity as measured by the OCI-R is dependent on the degree to which one’s symptoms match the specific items on each subscale. The OCI-R was completed by OCD, OAD, and student participants. The Y-BOCS ( Goodman, Price, Rasmussen, Mazure, Delgado, et al., 1989; Goodman, Price, Rasmussen, Mazure, Fleischmann, et al., 1989). The 10-item clinician-rated version of the Y-BOCS was administered to the OCD patient group only. Scores range from 0 (no symptoms) to 40 (extreme). The Y-BOCS performs well on most indices of reliability and validity, and it is sensitive to treatment-related changes in OC symptoms (Goodman, Price, Rasmussen, Mazure, Delgado, et al., 1989;, Goodman, Price, Rasmussen, Mazure, Fleischmann, et al., 1989). A limitation is that scores on the Y-BOCS are strongly correlated with mea-
sures of depression and general anxiety (e.g., Goodman, Price, Rasmussen, Mazure, Delgado, et al., 1989). Depression Anxiety Stress Scale (DASS; Lovibond & Lovibond, 1995). The DASS is a 21-item reliable and valid selfreport measure of general depression, hyperarousal, and tension (Antony, Bieling, Cox, Enns, & Swinson, 1998). It contains three seven-item subscales. The Depression subscale measures dysphoric mood (e.g., sadness), the Anxiety subscale measures symptoms of physical arousal and fear (e.g., trembling), and the Stress subscale measures symptoms such as tension, irritability, and overreaction to stressful events. The DASS was completed by 227 participants in the student group. Beck Anxiety Inventory (BAI; Beck, Epstein, Brown, & Steer, 1988). The OCD and OAD groups completed this widely used self-report measure of physiological and cognitive symptoms of general anxiety (e.g., sweating, fear of losing control). Respondents indicate the degree to which they have been bothered by each symptom during the past week. The BAI was designed to assess anxiety symptoms independently from depressive symptoms and performs very well on most indices of reliability and validity (Beck et al., 1988). Beck Depression Inventory (BDI; Beck, Steer, & Brown, 1996). This 21-item self-report scale assesses the severity of affective, cognitive, motivational, vegetative, and psychomotor components of depression. The BDI has stable psychometric properties, and there is strong evidence that scores on the measure are reliable and valid (Beck, Steer, & Garbin, 1988). Thus, the BDI is widely used in clinical research (Beck et al., 1996). The OCD and OAD groups completed the BDI in the present study. Social Interaction and Anxiety Scale (SIAS; Mattick & Clarke, 1998). A subset of each group completed the 20-item SIAS, a widely used self-report measure of social anxiety. Scores on the SIAS are reliable and valid indicators of the cognitive, affective, and behavioral aspects of social phobia (Mattick & Clarke, 1998).
Procedure OCD and OAD patients. The sites collecting patient data coordinated their intake assessment procedures for the purposes of this research so that the process for diagnosing OCD and other anxiety disorders were highly similar. All individuals presenting for evaluation and treatment completed paper-and-pencil versions of the self-report questionnaires (including the DOCS items) as indicated above. Next, a diagnostic interview was administered by a trained assessor to establish the presence of OCD or another anxiety disorder. Diagnoses were then confirmed using one of the following structured or semi-structured diagnostic interviews (depending on the site): the ADIS (DiNardo et al., 1994), Mini International Neuropsychiatric Interview (Sheehan et al., 1998), Structured Clinical Interview for DSM-IV (First, Spitzer, Gibbon, & Williams, 2002), or Y-BOCS (for OCD patients only). The interviewer then presented this assessment data to a more expert clinician (i.e., the site director or senior clinician), who subsequently met and reviewed the data with the patient. Although formal interrater reliability checks were not conducted at all sites, only patients for whom both interviewers agreed on diagnostic status were included in the study (i.e., 100% interrater agreement).
DIMENSIONAL OBSESSIVE-COMPULSIVE SCALE
Student sample. All students completed the self-report measures described above as part of a battery of questionnaires. At the Tallahassee and Arkansas sites, these measures were completed online. Research suggests that online methods for collecting selfreport data on OC symptoms and related phenomena yield results comparable to paper-and-pencil methods (Coles, Cook, & Blake, 2007). Test–retest sample. A subset of 210 students from the Nashville site completed a second administration of the DOCS 12 weeks after the first administration and also for course credit. This group was 58% female, had a mean age of 18.94 years (SD ⫽ 1.22, range ⫽ 18 –30), and was fairly ethnically diverse (71.3% Caucasian, 17% African American, 4% Asian, and 3% Hispanic). The 12-week time interval was chosen because it allowed us to maximize retention while also minimizing practice effects and allowing sufficient time for respondents to experience personal events that might influence their responses to the DOCS items. Participants were contacted via e-mail to complete the second administration. Treatment sensitivity sample. A subset of 68 OCD patients (57% female, mean age ⫽ 28.35, SD ⫽ 12.27) completed the DOCS, OCI-R, and BDI and were administered the Y-BOCS before and after receiving a trial of exposure and response prevention (ERP) at the Chicago and Wisconsin sites. The Y-BOCS was administered in interview format by a trained assessor not otherwise involved in the patient’s therapy. Treatment was similar across the two sites and consisted of ERP as described in the manual by Kozak and Foa (1997). Therapy was delivered in a partial hospitalization setting and consisted of 3– 6 hr of daily individual and group exposure therapy along with instructions to refrain from rituals (response prevention) between sessions. On average, patients received 25 sessions over the course of 5 weeks. The therapists were doctoral and master’s-level treatment providers who had been trained in the use of ERP. Over 80% of the patients in this sample were concomitantly receiving pharmacological treatment (e.g., serotonin reuptake inhibitors) for their OCD symptoms.
Data Analytic Strategy The approach to examining the psychometric properties and gathering evidence for the reliability and validity of DOCS scores as measures of OC symptoms involved five steps. First, the scale’s factor structure was examined. Second, reliability via internal consistency and test–retest coefficients was investigated. Analyses to examine various aspects of validity on the basis of relations to other variables constituted the third step. Fourth, the diagnostic accuracy of DOCS scores was examined. Lastly, sensitivity to treatment effects was investigated.
Results Preliminary Considerations Within each group, there were no site differences in the DOCS mean total scores: OCD, F(5, 259) ⫽ 0.41, p ⫽ .84; OADs, F(3, 150) ⫽ 1.13, p ⫽ .34; students, F(2, 887) ⫽ 0.78, p ⫽ .22. We therefore combined data from the various sites (within each group) for the analyses reported below. This also served to improve the
185
generalizability (external validity) of our findings. That is, the use of a scale construction sample consisting of respondents from different regions and universities ensured that our analyses would address whether the DOCS is broadly applicable, as opposed to being fitted to one particular sample. Brown (2006), for example, cautioned that in factor analysis, fitting a model to the specific characteristics of a given sample can lead to model overfitting, which undermines generalizability.
Factor Structure We investigated the factor structure of the DOCS using both exploratory and confirmatory factor analytic methods as described in Brown (2006). All of these analyses were carried out using Mplus (Muthe´n & Muthe´n, 2007) using a diagonally weighted least squares estimator, from the polychoric correlation matrix, as we have categorical outcome variables. First, the student sample was randomly divided into two groups using the SPSS 17.0 “Random sample of cases” function. To identify the lower order factor structure of the DOCS, we conducted an exploratory (common) factor analysis (EFA) using data from one group of students (n ⫽ 478). On the basis of these results, we then generated a measurement model and used confirmatory factor analysis (CFA) to test the goodness of fit of this model, and the fit of a model including a higher order factor, using data from the second student group (n ⫽ 477). We then performed identical lower order and higher order CFAs on the data from the combined OCD and OAD groups (n ⫽ 423). We combined the patient groups for the purpose of maximizing sample size. For the 20 DOCS items, the percentage of missing data for a given item ranged from 0% to 1.2% in the clinical samples and from 0.2% to 1.7% in the student sample. We handled missing data with a pairwise approach (Asparouhov & Muthe´n, 2007). EFA with the first student group. We used data from the first randomly selected group of students to conduct an exploratory factor analysis of the DOCS. The number of factors to retain was determined by parallel analysis, a statistical procedure for determining the break in the scree plot. This method is one of the most accurate techniques for determining the number of factors to retain across varying sample conditions (Zwick & Velicer, 1986). On the basis of the recommendations of Longman, Cota, Holden, and Fekken (1989), we conducted parallel analyses twice, once using the mean eigenvalues and once using the 95th percentile eigenvalues. We rotated lower order factors using an oblique (oblimin) transformation based on our assumption that the DOCS factors would be moderately correlated. The first five eigenvalues were 10.37, 1.92, 1.55, 1.29, and 0.71. Parallel analysis indicated an unambiguous and clearly interpretable four-factor solution for both the mean and 95th percentile eigenvalues. Table 1 presents the factor loadings and communalities for the four-factor solution. Together, the lower order factors explained 75.65% of the item variance. The magnitude of the communalities indicates that these factors accounted for a large portion of the variance in each item. As shown in Table 1, the factor structure of the DOCS reproduced the intended structure of the scale, with four 5-item factors assessing Contamination, Responsibility for harm and mistakes, Unacceptable Thoughts, and Symmetry. The four-factor solution demonstrated excellent simple structure (Thurstone, 1947), as all items had a salient loading on
ABRAMOWITZ ET AL.
186
Table 1 Exploratory Factor Analysis of the Dimensional Obsessive-Compulsive Scale: Factor Loadings and Communalities (h2) for the FourFactor Solution DOCS factor Item number and content 1. 2. 3. 4. 5. 6. 7. 8. 9. 10. 11. 12. 13. 14. 15. 16. 17. 18. 19. 20.
Factor 1: Contamination
Factor 2: Responsibility
Factor 3: Unacceptable Thoughts
Factor 4: Symmetry
h2
0.76 0.79 0.76 0.60 0.80 0.08 0.14 0.10 ⫺0.04 ⫺0.05 0.13 ⫺0.01 ⫺0.05 ⫺0.02 0.04 0.08 0.07 ⫺0.07 0.01 0.09
⫺0.06 ⫺0.03 0.06 0.15 0.09 0.71 0.69 0.78 0.72 0.85 ⫺0.04 0.09 0.17 ⫺0.02 0.01 ⫺0.04 0.11 0.16 0.11 ⫺0.11
⫺0.03 0.10 ⫺0.02 0.10 ⫺0.03 0.01 ⫺0.05 ⫺0.01 0.15 0.10 0.82 0.74 0.72 0.87 0.82 ⫺0.01 ⫺0.01 0.02 0.06 0.03
0.07 ⫺0.09 0.02 0.12 0.05 0.03 0.00 ⫺0.01 0.14 0.01 ⫺0.05 ⫺0.01 0.01 0.10 0.02 0.80 0.74 0.80 0.79 0.88
0.59 0.65 0.58 0.41 0.65 0.51 0.50 0.61 0.56 0.74 0.69 0.55 0.56 0.77 0.68 0.65 0.56 0.68 0.64 0.80
Contamination: Time spent Contamination: Avoidance Contamination: Distress Contamination: Interference Contamination: Control Responsibility: Time spent Responsibility: Avoidance Responsibility: Distress Responsibility: Interference Responsibility: Control Unacceptable Thoughts: Time spent Unacceptable Thoughts: Avoidance Unacceptable Thoughts: Distress Unacceptable Thoughts: Interference Unacceptable Thoughts: Control Symmetry: Time spent Symmetry: Avoidance Symmetry: Distress Symmetry: Interference Symmetry: Control
DOCS ⫽ Dimensional Obsessive-Compulsive Scale. Salient factor loadings are listed in boldface type.
Note.
one factor, no items displayed a salient loading on more than one factor, and no items failed to load on any factor. With four or more items demonstrating highly salient (ⱖ|.71|) loadings on each factor, the factor solution obtained in this analysis also satisfies Guadagnoli and Velicer’s (1988) most stringent criterion for stability and replicability. As shown in Table 2, Pearson correlations between factors were statistically significant ( ps ⬍ .001) and ranged from moderate to strong.
Table 2 Correlations Among the Factors in Exploratory and Confirmatory Factor Analyses of the Dimensional Obsessive-Compulsive Scale (DOCS) DOCS factor DOCS factor and label
1
2
3
4
Exploratory factor analysis Factor Factor Factor Factor
1: 2: 3: 4:
Contamination .49 Responsibility Unacceptable Thoughts Symmetry Confirmatory factor analysesa
.58 .59
.56 .59 .48
Factor Factor Factor Factor
1: 2: 3: 4:
Contamination Responsibility Unacceptable Thoughts Symmetry
.32 .44
.40 .50 .39
a
.44 .38 .15 .31
.32 .38
.27
Correlations for the student sample appear above the diagonal, and correlations for the clinical sample appear below the diagonal.
CFA with the second student sample. To verify this factor structure, we conducted a CFA in the second randomly selected student sample using a robust weighted least squares estimator in Mplus. Chi-square is often used for examining the adequacy of model fit; however, as sample size (and therefore, power) increases, this statistic overestimates lack of fit (Bollen, 1989). Jo¨reskog and So¨rbom (1989) and Bentler (1990) therefore advise against using chi-square to judge overall model fit. Thus, as in Pincus et al. (2009), we used multiple complementary fit indices to evaluate the factor structure obtained in the EFA. Specifically, as suggested by Hu and Bentler (1999), we evaluated goodness of fit using the standardized rootmean-square residual (SRMR), root-mean-square error of approximation (RMSEA), the comparative fit index (CFI), and the TuckerLewis index (TLI). Good model fit was defined by the following criteria (Hu & Bentler, 1999): RMSEA ⱕ .06; SRMR ⱕ .08; CFI ⱖ .95; and TLI ⱖ .95. The use of multiple indices provide a conservative and reliable evaluation of model fit relative to the use of a single-fit index. As expected, chi-square was significant, 2(72, N ⫽ 477) ⫽ 190.33, p ⫽ .000; however, all of the other goodness-of-fit indices converged in supporting the fit of the data to the four-factor model: RMSEA ⫽ .059, SRMR ⫽ .042, TLI ⫽ .99, CFI ⫽ .96. Inspection of standardized residuals indicated no localized points of ill fit in the solution (e.g., largest standardized residual ⫽ .13). Factor loading estimates revealed that the indicators were strongly related to their purported latent factors (see Table 3) consistent with the position that the DOCS measures four dimensions of OC symptoms. Moreover, the factors were moderately correlated with one another as shown in the bottom portion of Table 2.
DIMENSIONAL OBSESSIVE-COMPULSIVE SCALE
187
Table 3 Loadings (and Standard Errors) for the Final Four-Factor Solution of the Dimensional Obsessive-Compulsive Scale (DOCS) in the Student and Clinical Samples DOCS factor DOCS item Student sample 1. Contamination: Time spent 2. Contamination: Avoidance 3. Contamination: Distress 4. Contamination: Interference 5. Contamination: Control 6. Responsibility: Time spent 7. Responsibility: Avoidance 8. Responsibility: Distress 9. Responsibility: Interference 10. Responsibility: Control 11. Unacceptable Thoughts: Time spent 12. Unacceptable Thoughts: Avoidance 13. Unacceptable Thoughts: Distress 14. Unacceptable Thoughts: Interference 15. Unacceptable Thoughts: Control 16. Symmetry: Time spent 17. Symmetry: Avoidance 18. Symmetry: Distress 19. Symmetry: Interference 20. Symmetry: Control Clinical sample 1. Contamination: Time spent 2. Contamination: Avoidance 3. Contamination: Distress 4. Contamination: Interference 5. Contamination: Control 6. Responsibility: Time spent 7. Responsibility: Avoidance 8. Responsibility: Distress 9. Responsibility: Interference 10. Responsibility: Control 11. Unacceptable Thoughts: Time spent 12. Unacceptable Thoughts: Avoidance 13. Unacceptable Thoughts: Distress 14. Unacceptable Thoughts: Interference 15. Unacceptable Thoughts: Control 16. Symmetry: Time spent 17. Symmetry: Avoidance 18. Symmetry: Distress 19. Symmetry: Interference 20. Symmetry: Control
Factor 1: Contamination
Factor 2: Responsibility
Factor 3: Unacceptable Thoughts
Factor 4: Symmetry
1.00 (.00) 1.11 (.01) 1.04 (.01) 1.29 (.01) 1.20 (.01) 1.00 (.00) 0.91 (.01) 0.97 (.01) 1.06 (.01) 1.07 (.01) 1.00 (.00) 0.98 (.02) 1.02 (.01) 1.05 (.01) 1.08 (.01) 1.00 (.00) 1.03 (.01) 1.02 (.01) 1.09 (.01) 1.09 (.01) 1.00 (.00) 1.02 (.01) 0.99 (.01) 1.03 (.01) 1.04 (.01)
Next, we tested a higher order CFA model to determine whether a single higher order factor accounted for the interrelationships between the lower order factors. Again, aside from the expected chi-square result, all of the goodness-of-fit indices suggested that the higher order model fit the data well, 2 (63, N ⫽ 477) ⫽ 152.36, p ⫽ .000, RMSEA ⫽ .055, SRMR ⫽ .043, TLI ⫽ .993, CFI ⫽ .971. Inspection of standardized residuals indicated no localized points of ill fit in the solution (e.g., largest standardized residual ⫽ .12). Each of the first-order factors loaded strongly on the higher order factor (range of loadings ⫽ .98 –1.30). The results indicated that the higher order factor accounted for a significant proportion of the variance in the first-order factors (R2s ⫽ Contamination ⫽ .72, Responsibility ⫽ .80, Unacceptable Thoughts ⫽ .46, Symme-
1.00 (.00) 1.00 (.02) 1.05 (.01) 1.06 (.02) 1.07 (.01) 1.00 (.00) 0.92 (.02) 1.04 (.02) 1.03 (.02) 1.05 (.01) 1.00 (.00) 1.01 (.02) 1.06 (.02) 1.07 (.02) 1.05 (.01)
try ⫽ .63). Because the higher order solution did not result in a significant decrease in model fit, we concluded that the model provided a good account for the correlations among the firstorder factors (Brown, 2006). CFA with the clinical sample. We next sought to confirm the four-factor structure of the DOCS in the clinical participants (both OCD patients and OADs). As expected, the chi-square result for this model was again significant, 2(45, N ⫽ 423) ⫽ 191.41, p ⫽ .000; however, with the exception of the RMSEA, the fit indices for this model indicated a good fit: RMSEA ⫽ .089, SRMR ⫽ .044, TLI ⫽ .995, CFI ⫽ .982. Inspection of standardized residuals indicated no localized points of ill fit in the solution (e.g., largest standardized residual ⫽ .14). As shown in Table 2, the four factors were correlated with one another.
188
ABRAMOWITZ ET AL.
As in the student sample, we also tested whether a single higher order factor accounted for the interrelationships between the lower order factors in the clinical sample. Again, aside from the expected chi-square result, 2(22, N ⫽ 423) ⫽ 90.55, p ⫽ 000, three of the four fit indices suggested that the higher order model fit the data well: RMSEA ⫽ .086, SRMR ⫽ .053, TLI ⫽ .995, CFI ⫽ .992. Inspection of standardized residuals indicated no localized points of ill fit in the solution (e.g., largest standardized residual ⫽ .16). Each of the first-order factors loaded strongly on the higher order factor (range of loadings ⫽ .83–1.37). The results indicated that the higher order factor accounted for a significant proportion of the variance in the first-order factors (R2s ⫽ Contamination ⫽ .31, Responsibility ⫽ .64, Unacceptable Thoughts ⫽ .23, Symmetry ⫽ .41). Because the addition of a higher order factor to the model did not result in significant degradation in fit, we again concluded that the higher order model fit the data well. In both the higher order and lower order CFA models for the clinical sample, the RMSEA exceeded the threshold we applied for good model fit (Hu & Bentler, 1999). Accordingly, we explored possible explanations for this finding. First, RMSEA was not improved when we removed 17 multivariate outliers from the data set. Next, to investigate the possibility that model fit would be improved by specifying more factors, we conducted an EFA using robust weighted least squares as an estimator with multiple rules to determine the number of factors to retain, including inspection of the scree plot, parallel analysis, and factor interpretability. The results clearly supported a four-factor solution, and the quartimax rotated loadings indicated good simple structure, with every item having strong loadings (ⱖ.80) on only one factor and small loadings on all other factors (⬍.13). This suggests that the RMSEA was not impaired because the type and number of factors for the clinical sample were different from the factor structure in the student sample. Given these findings, and considering that other fit indices consistently indicated a good fit, we concluded that the four-factor model has acceptable fit in the clinical sample. This assumption is consistent with a recent study by Chen, Curran, Bollen, Kirby, and Paxton (2008), who found no empirical support for the use of universal cutoff points of RMSEA (these authors recommend considering RMSEA only in the context of other fit indices to inform model fit). Indeed, it is possible that our RMSEA values were inflated in the clinical sample due to extraneous variables such as use of psychotropic medications (e.g., Taylor et al., 2007). Thus, based on the EFA and CFA results, we conceptualized the DOCS as composed of four stable and robust factors, each composed of five items, with a higher order general OC factor (all 20 items) underlying the four dimensions. The DOCS’ four-factor model coincides with the empirically supported four-factor dimensional model of OC symptoms (e.g., Mataix-Cols et al., 2005; McKay et al., 2004). We computed unit-weighted sum-of-item scores (i.e., subscale scores) for each of the four DOCS factors: Contamination, Responsibility for harm, Unacceptable Thoughts, and Symmetry. Correlations between these subscale scores and the corresponding factor scores approached 1.0 (all rs ⬎ .99). As a result of this almost perfect overlap, and in order to increase the interpretability of our results, we used subscale scores in the remaining analyses reported in this article. This approach also approximates how the DOCS would be used in research and
clinical settings. Scores on each of the four subscales range from 0 (no symptoms) to 20 (extreme), and the subscale scores can be summed to produce a total DOCS score that ranges from 0 to 80.
Internal Consistency Coefficients Cronbach’s alpha. Although Cronbach’s coefficient alpha has limitations as an index of internal consistency, experts disagree over whether any other particular index is preferable (e.g., Brown, 2006). Given that alpha is so widely used, and therefore can be compared across measures, we chose to use it in the present study. As is shown in Table 4, Cronbach’s alpha values for the DOCS total score and each of the four subscales were in the good to excellent range (Nunnally & Bernstein, 1994). Correlations between DOCS subscales and total score. Correlations between each of the four subscales and the total DOCS score are also presented in Table 4. As can be seen, the DOCS subscales show strong associations with the total score.
Test–Retest Coefficients Table 5 shows the mean DOCS total and subscale scores for the test–retest sample (n ⫽ 210 students) at both time points. Paired t tests indicated no significant changes in mean scores over the 12-week interval (range of ps ⫽ .12–.60). Pearson correlation coefficients between Time 1 and Time 2 scores are also reported in Table 5. Strong correlations were detected, which fell in the range of what is typically considered evidence of adequate stability of test scores (Nunnaly, 1970).
Validity Evidence Based on Relations to Other Variables We obtained validity evidence for DOCS total and subscale scores by analyzing relationships with other measures of OC symptoms (convergent evidence), measures of anxiety and depression (discriminant evidence), and group membership (criterion evidence). The results of these analyses are reported next.
Table 4 Cronbach’s Alpha for Dimensional Obsessive-Compulsive Scale (DOCS) Total Score and Subscales Group DOCS Cronbach’s alpha Total score Contamination Responsibility for Harm Unacceptable Thoughts Symmetry Correlation with DOCS total score Contamination Responsibility Unacceptable Thoughts Symmetry
OCD
OAD
Students
.90 .96 .94 .94 .94
.92 .84 .94 .92 .93
.93 .83 .86 .88 .89
.61 .72 .62 .64
.68 .78 .72 .77
.80 .83 .77 .81
Note. OCD ⫽ obsessive-compulsive disorder; OAD ⫽ other anxiety disorders.
DIMENSIONAL OBSESSIVE-COMPULSIVE SCALE
Convergent and discriminant correlations. We predicted that the DOCS total score would be strongly correlated (i.e., r ⬎ .50) with other measures of OC symptoms (convergent measures). As can be seen in Table 6, these correlations ranged from .54 to .71 across the three participant groups. We also computed correlations between the DOCS total score and measures of depression, general anxiety and stress, and social anxiety (discriminant measures), predicting that these coefficients would be significantly weaker than those between the DOCS and measures of OC symptoms. As is shown in Table 6, these correlations ranged from .08 to .52, and tests of significant differences between the magnitude of dependent correlation coefficients (Cohen & Cohen, 1983) revealed that within each group, the DOCS was more strongly correlated with other measures of OCD symptoms than with these other constructs (all ps ⬍ .05). We next computed correlations between the DOCS subscales and the purportedly convergent subscales of the OCI-R, predicting correlations of ⱖ .50 between (a) DOCS Contamination and OCI-R Washing, (b) DOCS Responsibility and OCI-R Checking, (c) DOCS Unacceptable Thoughts and OCI-R Obsessing, and (d) DOCS Symmetry and OCI-R Ordering. Due to known limitations with the OCI-R Neutralizing subscale (e.g., Abramowitz & Deacon, 2006), and the absence of a DOCS subscale to correspond with the OCI-R Hoarding subscale, we excluded these two OCI-R subscales from our predictions. Results from these analyses appear in Table 7. As can be seen, scores on the DOCS Contamination and Unacceptable Thoughts subscales were uniformly strongly correlated (rs ⬎ .50) with scores on the corresponding OCI-R subscales in all three participant groups. Although the DOCS Responsibility and Symmetry subscales were strongly correlated with their corresponding OCI-R subscales in the OCD and student samples, this was not the case in the OAD sample. Correlations with noncorresponding OCI-R subscales and with measures of anxiety and depression (also presented in Table 7) revealed only weak to moderate relationships for the Contamination and Unacceptable Thoughts subscales of the DOCS. Moreover, significance tests indicated that correlations between these DOCS subscales and the measures of dissimilar constructs, including dissimilar OCI-R subscales, were significantly weaker than correlations with the corresponding OCI-R subscales (all ps ⬍ .01). Although correlations between the DOCS Responsibility and Symmetry subscales and measures of depression and anxiety were only weak to moderate and significantly weaker ( ps ⬍ .05) than correlations with the correspond-
Table 5 Means, Standard Deviations, and Test–Retest Coefficients for the Dimensional Obsessive-Compulsive Scale (DOCS) Total Score and Subscales (n ⫽ 210) DOCS scale Total score Contamination Responsibility for Harm Unacceptable Thoughts Symmetry
Time 1 M (SD)
Time 2 M (SD)
Paired t(209)
Test–retest r
10.57 (9.83) 2.50 (2.87)
10.13 (10.31) 2.40 (2.91)
0.74 0.55
.66 .58
2.41 (2.82)
2.71 (2.96)
1.56
.56
2.99 (3.09) 2.56 (3.23)
2.63 (2.92) 2.39 (3.39)
1.31 0.89
.55 .66
189
Table 6 Pearson Correlations (With Sample Size) Between the Dimensional Obsessive-Compulsive Scale (DOCS) Total Score and Covergent and Discriminant Measures by Group Group Measure Convergent measures Y-BOCS total score OCI-R total score Discriminant measures DASS Depression DASS Anxiety DASS Stress BAI BDI SIAS
OCD
OAD
Students
(114) .54 (244) .69
(135) .65
(514) .71 (227) .37 (227) .52 (227) .52
(169) .33 (213) .38 (42) .08
(121) .34 (151) .46 (84) .28
(227) .40
Note. All correlations are significant at p ⬍ .01. OCD ⫽ obsessivecompulsive disorder; OAD ⫽ other anxiety disorders; Y-BOCS ⫽ YaleBrown Obsessive Compulsive Scale; OCI-R ⫽ Obsessive Compulsive Inventory-Revised; DASS ⫽ Depression, Anxiety, and Stress Scale; BAI ⫽ Beck Anxiety Inventory; BDI ⫽ Beck Depression Inventory; SIAS ⫽ Social Interaction and Anxiety Scale.
ing OCI-R subscale, some correlations with dissimilar OCI-R subscales in the student and OAD (but not in the OCD) groups were also in the moderate to strong range and not significantly weaker than correlations with the corresponding OCI-R subscale. Criterion evidence. Means and standard deviations for the DOCS total and subscale scores by group are presented in Table 8. A comparison of the mean total scores using a one-way analysis of variance (ANOVA) revealed a significant main effect of group, F(2, 1298) ⫽ 245.91, p ⫽ .001. Post hoc comparisons (Tukey’s honestly significant difference [HSD] test) revealed that the OCD group had significantly higher scores than the OAD group, which had higher scores than the student group (all ps ⬍ .05). For the DOCS subscales, we computed a multivariate ANOVA as an omnibus test, in which the dependent variables were the four subscale scores, and the independent variable was participant group. The multivariate effect of group was significant, Pilai F(8, 2586) ⫽ 82.37, p ⫽ .000. Univariate ANOVAs conducted for each subscale indicated significant between-group differences (all ps ⬍ .05), and follow-up Tukey’s HSD tests revealed that on each subscale, the OCD group scored significantly higher than the OAD group, which scored significantly higher than the student group (all ps ⬍ .05). Taken together, these findings provide evidence that scores on the DOCS and its subscales discriminate people with OCD from those with OADs, and from unselected university students.1
Diagnostic Sensitivity We examined the potential for the DOCS to be used as a diagnostic tool in three steps. First, we conducted receiver oper1
Because the student group included a smaller proportion of Caucasian participants (77%) relative to the other groups (OCD ⫽ 92%, OAD ⫽ 93%), 2(2, N ⫽ 1462) ⫽ 50.08, we examined whether ethnicity moderated between group differences observed on the DOCS total and subscale scores. These analyses, however, revealed no effect of ethnicity for any of the DOCS scales (all ps ⬎ .05).
ABRAMOWITZ ET AL.
190
Table 7 Correlations Between Dimensional Obsessive-Compulsive Scale (DOCS) Subscales and Other Measures DOCS subscale Contamination Measure OCI-R OCI-R OCI-R OCI-R OCI-R OCI-R BAI DASS BDI SIAS
Washing Checking Obsessing Ordering Neutralizing Hoarding
OCD ⴱ
OAD ⴱ
.88 .25ⴱ .04 .23ⴱ .12 .02 .21ⴱ
.57 .47ⴱ .37ⴱ .49ⴱ .34ⴱ .28ⴱ .02
.10 .06
.20ⴱ .14ⴱ
Responsibility Stud. ⴱ
.73 .43ⴱ .44ⴱ .43ⴱ .37ⴱ .34ⴱ .37ⴱ ⴱ
.33
OCD
OAD
.17 .50 .33 .22 .32 .05 .21ⴱ
.43 .47 .46 .26 .37 .32 .33ⴱ
.31ⴱ .11
.21ⴱ .08
Unacceptable Thoughts Stud. ⴱ
.37 .52ⴱ .47ⴱ .36ⴱ .36ⴱ .40ⴱ .42ⴱ ⴱ
.34
OCD
OAD ⴱ
.04 .16 .61ⴱ .06 .23ⴱ .06 .36ⴱ
.26 .24 .60ⴱ .14 .27ⴱ .07 .29ⴱ
.30ⴱ .07
.45ⴱ .26ⴱ
Symmetry
Stud. ⴱ
.30 .33ⴱ .64ⴱ .27ⴱ .33ⴱ .34ⴱ .47 ⴱ
.34
OCD
OAD ⴱ
.11 .39ⴱ .11 .67ⴱ .37ⴱ .31ⴱ .26ⴱ
.44 .64ⴱ .38ⴱ .39ⴱ .60ⴱ .28ⴱ .16
.24ⴱ .19
.32 .27ⴱ
Stud. .40ⴱ .45ⴱ .41ⴱ .59ⴱ .51ⴱ .29ⴱ .37 .24ⴱ
Note. OCD ⫽ obsessive-compulsive disorder (n ⫽ 251); OAD ⫽ other anxiety disorders (n ⫽ 137); Stud. ⫽ student sample (n ⫽ 517); OCI-R ⫽ Obsessive-Compulsive Inventory-Revised. Boldface type reflects hypothesized correlations between corresponding subscales. ⴱ p ⬍ .002 (Bonferoni corrected, calculated within each diagnostic group).
ating characteristic (ROC) analyses, which uses the association between sensitivity and specificity to estimate the area under the curve (AUC) to indicate how well scores on a measure distinguish between positive (i.e., a diagnosis of OCD) and negative (i.e., no diagnosis or a different anxiety disorder diagnosis) cases. A value of 1.0 indicates perfect diagnostic prediction, whereas a value of .50 indicates the level of chance. Second, we compared the diagnostic accuracy of DOCS scores with OCI-R scores. The OCI-R was chosen as the measure for comparison because it is the only measure of OC symptoms for which diagnostic accuracy has previously been empirically established and because it was administered to all diagnostic groups in the present study. Finally, we established a cutoff score with optimal diagnostic accuracy for distinguishing between individuals with OCD and those with other anxiety disorders. Diagnostic accuracy of DOCS total and subscale scores. We conducted ROC analyses for the DOCS total and subscale scores to determine which best distinguished patients with OCD from (a) nonclinical participants and (b) those with other anxiety disorders. In distinguishing individuals with OCD from nonclinical participants, AUC estimates for the four DOCS subscales ranged from .62 (Contamination) to .80 (Unacceptable Thoughts). The DOCS total score, however, evidenced the highest AUC (.86, Table 8 Mean (and Standard Deviation) Dimensional ObsessiveCompulsive Scale (DOCS) Total and Subscale Scores by Group Group DOCS
OCD
OAD
Students
Total score Contamination Responsibility Unacceptable Thoughts Symmetry
30.06 (15.49)a 6.53 (6.40)a 7.54 (5.84)a 9.73 (6.20)a 6.13 (5.50)a
16.75 (13.14)b 3.07 (2.76)b 4.21 (4.87)b 7.17 (5.46)b 3.41 (4.66)b
11.93 (9.87)c 2.03 (2.89)c 2.86 (2.90)c 3.08 (3.25)c 2.31 (2.80)c
Note. OCD ⫽ obsessive-compulsive disorder; OAD ⫽ other anxiety disorders. Groups with different superscripts differ significantly at p ⬍ .05.
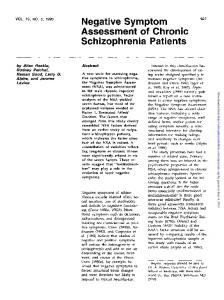
95% confidence interval [CI] ⫽ .84 –.89). In distinguishing individuals with OCD from those with other anxiety disorders, AUC estimates for the four subscales ranged from .62 (Unacceptable Thoughts) to .70 (Contamination). Again, however, the DOCS total score evidenced the highest AUC (.77, 95% CI ⫽ .73–.82). These data indicate that the DOCS total score discriminates individuals with OCD extremely well from nonclinical individuals, and quite well from those with other anxiety disorders. Accordingly, we elected to use total scores to examine the diagnostic accuracy of the DOCS. Diagnostic accuracy of DOCS scores relative to OCI-R scores. How does the diagnostic accuracy of DOCS scores compare with scores on the OCI-R, a widely used OC symptom measure? An ROC analysis on the OCI-R total score revealed AUC estimates of .80 (OCD vs. nonclinical participants) and .70 (OCD vs. other anxiety disorders). As shown in Figure 1, direct comparisons between the two measures revealed significantly greater AUC estimates for DOCS scores relative to OCI-R scores in discriminating between OCD patients and nonclinical individuals (see Figure 1a; difference in AUC ⫽ .06; Z ⫽ 4.68, p ⫽ .000) and between OCD patients and those with other anxiety disorders (see Figure 1b; difference in AUC ⫽ .08; Z ⫽ 3.57, p ⫽ .000). Thus, the DOCS total score appears to have greater diagnostic accuracy than the OCI-R total score for identifying OCD patients relative to nonpatients and those with other anxiety disorders. Diagnostically accurate cutoff scores. Next, we examined the accuracy of different DOCS cutoff scores in correctly classifying patients as having a primary diagnosis of OCD or a different anxiety disorder. We evaluated diagnostic accuracy by calculating the sensitivity and specificity of various DOCS total scores. Sensitivity refers to the percentage of patients correctly classified as having OCD (i.e., true positives), whereas specificity refers to the percentage of patients correctly classified as having a different anxiety disorder (i.e., true negatives). A cutoff score of 21 provided the best balance between sensitivity and specificity in classifying OCD patients from those with other anxiety disorders. This cutoff score correctly classified about 70% of OCD patients (sensitivity) and 70% of patients with other anxiety disorders (speci-
DIMENSIONAL OBSESSIVE-COMPULSIVE SCALE
191
Figure 1. Receiver operating characteristic curves for the OCD/nonclinical sample (1a) and OCD/other anxiety disorder sample (1b).
ficity). Similar analyses revealed that a cutoff score of 18 provided the best balance between sensitivity and specificity in classifying OCD patients from nonclinical adults. This cutoff score correctly classified about 78% (sensitivity) of OCD patients and 78% of nonclinical adults (specificity).
Sensitivity to Treatment Effects We evaluated the DOCS’ potential for use as a treatment outcome measure by assessing the extent to which scores reflect responsiveness to effective treatment for OCD—namely, cognitive
behavioral therapy by ERP. The analyses below were performed using a subset of 68 OCD patients (57% female, mean age ⫽ 28.35, SD ⫽ 12.27) who received ERP treatment at the Chicago and Wisconsin sites. Preliminary considerations. Both the DOCS and OCI-R contain subscales that may not pertain to every patient’s particular presentation of OCD and therefore could suppress the measure’s sensitivity to treatment. To address this issue in our analyses, we computed pre- and posttreatment scores for each patient on only the DOCS and OCI-R subscale with the highest score (i.e., most
ABRAMOWITZ ET AL.
192
severe) at pretreatment. Hereafter, this dependent variable is referred to as DOCS (or OCI-R) main (range ⫽ 0 –20 for the DOCS, range ⫽ 0 –12 for the OCI-R). In cases in which two or more subscales tied for the highest score at pretreatment (i.e., the patient had multiple “main” symptoms), the posttreatment DOCS or OCI-R main score was computed as the mean of the corresponding posttreatment subscale scores. Comparison of pre- and posttreatment scores. Table 9 shows the sample’s mean pre- and posttreatment scores and percentage of change on each outcome measure. Whereas the pretreatment mean Y-BOCS total score fell within the severe range of symptoms, at posttreatment the mean score was at the high end of the mild range, indicating that significant improvement occurred for the individuals who received ERP. Repeated measures t tests (also presented in Table 9) indicated that all pre- to posttreatment contrasts were significant at the Bonferroni corrected p ⬍ .001 value. Treatment effect sizes. To compare the magnitude of treatment effects as assessed by different outcome measures, we converted changes from pre- to posttreatment on each scale to Cohen’s (1977) d, a standardized measure of effect size. As shown in the far right column of Table 9, effect sizes derived from the DOCS total and main scores were large and similar in magnitude to those derived from the OCI-R and the Y-BOCS. As expected, the more specific “DOCS main” effect size was larger than the overall DOCS total score. The findings reported above provide evidence that scores on the DOCS are sensitive to the effects of empirically supported treatment for OCD, especially when the subscale(s) representing one’s main OC symptoms is considered.
Discussion Research on the nature of OC symptoms suggests that a conceptually sound measure of obsessions and compulsions should have the following qualities: It should (a) assess the severity of the four best supported OC symptom dimensions (Contamination, Responsibility for Harm and Mistakes, Symmetry/Incompleteness, and Unacceptable Thoughts), (b) measure symptom severity as a function of empirically supported parameters (including avoidance behavior), and (c) provide an index of severity that is independent of
Table 9 Pre- and Posttreatment Mean Scores for Patients With Obsessive-Compulsive Disorder Treated With Exposure and Response Prevention Pretreatment
Posttreatment
Measure
M (SD)
M (SD)
ta
d
Y-BOCS total DOCS total DOCS main OCI-R total OCI-R main BDI
28.47 (6.95) 30.25 (14.89) 13.51 (3.64) 27.29 (12.77) 9.73 (3.04) 28.51 (12.16)
15.00 (6.35) 15.49 (11.09) 6.44 (3.96) 11.05 (8.57) 4.18 (3.46) 10.22 (8.80)
7.52ⴱ 9.57ⴱ 14.37ⴱ 8.26ⴱ 9.06ⴱ 12.88ⴱ
1.94 0.99 1.94 1.27 1.83 1.50
Note. Y-BOCS ⫽ Yale-Brown Obsessive-Compulsive Scale; DOCS ⫽ Dimensional Obsessive-Compulsive Scale; OCI-R ⫽ ObsessiveCompulsive Inventory-Revised; BDI ⫽ Beck Depression Inventory. a df ⫽ 39. ⴱ p ⬍ .01.
the types of obsessions and compulsions present. Moreover, an instrument needs to be fairly brief and easy to administer in clinical and research settings with patient and nonpatient samples. We developed the DOCS with these needs in mind and found evidence that this new measure possessed sound psychometric properties. Consistent with our hypotheses, our data indicated a stable four-factor structure as evidenced by the uniformity of the factor structure across different diagnostic groups and across exploratory and confirmatory factor analytic methods. This uniformity is at least comparable to that of other OC symptom measures and is especially encouraging given that we obtained our data from multiple sites. Regarding evidence for the reliability of DOCS scores, internal consistency coefficients for the total and subscale scores across participant groups were at least equal to that of other widely used OC symptom measures such as the OCI-R and PI. Moreover, the test–retest coefficient, which was obtained only among nonclinical individuals in the present study, was comparable to the test–retest coefficient for OCI-R scores in a student population over a similar time interval (e.g., Hajcak, Huppert, Simons, & Foa, 2004). Scores on other measures, such as the PI-R and SCOPI, show evidence of slightly better stability over time relative to the DOCS and OCI-R. Although these results could be taken as evidence of instability of DOCS scores across time, an alternate explanation is that nonclinical individuals (including most students) tend to experience transient obsessions and compulsions that may vary in intensity on a regular basis (e.g., Rachman & de Silva, 1978). Thus, future research should compute the test–retest correlation for DOCS scores among a clinical sample of OCD patients to provide a more valid assessment of temporal stability. On the basis of our theoretically and empirically informed approach to item development, and the results of our analyses, we conclude that scores on the DOCS and its subscales are valid indicators of the severity of the four most empirically supported OC symptom dimensions. At minimum, the validity evidence for the DOCS total and subscale scores was comparable to that of other widely used OC symptom measures. Correlations between the DOCS total score and other measures of OC symptoms were stronger than correlations between the DOCS and measures of non-OC constructs. Relative to what has been reported for the OCI-R (e.g., Foa et al., 2002), DOCS scores appear to be at least as strongly correlated with scores on the Y-BOCS and no more strongly correlated with measures of depression. The discriminant evidence we found was strong and consistent relative to many other OC symptom measures, and may be the result of how the DOCS included items specifically worded for assessing each OC symptom dimension. The similar pattern of convergent and discriminant relationships we observed in the clinical and student samples indicate that the DOCS has relevance for use with both populations. The strong convergence between DOCS subscale scores and scores on corresponding OCI-R subscales demonstrates the validity of the DOCS’ dimensional approach, especially among OCD patients. Whereas scores on the Contamination and Unacceptable Thoughts subscales demonstrated excellent convergent and discriminant evidence within all three of our participant groups, the Responsibility and Symmetry subscale scores demonstrated these properties within the OCD and student groups, but not in the OAD group. The dimensional structure of OC symptoms, which provided the basis for the development of the DOCS, has been widely investigated in OCD patients and nonclinical individuals, but not in sam-
DIMENSIONAL OBSESSIVE-COMPULSIVE SCALE
ples of patients with OADs. Perhaps the particular obsessions and compulsions assessed by the Responsibility (e.g., harming obsessions, checking rituals) and Symmetry (e.g., order, neatness, arranging rituals) subscales of the DOCS co-occur with other sorts of OC symptoms in individuals with anxiety disorders other than OCD. Scores on the DOCS discriminated individuals with OCD from those with other anxiety disorders and from students as efficiently as observed with other OC symptom measures. Moreover, as predicted, a direct comparison of the diagnostic accuracy of DOCS and OCI-R total scores revealed that DOCS scores were significantly better at identifying individuals with OCD relative to nonpatients and those with other anxiety disorders. This may be the result of how the DOCS items were developed so as not to confound OC symptom severity with the number or types of obsessions and compulsions present. These data further indicate that the DOCS total score may be a useful clinical tool that can assist in making the diagnosis of OCD. Finally, scores on the DOCS demonstrated good sensitivity to change that was comparable to that reported for the Y-BOCS and OCI-R. In particular, the DOCS subscale score(s) measuring the patient’s main type of obsessions and compulsions appears to be most sensitive to detecting the effects of ERP treatment for OCD. These findings indicate that the DOCS shows promise as an instrument for measuring treatment outcome on particular OC symptom dimensions in research and clinical settings. Future research should address sensitivity to treatment by empirically supported pharmacotherapies. As we have discussed, OC symptoms are highly heterogeneous and idiosyncratic, yet they can be distilled into several dimensions that include both obsessional and compulsive symptoms. Although the DOCS does not contain items assessing specific obsessions and compulsions, our data indicate that its coverage, descriptions, and examples of the four OC dimensions and its severity items comprise a psychometrically sound measure, especially among individuals with OCD and student samples, that is, consistent with contemporary conceptualizations of OC symptoms. By including descriptions of obsessions and compulsions within each symptom dimension, this new measure circumvents an important problem inherent in many other OC symptom measures: that of needing to include enough specific scale items to ensure that all respondents’ symptoms are equally represented. The DOCS therefore allows for the assessment of OC symptom severity independent of the number and type of obsessions and compulsions present. It also provides a multidimensional rating of symptom severity that is consistent with previous research. As such, the DOCS is well suited for use in clinical settings to evaluate the effects of treatment on specific OC symptoms. It will also be of use in treatment and psychopathology research on OCD in which investigators are recognizing more the importance of a dimensional approach to studying these symptoms, as opposed to considering OCD as a homogeneous condition. The multisample data set used in this research has both strengths and limitations. The sample was clinically diverse and, to our knowledge, is the largest combined clinical and nonclinical data set to have been used in the development of an OC symptom measure. Using data collected from multiple sites can increase the generalizibility of findings; however, a limitation of this approach is that cross-site differences in variables, such as geographical location and subtle procedural variations (e.g., location of the DOCS in the questionnaire battery, completion of measures in
193
groups or individually), could represent confounds. Thus, future studies are necessary to further examine the psychometric properties of the DOCS in homogeneous samples. Another limitation of the present research is the use of a student sample instead of a community (nonstudent) control group. Indeed, students are not representative of the nonclinical population at large. Thus, there remains a need to evaluate the DOCS in a sample of healthy nonstudent individuals, which we are presently investigating. Moreover, although the OCD and OAD groups completed hard copies of the study measures, online administration was used for part of the student sample, and this difference may confound comparisons between groups. The absence of clinical patients in the test–retest sample and lack of interrater reliability estimates for the clinical diagnoses are also shortcomings of the present study. Future work should evaluate the test–retest reliability among nontreated patients with OCD. In addition, future research should evaluate relationships between the DOCS factors and measures of OC-related constructs such as cognitive variables that might underlie the various symptom dimensions. Finally, our readability statistics suggest that the DOCS is not well suited for children and adolescents. This, combined with evidence that the structure of OC symptoms is different in adults and children, indicates that it would be useful to develop a separate child version of the DOCS.
References Abramowitz, J. S., & Deacon, B. J. (2006). Psychometric properties and construct validty of the Obsessive-Compulsive Inventory-Revised: Replication and extension with a clinical sample. Journal of Anxiety Disorders, 20, 1016 –1035. Abramowitz, J. S., Franklin, M. E., Schwartz, S. A., & Furr, J. M. (2003). Symptom presentation and outcome of cognitive– behavioral therapy for obsessive– compulsive disorder. Journal of Consulting and Clinical Psychology, 71, 1049 –1057. Abramowitz, J. S., Tolin, D. F., & Diefenbach, G. J. (2005). Measuring change in OCD: Sensitivity of the Obsessive-Compulsive InventoryRevised. Journal of Psychopathology and Behavioral Assessment, 27, 317–324. Abramowitz, J., Wheaton, M. G., & Storch, E. A. (2008). The status of hoarding as a symptom of obsessive-compulsive disorder. Behaviour Research and Therapy, 46, 1026 –1033. American Psychiatric Association. (2000). Diagnostic and statistical manual of mental disorders (4th ed., text rev.). Washington DC: Author. Amir, N., Foa, E. B., & Coles, M. E. (1997). Factor structure of the Yale-Brown Obsessive Compulsive Scale. Psychological Assessment, 9, 312–316. Antony, M., Bieling, P. J., Cox, B., Enns, M., & Swinson, R. (1998). Psychometric properties of the 42-item and 21-item versions of the Depression, Anxiety, and Stress Scale (DASS) in clinical groups and a community sample. Psychological Assessment, 10, 176 –181. Antony, M., Purdon, C., & Summerfeldt, L. (2007). Psychological treatment of obsessive-compulsive disorder: Fundamentals and beyond. Washington, DC: American Psychological Association. Asparouhov, T., & Muthe´n, B. (2007, July). Computationally efficient estimation of multilevel high-dimensional latent variable models. Proceedings of the 2007 Joint Statistical Meetings, Section on Statistics in Epidemiology, Salt Lake City, Utah. Beck, A. T., Epstein, N., Brown, G., & Steer, R. A. (1988). An inventory for measuring clinical anxiety: Psychometric properties. Journal of Consulting and Clinical Psychology, 56, 893– 897. Beck, A. T., Steer, R. A., & Brown, G. K. (1996). Manual for the Beck Depression Inventory-II. San Antonio, TX: Psychological Corporation.
194
ABRAMOWITZ ET AL.
Beck, A. T., Steer, R. A., & Garbin, M. G. (1988). Psychometric properties of the Beck Depression Inventory: Twenty-five years of evaluation. Clinical Psychology Review, 8, 77–100. Bentler, P. M. (1990). Comparative fit indexes in structural models. Psychological Bulletin, 107, 238 –246. Bollen, K. A. (1989). Structural equations with latent variables. New York. NY: Wiley. Brown, T. A. (2006). Confirmatory factor analysis for applied research. New York, NY: Guilford Press. Burns, G., Keortge, S., Formea, G., & Sternberger, L. (1996). Revision of the Padua Inventory of Obsessive Compulsive Disorder Symptoms: Distinctions between worry, obsessions, and compulsions. Behavior Research and Therapy, 34, 163–173. Chen, F., Curran, P., Bollen, K., Kirby, J., & Paxton, P. (2008). An empirical evaluation of the use of fixed cutoff points in RMSEA test statistic in structural equation models. Sociological Methods and Research, 36, 462– 494. Clark, D. A. (2004). Cognitive-behavioral therapy for OCD. New York, NY: Guilford Press. Cohen, J. (1977). Statistical power analysis for the behavioral sciences (rev. ed.). New York, NY: Academic Press. Cohen, J., & Cohen, P. (1983). Applied multiple regression/correlation analysis for the behavioral sciences (2nd ed.). Hillsdale, NJ: Erlbaum. Coles, M. E., Cook, L., & Blake, T. (2007). Assessing obsessivecompulsive symptoms and cognitions on the Internet: Evidence for the comparability of paper and Internet administration. Behaviour Research and Therapy, 45, 2232–2240. Deacon, B. J., & Abramowitz, J. S. (2005). The Yale-Brown Obsessive Compulsive Scale: Factor analysis, construct validity, and suggestions for refinement. Journal of Anxiety Disorders, 19, 573–585. DiNardo, P., Brown, T., & Barlow, D. H. (1994). Anxiety Disorders Interview Schedule for DSM-IV: Lifetime version (ADIS-IV-LV). San Antonio, TX: Psychological Corporation. First, M. B., Spitzer, R. L., Gibbon, M., & Williams, J. (2002). Structured Clinical Interview for the DSM-IV Axis I Disorders. New York, NY: Biometrics Research Department, New York State Psychiatric Institute. Foa, E. B., Huppert, J. D., Leiberg, S., Langner, R., Kichic, R., Hajcak, G., & Salkovskis, P. M. (2002). The Obsessive-Compulsive Inventory: Development and validation of a short version. Psychological Assessment, 14, 485– 496. Foa, E. B., Kozak, M. J., Salkovskis, P. M., Coles, M. E., & Amir, N. (1998). The validation of a new obsessive– compulsive disorder scale: The Obsessive–Compulsive Inventory. Psychological Assessment, 10, 206 –214. Frost, R. O., & Steketee, G. (2008). Compulsive hoarding. In J. S. Abramowitz, D. McKay, & S. Taylor (Eds.), Obsessive-compulsive disorder: Subtypes and spectrum conditions (pp. 76 –93). New York, NY: Elsevier. Frost, R. O., Steketee, G., Williams, L., & Warren, R. (2000). Mood, disability, and personality disorder symptoms in hoarding, obsessive compulsive disorder, and control subjects. Behaviour Research and Therapy, 38, 1071–1082. Goodman, W. K., Price, L. H., Rasmussen, S. A., Mazure, C., Delgado, P., Heninger, G. R., & Charney, D. S. (1989). The Yale-Brown Obsessive Compulsive Scale: Validity. Archives of General Psychiatry, 46, 1012–1016. Goodman, W. K., Price, L. H., Rasmussen, S. A., Mazure, C., Fleischmann, R. L., Hill, C. L., Heninger, G. R., & Charney, D. S. (1989). The Yale-Brown Obsessive Compulsive Scale: Development, use, and reliability. Archives of General Psychiatry, 46, 1006 –1011. Grabill, K., Merlo, L., Duke, D., Harford, K., Keely, M., Geffken, G., & Storch, E. (2008). Assessment of obsessive-compulsive disorder: A review. Journal of Anxiety Disorders, 22, 1–17. Guadagnoli, E., & Velicer, W. F. (1988). Relation of sample size to the stability of component patterns. Psychological Bulletin, 103, 265–275.
Hajcak, G., Huppert, J. D., Simons, R. F., & Foa, E. B. (2004). Psychometric properties of the OCI-R in a college sample. Behavior Research and Therapy, 42, 115–123. Haslam, N., Williams, B. A., Kyrios, M., McKay, D., & Taylor, S. (2005). Subtyping obsessive-compulsive disorder: A taxometric analysis. Behavior Therapy, 36, 381–391. Hu, L., & Bentler, P. (1999). Cutoff criteria for fit indices in covariance structure analyses: Conventional criteria versus new alternatives. Structural Equation Modeling, 6, 1–55. Jo¨reskog, K. G., & So¨rbom, D. (1989). LISREL 7: A guide to the program and applications (2nd ed.). Chicago, IL: SPSS Publications. Kim, S. W., Dysken, M. W., Pheley, A. M., & Hoover, K. M. (1994). The Yale-Brown Obsessive Compulsive Scale: Measures of internal consistency. Psychiatry Research, 51, 203–211. Kozak, M. J., & Foa, E. B. (1997). Mastery of obsessive-compulsive disorder: Therapist manual. San Antonio, TX: Psychological Corporation. Longman, R. S., Cota, A. A., Holden, R. R., & Fekken, G. C. (1989). A regression equation for the parallel analysis criterion in principal components analysis: Mean and 95th percentile eigenvalues. Multivariate Behavioral Research, 24, 59 – 69. Lovibond, S. H., & Lovibond, P. F. (1995). Manual for the Depression Anxiety Stress Scales (2nd ed.). Sydney, Australia: Psychology Foundation of Australia. Mataix-Cols, D., Rauch, S. L., Manzo, P. A., Jenike, M. A., & Baer, L. (1999). Use of factor-analyzed symptom dimensions to predict outcome with serotonin reuptake inhibitors and placebo in the treatment of obsessivecompulsive disorder. American Journal of Psychiatry, 156, 1409 –1416. Mataix-Cols, D., Rosario-Campos, M. C., & Leckman, J. F. (2005). A multidimensional model of obsessive-compulsive disorder. American Journal of Psychiatry, 162, 228 –238. Mattick, R. P., & Clarke, J. C. (1998). Development and validation of measures of social phobia scrutiny fear and social interaction anxiety. Behavior Research and Therapy, 36, 455– 470. McKay, D., Abramowitz, J. S., Calamari, J. E., Kyrios, M., Radomsky, A. S., Sookman, D., Taylor, S., & Wilhelm, S. (2004). A critical evaluation of obsessive-compulsive disorder subtypes: Symptoms versus mechanisms. Clinical Psychology Review, 24, 283–313. McKay, D., Neziroglu, F., Stevens, K., & Yaryura-Tobias, J. A. (1998). The Yale-Brown Obsessive Compulsive Scale: Confirmatory factor analytic findings. Journal of Psychopathology and Behavioral Assessment, 20, 265–274. Moritz, S., Meier, B., Kloss, M., Jacobsen, D., Wein, C., Fricke, S., & Hand, I. (2002). Dimensional structure of the Yale-Brown Obsessive Compulsive Scale (Y-BOCS). Psychiatry Research, 109, 193–199. Muris, P., Merckelbach, H., & Clavan, M. (1997). Abnormal and normal compulsions. Behaviour Research and Therapy, 45, 249 –252. Muthe´n, L. K., & Muthe´n, B. O. (2007). Mplus user’s guide (5th ed.). Los Angeles, CA: Author. Nunally, J. (1970). Introduction to psychological measurement. New York, NY: McGraw-Hill. Nunnally, J. C., & Bernstein, I. H. (1994). Psychometric theory (3rd ed.). New York, NY: McGraw-Hill. Olatunji, B. O., Williams, B. J., Haslam, N., Abramowitz, J. S., & Tolin, D. F. (2008). The latent structure of obsessive-compulsive symptoms: A taxometric study. Depression and Anxiety, 25, 956 –968. Pincus, A., Ansell, E., Pimentel, C., Cain, N., Wright, A., & Levy, K. (2009). Initial construction and validation of the Pathological Narcissism Inventory. Psychological Assessment, 21, 365–379. Rachman, S., & de Silva, P. (1978). Abnormal and normal obsessions. Behaviour Research and Therapy, 16, 233–248. Rachman, S., Elliott, C., Shafran, R., & Radomsky, A. (2009). Separating hoarding from OCD. Behaviour Research and Therapy, 47, 520 –522. Rosario-Campos, M. C., Miguel, E. C., Quatrano, S., Chacon, P., Ferrao, Y., Findley, D., . . . Leckman, J. (2006). The dimensional Yale–Brown Obsessive–
DIMENSIONAL OBSESSIVE-COMPULSIVE SCALE Compulsive Scale (DY-BOCS): An instrument for assessing obsessive– compulsive symptom dimensions. Molecular Psychiatry, 11, 495–504. Sanavo, E. (1988). Obsessions and compulsions: The Padua Inventory. Behaviour Research and Therapy, 26, 169 –177. Saxena, S. (2007). Is compulsive hoarding a genetically and neurobiologically discrete syndrome? Implications for diagnostic classification. American Journal of Psychiatry, 164, 380 –384. Sheehan, D., Lecrubier, Y., Harnett-Sheehan, K., Amoriam, P., Janavs, J., Weiller, E., . . . Dunbar, G. (1998). The Mini International Neuropsychiatric Interview (M. I. N. I.): The development and validation of a structured diagnostic interview for DSM-IV and ICD-10. Journal of Clinical Psychiatry, 59(Suppl. 20), 22–33. Taylor, S., Zvolensky, M., Cox, B., Deacon, B., Heimberg, R., Ledley, D. R., . . . Cardenas, S. (2007). Robust dimensions of anxiety sensitivity: Development and initial validation of the anxiety sensitivity index-3 (ASI-3). Psychological Assessment, 19, 176 –188. Thordarson, D. S., Radomsky, A. S., Rachman, S., Shafran, R., Sawchuk,
195
C. N., & Hakstian, A. R. (2004). The Vancouver Obsessional Compulsive Inventory (VOCI). Behaviour Research & Therapy, 42, 1289 –1314. Thurstone, L. L. (1947). Multiple factor analysis. Chicago, IL: University of Chicago Press. Watson, D., & Wu, K. D. (2005). Development and validation of the Schedule of Compulsions, Obsessions, and Pathological Impulses (SCOPI). Assessment, 12, 50 – 65. Wheaton, M., Timpano, K., Lasalle-Ricci, V., & Murphy, D. (2008). Characterizing the hoarding phenotype in individuals with OCD: Associations with comorbidity, severity, and gender. Behaviour Research and Therapy, 22, 243–252. Wu, K. D., & Watson, D. (2005). Relations between hoarding and obsessive-compulsive disorder. Behaviour Research and Therapy, 43, 897–921. Zwick, W. R., & Velicer, W. F. (1986). Comparisons of five rules for determining the number of components to retain. Psychological Bulletin, 99, 432– 442.
Appendix Dimensional Obsessive-Compulsive Scale This questionnaire asks you about 4 different types of concerns that you might or might not experience. For each type there is a description of the kinds of thoughts (sometimes called obsessions) and behaviors (sometimes called rituals or compulsions) that are typical of that particular concern, followed by 5 questions about your experiences with these thoughts and behaviors. Please read each description carefully and answer the questions for each category based on your experiences in the last month.
Keep in mind that your experiences might be different than the examples listed above. Please circle the number next to your answer: 1.
About how much time have you spent each day thinking about contamination and engaging in washing or cleaning behaviors because of contamination? 0 None at all 1 Less than 1 hour each day 2 Between 1 and 3 hours each day 3 Between 3 and 8 hours each day 4 8 hours or more each day
2.
To what extent have you avoided situations in order to prevent concerns with contamination or having to spend time washing, cleaning, or showering? 0 None at all 1 A little avoidance 2 A moderate amount of avoidance 3 A great deal of avoidance 4 Extreme avoidance of nearly all things
3.
If you had thoughts about contamination but could not wash, clean, or shower (or otherwise remove the contamination), how distressed or anxious did you become? 0 Not at all distressed/anxious 1 Mildly distressed/anxious 2 Moderately distressed/anxious 3 Severely distressed/anxious 4 Extremely distressed/anxious
Category 1: Concerns about Germs and Contamination Examples . . . -Thoughts or feelings that you are contaminated because you came into contact with (or were nearby) a certain object or person. -The feeling of being contaminated because you were in a certain place (such as a bathroom). -Thoughts about germs, sickness, or the possibility of spreading contamination. -Washing your hands, using hand sanitizer gels, showering, changing your clothes, or cleaning objects because of concerns about contamination. -Following a certain routine (e.g., in the bathroom, getting dressed) because of contamination -Avoiding certain people, objects, or places because of contamination.
The next questions ask about your experiences with thoughts and behaviors related to contamination over the last month.
(Appendix continues)
ABRAMOWITZ ET AL.
196 4.
5.
To what extent has your daily routine (work, school, self-care, social life) been disrupted by contamination concerns and excessive washing, showering, cleaning, or avoidance behaviors? 0 No disruption at all. 1 A little disruption, but I mostly function well. 2 Many things are disrupted, but I can still manage. 3 My life is disrupted in many ways and I have trouble managing. 4 My life is completely disrupted and I cannot function at all. How difficult is it for you to disregard thoughts about contamination and refrain from behaviors such as washing, showering, cleaning, and other decontamination routines when you try to do so? 0 Not at all difficult 1 A little difficult 2 Moderately difficult 3 Very difficult 4 Extremely difficult
mind that your experiences might be slightly different than the examples listed above. Please circle the number next to your answer: 1.
About how much time have you spent each day thinking about the possibility of harm or disasters and engaging in checking or efforts to get reassurance that such things do not (or did not) occur? 0 None at all 1 Less than 1 hour each day 2 Between 1 and 3 hours each day 3 Between 3 and 8 hours each day 4 8 hours or more each day
2.
To what extent have you avoided situations so that you did not have to check for danger or worry about possible harm or disasters? 0 None at all 1 A little avoidance 2 A moderate amount of avoidance 3 A great deal of avoidance 4 Extreme avoidance of nearly all things
3.
When you think about the possibility of harm or disasters, or if you cannot check or get reassurance about these things, how distressed or anxious did you become? 0 Not at all distressed/anxious 1 Mildly distressed/anxious 2 Moderately distressed/anxious 3 Severely distressed/anxious 4 Extremely distressed/anxious
4.
To what extent has your daily routine (work, school, self-care, social life) been disrupted by thoughts about harm or disasters and excessive checking or asking for reassurance? 0 No disruption at all. 1 A little disruption, but I mostly function well. 2 Many things are disrupted, but I can still manage. 3 My life is disrupted in many ways and I have trouble managing. 4 My life is completely disrupted and I cannot function at all.
5.
How difficult is it for you to disregard thoughts about possible harm or disasters and refrain from checking or reassurance-seeking behaviors when you try to do so? 0 Not at all difficult 1 A little difficult 2 Moderately difficult 3 Very difficult 4 Extremely difficult
Category 2: Concerns about being Responsible for Harm, Injury, or Bad Luck Examples . . . -A doubt that you might have made a mistake that could cause something awful or harmful to happen. -The thought that a terrible accident, disaster, injury, or other bad luck might have occurred and you weren’t careful enough to prevent it. -The thought that you could prevent harm or bad luck by doing things in a certain way, counting to certain numbers, or by avoiding certain “bad” numbers or words. -Thought of losing something important that you are unlikely to lose (e.g., wallet, identify theft, papers). -Checking things such as locks, switches, your wallet, etc. more often than is necessary. -Repeatedly asking or checking for reassurance that something bad did not (or will not) happen. -Mentally reviewing past events to make sure you didn’t do anything wrong. -The need to follow a special routine because it will prevent harm or disasters from occurring. -The need to count to certain numbers, or avoid certain bad numbers, due to the fear of harm.
The next questions ask about your experiences with thoughts and behaviors related to harm and disasters over the last month. Keep in
DIMENSIONAL OBSESSIVE-COMPULSIVE SCALE
3 Category 3: Unacceptable Thoughts 4
Examples . . . -Unpleasant thoughts about sex, immorality, or violence that come to mind against your will. -Thoughts about doing awful, improper, or embarrassing things that you don’t really want to do. -Repeating an action or following a special routine because of a bad thought. -Mentally performing an action or saying prayers to get rid of an unwanted or unpleasant thought. -Avoidance of certain people, places, situations or other triggers of unwanted or unpleasant thoughts. The next questions ask about your experiences with unwanted thoughts that come to mind against your will and behaviors designed to deal with these kinds of thoughts over the last month. Keep in mind that your experiences might be slightly different than the examples listed above. Please circle the number next to your answer: 1.
2.
3.
4.
About how much time have you spent each day with unwanted unpleasant thoughts and with behavioral or mental actions to deal with them? 0 None at all 1 Less than 1 hour each day 2 Between 1 and 3 hours each day 3 Between 3 and 8 hours each day 4 8 hours or more each day To what extent have you been avoiding situations, places, objects and other reminders (e.g., numbers, people) that trigger unwanted or unpleasant thoughts? 0 None at all 1 A little avoidance 2 A moderate amount of avoidance 3 A great deal of avoidance 4 Extreme avoidance of nearly all things When unwanted or unpleasant thoughts come to mind against your will how distressed or anxious did you become? 0 Not at all distressed/anxious 1 Mildly distressed/anxious 2 Moderately distressed/anxious 3 Severely distressed/anxious 4 Extremely distressed/anxious
5.
197
My life is disrupted in many ways and I have trouble managing. My life is completely disrupted and I cannot function at all.
How difficult is it for you to disregard unwanted or unpleasant thoughts and refrain from using behavioral or mental acts to deal with them when you try to do so? 0 Not at all difficult 1 A little difficult 2 Moderately difficult 3 Very difficult 4 Extremely difficult
Category 4: Concerns about Symmetry, Completeness, and the Need for Things to be “Just Right” Examples . . . -The need for symmetry, evenness, balance, or exactness. -Feelings that something isn’t “just right.” -Repeating a routine action until it feels “just right” or “balanced.” -Counting senseless things (e.g., ceiling tiles, words in a sentence). -Unnecessarily arranging things in “order.” -Having to say something over and over in the same way until it feels “just right.”
The next questions ask about your experiences with feelings that something is not “just right” and behaviors designed to achieve order, symmetry, or balance over the last month. Keep in mind that your experiences might be slightly different than the examples listed above. Please circle the number next to your answer: 1.
About how much time have you spent each day with unwanted thoughts about symmetry, order, or balance and with behaviors intended to achieve symmetry, order or balance? 0 None at all 1 Less than 1 hour each day 2 Between 1 and 3 hours each day 3 Between 3 and 8 hours each day 4 8 hours or more each day
2.
To what extent have you been avoiding situations, places or objects associated with feelings that something is not symmetrical or “just right?” 0 None at all 1 A little avoidance 2 A moderate amount of avoidance 3 A great deal of avoidance 4 Extreme avoidance of nearly all things
To what extent has your daily routine (work, school, self-care, social life) been disrupted by unwanted and unpleasant thoughts and efforts to avoid or deal with such thoughts? 0 No disruption at all. 1 A little disruption, but I mostly function well. 2 Many things are disrupted, but I can still manage.
(Appendix continues)
ABRAMOWITZ ET AL.
198 3.
When you have the feeling of something being “not just right,” how distressed or anxious did you become? 0 Not at all distressed/anxious 1 Mildly distressed/anxious 2 Moderately distressed/anxious 3 Severely distressed/anxious 4 Extremely distressed/anxious
4.
To what extent has your daily routine (work, school, self-care, social life) been disrupted by the feeling of things being “not just right,” and efforts to put things in order or make them feel right? 0 No disruption at all. 1 A little disruption, but I mostly function well. 2 Many things are disrupted, but I can still manage. 3 My life is disrupted in many ways and I have trouble managing. 4 My life is completely disrupted and I cannot function at all.
5.
Note.
How difficult is it for you to disregard thoughts about the lack of symmetry and order, and refrain from urges to arrange things in order or repeat certain behaviors when you try to do so? 0 Not at all difficult 1 A little difficult 2 Moderately difficult 3 Very difficult 4 Extremely difficult
© 2009 by Jonathan S. Abramowitz
Received August 3, 2009 Revision received October 18, 2009 Accepted October 20, 2009 䡲