Harshan et al.
Assessment of water quality index
Assessment of water quality index of groundwater quality in Chunnakam and Jaffna Town, Sri Lanka S Harshan1, M Thushyanthy2, J Gunatilake3, T Srivaratharasan2 and K Gunaalan4* 1 Postgraduate Institute of Science, University of Peradeniya 2 Deptpartment of Agricultural Engineering, Faculty of Agriculture, University of Jaffna 3 Department of Geology, Faculty of Science, University of Peradeniya 4 Department of Fisheries, Faculty of Science, University of Jaffna Abstract The Water Quality Index (WQI) is simple tool and compound indicator, aggregates information from several water quality parameters to convey water quality information in single value to planners, policy makers and the public. For this study, Chunnakam was sampled to represent a predominantly agricultural area and the Jaffna town representing a residential and coastal area. Secondary data of groundwater quality parameters (from December 2010 to April 2011) were used for this application. Twenty dug wells were chosen in each site. This study aims at assessing Water Quality Index (WQI) to determine the suitability of groundwater for drinking purpose. Nine critical parameters such as pH, turbidity, total alkalinity, total hardness, phosphate, chloride, nitrate-N, total coli forms and sulphate were used to calculate WQI. The calculated WQI value varies from 1.7 to 75.5 in Chunnakam and 10% wells in December 2010 and 5% wells in January 2011 are shown ‘Poor’ WQI ranking. In Jaffna town area WQI value varies from 1.2 to 64.6 and only 5% wells in December 2010 are shown ‘poor’ WQI ranking. In Chunnakam 20% wells are ‘excellent’ WQI ranking and 70% wells are ‘good’ WQI ranking and in Jaffna town, 90% wells are ranked in to ‘good’ WQI ranking.
Key words: Jaffna, Groundwater, Water quality, WQI
Introduction Groundwater is one of earth’s most vital renewable and /or non-renewable and widely distributed resources as well as an important source of water supply throughout the world. The quality of water is a vital concern for mankind since it is directly linked with human welfare. The groundwater is believed to be comparatively much clean and free from pollution than surface
water. Groundwater can become contaminated naturally or because of numerous types of human activities; residential, municipal, commercial, industrial, and agricultural activities can all affect groundwater quality (Balakrishnan, 2011). Jaffna peninsula completely depends on the limited groundwater resource to meet all
* Correspondence:
[email protected]
84
Ving. Journal of Science 2016, Vol 13, Nos 1&2
Harshan et al.
Assessment of water quality index
of their water requirements from the open dug wells (Mikunthan, 2005). There are no streams and rivers in Jaffna Peninsula due to the flatness (7% slope) of the land and the topography does not permit the construction of reservoirs. The groundwater contains dissolved salts and other constituents depending on the geochemistry. Therefore, groundwater must have an important bearing on the health of the population (Dissanayake, 2005). The presence of different chemical and physical constituents in excess of their permissible limits for various uses can create health hazard and environmental problems. The quality of water plays a prominent role in promoting both the standard of agricultural production and human health. Groundwater pollution depends on the inherent hydro geologic property of the site, agricultural land use and cultivation practices (Remesan and Panda, 2008). Contamination of groundwater can result in poor drinking water quality, loss of water supply, high cleanup costs, high costs for alternative water supplies, and/or potential health problems. Jaffna municipal area is a densely populated and land use pattern is mostly building and households. On the other hand, Chunnakam area land use pattern is mostly irrigated agriculture. Assessment of water quality can be defined as the analysis of physical, chemical and biological characteristics of water. Water quality indices aim at giving a single value to the water quality of a source reducing great amount of parameters into a simpler expression and enabling easy interpretation of monitoring data (Bharti and Katyal, 2011). To analyse water quality, different approaches like statistical analyses of individual parameter, multi-stressors water quality indices, have been considered and many water quality
indices have been formulated all over the world which can easily judge out the overall water quality within a particular area promptly and efficiently. Those indices methods are based on the comparison of the water quality parameters to regulatory standards and give a single value to the water quality of a source. The water quality index (WQI) has emerged as a central way to convey water quality information to policy makers and the general public and is regularly used for regulatory impact analysis. It is a compound indicator that aggregates information from several water quality parameters (Walsh and Wheeler, 2012). The WQI has become one of the chief ways to communicate information about water quality and it represents a means of distilling information from multiple sources into one easily understood value. The purpose of this investigation is to provide an overview of present groundwater quality in Jaffna town and Chunnakam areas by using WQI.
Methodology
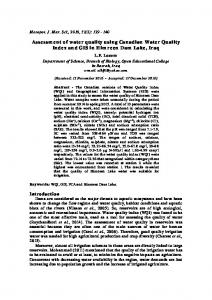
Jaffna peninsula is fast developing city and people are coming back to resulting after displacement. Therefore two major sites were selected in Jaffna peninsula to this study such as Chunnakam for intensive agricultural area and Jaffna town for heavy populated and closer to costal line (Figure 1). Altogether from 40 wells (20 wells in each sites) secondary data were collected (December 2010 to April 2011) for WQI calculation. For the purpose of present investigation, the following nine physico-chemical and biological characteristics of drinking water were selected. These parameters are pH, turbidity, total alkalinity, total hardness, phosphate, chloride, nitrate-N, total coliform and sulphate. These
Ving. Journal of Science 2016, Vol 13, Nos 1&2
85
Harshan et al.
Assessment of water quality index
parameters maximum contribute for the quality of drinking water (Vatkar et al., 2013). Water quality index was computed by adopting the
method of Swarnalatha and Nageswararao (2010) determine the suitability of the groundwater for drinking purposes as follows;
Figure 1: Study area spatial map
n WQI = Anti log ∑ wi log10 qi i =1
(Eq:1)
Where wi = weightage factor of ith parameter qi = quality rating of ith pameter Weightage: The weightage of each quality factor was calculated by equations 2 and 3 and values shown in the Table 1. Factors which have higher permissible limits are less harmful because they can harm quality of drinking water
86
when they are present in very high quantity. So weightage of factor has an inverse relationship with its permissible limits. Therefore, wi is calculated from the following equation, Ving. Journal of Science 2016, Vol 13, Nos 1&2
Harshan et al.
Assessment of water quality index
The weightage of all the chemical factors are calculated on the basis of this equation. k Or wi = 1 Rating scale was calculated for range of values
vi
wi ∝
vi
of each parameter. The rating varies from 0 to 100 and qi is calculated from the following equation,
(Eq: 2)
v − vs qi = a vi − v s
Where wi = weightage factor of ith parameter
k = constant proportionality
vi = standard value of ith parameter for Sri Lankan standard Value of k was calculated as,
k=
1 n
1
i =1
i
∑v
× 100
(Eq: 4) Where va = actual value obtained from laboratory analysis of ith parameter vi= standard value of ith parameter (Sri Lankan standards) vs = ideal value (pH=7 and 0 for all parameters) (Table: 1)
(Eq: 3)
Table 1: Water quality factors, SLS permissible value, ideal value and weightage. Ideal value Unit Weight Water quality factor SLS (vi)* (vs)** (wi)*** pH 6.5 – 9 7 0.118 Nitrate –as N (mg/L) 10 0 0.106 Total Phosphate (mg/L) 2 0 0.530 Total alkalinity (mg/L) 400 0 0.003 Sulphate (mg/L) 400 0 0.003 Total hardness (mg/L) 600 0 0.002 Turbidity (TNU) 8 0 0.132 Chloride (mg/L) 1200 0 0.001 Total coliform (in 100 10 0 0.106 mL) * Sri Lanka standards for potable water (SLS – 614,1983) ** Assume ideal value. *** Unit weight calculated by equation 2 and 3 for nine water quality parameters. Ving. Journal of Science 2016, Vol 13, Nos 1&2
87
Harshan et al.
Assessment of water quality index
Based on the WQI, the analysed samples were grouped into five categories based on Canadian scheme such as ‘Excellent’ (0 – 5); ‘Good’ (6 – 20); ‘Fair’ (21 – 35); ‘Marginal’ (36 – 55); and ‘Poor’ (56 – 100). WQI is commonly used for the detection and evaluation of water pollution and may be defined as a rating reflecting the composite influence on the overall quality of a number of quality parameters
Results and Discussion
During our study period, 553 mm, 112 mm, 3 mm, 1.3 mm and 21 mm rainfall was recorded in the months December 2010, January 2011,
February 2011, March 2011 and April 2011 respectively. The values of selected parameters of groundwater quality data and SLS water quality standards were used for calculating water quality indices. The water quality standard values corresponding weightage factor and ideal values are presented in Table 1. Quality status is assigned on the basis of calculated values of water quality indices to include the collective role of various physicochemical parameters on the overall quality of drinking water.
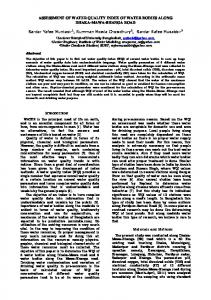
Figure 2: Calculated WQI variation in Chunnakam swells.
88
Ving. Journal of Science 2016, Vol 13, Nos 1&2
Harshan et al.
Assessment of water quality index
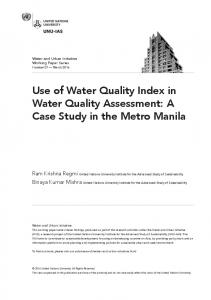
WQI computations were made from the equations and obtained results are given in Figure 2 and Figure 3. In Chunnakam study area two wells in December 2010 and one well in January 2011 shown poor WQI ranking (Figure 2). Only five wells ranked marginal WQI in Chunnakam during December 2010. Figure 3 shows, in Jaffna town only one well in December 2010 is poor WQI. Nine wells are ranked in marginal WQI in Jaffna town area in December 2010 and January 2011. Average WQI variation indicates one well shows ‘marginal’ rank in each study sites. Figure 2 and 3 indicates arrangement of monthly lines depends on monthly rainfall pattern and high rainfall resulted to shift line to ‘Poor’ categories.
During December 2010 calculated WQI averages are 34.2 + 17.0 in Chunnakam and 21.0 + 17.6 in Jaffna town area. There are no excellent WQI ranking wells in Chunnakam area and 20% wells are grouped as good; 45% well lies in the group of fair WQI. In Jaffna town area 25% wells are ranked excellent WQI group and 25% wells are good WQI group. Calculated WQI averages are 12.4 + 14.5 and 19.7 + 16.5 in Chunnakam and Jaffna town study area respectively in January 2011. In Chunnakam area 35% study wells are ranked excellent and 45% study wells are ranked good WQI. 20% study wells are ranked excellent and 45% wells area ranked good WQI in Jaffna study area.
Figure 3: Calculated WQI variation in Jaffna town wells.
Ving. Journal of Science 2016, Vol 13, Nos 1&2
89
Harshan et al.
Assessment of water quality index
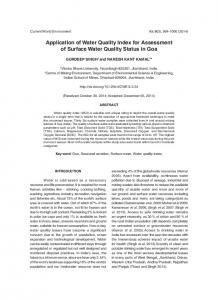
Figure 4: Overall view of WQI spatial distribution map In February 2011, Average WQI values are 8.0 + 7.0 in Chunnakam and 11.6 + 8.5 in Jaffna town study area. In Chunnakam area around 50% of wells are grouped excellent WQI and 45% of wells are grouped good WQI. In Jaffna town study area, 30% wells are excellent and 45% wells are good WQI. In Chunnakam study area average WQI value is 7.0 and deviate 4.8 in March 2011. Like in Jaffna town area average WQI value is 10.0 and deviate 6.3 in March 2011. Around 35% wells in Chunnakam area grouped in to excellent WQI and rest 60% wells are grouped good WQI. But
90
in Jaffna town area wells are grouped as follows; 25% excellent and 65% good WQI. In April 2011, calculated average WQI values are 10.3 + 5.1 and 13.4 + 7.2 in Chunnakam and Jaffna town area, respectively. In Chunnakam 20% wells are excellent WQI and 70% wells are good WQI but in Jaffna town 90% wells are ranked in to good WQI. Figure 4 shows water quality declining during rainy months (example December 2010) due to reaching groundwater and Jaffna town area has high salinity level due to coastal effects. Ving. Journal of Science 2016, Vol 13, Nos 1&2
Harshan et al.
Assessment of water quality index
Conclusions
WQI is used to describe in single value the overall effect of physiochemical and biological parameters of the quality of ground water. Calculated WQI values were ‘fair’ or ‘marginal’ during the rainy season and ‘excellent’ or ‘good’ in the dry months. Monitoring of the quality of water for drinking is a public health concern and WQI provides this information. During rainy month WQI was higher (fair/marginal/ poor) so better adopt simple water quality treatment technique of heating and / or filtration in household level especially during rainy seasons. DRASTIC hydro geologic vulnerability method will be used to study the risk potential site in Jaffna peninsula by modified WQI value.
References Balakrishnan, P., Saleem, A. and Mallikarjun, N.D., (2011). Afr J Environ Sci Tech. 5 (12): 1069–1084 Bharti N. and Katyal.D., (2011). International Jornalof Environmental Science, 2 (1).
Dissanayake, C.B., (2005). Journal of Science Foundation, Sri Lanka. 33 (3): 161 -168. Mihunthan. T. (2005). Water Professionals’ Day Symposium 2005: Water resources research in Sri Lanka. Remesan, R. and Panda, R.K., (2008). The 3rd International Conference on Water Resources and Arid Environments. SLS, (1983). Sri Lanka standard 614: part 1, 5-10. Swarnalatha, P. and Nageswararao. K., (2010). International Journal of Environmental Science,1 (2): 198 – 212. Vatkar, Y.S., Kore, S.V., Kore, V.S. and Kulkarni.G.S., (2013). International Journal of Scientific and Engineering Research, 4(3). Walsh, P. and Wheeler, W., (2012). NCEE Working Paper Series No. 12-05 July 2012, U.S. Environmental Protection Agency and National Centre for Environmental Economics.
Ving. Journal of Science 2016, Vol 13, Nos 1&2
91